Scolaris Content Display Scolaris Content Display

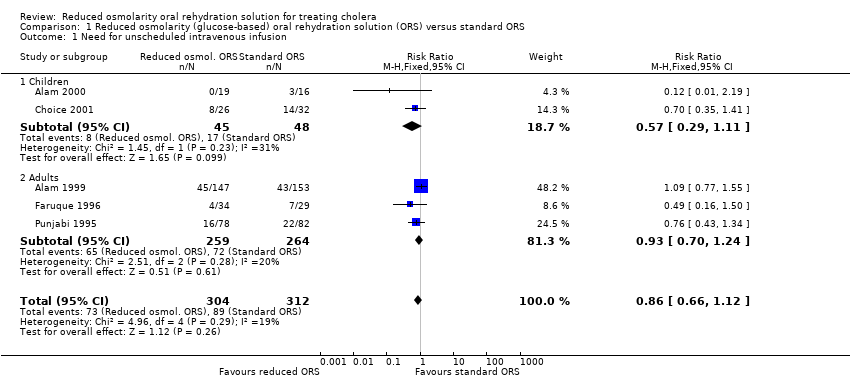
Comparison 1 Reduced osmolarity (glucose‐based) oral rehydration solution (ORS) versus standard ORS, Outcome 1 Need for unscheduled intravenous infusion.
Figuras y tablas -
Analysis 1.1

Comparison 1 Reduced osmolarity (glucose‐based) oral rehydration solution (ORS) versus standard ORS, Outcome 1 Need for unscheduled intravenous infusion.

Comparison 1 Reduced osmolarity (glucose‐based) oral rehydration solution (ORS) versus standard ORS, Outcome 2 Biochemical hyponatremia (serum sodium < 130 mmol/L).
Figuras y tablas -
Analysis 1.2

Comparison 1 Reduced osmolarity (glucose‐based) oral rehydration solution (ORS) versus standard ORS, Outcome 2 Biochemical hyponatremia (serum sodium < 130 mmol/L).

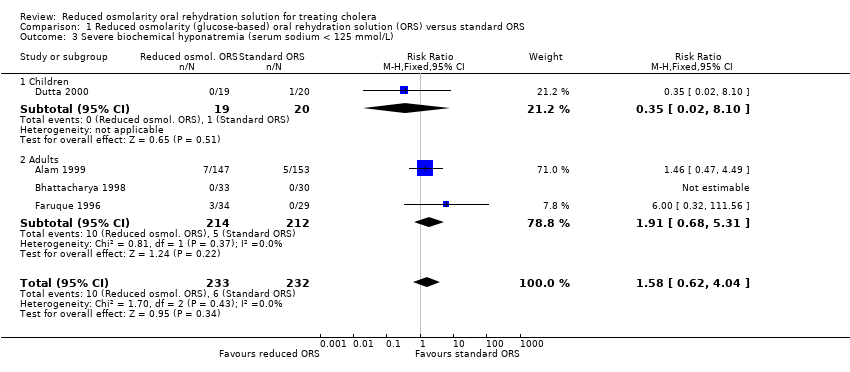
Comparison 1 Reduced osmolarity (glucose‐based) oral rehydration solution (ORS) versus standard ORS, Outcome 3 Severe biochemical hyponatremia (serum sodium < 125 mmol/L).
Figuras y tablas -
Analysis 1.3

Comparison 1 Reduced osmolarity (glucose‐based) oral rehydration solution (ORS) versus standard ORS, Outcome 3 Severe biochemical hyponatremia (serum sodium < 125 mmol/L).

Comparison 1 Reduced osmolarity (glucose‐based) oral rehydration solution (ORS) versus standard ORS, Outcome 4 Duration of diarrhea.
Figuras y tablas -
Analysis 1.4

Comparison 1 Reduced osmolarity (glucose‐based) oral rehydration solution (ORS) versus standard ORS, Outcome 4 Duration of diarrhea.

Comparison 1 Reduced osmolarity (glucose‐based) oral rehydration solution (ORS) versus standard ORS, Outcome 5 Stool volume in first 24 hours after admission or randomization.
Figuras y tablas -
Analysis 1.5

Comparison 1 Reduced osmolarity (glucose‐based) oral rehydration solution (ORS) versus standard ORS, Outcome 5 Stool volume in first 24 hours after admission or randomization.

Comparison 1 Reduced osmolarity (glucose‐based) oral rehydration solution (ORS) versus standard ORS, Outcome 6 Vomiting during rehydration.
Figuras y tablas -
Analysis 1.6

Comparison 1 Reduced osmolarity (glucose‐based) oral rehydration solution (ORS) versus standard ORS, Outcome 6 Vomiting during rehydration.

Comparison 2 Reduced osmolarity (rice‐based) oral rehydration solution (ORS) versus standard ORS, Outcome 1 Biochemical hyponatremia (serum sodium < 130 mmol/L).
Figuras y tablas -
Analysis 2.1

Comparison 2 Reduced osmolarity (rice‐based) oral rehydration solution (ORS) versus standard ORS, Outcome 1 Biochemical hyponatremia (serum sodium < 130 mmol/L).

Comparison 2 Reduced osmolarity (rice‐based) oral rehydration solution (ORS) versus standard ORS, Outcome 2 Severe biochemical hyponatremia (serum sodium < 125 mmol/L).
Figuras y tablas -
Analysis 2.2

Comparison 2 Reduced osmolarity (rice‐based) oral rehydration solution (ORS) versus standard ORS, Outcome 2 Severe biochemical hyponatremia (serum sodium < 125 mmol/L).

Comparison 2 Reduced osmolarity (rice‐based) oral rehydration solution (ORS) versus standard ORS, Outcome 3 Duration of diarrhea.
Figuras y tablas -
Analysis 2.3

Comparison 2 Reduced osmolarity (rice‐based) oral rehydration solution (ORS) versus standard ORS, Outcome 3 Duration of diarrhea.

Comparison 1. Reduced osmolarity (glucose‐based) oral rehydration solution (ORS) versus standard ORS

Outcome or subgroup title

No. of studies

No. of participants

Statistical method

Effect size

1 Need for unscheduled intravenous infusion Show forest plot

5

616

Risk Ratio (M‐H, Fixed, 95% CI)

0.86 [0.66, 1.12]

1.1 Children

2

93

Risk Ratio (M‐H, Fixed, 95% CI)

0.57 [0.29, 1.11]

1.2 Adults

3

523

Risk Ratio (M‐H, Fixed, 95% CI)

0.93 [0.70, 1.24]

2 Biochemical hyponatremia (serum sodium < 130 mmol/L) Show forest plot

4

465

Risk Ratio (M‐H, Fixed, 95% CI)

1.67 [1.09, 2.57]

2.1 Children

1

39

Risk Ratio (M‐H, Fixed, 95% CI)

1.58 [0.53, 4.74]

2.2 Adults

3

426

Risk Ratio (M‐H, Fixed, 95% CI)

1.69 [1.06, 2.69]

3 Severe biochemical hyponatremia (serum sodium < 125 mmol/L) Show forest plot

4

465

Risk Ratio (M‐H, Fixed, 95% CI)

1.58 [0.62, 4.04]

3.1 Children

1

39

Risk Ratio (M‐H, Fixed, 95% CI)

0.35 [0.02, 8.10]

3.2 Adults

3

426

Risk Ratio (M‐H, Fixed, 95% CI)

1.91 [0.68, 5.31]

4 Duration of diarrhea Show forest plot

7

718

Mean Difference (IV, Random, 95% CI)

‐1.08 [‐4.58, 2.41]

4.1 Children

3

132

Mean Difference (IV, Random, 95% CI)

1.42 [0.29, 2.55]

4.2 Adults

4

586

Mean Difference (IV, Random, 95% CI)

‐2.54 [‐8.78, 3.70]

5 Stool volume in first 24 hours after admission or randomization Show forest plot

4

581

Std. Mean Difference (IV, Random, 95% CI)

‐0.13 [‐0.43, 0.17]

5.1 Children

1

58

Std. Mean Difference (IV, Random, 95% CI)

0.03 [‐0.49, 0.55]

5.2 Adults

3

523

Std. Mean Difference (IV, Random, 95% CI)

‐0.18 [‐0.57, 0.20]

6 Vomiting during rehydration Show forest plot

2

363

Risk Ratio (M‐H, Fixed, 95% CI)

1.14 [0.92, 1.40]

6.1 Children

0

0

Risk Ratio (M‐H, Fixed, 95% CI)

0.0 [0.0, 0.0]

6.2 Adults

2

363

Risk Ratio (M‐H, Fixed, 95% CI)

1.14 [0.92, 1.40]

Figuras y tablas -
Comparison 1. Reduced osmolarity (glucose‐based) oral rehydration solution (ORS) versus standard ORS
Comparison 2. Reduced osmolarity (rice‐based) oral rehydration solution (ORS) versus standard ORS

Outcome or subgroup title

No. of studies

No. of participants

Statistical method

Effect size

1 Biochemical hyponatremia (serum sodium < 130 mmol/L) Show forest plot

2

102

Risk Ratio (M‐H, Fixed, 95% CI)

0.66 [0.26, 1.69]

1.1 Children

1

39

Risk Ratio (M‐H, Fixed, 95% CI)

1.05 [0.31, 3.62]

1.2 Adults

1

63

Risk Ratio (M‐H, Fixed, 95% CI)

0.36 [0.08, 1.74]

2 Severe biochemical hyponatremia (serum sodium < 125 mmol/L) Show forest plot

2

102

Risk Ratio (M‐H, Fixed, 95% CI)

0.35 [0.02, 8.10]

2.1 Children

1

39

Risk Ratio (M‐H, Fixed, 95% CI)

0.35 [0.02, 8.10]

2.2 Adults

1

63

Risk Ratio (M‐H, Fixed, 95% CI)

0.0 [0.0, 0.0]

3 Duration of diarrhea Show forest plot

2

102

Mean Difference (IV, Fixed, 95% CI)

‐16.85 [‐21.22, ‐12.48]

3.1 Children

1

39

Mean Difference (IV, Fixed, 95% CI)

‐9.13 [‐21.27, 3.01]

3.2 Adults

1

63

Mean Difference (IV, Fixed, 95% CI)

‐18.0 [‐22.68, ‐13.32]

Figuras y tablas -
Comparison 2. Reduced osmolarity (rice‐based) oral rehydration solution (ORS) versus standard ORS