Scolaris Content Display Scolaris Content Display

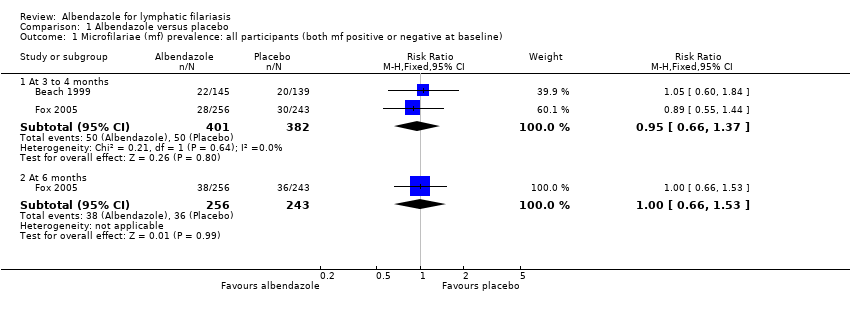
Comparison 1 Albendazole versus placebo, Outcome 1 Microfilariae (mf) prevalence: all participants (both mf positive or negative at baseline).
Figuras y tablas -
Analysis 1.1

Comparison 1 Albendazole versus placebo, Outcome 1 Microfilariae (mf) prevalence: all participants (both mf positive or negative at baseline).

Comparison 1 Albendazole versus placebo, Outcome 2 Microfilariae (mf) prevalence: only participants mf positive at baseline.
Figuras y tablas -
Analysis 1.2

Comparison 1 Albendazole versus placebo, Outcome 2 Microfilariae (mf) prevalence: only participants mf positive at baseline.

Comparison 1 Albendazole versus placebo, Outcome 3 Antigen prevalence: all participants (both mf positive or negative at baseline).
Figuras y tablas -
Analysis 1.3

Comparison 1 Albendazole versus placebo, Outcome 3 Antigen prevalence: all participants (both mf positive or negative at baseline).

Comparison 1 Albendazole versus placebo, Outcome 4 New clinical disease.
Figuras y tablas -
Analysis 1.4

Comparison 1 Albendazole versus placebo, Outcome 4 New clinical disease.

Comparison 1 Albendazole versus placebo, Outcome 5 Pre‐existing clinical disease.
Figuras y tablas -
Analysis 1.5

Comparison 1 Albendazole versus placebo, Outcome 5 Pre‐existing clinical disease.

Comparison 1 Albendazole versus placebo, Outcome 6 Adverse events.
Figuras y tablas -
Analysis 1.6

Comparison 1 Albendazole versus placebo, Outcome 6 Adverse events.

Comparison 2 Albendazole versus ivermectin, Outcome 1 Microfilariae (mf) prevalence: all participants (both mf positive or negative at baseline).
Figuras y tablas -
Analysis 2.1

Comparison 2 Albendazole versus ivermectin, Outcome 1 Microfilariae (mf) prevalence: all participants (both mf positive or negative at baseline).

Comparison 2 Albendazole versus ivermectin, Outcome 2 Microfilariae (mf) prevalence: only participants mf positive at baseline.
Figuras y tablas -
Analysis 2.2

Comparison 2 Albendazole versus ivermectin, Outcome 2 Microfilariae (mf) prevalence: only participants mf positive at baseline.

Comparison 2 Albendazole versus ivermectin, Outcome 3 Antigen prevalence: all participants (antigen positive or negative at baseline).
Figuras y tablas -
Analysis 2.3

Comparison 2 Albendazole versus ivermectin, Outcome 3 Antigen prevalence: all participants (antigen positive or negative at baseline).

Comparison 2 Albendazole versus ivermectin, Outcome 4 New clinical disease.
Figuras y tablas -
Analysis 2.4

Comparison 2 Albendazole versus ivermectin, Outcome 4 New clinical disease.

Comparison 2 Albendazole versus ivermectin, Outcome 5 Pre‐existing clinical disease.
Figuras y tablas -
Analysis 2.5

Comparison 2 Albendazole versus ivermectin, Outcome 5 Pre‐existing clinical disease.

Comparison 2 Albendazole versus ivermectin, Outcome 6 Adverse events.
Figuras y tablas -
Analysis 2.6

Comparison 2 Albendazole versus ivermectin, Outcome 6 Adverse events.

Comparison 3 Albendazole plus ivermectin versus ivermectin, Outcome 1 Microfilariae (mf) prevalence: all participants (both mf positive or negative at baseline).
Figuras y tablas -
Analysis 3.1

Comparison 3 Albendazole plus ivermectin versus ivermectin, Outcome 1 Microfilariae (mf) prevalence: all participants (both mf positive or negative at baseline).

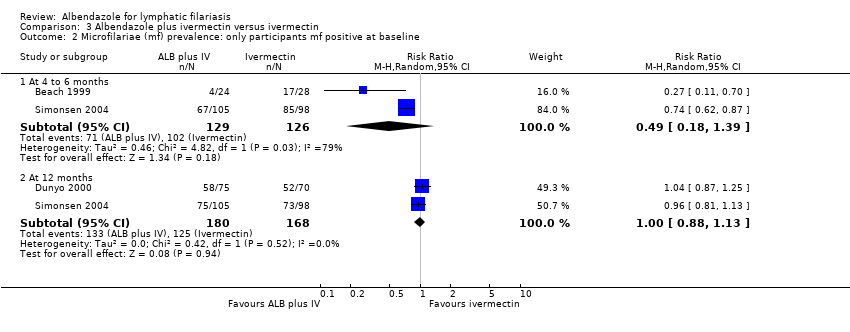
Comparison 3 Albendazole plus ivermectin versus ivermectin, Outcome 2 Microfilariae (mf) prevalence: only participants mf positive at baseline.
Figuras y tablas -
Analysis 3.2

Comparison 3 Albendazole plus ivermectin versus ivermectin, Outcome 2 Microfilariae (mf) prevalence: only participants mf positive at baseline.

Comparison 3 Albendazole plus ivermectin versus ivermectin, Outcome 3 Antigen prevalence: all participants (antigen positive or negative) at baseline.
Figuras y tablas -
Analysis 3.3

Comparison 3 Albendazole plus ivermectin versus ivermectin, Outcome 3 Antigen prevalence: all participants (antigen positive or negative) at baseline.

Comparison 3 Albendazole plus ivermectin versus ivermectin, Outcome 4 Antigen prevalence: only participants antigen positive at baseline.
Figuras y tablas -
Analysis 3.4

Comparison 3 Albendazole plus ivermectin versus ivermectin, Outcome 4 Antigen prevalence: only participants antigen positive at baseline.

Comparison 3 Albendazole plus ivermectin versus ivermectin, Outcome 5 New clinical disease.
Figuras y tablas -
Analysis 3.5

Comparison 3 Albendazole plus ivermectin versus ivermectin, Outcome 5 New clinical disease.

Comparison 3 Albendazole plus ivermectin versus ivermectin, Outcome 6 Pre‐existing clinical disease.
Figuras y tablas -
Analysis 3.6

Comparison 3 Albendazole plus ivermectin versus ivermectin, Outcome 6 Pre‐existing clinical disease.

Comparison 3 Albendazole plus ivermectin versus ivermectin, Outcome 7 Adverse events.
Figuras y tablas -
Analysis 3.7

Comparison 3 Albendazole plus ivermectin versus ivermectin, Outcome 7 Adverse events.

Comparison 4 Albendazole versus diethylcarbamazine (DEC), Outcome 1 Microfiliariae (mf) prevalence: all participants (both mf positive or negative at baseline).
Figuras y tablas -
Analysis 4.1

Comparison 4 Albendazole versus diethylcarbamazine (DEC), Outcome 1 Microfiliariae (mf) prevalence: all participants (both mf positive or negative at baseline).

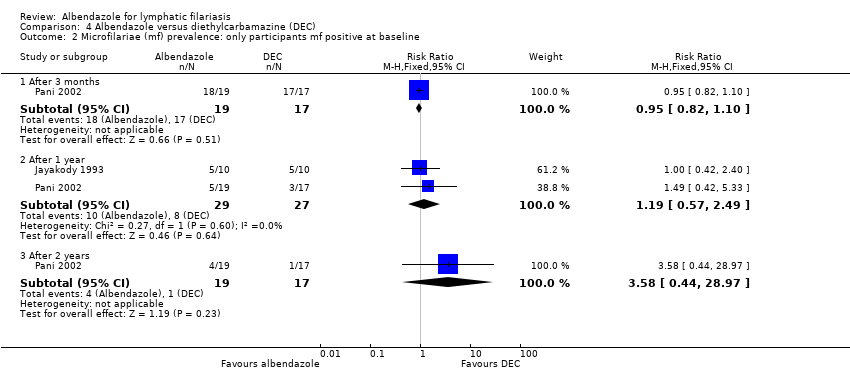
Comparison 4 Albendazole versus diethylcarbamazine (DEC), Outcome 2 Microfilariae (mf) prevalence: only participants mf positive at baseline.
Figuras y tablas -
Analysis 4.2

Comparison 4 Albendazole versus diethylcarbamazine (DEC), Outcome 2 Microfilariae (mf) prevalence: only participants mf positive at baseline.

Comparison 4 Albendazole versus diethylcarbamazine (DEC), Outcome 3 Antigen prevalence: all participants (both antigen positive or negative at baseline).
Figuras y tablas -
Analysis 4.3

Comparison 4 Albendazole versus diethylcarbamazine (DEC), Outcome 3 Antigen prevalence: all participants (both antigen positive or negative at baseline).

Comparison 4 Albendazole versus diethylcarbamazine (DEC), Outcome 4 Antigen prevalence: only participants antigen positive at baseline.
Figuras y tablas -
Analysis 4.4

Comparison 4 Albendazole versus diethylcarbamazine (DEC), Outcome 4 Antigen prevalence: only participants antigen positive at baseline.

Comparison 4 Albendazole versus diethylcarbamazine (DEC), Outcome 5 Adverse events.
Figuras y tablas -
Analysis 4.5

Comparison 4 Albendazole versus diethylcarbamazine (DEC), Outcome 5 Adverse events.

Comparison 4 Albendazole versus diethylcarbamazine (DEC), Outcome 6 Adverse events: scrotal syndrome.
Figuras y tablas -
Analysis 4.6

Comparison 4 Albendazole versus diethylcarbamazine (DEC), Outcome 6 Adverse events: scrotal syndrome.

Comparison 5 Albendazole plus diethylcarbamazine (DEC) versus DEC, Outcome 1 Microfilariae (mf) prevalence: all participants (both mf positive or negative at baseline).
Figuras y tablas -
Analysis 5.1

Comparison 5 Albendazole plus diethylcarbamazine (DEC) versus DEC, Outcome 1 Microfilariae (mf) prevalence: all participants (both mf positive or negative at baseline).

Comparison 5 Albendazole plus diethylcarbamazine (DEC) versus DEC, Outcome 2 Microfilariae (mf) prevalence: only participants mf positive at baseline.
Figuras y tablas -
Analysis 5.2

Comparison 5 Albendazole plus diethylcarbamazine (DEC) versus DEC, Outcome 2 Microfilariae (mf) prevalence: only participants mf positive at baseline.

Comparison 5 Albendazole plus diethylcarbamazine (DEC) versus DEC, Outcome 3 Antigen prevalence: all participants (both antigen positive and negative at baseline).
Figuras y tablas -
Analysis 5.3

Comparison 5 Albendazole plus diethylcarbamazine (DEC) versus DEC, Outcome 3 Antigen prevalence: all participants (both antigen positive and negative at baseline).

Comparison 5 Albendazole plus diethylcarbamazine (DEC) versus DEC, Outcome 4 Antigen prevalence: only participants antigen positive at baseline.
Figuras y tablas -
Analysis 5.4

Comparison 5 Albendazole plus diethylcarbamazine (DEC) versus DEC, Outcome 4 Antigen prevalence: only participants antigen positive at baseline.

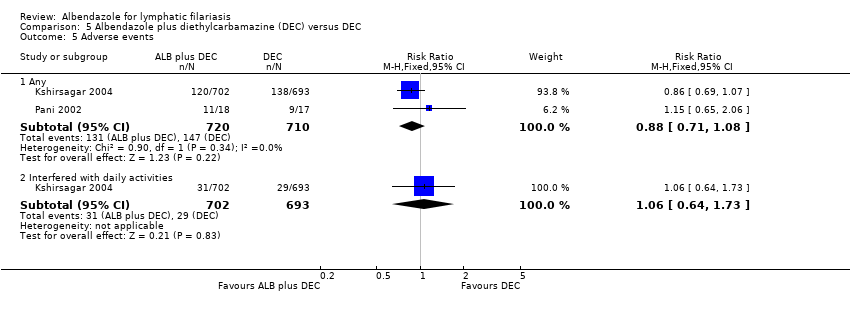
Comparison 5 Albendazole plus diethylcarbamazine (DEC) versus DEC, Outcome 5 Adverse events.
Figuras y tablas -
Analysis 5.5

Comparison 5 Albendazole plus diethylcarbamazine (DEC) versus DEC, Outcome 5 Adverse events.

Comparison 1. Albendazole versus placebo

Outcome or subgroup title

No. of studies

No. of participants

Statistical method

Effect size

1 Microfilariae (mf) prevalence: all participants (both mf positive or negative at baseline) Show forest plot

2

Risk Ratio (M‐H, Fixed, 95% CI)

Subtotals only

1.1 At 3 to 4 months

2

783

Risk Ratio (M‐H, Fixed, 95% CI)

0.95 [0.66, 1.37]

1.2 At 6 months

1

499

Risk Ratio (M‐H, Fixed, 95% CI)

1.00 [0.66, 1.53]

2 Microfilariae (mf) prevalence: only participants mf positive at baseline Show forest plot

2

195

Risk Ratio (M‐H, Fixed, 95% CI)

0.97 [0.87, 1.09]

3 Antigen prevalence: all participants (both mf positive or negative at baseline) Show forest plot

2

1090

Risk Ratio (M‐H, Fixed, 95% CI)

0.95 [0.81, 1.12]

4 New clinical disease Show forest plot

1

Risk Ratio (M‐H, Fixed, 95% CI)

Totals not selected

4.1 Hydrocoele

1

Risk Ratio (M‐H, Fixed, 95% CI)

0.0 [0.0, 0.0]

5 Pre‐existing clinical disease Show forest plot

1

Risk Ratio (M‐H, Fixed, 95% CI)

Totals not selected

5.1 Improvement in lymphoedema

1

Risk Ratio (M‐H, Fixed, 95% CI)

0.0 [0.0, 0.0]

5.2 Improvement in hydrocoele

1

Risk Ratio (M‐H, Fixed, 95% CI)

0.0 [0.0, 0.0]

6 Adverse events Show forest plot

1

Risk Ratio (M‐H, Fixed, 95% CI)

Totals not selected

6.1 Systemic

1

Risk Ratio (M‐H, Fixed, 95% CI)

0.0 [0.0, 0.0]

Figuras y tablas -
Comparison 1. Albendazole versus placebo
Comparison 2. Albendazole versus ivermectin

Outcome or subgroup title

No. of studies

No. of participants

Statistical method

Effect size

1 Microfilariae (mf) prevalence: all participants (both mf positive or negative at baseline) Show forest plot

1

Risk Ratio (M‐H, Fixed, 95% CI)

Totals not selected

2 Microfilariae (mf) prevalence: only participants mf positive at baseline Show forest plot

2

198

Risk Ratio (M‐H, Fixed, 95% CI)

0.84 [0.72, 0.98]

3 Antigen prevalence: all participants (antigen positive or negative at baseline) Show forest plot

1

Risk Ratio (M‐H, Fixed, 95% CI)

Totals not selected

4 New clinical disease Show forest plot

1

Risk Ratio (M‐H, Fixed, 95% CI)

Totals not selected

4.1 Hydrocoele

1

Risk Ratio (M‐H, Fixed, 95% CI)

0.0 [0.0, 0.0]

5 Pre‐existing clinical disease Show forest plot

1

Risk Ratio (M‐H, Fixed, 95% CI)

Totals not selected

5.1 Improvement in lymphoedema

1

Risk Ratio (M‐H, Fixed, 95% CI)

0.0 [0.0, 0.0]

5.2 Improvement in hydrocoele

1

Risk Ratio (M‐H, Fixed, 95% CI)

0.0 [0.0, 0.0]

6 Adverse events Show forest plot

1

Risk Ratio (M‐H, Fixed, 95% CI)

Totals not selected

6.1 Systemic

1

Risk Ratio (M‐H, Fixed, 95% CI)

0.0 [0.0, 0.0]

Figuras y tablas -
Comparison 2. Albendazole versus ivermectin
Comparison 3. Albendazole plus ivermectin versus ivermectin

Outcome or subgroup title

No. of studies

No. of participants

Statistical method

Effect size

1 Microfilariae (mf) prevalence: all participants (both mf positive or negative at baseline) Show forest plot

1

Risk Ratio (M‐H, Fixed, 95% CI)

Totals not selected

2 Microfilariae (mf) prevalence: only participants mf positive at baseline Show forest plot

3

Risk Ratio (M‐H, Random, 95% CI)

Subtotals only

2.1 At 4 to 6 months

2

255

Risk Ratio (M‐H, Random, 95% CI)

0.49 [0.18, 1.39]

2.2 At 12 months

2

348

Risk Ratio (M‐H, Random, 95% CI)

1.00 [0.88, 1.13]

3 Antigen prevalence: all participants (antigen positive or negative) at baseline Show forest plot

1

Risk Ratio (M‐H, Fixed, 95% CI)

Totals not selected

4 Antigen prevalence: only participants antigen positive at baseline Show forest plot

2

Risk Ratio (M‐H, Fixed, 95% CI)

Totals not selected

4.1 Data at 6 months

1

Risk Ratio (M‐H, Fixed, 95% CI)

0.0 [0.0, 0.0]

4.2 Data at 12 months

2

Risk Ratio (M‐H, Fixed, 95% CI)

0.0 [0.0, 0.0]

5 New clinical disease Show forest plot

1

Risk Ratio (M‐H, Fixed, 95% CI)

Totals not selected

5.1 Hydrocoele

1

Risk Ratio (M‐H, Fixed, 95% CI)

0.0 [0.0, 0.0]

6 Pre‐existing clinical disease Show forest plot

1

Risk Ratio (M‐H, Fixed, 95% CI)

Totals not selected

6.1 Improvement in lymphoedema

1

Risk Ratio (M‐H, Fixed, 95% CI)

0.0 [0.0, 0.0]

6.2 Improvement in hydrocoele

1

Risk Ratio (M‐H, Fixed, 95% CI)

0.0 [0.0, 0.0]

7 Adverse events Show forest plot

2

Risk Ratio (M‐H, Fixed, 95% CI)

Totals not selected

7.1 Total

1

Risk Ratio (M‐H, Fixed, 95% CI)

0.0 [0.0, 0.0]

7.2 Systemic

1

Risk Ratio (M‐H, Fixed, 95% CI)

0.0 [0.0, 0.0]

Figuras y tablas -
Comparison 3. Albendazole plus ivermectin versus ivermectin
Comparison 4. Albendazole versus diethylcarbamazine (DEC)

Outcome or subgroup title

No. of studies

No. of participants

Statistical method

Effect size

1 Microfiliariae (mf) prevalence: all participants (both mf positive or negative at baseline) Show forest plot

1

Risk Ratio (M‐H, Fixed, 95% CI)

Totals not selected

1.1 At 3 months

1

Risk Ratio (M‐H, Fixed, 95% CI)

0.0 [0.0, 0.0]

1.2 At 6 months

1

Risk Ratio (M‐H, Fixed, 95% CI)

0.0 [0.0, 0.0]

2 Microfilariae (mf) prevalence: only participants mf positive at baseline Show forest plot

2

Risk Ratio (M‐H, Fixed, 95% CI)

Subtotals only

2.1 After 3 months

1

36

Risk Ratio (M‐H, Fixed, 95% CI)

0.95 [0.82, 1.10]

2.2 After 1 year

2

56

Risk Ratio (M‐H, Fixed, 95% CI)

1.19 [0.57, 2.49]

2.3 After 2 years

1

36

Risk Ratio (M‐H, Fixed, 95% CI)

3.58 [0.44, 28.97]

3 Antigen prevalence: all participants (both antigen positive or negative at baseline) Show forest plot

1

Risk Ratio (M‐H, Fixed, 95% CI)

Totals not selected

4 Antigen prevalence: only participants antigen positive at baseline Show forest plot

1

Risk Ratio (M‐H, Fixed, 95% CI)

Totals not selected

4.1 ICT test

1

Risk Ratio (M‐H, Fixed, 95% CI)

0.0 [0.0, 0.0]

5 Adverse events Show forest plot

1

Risk Ratio (M‐H, Fixed, 95% CI)

Totals not selected

6 Adverse events: scrotal syndrome Show forest plot

1

Risk Ratio (M‐H, Fixed, 95% CI)

Totals not selected

Figuras y tablas -
Comparison 4. Albendazole versus diethylcarbamazine (DEC)
Comparison 5. Albendazole plus diethylcarbamazine (DEC) versus DEC

Outcome or subgroup title

No. of studies

No. of participants

Statistical method

Effect size

1 Microfilariae (mf) prevalence: all participants (both mf positive or negative at baseline) Show forest plot

1

Risk Ratio (M‐H, Fixed, 95% CI)

Totals not selected

1.1 At 3 months

1

Risk Ratio (M‐H, Fixed, 95% CI)

0.0 [0.0, 0.0]

1.2 At 6 months

1

Risk Ratio (M‐H, Fixed, 95% CI)

0.0 [0.0, 0.0]

2 Microfilariae (mf) prevalence: only participants mf positive at baseline Show forest plot

2

Risk Ratio (M‐H, Fixed, 95% CI)

Subtotals only

2.1 At 3 months

2

73

Risk Ratio (M‐H, Fixed, 95% CI)

1.06 [0.83, 1.36]

2.2 At 6 months

1

42

Risk Ratio (M‐H, Fixed, 95% CI)

1.0 [0.62, 1.61]

2.3 At 12 months

2

78

Risk Ratio (M‐H, Fixed, 95% CI)

0.99 [0.69, 1.44]

2.4 At 2 years

1

35

Risk Ratio (M‐H, Fixed, 95% CI)

0.94 [0.06, 13.93]

3 Antigen prevalence: all participants (both antigen positive and negative at baseline) Show forest plot

2

Risk Ratio (M‐H, Fixed, 95% CI)

Subtotals only

3.1 Data at 6 months

2

592

Risk Ratio (M‐H, Fixed, 95% CI)

1.00 [0.82, 1.24]

3.2 Data at 12 months

1

103

Risk Ratio (M‐H, Fixed, 95% CI)

0.95 [0.69, 1.31]

4 Antigen prevalence: only participants antigen positive at baseline Show forest plot

1

Risk Ratio (M‐H, Fixed, 95% CI)

Totals not selected

5 Adverse events Show forest plot

2

Risk Ratio (M‐H, Fixed, 95% CI)

Subtotals only

5.1 Any

2

1430

Risk Ratio (M‐H, Fixed, 95% CI)

0.88 [0.71, 1.08]

5.2 Interfered with daily activities

1

1395

Risk Ratio (M‐H, Fixed, 95% CI)

1.06 [0.64, 1.73]

Figuras y tablas -
Comparison 5. Albendazole plus diethylcarbamazine (DEC) versus DEC