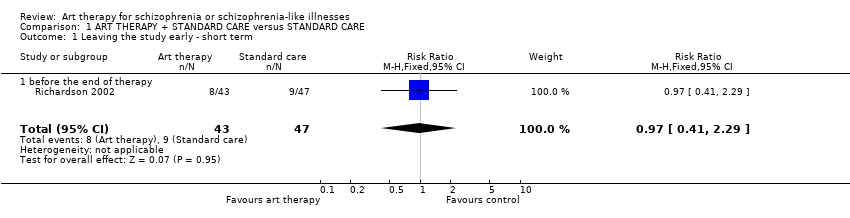
| 1 Leaving the study early ‐ short term Show forest plot | 1 | 90 | Risk Ratio (M‐H, Fixed, 95% CI) | 0.97 [0.41, 2.29] |
|
| 1.1 before the end of therapy | 1 | 90 | Risk Ratio (M‐H, Fixed, 95% CI) | 0.97 [0.41, 2.29] |
| 2 Leaving the study early ‐ medium term Show forest plot | 2 | | Risk Ratio (M‐H, Fixed, 95% CI) | Subtotals only |
|
| 2.1 before the end of therapy | 1 | 47 | Risk Ratio (M‐H, Fixed, 95% CI) | 0.34 [0.15, 0.80] |
| 2.2 before 6 month follow up | 1 | 90 | Risk Ratio (M‐H, Fixed, 95% CI) | 1.09 [0.76, 1.58] |
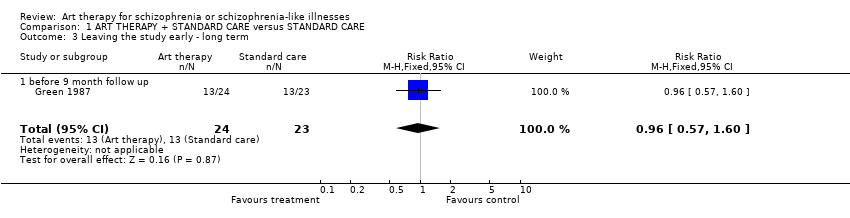
| 3 Leaving the study early ‐ long term Show forest plot | 1 | 47 | Risk Ratio (M‐H, Fixed, 95% CI) | 0.96 [0.57, 1.60] |
|
| 3.1 before 9 month follow up | 1 | 47 | Risk Ratio (M‐H, Fixed, 95% CI) | 0.96 [0.57, 1.60] |
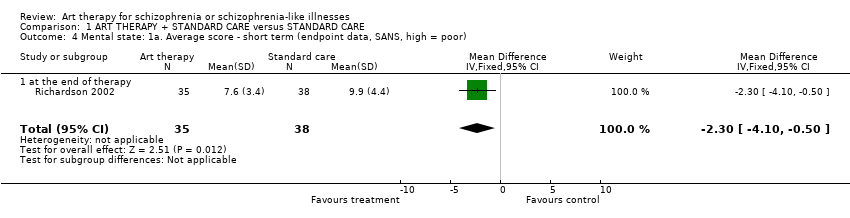
| 4 Mental state: 1a. Average score ‐ short term (endpoint data, SANS, high = poor) Show forest plot | 1 | 73 | Mean Difference (IV, Fixed, 95% CI) | ‐2.30 [‐4.10, ‐0.50] |
|
| 4.1 at the end of therapy | 1 | 73 | Mean Difference (IV, Fixed, 95% CI) | ‐2.30 [‐4.10, ‐0.50] |
| 5 Mental state: 1b. Average score ‐ short term (endpoint skewed data, various scales, high = poor) Show forest plot | | | Other data | No numeric data |
|
| 5.1 BPRS | | | Other data | No numeric data |
| 5.2 BSI | | | Other data | No numeric data |
| 6 Social functioning: 1a. Average score ‐ short term (endpoint data, SFS, high = poor) Show forest plot | 1 | 70 | Mean Difference (IV, Fixed, 95% CI) | 7.20 [‐2.53, 16.93] |
|
| 6.1 at end of therapy | 1 | 70 | Mean Difference (IV, Fixed, 95% CI) | 7.20 [‐2.53, 16.93] |
| 7 Social functioning: 1b. Average score ‐ short term (endpoint skewed data, IIP, high = good) Show forest plot | | | Other data | No numeric data |
|
| 8 Quality of life: Average score ‐ short term (endpoint data, PercQoL, high = good) Show forest plot | 1 | 74 | Mean Difference (IV, Fixed, 95% CI) | 0.10 [‐0.27, 0.47] |
|
| 8.1 at end of therapy | 1 | 74 | Mean Difference (IV, Fixed, 95% CI) | 0.10 [‐0.27, 0.47] |