Ácido 5 aminosalicílico oral para el mantenimiento de la remisión inducida quirúrgicamente en la enfermedad de Crohn
Información
- DOI:
- https://doi.org/10.1002/14651858.CD003715.pub3Copiar DOI

- Base de datos:
-
- Cochrane Database of Systematic Reviews
- Versión publicada:
-
- 28 septiembre 2016see what's new
- Tipo:
-
- Intervention
- Etapa:
-
- Review
- Grupo Editorial Cochrane:
-
Grupo Cochrane de Salud digestiva
- Copyright:
-
- Copyright © 2016 The Cochrane Collaboration. Published by John Wiley & Sons, Ltd.
Cifras del artículo
Altmetric:
Citado por:
Autores
Declarations of interest
Anthony K Akobeng: None known
Dongni Zhang: None known
Morris Gordon has received a travel grants from various companies to attend scientific meetings to present results or chair sessions. These companies have had no input or involvement in any aspect of the review process during this or any previous systematic reviews carried out by Morris Gordon.
John K MacDonald: None known
Acknowledgements
Partial funding for the Cochrane IBD Group (April 1, 2016 ‐ March 31, 2018) has been provided by Crohn's and Colitis Canada (CCC).
Version history
| Published | Title | Stage | Authors | Version |
| 2016 Sep 28 | Oral 5‐aminosalicylic acid for maintenance of medically‐induced remission in Crohn's disease | Review | Anthony K Akobeng, Dongni Zhang, Morris Gordon, John K MacDonald | |
| 2005 Jan 24 | Oral 5‐aminosalicylic acid for maintenance of medically‐induced remission in Crohn's disease | Review | Anthony K Akobeng, Elizabeth Gardener | |
| 2002 Apr 22 | Oral 5‐aminosalicylic acid for maintenance of remisssion in Crohn's Disease | Protocol | Anthony Kwaku Akobeng, A. Hillary Steinhart, Elizabeth Gardener | |
Differences between protocol and review
Partial funding for the Cochrane IBD Group (April 1, 2016 ‐ March 31, 2018) has been provided by Crohn's and Colitis Canada (CCC).
Keywords
MeSH
Medical Subject Headings (MeSH) Keywords
Medical Subject Headings Check Words
Humans;
PICO

Study flow diagram.

Risk of bias summary: review authors' judgements about each risk of bias item for each included study.

Forest plot of comparison: 1 5‐ASA compared to placebo, outcome: 1.1 Relapse, drop‐outs classed as relapse, grouped by length of follow‐up.
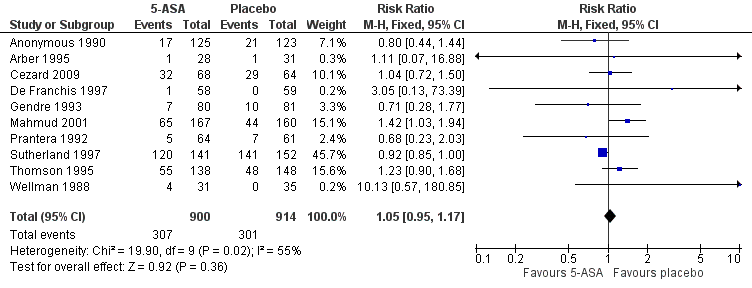
Forest plot of comparison: 1 5‐ASA compared to placebo, outcome: 1.5 Adverse events.

Funnel plot of comparison: 1 5‐ASA compared to placebo, outcome: 1.8 Relapse, drop‐outs classed as relapse, grouped by length of follow‐up.

Comparison 1 5‐ASA compared to placebo, Outcome 1 Relapse, drop‐outs classed as relapse, grouped by length of follow‐up.
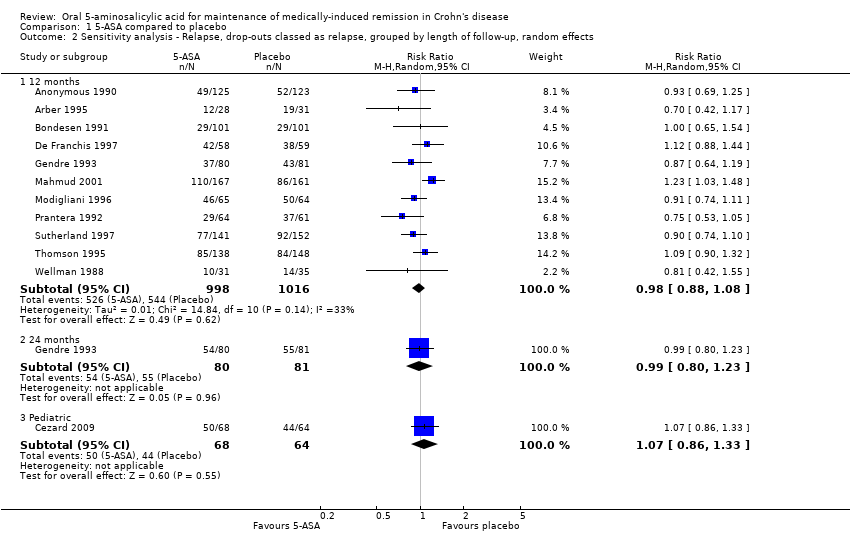
Comparison 1 5‐ASA compared to placebo, Outcome 2 Sensitivity analysis ‐ Relapse, drop‐outs classed as relapse, grouped by length of follow‐up, random effects.

Comparison 1 5‐ASA compared to placebo, Outcome 3 Sensitivity analysis ‐ Relapse, drop‐outs ignored, grouped by length of follow‐up.

Comparison 1 5‐ASA compared to placebo, Outcome 4 Sensitivity analysis ‐ Relapse, drop‐outs ignored, grouped by length of follow‐up, random effects.

Comparison 1 5‐ASA compared to placebo, Outcome 5 Adverse events.

Comparison 1 5‐ASA compared to placebo, Outcome 6 Withdrawals due to adverse events.

Comparison 1 5‐ASA compared to placebo, Outcome 7 Serious adverse events.

Comparison 1 5‐ASA compared to placebo, Outcome 8 Relapse, drop‐outs classed as relapse, grouped by length of follow‐up.
| 5‐ASA compared to placebo for maintenance of medically‐induced remission in Crohn's disease | ||||||
| Patient or population: patients with maintenance of medically‐induced remission in Crohn's disease | ||||||
| Outcomes | Illustrative comparative risks* (95% CI) | Relative effect | No of Participants | Quality of the evidence | Comments | |
| Assumed risk | Corresponding risk | |||||
| Control | 5‐ASA compared to placebo | |||||
| Relapse, drop‐outs classed as relapse, grouped by length of follow‐up ‐ 12 months | 535 per 10001 | 525 per 1000 | RR 0.98 | 2014 | ⊕⊕⊕⊝ | |
| Relapse, drop‐outs classed as relapse, grouped by length of follow‐up ‐ 24 months | 679 per 10003 | 672 per 1000 | RR 0.99 | 161 | ⊕⊕⊝⊝ | |
| Relapse, drop‐outs classed as relapse, grouped by length of follow‐up ‐ Pediatric | 688 per 10003 | 736 per 1000 | RR 1.07 | 132 | ⊕⊕⊕⊝ | |
| Adverse events | 329 per 10001 | 346 per 1000 | RR 1.05 | 1814 | ⊕⊕⊝⊝ | |
| Withdrawals due to adverse events | 130 per 10001 | 144 per 1000 | RR 1.11 | 1833 | ⊕⊕⊝⊝ | |
| Serious adverse events | 7 per 10001 | 10 per 1000 | RR 1.43 | 576 | ⊕⊕⊝⊝ | |
| *The basis for the assumed risk (e.g. the median control group risk across studies) is provided in footnotes. The corresponding risk (and its 95% confidence interval) is based on the assumed risk in the comparison group and the relative effect of the intervention (and its 95% CI). | ||||||
| GRADE Working Group grades of evidence | ||||||
| 1 Control group risk comes from control arm of meta‐analysis, based on included trials. | ||||||
| Study | Total Unknown ‐ n(%) | 5‐ASA unknown ‐ n(%) | Placebo unknown ‐ n(%) |
| Anonymous 1990 | 55 (22%) | 23 (19%) | 32 (26%) |
| Arber 1995 | 10 (17%) | 6 (21%) | 4 (13%) |
| Cezard 2009 | 30 (23%) | 21 (31%) | 9 (14%) |
| De Franchis 1997 | 17 (14%) | 8 (14%) | 9 (15%) |
| Gendre 1993 (Eng) | 42 (26%) | 23 (29%) | 19 (23%) |
| Mahmud 2001 | 82 (25%) | 55 (33%) | 27 (17%) |
| Modigliani 1996 | 44 (34%) | 17 (26%) | 27 (42%) |
| Prantera 1992 | 15 (12%) | 10 (16%) | 5 (8%) |
| Sutherland 1997 | 92 (31%) | 47 (33%) | 45 (30%) |
| Thompson 1995 | 98 (34%) | 52 (38%) | 46 (31%) |
| Wellman 1988 | 2 (3%) | 2 (6%) | 0 (0%) |
| Outcome or subgroup title | No. of studies | No. of participants | Statistical method | Effect size |
| 1 Relapse, drop‐outs classed as relapse, grouped by length of follow‐up Show forest plot | 12 | Risk Ratio (M‐H, Fixed, 95% CI) | Subtotals only | |
| 1.1 12 months | 11 | 2014 | Risk Ratio (M‐H, Fixed, 95% CI) | 0.98 [0.91, 1.07] |
| 1.2 24 months | 1 | 161 | Risk Ratio (M‐H, Fixed, 95% CI) | 0.99 [0.80, 1.23] |
| 1.3 Pediatric | 1 | 132 | Risk Ratio (M‐H, Fixed, 95% CI) | 1.07 [0.86, 1.33] |
| 2 Sensitivity analysis ‐ Relapse, drop‐outs classed as relapse, grouped by length of follow‐up, random effects Show forest plot | 12 | Risk Ratio (M‐H, Random, 95% CI) | Subtotals only | |
| 2.1 12 months | 11 | 2014 | Risk Ratio (M‐H, Random, 95% CI) | 0.98 [0.88, 1.08] |
| 2.2 24 months | 1 | 161 | Risk Ratio (M‐H, Random, 95% CI) | 0.99 [0.80, 1.23] |
| 2.3 Pediatric | 1 | 132 | Risk Ratio (M‐H, Random, 95% CI) | 1.07 [0.86, 1.33] |
| 3 Sensitivity analysis ‐ Relapse, drop‐outs ignored, grouped by length of follow‐up Show forest plot | 12 | Risk Ratio (M‐H, Fixed, 95% CI) | Subtotals only | |
| 3.1 12 Months | 10 | 1438 | Risk Ratio (M‐H, Fixed, 95% CI) | 0.90 [0.79, 1.01] |
| 3.2 24 Months | 1 | 119 | Risk Ratio (M‐H, Fixed, 95% CI) | 0.94 [0.68, 1.29] |
| 3.3 Pediatric | 1 | 102 | Risk Ratio (M‐H, Fixed, 95% CI) | 0.97 [0.72, 1.31] |
| 4 Sensitivity analysis ‐ Relapse, drop‐outs ignored, grouped by length of follow‐up, random effects Show forest plot | 12 | Risk Ratio (M‐H, Random, 95% CI) | Subtotals only | |
| 4.1 12 Months | 10 | 1438 | Risk Ratio (M‐H, Random, 95% CI) | 0.89 [0.76, 1.05] |
| 4.2 24 Months | 1 | 119 | Risk Ratio (M‐H, Random, 95% CI) | 0.94 [0.68, 1.29] |
| 4.3 Pediatric | 1 | 102 | Risk Ratio (M‐H, Random, 95% CI) | 0.97 [0.72, 1.31] |
| 5 Adverse events Show forest plot | 10 | 1814 | Risk Ratio (M‐H, Fixed, 95% CI) | 1.05 [0.95, 1.17] |
| 6 Withdrawals due to adverse events Show forest plot | 10 | 1833 | Risk Ratio (M‐H, Fixed, 95% CI) | 1.11 [0.88, 1.38] |
| 7 Serious adverse events Show forest plot | 3 | 576 | Risk Ratio (M‐H, Fixed, 95% CI) | 1.43 [0.24, 8.44] |
| 8 Relapse, drop‐outs classed as relapse, grouped by length of follow‐up Show forest plot | 11 | 2014 | Odds Ratio (M‐H, Fixed, 95% CI) | 0.97 [0.81, 1.16] |