重症の成人患者に対するセレン補充
アブストラクト
背景
セレンは健康に不可欠な微量ミネラルで、免疫、組織障害に対する防御、甲状腺機能に重要な役割を果たす。重症の成人患者では、セレンの状態を改善することが、高度の組織障害や感染を防ぐことにつながる可能性がある。本コクラン・レビューは2004年に初版が発表され、2007年、2015年に更新された。
目的
主要目的は、重症患者の死亡率に対するセレンまたはエブセレン補充の効果を調べることである。
副次目的は、セレンやエブセレンの補充と、感染数、人工呼吸器の使用期間、集中治療室の滞在期間、および入院期間との関連性を調べることである。
検索方法
今回の更新にあたり以下を検索した。Cochrane Central Register of Controlled Trialsの最新号、コクラン・ライブラリ(2014年、第5号)、MEDLINE(Ovid SP、2014年5月20日まで)、EMBASE(Ovid SP、2014年5月20日まで)、CAB、BIOSIS、CINAHL。最新の総説の文献リストを手作業で検索し、MEDLINEの検索結果と照合した。選択した研究の主な著者に、欠測や未報告、継続中の研究について問い合わせた。最新の検索は2014年5月21日まで実施した。現在、開始から2014年5月21日までについて検索した。
選択基準
発表の有無、発表日、ブラインド化(盲検化)の有無、発表されたアウトカム、および言語を問わず、ランダム化比較試験(RCT)を選択した。治験責任医師や著者に連絡し、関連性のあるデータや欠測データを得た。
データ収集と分析
2名のレビュー著者が独自にデータを抽出し、相違について協議のうえ解決した。主要アウトカム指標は全死因死亡率とした。複数のサブグループ解析および感度解析を実施し、重症患者に対するセレンの効果を評価した。介入効果に関する統合推定値として、95% 信頼区間(CI)を付したリスク比(RR)を提示した。試験の方法論に関する評価によりバイアスのリスクを、逐次解析により偶然誤差のリスクを評価した。
主な結果
本レビューの更新に際し、6件の新規RCTを選択した。本レビューでは合計16件のRCT(2084例)を選択した。ほとんどの試験でバイアスのリスクが高かった。利用可能なアウトカムデータが限定的で、セレン補充に関する試験は、1件を除き、サンプル・サイズが小規模であった。したがって、結果の解釈には注意を要する。
亜セレン酸ナトリウムを静脈内投与した13件の試験では、総死亡率が統計学的に有意に低下した(RR 0.82、95% CI 0.72 ~ 0.93、1391例、エビデンスの質は極めて低い)。しかし、試験のバイアスのリスクが高いことが、死亡率の全般的な点推定値に影響を与えた。エブセレンに関する3件の試験のメタアナリシスでは、RRが0.83であった(95% CI 0.52 ~ 1.34、693例、エビデンスの質は極めて低い)。
亜セレン酸ナトリウムを静脈内投与した9件の試験では28日間の死亡率を解析し、統計学的な有意差はみられなかった(RR 0.84、95% CI 0.69 ~ 1.02、1180例、エビデンスの質は極めて低い)。一方、3件の試験では90日間の死亡率を解析し、同様の知見が得られた(RR 0.96、95% Cl 0.78 ~ 1.18、614例、エビデンスの質は極めて低い)。
エブセレンに関する2件の試験では90日間の死亡率を解析し、いかなる利益も認められなかった(RR 0.72、95% Cl 0.42 ~ 1.22、588例、エビデンスの質は極めて低い)。
集中治療患者の死亡率について、セレン補充による統計学的に有意な利益はみられなかった(RR 0.88、95% CI 0.77 ~ 1.01、9件の試験、1168例、エビデンスの質は極めて低い)。
亜セレン酸ナトリウムを静脈内投与した6件の試験では、感染症の発症について統計学的な有意差はみられなかった(RR 0.96、95% CI 0.75 ~ 1.23、934例、エビデンスの質は極めて低い)。同様に、エブセレンに関する3件の試験で、感染症の発症に関するデータが得られたが(発熱、呼吸器感染症、髄膜炎)、明白な利益はなかった(RR 0.60、95% CI 0.36 ~ 1.02、685例、エビデンスの質は極めて低い)。
我々の解析では、有害事象に対するセレンやエブセレンの影響はみられなかった(セレン:RR 1.03、95% Cl 0.85 ~ 1.24、6件の試験、925例。エブセレン:RR 1.16、95% CI 0.40 ~ 3.36、2件の試験、588例、エビデンスの質は極めて低い)。
以下のアウトカムについて、セレン補充を支持する明白なエビデンスはなかった。人工呼吸器の使用期間:平均差(MD) ‐0.86、95% CI ‐4.39 ~ 2.67、4件の試験、191例、エビデンスの質は極めて低い。集中治療室の滞在期間:MD 0.54、95% CI ‐2.27 ~ 3.34、7件の試験、934例、エビデンスの質は極めて低い。入院期間:MD ‐3.33、95% Cl ‐5.22 ~ ‐1.44、5件の試験、693例、エビデンスの質は極めて低い。
試験の方法論的な質は低かった。選択した試験ではバイアスのリスクが高いため、結果の解釈には注意を要する。
著者の結論
多くの試験が発表されているが、重症患者にセレンやエブセレンの補充を推奨する最新のエビデンスについては、議論が続いている。本レビューで選択した試験の方法論的な不備(特にサンプル・サイズ、デザイン、アウトカム)を克服する試験が必要である。
PICOs
一般語訳
重症の成人患者に対するセレン補充
セレンは健康に不可欠なミネラルである。組織障害や疾患に対する防御に重要な役割を果たす。重症の成人患者では、セレンの状態を改善することが、患者を守ることにつながる可能性がある。
今回更新したレビューでは、重症疾患から回復中の成人に対するセレン補充の効果について、コクランの研究者が評価した。治療中にセレンを補充することで死亡者数が変化するのかを調べた。また、入院中のこれらの患者について、セレン補充が感染率や他の疾患に与える影響をチェックした。セレンが人工呼吸器の使用期間、集中治療室の滞在期間、および入院期間に影響を与えるかについても調べた。
参加者2084名を対象とした16件の試験を選択した。13件の試験ではセレンについて調べ、3件の試験ではセレン含有化合物のエブセレンについて調べていた。選択した試験の質は全般的に低く、質の指標に関する情報がほとんどなかった。結果は限定的で、セレン補充に関するこれらの試験の多くが小規模なものであった。大部分の試験では、情報の不足や不正確性に関するリスクが高かった。したがって、結果の解釈には注意を要する。エビデンスは2014年5月21日までのものである。
亜セレン酸ナトリウムを静脈内投与した13件の試験では、死亡に対し統計学的に有意な効果がみられた。セレン含有化合物のエブセレンに関する3件の試験では、死亡に対する効果はみられなかった。感染症や続発性疾患に対する影響はみられなかった。
人工呼吸器の使用期間、集中治療室の滞在期間、入院期間、および生活の質について、セレンやエブセレンの補充による利益を示す明らかなエビデンスはなかった。統計学的に有意な所見であっても、セレン補充を支持するエビデンスの確実性の解釈には注意を要する。
研究結果について、全般的にエビデンスの質が低かった。本レビューで選択した試験の統計的不確実性(特にサンプル・サイズ、デザイン、アウトカム)を克服する試験が必要である。
Authors' conclusions
Summary of findings
| Selenium supplementation compared with control for critically ill adults | |||||
| Patient or population: Patients with critical illnesses Settings: ICU setting Intervention: Selenium or ebselen | |||||
| Outcomes | Illustrative comparative risks* (95% CI) | Relative effect | No. of participants | Quality of the evidence | |
| Assumed risk | Corresponding risk | ||||
| Control | Selenium | ||||
| Overall mortality (regardless of the follow‐up period) | All patients are high risk population | RR 0.82, 95% CI 0.72 to 0.93) | 1391 | ⊕⊝⊝⊝ | |
| ICU length of stay (selenium) | The mean length of stay in an ICU ranged across control groups from | The mean length of stay in an ICU ranged across intervention groups from | MD 0.54, 95% CI ‐2.27 to 3.34 | 934 | ⊕⊝⊝⊝ |
| Days on ventilator (selenium) | The mean days on ventilator ranged across control groups from 6 days to 16 days | The mean days on ventilator ranged across intervention groups from | MD ‐0.86, 95% CI ‐4.39 to 2.67 | 191 | ⊕⊝⊝⊝ |
| Length of hospital stay (selenium) | The mean length of hospital stay ranged across control groups from | The mean length of hospital stay ranged across intervention groups from | MD ‐3.33. 95% CI ‐5.22 to ‐1.44 | 693 | ⊕⊝⊝⊝ |
| GRADE Working Group grades of evidence | |||||
| Abbreviations: CI: confidence interval; RR: risk ratio; MD: mean difference; ICU: intensive care unit. | |||||
Background
Description of the condition
Critical illness is characterized by hyperinflammation, cellular immune dysfunction, oxidative stress and mitochondrial dysfunction. Oxidative stress reflects an imbalance between highly reactive oxygen molecules, known as free radicals, and the ability of the body to counteract their harmful effects through neutralization by antioxidants. Selenium is a trace mineral that is essential to this neutralization. Selenium‐containing proteins include glutathione peroxidases and thioredoxin reductases (Angstwurm 2006), which are antioxidant enzymes essential for the removal of damaging reactive oxygen species (ROS). ROS damage proteins, polysaccharides, nucleic acids and polyunsaturated fatty acids, which may lead to cell death (Geoghegan 2006). Selenium deficiency impairs the immune response; and supplementation in replete people appears to enhance the immune response (Rayman 2012). The iodothyronine deiodinase enzymes, which control the production of the hormone triiodothyronine from thyroxine, also require selenium.
Description of the intervention
Selenium intake from plants (and thus animals) generally reflects the levels present in soils. There is particular concern that intake in people living in most parts of Europe is insufficient (Rayman 2012); intakes are generally higher in people living in North America. Selenium status is further impaired in people with poor quality diets, such as alcoholics, and when dietary intake is reduced, for example during a chronic illness and gastrointestinal malfunction.
Ebselen (2‐phenyl‐1,2‐benzisoselenazol‐3(2H)‐one) is an organic selenium‐containing compound which appears to act as a mimic of glutathione peroxidase; it may thus also have anti‐oxidant properties (Parnham 2000).
How the intervention might work
Evidence suggests that excessive oxidative stress plays an important role in the development of complications of critical illness, such as the systemic inflammatory response which leads to acute respiratory distress syndrome (ARDS) and multiple organ failure (Bulger 2001). Selenium appears to be pivotal in this role (Manzanares 2009). Berger 2007 reported fewer infections after major burns compared with placebo when providing an antioxidant trace element supplement containing selenium, zinc and copper. Giladi 2011 similarly reported that antioxidant supplementation with vitamin C, vitamin E and selenium in people with severe trauma was associated with fewer infections and less organ dysfunction compared to placebo.
Why it is important to do this review
In the last two decades, several clinical trials have evaluated the role of antioxidant micronutrients either as a monotherapy or in combined therapy, as part of an antioxidant strategy for critically ill patients.
Several systematic reviews have reported reduced risk of mortality as a result of selenium supplementation (Heyland 2005; Huang 2013; Landucci 2014; Manzanares 2012).
The organic selenium‐containing compound ebselen has also been investigated for its antioxidant properties in critical illness (Parnham 2000).
We aimed to systematically review randomized controlled trials (RCTs) of either selenium or ebselen supplementation in adults with critical illness. More compelling evidence is needed on this subject and on its potential benefits.
Objectives
The primary objective was to examine the effect of nutrition supplemented with selenium or ebselen on mortality in critically ill patients.
The secondary objective was to examine the relationship between selenium or ebselen supplementation and number of infections, duration of mechanical ventilation, length of intensive care unit stay and length of hospital stay.
Methods
Criteria for considering studies for this review
Types of studies
We included RCTs irrespective of publication status, date of publication, blinding status, outcomes published or language. We contacted the trial investigators and authors for relevant data. We included unpublished trials only if trial data and methodological descriptions were provided either in written form or could be retrieved from the trial authors. We excluded cross‐over trials. No cluster‐RCTs were identified but we plan to include these, if found, in future updates.
Types of participants
We included studies on adults with critical illness (including patients with burns, head injury, brain haemorrhage, cerebrovascular accident) and those undergoing elective major surgery.
Studies reporting mixed groups of participants (for example, combined data of critically ill and medical patients) were included only if data could be provided separately for patients with critical illness.
We excluded trials including neonates and participants aged under 18 years.
Types of interventions
We included trials on nutritional interventions by the enteral or parenteral route, or both routes, supplemented with additional selenium versus nutritional care by the same route without additional selenium. We examined all types of selenium compounds including ebselen.
We undertook separate subgroup analyses of trials in which we calculated risk ratio (RR) for selenium/ebselen versus no selenium. If selenium was one of several components in an antioxidant supplement protocol, the trial was excluded based on our inability to assess the direct and isolated benefit of selenium.
Types of outcome measures
Primary outcomes
-
Overall mortality (longest follow‐up, regardless of the period of follow‐up).
-
Mortality by duration (studies reporting mortality for 28 and 90 days).
Secondary outcomes
-
Number of infectious complications (as defined in each of the included studies).
-
Adverse events.
-
Length of stay in an intensive care unit (ICU).
-
Number of days on a ventilator.
-
Length of hospital stay.
-
Quality of life after discharge (as defined in the included studies).
-
Economic outcomes.
Search methods for identification of studies
Electronic searches
In this review update, we performed a search update up to 20 May 2014. Thus, we searched the Cochrane Central Register of Controlled Trials (the Cochrane Library 2014, Issue 5; see Appendix 1). We updated our search of MEDLINE (Ovid SP, to May 20, 2014, see Appendix 2) and EMBASE (Ovid SP, to May 20, 2014, see Appendix 3). The search is now from inception until 21 May 2014
Searching other resources
We handsearched the reference lists of reviews (Huang 2013; Landucci 2014; Manzanares 2012), randomized and non‐randomized studies, and editorials for additional studies. We searched the ASPEN and ESPEN databases without finding references to selenium or ebselen. References were crosschecked with our search in MEDLINE. We contacted the main authors of included studies to ask for any missed, unreported or ongoing studies.
We searched for ongoing clinical trials and unpublished studies on the following Internet sites:
No language restriction was applied to eligible reports. The latest search was performed 22 October 2014.
Data collection and analysis
Two review authors (MA, AA) independently screened and classified all citations as potential primary studies, review articles or other. Also, the two review authors independently examined all potential primary studies and decided on their inclusion in the review. Data on methodology and outcomes from each trial were independently extracted and evaluated in accordance with the Cochrane Handbook for Systematic Reviews of Interventions (Higgins 2011). We resolved any disagreements by consensus among the review authors.
Selection of studies
We assessed the articles identified from the described searches and excluded obviously irrelevant reports. Two review authors (MA, AA) independently examined articles for eligibility and screened the titles and abstracts in order to identify studies for eligibility (see: Characteristics of included studies; Characteristics of excluded studies). This process was performed without blinding of authors, institution, journal of publication or results. We resolved any disagreements by consensus among the review authors. We provide a detailed description of the search and assessment.
Data extraction and management
We independently extracted and collected the data without being blinded to the author, source institution or the publication source of trials. We resolved disagreements by discussion and approached all first authors of the included trials for additional information on risks of bias. For more detailed information please see the 'Contributions of authors' section.
Assessment of risk of bias in included studies
We evaluated the validity and design characteristics of each trial. Trials were evaluated for major potential sources of bias (random sequence generation, allocation concealment, blinding, intention‐to‐treat (ITT) analysis and completeness of follow‐up). We assessed each trial quality factor separately and defined the trials as having low risk of bias only if they adequately fulfilled all of the below described criteria.
1. Random sequence generation
Assessment of randomization: sufficiency of the method in producing two comparable groups before intervention.
Grade: ’low risk’: a truly random process (e.g. random computer number generator, coin tossing, throwing dice); ’high risk’: any non‐random process (e.g. date of birth, date of admission by hospital or clinic record number or by availability of the intervention); or ’unclear risk’: insufficient information.
2. Allocation concealment
Allocation method prevented investigators or participants from foreseeing assignment.
Grade: ’low risk’: central allocation or sealed opaque envelopes; ’high risk’: using open allocation schedule or other unconcealed procedure; or ’unclear risk’: insufficient information.
3. Blinding
Assessment of appropriate blinding of the team of investigators and participants: person responsible for participant care, participants and outcome assessors.
Grade: ’low risk’: blinding considered adequate if participants and personnel were kept unaware of intervention allocations after inclusion of participants into the study, and if the method of blinding involved a placebo indistinguishable from the intervention, as mortality is an objective outcome; ’high risk’: not double‐blinded, categorized as an open label study, or without use of a placebo indistinguishable from the intervention; ’unclear risk’: blinding not described.
4. Incomplete outcome data
Completeness of outcome data, including attritions and exclusions.
Grade: ’low risk’: numbers and reasons for drop‐outs and withdrawals in the intervention groups described, or no drop‐outs or withdrawals was specified; ’high risk’: no description of drop‐outs and withdrawals provided; ’unclear risk’: report gave the impression of no drop‐outs or withdrawals, but this was not specifically stated.
5. Selective reporting
The possibility of selective outcome reporting.
Grade: ’low risk’: reported outcomes prespecified in an available study protocol, or, if this is not available, published report includes all expected outcomes; ’high risk’: not all prespecified outcomes reported, reported using non‐prespecified subscales, reported incompletely or report fails to include a key outcome that would have been expected for such a study; ’unclear risk’: insufficient information.
6. Funding bias
Assessment of any possible funding bias:
Grade: ’low risk’: reported no funding, funding from universities or public institutions; ’high risk’: funding from private investors, pharmaceutical companies or trial investigator employed by the pharmaceutical company; ’unclear risk’: insufficient information.
7. Other bias
Assessment of any possible sources of bias not addressed in domains 1 to 6.
Grade: ’low risk’: report appears to be free of such biases; ’high risk’: at least one important bias is present that is related to study design, early stopping because of some data‐dependent process, extreme baseline imbalance, academic bias, claimed fraudulence or other problems; or ’unclear risk’: insufficient information, or evidence that an identified problem will introduce bias.
Measures of treatment effect
Dichotomous data
We calculated RRs with 95% confidence intervals (CIs) for dichotomous data (binary outcomes). These included:
Primary outcomes:
-
Mortality by duration and overall mortality.
Secondary outcomes:
-
Number of infectious complications.
-
Adverse events.
Continuous data
We used the mean difference (MD) or RR if data were continuous and measured in the same way between trials. These included:
-
Length of stay in an ICU.
-
Number of days on a ventilator.
-
Length of hospital stay.
Unit of analysis issues
Cross‐over trials
We excluded cross‐over trials from our meta‐analyses because of the potential risk of "carry‐over" of treatment effect.
Studies with multiple intervention groups
In studies designed with multiple intervention groups we combined groups to create a single pair wise comparison in accordance with Higgins 2011. In trials with two or more groups receiving different doses, we combined data for the primary and secondary outcomes.
Dealing with missing data
We contacted the authors of trials with missing data in order to retrieve the relevant information. For all included studies we noted levels of attrition and any exclusion of participants. In case of missing data, we chose 'complete‐case analysis' for our primary outcomes, which excludes from the analysis all participants with the outcome missing. Selective outcome reporting occurs when non‐significant results are selectively withheld from publication (Chan 2004), and is defined as the selection, on the basis of the results, of a subset of the original variables recorded for inclusion in publication of trials (Hutton 2000). The most important types of selective outcome reporting are: selective omission of outcomes from reports; selective choice of data for an outcome; selective reporting of different analyses using the same data; selective reporting of subsets of the data; and selective under‐reporting of data (Higgins 2011).
Assessment of heterogeneity
We explored heterogeneity using the I² statistic and Chi² test. An I² statistic above 50% represents substantial heterogeneity (Higgins 2003). In case of an I² statistic value > 0 (mortality outcome), we tried to determine the cause of heterogeneity by performing relevant subgroup analyses. We used the Chi² test to provide an indication of heterogeneity between studies, with P ≤ 0.1 considered significant.
Assessment of reporting biases
Funding bias is related to the possible publication delay or discouragement of undesired results in trials sponsored by the industry (Higgins 2011). To explore the role of funding, we planned to conduct a sensitivity analysis based on our primary endpoint.
Data synthesis
Using RevMan 5.3, we calculated RR with 95% CIs for dichotomous variables and MD with 95% CIs for continuous outcomes. We used the Chi² test to provide an indication of heterogeneity between studies, with P < 0.1 considered significant. The degree of heterogeneity observed in the results was quantified using the I² statistic, which can be interpreted as the proportion of the total variation observed between the studies that is attributable to differences between studies rather than sampling error (Higgins 2002). An I² statistic value > 75% is considered very heterogeneous. We used both a random‐effects model and a fixed‐effect model. If the I² statistic value was 0 we only reported the results from the fixed‐effect model; and in the case of the I² statistic value being > 0 we reported only the results from the random‐effects model.
Trial sequential analysis
Trial sequential analysis (TSA) is a methodology that combines an information size calculation for meta‐analysis with a threshold of statistical significance. TSA is a tool for quantifying the statistical reliability of data in a cumulative meta‐analysis, adjusting significance levels for sparse data and repetitive testing on accumulating data. We conducted TSA (Brok 2009; Pogue 1997; Thorlund 2009; Wetterslev 2008) at least on the primary outcomes and on the secondary outcomes if the accrued information size was an acceptable fraction of the estimated required information size to allow meaningful analyses (> 20). If the actual accrued information size was too low, we provided the required information size given the actual diversity in case of low risk of bias (Wetterslev 2009) or adjusted with a possible diversity of 25% in case of high risk of bias and absence of actual diversity.
Meta‐analysis may result in type I errors due to random errors arising from sparse data or repeated significance testing when updating the meta‐analysis with new trials (Brok 2009; Wetterslev 2008). Bias (systematic error) from trials with low methodological quality, outcome measure bias, publication bias, early stopping for benefit and small trial bias may also result in spurious P values (Brok 2009; Higgins 2011; Wetterslev 2008).
In a single trial, interim analysis increases the risk of type I errors. To avoid these, group sequential monitoring boundaries are applied to decide whether a trial could be terminated early because of a sufficiently small P value, i.e. the cumulative Z‐curve crosses the monitoring boundaries (Lan 1983). Sequential monitoring boundaries can also be applied to meta‐analysis, and are called trial sequential monitoring boundaries. In TSA, the addition of each trial in a cumulative meta‐analysis is regarded as an interim meta‐analysis and helps to clarify whether additional trials are needed.
The idea in TSA is that if the cumulative Z‐curve crosses the boundary, a sufficient level of evidence is reached and no further trials may be needed (firm evidence). If the Z‐curve does not cross the boundary, then there is insufficient evidence to reach a conclusion. To construct the trial sequential monitoring boundaries the required information size is needed and is calculated as the least number of participants needed in a well‐powered single trial (Brok 2009; Pogue 1997; Thorlund 2011; Trial Sequential Analysis (TSA); Wetterslev 2008). We aimed to apply TSA as it prevents an increase in the risk of type I error with sparse data or multiple updating in a cumulative meta‐analysis. Hence, TSA provides us with important information in order to estimate the level of evidence of the experimental intervention, the need for additional trials and their sample size.
Subgroup analysis and investigation of heterogeneity
We conducted the following subgroup analyses:
-
Mortality by duration. We planned to use 28, 90 days and the longest follow‐up period. If data were provided in 30 days we included them in the same analysis as 28 days.
-
Mortality among patients admitted in a general ICU.
-
Mortality among patients admitted under the diagnosis of acute pancreatitis.
-
Number of infected participants.
-
Number of participants with adverse event.
-
Length of stay in the ICU.
-
Number of days on a ventilator.
-
Length of hospital stay.
We considered P values < 0.05 as indicating significant interaction between the subgroup category.
Sensitivity analysis
We decided to carry out a sensitivity analysis on the results by applying fixed‐effect and random‐effects models to assess the impact of heterogeneity on our results.
Summary of findings
We used the principles of the Grades of Recommendation, Assessment, Development and Evaluation (GRADE) approach to provide an overall assessment of the evidence relating to the following outcomes: Overall mortality (regardless of the follow‐up period), ICU length of stay (selenium), Days on ventilator (selenium), Length of hospital stay (selenium) (summary of findings Table for the main comparison).
Results
Description of studies
See: Characteristics of included studies; Characteristics of excluded studies; Characteristics of studies awaiting classification; Characteristics of ongoing studies sections.
Results of the search
In this updated review, 11 trials was identified via the search strategy, 6 were included, 5 were excluded, two were classified as ongoing and two are awaiting assessment. We have listed the reasons for excluding the 5 studies in the 'Characteristics of excluded studies' table. Three included studies and three excluded studies were published in German only, and one included trial was in Spanish. Translations to English were performed for these studies. Some trials had multiple full text publications (Angstwurm 1999; Berger 2001; Saito 1998; SIGNET 2011; Zimmermann 1997). A total of 2084 patients were included in this review update.
Of the six new included studies, we found one by handsearching (Montoya 2009) and five using our search string (Forceville 2007; Janka 2013; Manzanares 2011; SIGNET 2011; Valenta 2011). We sought further details and obtained them for four studies (Angstwurm 2007; Angstwurm 1999; Manzanares 2011; Valenta 2011). The flow chart for this updated review is given in Figure 1.
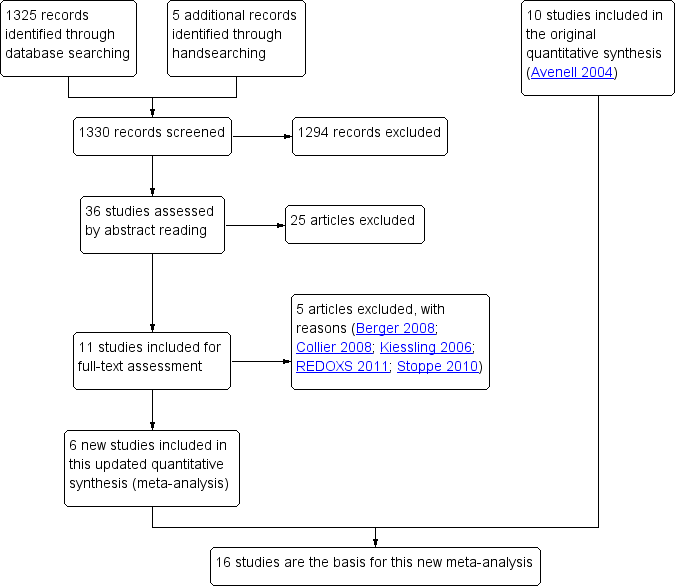
Study flow diagram for the updated review. (In the original article, Avenell 2004, 10 studies were included and 11 studies were excluded with reasons. Three were awaiting classification, of which one has now been excluded (Kiessling 2006). Two studies are still ongoing).
Included studies
The included trials were all published between 1997 and 2013 except for one trial which was published in 1991 (Kuklinski 1991). Three trials of ebselen were Japanese multicentre trials (Ogawa 1999; Saito 1998; Yamaguchi 1998). One trial of selenium was a multicentre trial in Germany (Angstwurm 2007), one was a multicentre trial in the UK (SIGNET 2011) and one was a multicentre trial in France (Forceville 2007). The remaining Selenium trials were single centre trials in the Czech Republic, Germany, Switzerland, the UK and Uruguay (Angstwurm 1999; Berger 2001; Janka 2013; Kuklinski 1991; Lindner 2004; Manzanares 2011; Mishra 2007; Valenta 2011; Zimmermann 1997). One trial did not state the location (Montoya 2009).
The 16 included studies involved a total of 2084 participants. We have provided the details of the included studies in the 'Characteristics of included studies' section. Eleven trials recruited more male than female participants (Angstwurm 1999; Angstwurm 2007; Berger 2001; Forceville 2007; Janka 2013; Lindner 2004; Montoya 2009; Ogawa 1999; SIGNET 2011; Valenta 2011; Yamaguchi 1998). One trial recruited only men (Kuklinski 1991), one did not report the sex of the participants (Zimmermann 1997) and three studies had more women than men (Manzanares 2011; Mishra 2007; Saito 1998). Where reported, the mean age of participants was greater than 50 years. Two trials excluded participants older than 75 and 71 years, respectively (Berger 2001; Saito 1998).
Trials of selenium recruited participants with the following conditions: sepsis or systemic inflammatory response syndrome (Angstwurm 2007; Angstwurm 1999; Forceville 2007; Janka 2013; Manzanares 2011; Mishra 2007; Montoya 2009; Valenta 2011; Zimmermann 1997), severe multiple injury (Berger 2001), more serious cases of acute pancreatitis (Kuklinski 1991; Lindner 2004) and gastrointestinal failure requiring parenteral nutrition (56% with sepsis; SIGNET 2011). The three trials of ebselen were conducted in participants with acute neurological conditions: acute middle cerebral artery occlusion (Ogawa 1999), aneurysmal subarachnoid haemorrhage (Saito 1998) and acute ischaemic stroke (Yamaguchi 1998).
It is unclear whether ebselen and selenium have similar mechanisms of action and thus, we chose not to consider them as identical interventions. For the ebselen trials, no details were provided concerning the need for ventilation or the level of critical illness care required.
The three neurological trials of ebselen (Ogawa 1999; Saito 1998; Yamaguchi 1998) all used an enteral dose of 300 mg daily for 14 days that was compared to a matching placebo. The trials of selenium used intravenous selenium, usually given as a sodium selenite, as a continuous infusion over 24 hours, with doses of selenium ranging from 155 mcg to 4000 mcg (often decreasing the dose as time went on). Four studies gave loading bolus doses on the first day (Angstwurm 2007; Manzanares 2011; Montoya 2009; Zimmermann 1997) and a fifth (Valenta 2011) gave daily boluses. Only Zimmermann 1997 had no comparison infusion. No trial examined the impact of selenium or ebselen supplementation for more than 28 days.
Berger 2001 included three trial groups: selenium only, selenium combined with alpha‐tocopherol and zinc, and placebo control. We have presented only the comparison between selenium and placebo. The SIGNET 2011 trial included four study groups: glutamine only, selenium only, selenium combined with glutamine, and a placebo group. We pooled data for selenium only and selenium combined with glutamine as the treatment group, and glutamine only and placebo as the control group.
Excluded studies
We excluded 16 studies (Berger 1998; Berger 2004a; Berger 2004b; Berger 2005a; Berger 2005b; Berger 2008; Börner 1997; Collier 2008; Kiessling 2006; Porter 1999; REDOXS 2011; Stoppe 2010; Thiele 1997; Uden 1990; Watters 2002; Wollschläger 1997) for the reasons detailed in the 'Characteristics of excluded studies' section.
Ongoing studies
Two studies are ongoing (Geoghegan 2009; Yamaguchi 2003; see the 'Characteristics of ongoing studies' section.
Awaiting classification
Two studies are awaiting classification (SEREAL 2012; SISPCT; see the 'Characteristics of studies awaiting classification' section.
Risk of bias in included studies
The risk of bias of the included studies was high. The trials often failed to report trial methodology in sufficient detail. One trial had improved methodology after further details were obtained from one trial author (Angstwurm 1999). See Description of studies, Figure 2 and Figure 3
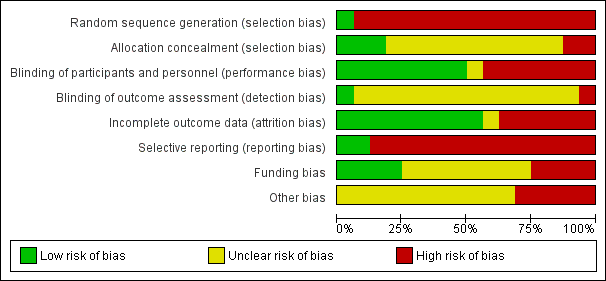
'Risk of bias' graph: review authors' judgements about each 'Risk of bias' item presented as percentages across all included studies.
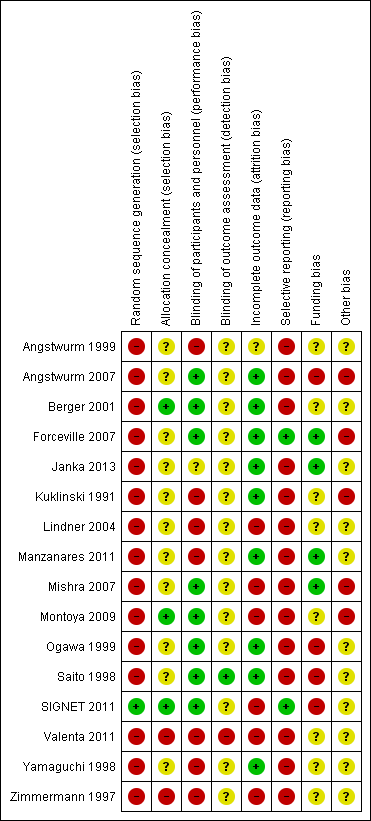
'Risk of bias' summary: review authors' judgements about each 'Risk of bias' item for each included study.
All but one of the included studies were RCTs; Valenta 2011 was a quasi‐RCT.
In eight trials groups were clearly comparable at baseline (Angstwurm 1999; Kuklinski 1991; Lindner 2004; Janka 2013; Montoya 2009; Ogawa 1999; SIGNET 2011; Yamaguchi 1998). Four trials did not clearly report following up all participants to the end of the trial (Lindner 2004; Mishra 2007; Montoya 2009; Zimmermann 1997). All trials clearly reported the treatments given for the trial but no trial clearly described the co‐interventions as being equally provided to all groups. Six trials gave objectively described definitions of trial outcomes (Angstwurm 1999; Berger 2001; Manzanares 2011; Ogawa 1999; SIGNET 2011; Yamaguchi 1998).
Allocation
Concealment of allocation was confirmed in only three trials (Berger 2001; Montoya 2009; SIGNET 2011). The other trials did not clearly report the method of concealment of allocation. Although not always explicitly stated, ITT analysis was undertaken in seven of the 16 trials (Angstwurm 1999; Forceville 2007; Kuklinski 1991; Ogawa 1999; Saito 1998; SIGNET 2011; Zimmermann 1997). The risk of selection bias is high.
Blinding
Ten trials were reported to be blinded or double blinded (Angstwurm 2007; Berger 2001, Lindner 2004; Manzanares 2011; Mishra 2007; Montoya 2009; Ogawa 1999; Saito 1998; SIGNET 2011; Yamaguchi 1998). For the outcomes assessed in this review, it was often unclear to whom the blinding referred. Only Angstwurm 2007 and Angstwurm 1999 recruited consecutive eligible patients. Due to the poorly described level of blinding in most trials, the risk of bias remains unclear.
Incomplete outcome data
One trial, Montoya 2009, had a follow‐up period of 10 days. The average (median) length of mechanical ventilation in the control group was 13 days compared to nine days in the intervention group. The median length of stay in hospital was 17 days for the control group and 12 days for the intervention group. It remains unclear how long the patients indeed were followed‐up. Most trials poorly described or failed to describe the follow‐up period (Angstwurm 1999; Lindner 2004; Mishra 2007; Montoya 2009; SIGNET 2011; Valenta 2011; Zimmermann 1997). The risk of attrition bias is thus high.
Selective reporting
Only two trials had published a protocol or registered the trial in an available database (Forceville 2007; SIGNET 2011). Thus, for most trials we are unable to assess the degree of reporting bias. The overall risk of bias is high for selective reporting.
Other potential sources of bias
Funding bias
Four studies provided a conflict of interest statement (Forceville 2007; Manzanares 2011; SIGNET 2011; Valenta 2011). Five trials reported receiving pharmaceutical company funding (Angstwurm 2007; Ogawa 1999; Saito 1998; SIGNET 2011; Yamaguchi 1998), and in one trial a study was acknowledged for providing the study drug (Forceville 2007).
Effects of interventions
See: Summary of findings for the main comparison Summary of findings table 1
The outcomes reported in the included studies are listed in the 'Characteristics of included studies' table. Where available, we have presented mortality results using denominators based on the numbers of participants at randomization. Generally, we have presented the results for other outcomes using denominators based on the numbers of participants available at follow‐up.
Primary outcomes
Mortality
All 16 included studies provided mortality data, 13 trials used selenium as intravenous sodium selenite (Angstwurm 1999; Angstwurm 2007; Berger 2001; Forceville 2007; Kuklinski 1991; Janka 2013; Lindner 2004; Manzanares 2011; Mishra 2007; Montoya 2009; SIGNET 2011; Valenta 2011; Zimmermann 1997) and three trials used ebselen (Ogawa 1999; Saito 1998; Yamaguchi 1998).
In trials of selenium, overall mortality was reduced in the intervention group (RR 0.82, 95% Cl 0.72 to 0.93, I² statistic = 0%, fixed‐effect model) while for ebselen the RR in favour of intervention among trials was 0.83 (95% Cl 0.52 to 1.34, I² statistic = 0%, fixed‐effect model). Combined data for mortality showed a RR of 0.82 (95% Cl 0.72 to 0.93; I² statistic = 0%, test for subgroup differences: I² statistic = 0%; Analysis 1.1; Figure 4).

Funnel plot of comparison: 1.2 Overall mortality (regardless of the follow‐up period).
Twenty‐eight days mortality among selenium studies yielded a RR of 0.84 (Cl 95% 0.69 to 1.02, I² statistic = 21%, random‐effects model) while at 90 days RR was 0.96 (95% CI 0.78 to 1.18, I² statistic = 0% random‐effects model) (Analysis 2.1).
Inclusion of the data from the three trials of ebselen showed no statistically significant difference in mortality (RR 0.83, 95% CI 0.52 to 1.34; I² statistic = 0%). Only Ogawa 1999 reported mortality at 30 days (RR 1.78, 95% CI 0.53 to 5.95) while Saito 1998 and Yamaguchi 1998 reported mortality data at three months follow‐up (RR 0.72, 95% CI 0.42 to 1.22) (Analysis 2.2).
Mortality in trials of selenium in intensive care patients (Angstwurm 1999; Angstwurm 2007; Berger 2001; Forceville 2007; Janka 2013; Manzanares 2011; Mishra 2007; SIGNET 2011; Valenta 2011; Zimmermann 1997) compared with trials in patients with acute pancreatitis (Kuklinski 1991; Lindner 2004) yielded a RR of 0.88 (95% CI 0.77 to 1.01, I² statistic = 0%, random‐effects model). In patients with acute pancreatitis the RR was 0.40 (95% CI 0.01 to 12.30, I² statistic = 81% random‐effects model) (Analysis 2.3).
Secondary outcomes
Number of infectious complications
Six trials of intravenous sodium selenite provided data on this outcome (Angstwurm 2007; Berger 2001; Forceville 2007; Lindner 2004; Manzanares 2011; SIGNET 2011).
Berger 2001 provided data for participants developing infections based on the number of participants requiring antibiotics. Angstwurm 2007 reported no significant difference in the incidence of new infections (for example the development of hospital acquired pneumonia, as well as the incidence of acute respiratory distress syndrome). Forceville 2007 reported participants with at least one episode of nosocomial pneumonia and one participant on selenium developing a superinfection. Similarly, Manzanares 2011 reported participants with ventilator‐associated pneumonia. Lindner 2004 provided data on patients developing sepsis or peritonitis. SIGNET 2011 reported new infections at 14 days post‐randomization (both clinically suspected infections (used in our meta‐analysis)) and infections confirmed and based on Centers for Disease Control and Prevention criteria (reported odds ratio 0.75, 95% CI 0.52 to 1.08, P = 0.12). Based on data from these six trials, there was no statistically significant difference (RR 0.96, 95% CI 0.75 to 1.23, I² statistic = 16%, random‐effects model; Analysis 3.1). Mishra 2007 reported an infection rate instead of number of infections; consequently the data could not be included but no significant difference between groups was found.
All three trials of ebselen (Ogawa 1999; Saito 1998; Yamaguchi 1998) provided data for participants developing infections (pyrexia, respiratory infections or meningitis) with no statistically significant difference (RR 0.60, 95% CI 0.36 to 1.02, I² statistic = 33%, random‐effects model; Analysis 3.1).
Adverse events
Trial investigators reported a wide variety of individual adverse events, including: organ failure, shock, requirement for inotropic support, requirement for fluids or transfusion, gastrointestinal bleeding, cerebral infarction and haemorrhage, nausea and vomiting, acute myocardial infarction, pulmonary embolism, enterocolitis, pancreatitis and skin rash. Angstwurm 1999 reported that renal failure requiring continuous veno‐venous haemodialysis was required for three of the 21 participants receiving intravenous sodium selenite and nine of the 21 participants in the control group. Angstwurm 2007 reported that the need for haemodialysis or vasopressor therapy was identical in the two groups and that adverse events occurred in 110/122 of the intravenous sodium selenite group and 119/124 of the placebo group. Three trials reported numbers of participants developing any serious adverse event (Forceville 2007; Manzanares 2011; SIGNET 2011). Mishra 2007 reported that five of the 18 selenium supplemented participants required renal replacement compared with seven of the 22 controls. The RR for an adverse event from these six trials was 1.03 (95% CI 0.85 to 1.24, I² statistic = 41%; Analysis 4.1).
In the three trials of ebselen, the overall incidence of adverse events in the ebselen and placebo groups were reported as 7.3% and 3.3%, respectively (Yamaguchi 1998); 10% and 14%, respectively (Saito 1998); and as not significantly different (Ogawa 1999). Combining the results for Saito 1998 and Yamaguchi 1998 (no available data for Ogawa 1999) yielded a RR of 1.16 (95% CI 0.40 to 3.36, I² statistic = 68%; Analysis 4.1).
Length of stay in ICU
Seven trials of intravenous sodium selenite provided data on the length of stay in intensive care (Angstwurm 1999; Angstwurm 2007; Berger 2001; Forceville 2007; Manzanares 2011; Mishra 2007; SIGNET 2011; Table 1). Three trials provided data directly suitable for meta‐analysis (Angstwurm 2007; Manzanares 2011; Mishra 2007). Four trials (Angstwurm 1999; Berger 2001; Forceville 2007; SIGNET 2011) provided data which had to be processed. The overall MD was 0.54 (95% CI ‐2.27 to 3.34, I² statistic = 72%, random‐effects model; Analysis 4.2).
| Trial | Selenium | Control |
| 22.8 days (20.8) | 26.5 days (22) | |
| 15.1 days (10) | 12.7 days (9) | |
| 7,5 days (3.5) | 9 days (7.1) | |
| 22.3 days (9.6) | 17 days (8.7) | |
| 14 days (11) | 13days (6) | |
| 21.3 days (16.2) | 20.8 days (21.8) | |
| 14.5 days (4.6) | 16.7 days (5.9) | |
| MD 0.54 (95% CI ‐2.27 to 3.34, I² statistic = 72%, random‐effects model) | ||
All findings given as mean (SD). If the original figures were provided in median (range) or interquartile range, we converted them to mean (SD) (Hozo 2005).
Number of days on a ventilator
Five trials of intravenous sodium selenite provided data for the number of days on a ventilator (Table 2). Four trials provided data suitable for meta‐analysis (Angstwurm 1999; Berger 2001; Forceville 2007; Montoya 2009; Table 2). One trial, Angstwurm 2007, reported the incidence and hours of mechanical ventilation as not significantly different between groups (mean of 13 days with selenium for 84 participants and 11 days with placebo for 95 participants), but stated no range of days. The overall MD was ‐0.86 (95% CI ‐4.39 to 2.67, I² statistic = 89%, random‐effects model; Analysis 4.3).
| Trial | Selenium | Control |
| 11 days (5.9) | 16 (12.6) | |
| 6 days (2.9) | 6 days (5.7) | |
| 19.8 days (7.8) | 14.8 days (4.4) | |
| 9.3 days (1.5) | 12 days (1.8) | |
| MD ‐0.86 (95% CI ‐4.39 to 2.67, I² statistic = 89%, random‐effects model) | ||
All findings given as mean (SD). If the original figures were provided in median (range), we converted them to mean (SD) (Hozo 2005).
Length of hospital stay
Five trials, all of intravenous sodium selenite, provided data on the length of hospital stay (Angstwurm 1999; Berger 2001; Forceville 2007; Montoya 2009; SIGNET 2011; Table 3). The overall MD was ‐3.33 (95% CI ‐5.22 to ‐1.44, I² statistic = 42%, random‐effects model; Analysis 4.4).
| Trial | Selenium | Control |
| 38.5 days (24.4) | 39.5 days (15.7) | |
| 83 days (73.5) | 62.8 days (30.2) | |
| 31.3 days (18) | 32 days (11.6) | |
| 12.5 days (0.6) | 17 days (1.7) | |
| 31.7 days (10.9) | 33.8 days (12.4) | |
| MD ‐3.33 (95% CI ‐5.22 to ‐1.44, I² statistic = 42%, random‐effects model) | ||
All findings given as mean (SD). If the original figures were provided in median (range) or interquartile range, we converted them to mean (SD) (Hozo 2005).
Quality of life after discharge
Trials of ebselen (Ogawa 1999; Saito 1998; Yamaguchi 1998) reported no statistically significant difference in Glasgow Outcome Scales (Jennett 1975) at final follow‐up. However, Yamaguchi 1998 reported that the Modified Barthel Index Score (Shah 1989), an assessment of functional status, was significantly improved by ebselen at a final follow‐up time of three months.
Only one trial, Ogawa 1999, stated the results in values. The other two trials, Saito 1998 and Yamaguchi 1998, showed only a graphical representation. Consequently, we were unable to make an analysis for this subgroup.
No trials of selenium have provided quality of life data.
Economic outcomes
No trials provided details of costs or economic outcomes.
Other findings
Six trials found significantly increased activity of the antioxidant selenoenzyme glutathione peroxidase, demonstrating the potential for intravenous selenium to improve antioxidant capacity in participants (Angstwurm 2007; Angstwurm 1999; Berger 2001; Manzanares 2011; Mishra 2007; Valenta 2011). The measurement of selenium levels in the blood may be an unreliable marker of selenium status because levels fall with an acute phase response provoked by injury or infection (Sattar 1997).
Trials sequential analysis (TSA):
Since TSA was not part of the previous version of this review, Avenell 2004, we used the calculated relative risk and event rates of Analysis 1.1 to calculate the required information size. In our TSA of the impact of selenium supplementation on mortality among critically ill patients using a control event proportion of 32% found in the included trials, with a type 1 error of 5% and a 18% relative risk reduction (80% power), the trial sequential monitoring boundary for benefit is not crossed by the z‐curve (Figure 5). However, these lines are very close to crossing each other. This may suggest a probability of lack of random error for the conclusion of an effect of 18% relative risk reduction even though the required information size (N = 2605) has not yet been reached. Nevertheless, one must exert caution when interpreting the results of our TSA on mortality since all included studies are at high risk of bias and the intervention effect is likely to have been overestimated in the traditional meta‐analysis. This will inevitably influence the TSA result. As a general rule TSA is unable to adjust for risk of bias and is ideally designed for studies with low risk of bias. Thus, we anticipate a higher degree of heterogeneity and diversity, and consequently a different TSA output once the results of the ongoing large RCTs are published.
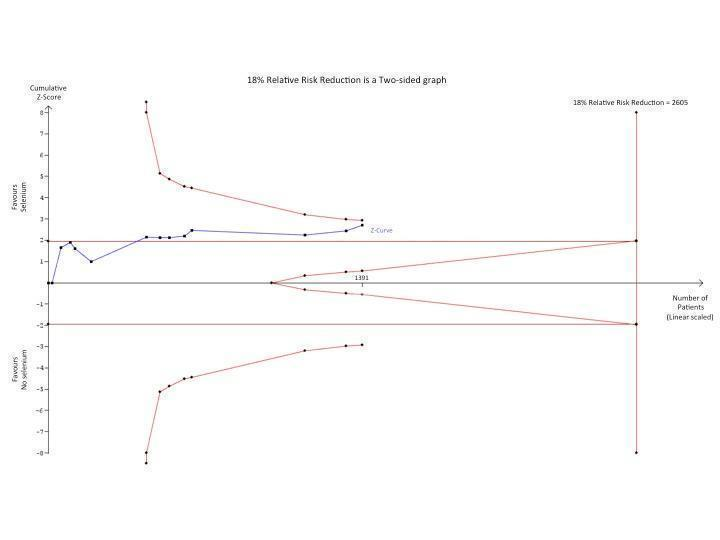
Trial sequential analysis (TSA) of all trials examining the effect of Selenium supplementation on mortality among critically ill. Using a control event proportion of 32% found in the included trials, with a type 1 error of 5% and a 18% relative risk reduction (80% power), the trial sequential monitoring boundary for benefit is not crossed by the z‐curve. However, these lines are very close to crossing each other which may indicate a probability of lack of random error for the conclusion of an effect of 18% relative risk reduction even though the required information size (N = 2605) has not yet been reached. However, caution must be exerted when interpreting the results of this TSA since all included studies are at high risk of bias and the intervention effect is likely to have been overestimated in the traditional meta‐analysis.
Discussion
Summary of main results
In this review update we found no clear evidence that selenium supplementation reduces mortality in critically ill adults despite a statistically significant finding. This is mainly due to the high risk of bias, most likely overestimating the overall intervention effect. Even though we are unable to rule out a beneficial effect, the evidence remains dubious as a result of the poor methodological quality of the trials. For instance, only three trials clearly reported concealment of allocation (Berger 2001; Montoya 2009; SIGNET 2011). Few trials reported on outcomes other than mortality or clearly defined the reported outcomes. Periods of follow‐up were often short and did not allow for the prolonged recovery from critical illness. There was insufficient data to examine the effect of methodological superiority or dose of selenium on the outcomes.
Selenium supplementation in the general ICU population with severe sepsis or septic shock has been investigated by SISPCT, which with a sample size of 1180 and rigorous methodology may help clarifying a potential benefit or harm of selenium. The lead author of SISPCT expects to publish the results within the next year. Additionally, based on data from current published trials it remains at best uncertain as to whether loading bolus or continuous doses are preferred (Manzanares 2011).
There was no clear evidence of benefit from the use of ebselen in patients with stroke or subarachnoid haemorrhage. The results of one large trial, Yamaguchi 2003, are still awaited.
Furthermore, we found no evidence to suggest that these interventions are harmful.
Overall completeness and applicability of evidence
We are confident that we identified all available studies from our search strategy. Several authors have been contacted but have not identified any additional trials for inclusion.
In contrast to Avenell 2004, in this update we revised the primary endpoints, adding overall mortality regardless of the period of follow‐up, and carried out TSA in order to reduce the risk of random error. Yet, the review conclusions remain the same.
The applicability of our results only refers to critically ill adult patients and as such there is insufficient evidence to support the routine use of this intervention.
Quality of the evidence
The RCT is considered the most rigorous method for determining whether a cause‐effect relationship exists between an intervention and outcome. The strength of the RCT lies in the process of randomization.
No trials were reported as at overall low‐risk of bias (Figure 2; Figure 3). Fifteen of the 16 included trials were at high risk of bias regarding random sequence generation (selection bias). Only one trial has published the protocol (SIGNET 2011) and only two trials had been registered in a database (Forceville 2007; SIGNET 2011), which is why we deemed 14 of the 16 included trials at high risk of reporting bias. All trials of ebselen were at high risk of funding bias. Thus, due to the overall high risk of bias in these included trials, the results should be interpreted with caution.
Application of the GRADE approach enables us to incorporate risk of bias, directness of evidence, heterogeneity, precision of effect estimate, and risk of publication bias. Based on the above mentioned criteria, the quality of evidence in this review was very low and there was a high risk of bias
Potential biases in the review process
In this update we remained loyal to the original protocol, Avenell 2002, with only minor changes in order to avoid bias. Two review authors (MA, AA) independently performed data extraction and 'Risk of bias' assessment. We consulted the Managing Editor and Trials Search Coordinator of the Cochrane Anaesthesia, Critical and Emergency Care Group throughout the entire process of the review update.
Despite our prior knowledge to the conclusions of other recently published systematic reviews (Huang 2013; Landucci 2014; Manzanares 2012), we have adhered to Cochrane methodology and applied additional statistical methods, such as TSA, to strengthen our conclusions and reduce the risk of random error.
Agreements and disagreements with other studies or reviews
The overall conclusions of this Cochrane review do not agree with the statements and findings of the most recently published systematic reviews and meta‐analysis (Huang 2013; Landucci 2014; Manzanares 2012). All three meta‐analyses reported a significantly decreased mortality in the selenium group. However, two papers did not address the quality of studies included (Huang 2013; Manzanares 2012). Landucci 2014 reported the quality of evidence of the meta‐analysis as low due to unclear quality of randomization in many studies. These papers did not adhere to PRISMA guidelines.
Study flow diagram for the updated review. (In the original article, Avenell 2004, 10 studies were included and 11 studies were excluded with reasons. Three were awaiting classification, of which one has now been excluded (Kiessling 2006). Two studies are still ongoing).
'Risk of bias' graph: review authors' judgements about each 'Risk of bias' item presented as percentages across all included studies.
'Risk of bias' summary: review authors' judgements about each 'Risk of bias' item for each included study.
Funnel plot of comparison: 1.2 Overall mortality (regardless of the follow‐up period).
Trial sequential analysis (TSA) of all trials examining the effect of Selenium supplementation on mortality among critically ill. Using a control event proportion of 32% found in the included trials, with a type 1 error of 5% and a 18% relative risk reduction (80% power), the trial sequential monitoring boundary for benefit is not crossed by the z‐curve. However, these lines are very close to crossing each other which may indicate a probability of lack of random error for the conclusion of an effect of 18% relative risk reduction even though the required information size (N = 2605) has not yet been reached. However, caution must be exerted when interpreting the results of this TSA since all included studies are at high risk of bias and the intervention effect is likely to have been overestimated in the traditional meta‐analysis.

Comparison 1 Selenium versus no selenium, Outcome 1 Overall mortality (regardless of the period of follow‐up).

Comparison 2 Selenium versus no selenium, Outcome 1 Mortality by duration (Selenium).

Comparison 2 Selenium versus no selenium, Outcome 2 Mortality by duration (Ebselen).

Comparison 2 Selenium versus no selenium, Outcome 3 Mortality: ICU and pancreatitis (Selenium).

Comparison 3 Selenium versus no selenium, Outcome 1 Number of infected participants.

Comparison 4 Selenium versus no selenium, Outcome 1 Number of participants with adverse event.

Comparison 4 Selenium versus no selenium, Outcome 2 Length of stay in ICU (Selenium).

Comparison 4 Selenium versus no selenium, Outcome 3 Number of days on a ventilator (Selenium).

Comparison 4 Selenium versus no selenium, Outcome 4 Length of hospital stay (Selenium).
| Selenium supplementation compared with control for critically ill adults | |||||
| Patient or population: Patients with critical illnesses Settings: ICU setting Intervention: Selenium or ebselen | |||||
| Outcomes | Illustrative comparative risks* (95% CI) | Relative effect | No. of participants | Quality of the evidence | |
| Assumed risk | Corresponding risk | ||||
| Control | Selenium | ||||
| Overall mortality (regardless of the follow‐up period) | All patients are high risk population | RR 0.82, 95% CI 0.72 to 0.93) | 1391 | ⊕⊝⊝⊝ | |
| ICU length of stay (selenium) | The mean length of stay in an ICU ranged across control groups from | The mean length of stay in an ICU ranged across intervention groups from | MD 0.54, 95% CI ‐2.27 to 3.34 | 934 | ⊕⊝⊝⊝ |
| Days on ventilator (selenium) | The mean days on ventilator ranged across control groups from 6 days to 16 days | The mean days on ventilator ranged across intervention groups from | MD ‐0.86, 95% CI ‐4.39 to 2.67 | 191 | ⊕⊝⊝⊝ |
| Length of hospital stay (selenium) | The mean length of hospital stay ranged across control groups from | The mean length of hospital stay ranged across intervention groups from | MD ‐3.33. 95% CI ‐5.22 to ‐1.44 | 693 | ⊕⊝⊝⊝ |
| GRADE Working Group grades of evidence | |||||
| Abbreviations: CI: confidence interval; RR: risk ratio; MD: mean difference; ICU: intensive care unit. | |||||
| Trial | Selenium | Control |
| 22.8 days (20.8) | 26.5 days (22) | |
| 15.1 days (10) | 12.7 days (9) | |
| 7,5 days (3.5) | 9 days (7.1) | |
| 22.3 days (9.6) | 17 days (8.7) | |
| 14 days (11) | 13days (6) | |
| 21.3 days (16.2) | 20.8 days (21.8) | |
| 14.5 days (4.6) | 16.7 days (5.9) | |
| MD 0.54 (95% CI ‐2.27 to 3.34, I² statistic = 72%, random‐effects model) | ||
| All findings given as mean (SD). If the original figures were provided in median (range) or interquartile range, we converted them to mean (SD) (Hozo 2005). | ||
| Trial | Selenium | Control |
| 11 days (5.9) | 16 (12.6) | |
| 6 days (2.9) | 6 days (5.7) | |
| 19.8 days (7.8) | 14.8 days (4.4) | |
| 9.3 days (1.5) | 12 days (1.8) | |
| MD ‐0.86 (95% CI ‐4.39 to 2.67, I² statistic = 89%, random‐effects model) | ||
| All findings given as mean (SD). If the original figures were provided in median (range), we converted them to mean (SD) (Hozo 2005). | ||
| Trial | Selenium | Control |
| 38.5 days (24.4) | 39.5 days (15.7) | |
| 83 days (73.5) | 62.8 days (30.2) | |
| 31.3 days (18) | 32 days (11.6) | |
| 12.5 days (0.6) | 17 days (1.7) | |
| 31.7 days (10.9) | 33.8 days (12.4) | |
| MD ‐3.33 (95% CI ‐5.22 to ‐1.44, I² statistic = 42%, random‐effects model) | ||
| All findings given as mean (SD). If the original figures were provided in median (range) or interquartile range, we converted them to mean (SD) (Hozo 2005). | ||
| Outcome or subgroup title | No. of studies | No. of participants | Statistical method | Effect size |
| 1 Overall mortality (regardless of the period of follow‐up) Show forest plot | 16 | 2084 | Risk Ratio (M‐H, Fixed, 95% CI) | 0.82 [0.72, 0.93] |
| 1.1 Overall mortality (Selenium) | 13 | 1391 | Risk Ratio (M‐H, Fixed, 95% CI) | 0.82 [0.72, 0.93] |
| 1.2 Overall mortality (Ebselen) | 3 | 693 | Risk Ratio (M‐H, Fixed, 95% CI) | 0.83 [0.52, 1.34] |
| Outcome or subgroup title | No. of studies | No. of participants | Statistical method | Effect size |
| 1 Mortality by duration (Selenium) Show forest plot | 11 | Risk Ratio (M‐H, Random, 95% CI) | Subtotals only | |
| 1.1 Selenium 28 day | 9 | 1180 | Risk Ratio (M‐H, Random, 95% CI) | 0.84 [0.69, 1.02] |
| 1.2 Selenium 90 day | 3 | 614 | Risk Ratio (M‐H, Random, 95% CI) | 0.96 [0.78, 1.18] |
| 2 Mortality by duration (Ebselen) Show forest plot | 3 | Risk Ratio (M‐H, Random, 95% CI) | Subtotals only | |
| 2.1 Ebselen 30 day | 1 | 105 | Risk Ratio (M‐H, Random, 95% CI) | 1.78 [0.53, 5.95] |
| 2.2 Ebselen 3 month | 2 | 588 | Risk Ratio (M‐H, Random, 95% CI) | 0.72 [0.42, 1.22] |
| 3 Mortality: ICU and pancreatitis (Selenium) Show forest plot | 11 | 1255 | Risk Ratio (M‐H, Random, 95% CI) | 0.87 [0.74, 1.02] |
| 3.1 General intensive care patients | 9 | 1168 | Risk Ratio (M‐H, Random, 95% CI) | 0.88 [0.77, 1.01] |
| 3.2 Acute pancreatitis | 2 | 87 | Risk Ratio (M‐H, Random, 95% CI) | 0.40 [0.01, 12.30] |
| Outcome or subgroup title | No. of studies | No. of participants | Statistical method | Effect size |
| 1 Number of infected participants Show forest plot | 9 | Risk Ratio (M‐H, Random, 95% CI) | Subtotals only | |
| 1.1 Selenium | 6 | 934 | Risk Ratio (M‐H, Random, 95% CI) | 0.96 [0.75, 1.23] |
| 1.2 Ebselen | 3 | 685 | Risk Ratio (M‐H, Random, 95% CI) | 0.60 [0.36, 1.02] |
| Outcome or subgroup title | No. of studies | No. of participants | Statistical method | Effect size |
| 1 Number of participants with adverse event Show forest plot | 8 | Risk Ratio (M‐H, Random, 95% CI) | Subtotals only | |
| 1.1 Selenium | 6 | 925 | Risk Ratio (M‐H, Random, 95% CI) | 1.03 [0.85, 1.24] |
| 1.2 Ebselen | 2 | 588 | Risk Ratio (M‐H, Random, 95% CI) | 1.16 [0.40, 3.36] |
| 2 Length of stay in ICU (Selenium) Show forest plot | 7 | 934 | Mean Difference (IV, Random, 95% CI) | 0.54 [‐2.27, 3.34] |
| 3 Number of days on a ventilator (Selenium) Show forest plot | 4 | 191 | Mean Difference (IV, Random, 95% CI) | ‐0.86 [‐4.39, 2.67] |
| 4 Length of hospital stay (Selenium) Show forest plot | 5 | 693 | Mean Difference (IV, Random, 95% CI) | ‐3.33 [‐5.22, ‐1.44] |