Abordajes quirúrgicos de la histerectomía para las enfermedades ginecológicas benignas
Resumen
Antecedentes
Los cuatro abordajes para la histerectomía en las enfermedades benignas son histerectomía abdominal (HA), histerectomía vaginal (HV), histerectomía laparoscópica (HL) e histerectomía robotizada (HR).
Objetivos
Evaluar la efectividad y la seguridad de diferentes abordajes quirúrgicos para la histerectomía en pacientes con enfermedades ginecológicas benignas.
Métodos de búsqueda
Se hicieron búsquedas en las siguientes bases de datos (desde su inicio hasta el 14 agosto 2014), utilizando la plataforma Ovid: Registro Cochrane Central de Ensayos Controlados (Cochrane Central Register of Controlled Trials, CENTRAL); MEDLINE; EMBASE; Cumulative Index to Nursing and Allied Health Literature (CINAHL) y PsycINFO. También se buscó en las listas de referencias relevantes. Se utilizaron términos indizados y de texto libre.
Criterios de selección
Se incluyeron los ensayos controlados aleatorios (ECA) que compararon los resultados clínicos entre un abordaje quirúrgico para la histerectomía y otro.
Obtención y análisis de los datos
Al menos dos autores de la revisión seleccionaron de forma independiente los ensayos, evaluaron el riesgo de sesgo y realizaron la extracción de datos. Los resultados primarios fueron retorno a las actividades normales, satisfacción, calidad de vida, lesión visceral intraoperatoria y complicaciones importantes a largo plazo (es decir, fístula, dolor pélvico‐abdominal, disfunción urinaria, disfunción intestinal, afección del suelo pelviano y disfunción sexual).
Resultados principales
Se incluyeron 47 estudios con 5102 mujeres. Las pruebas para la mayoría de las comparaciones fueron de calidad baja o moderada. Las limitaciones principales fueron el informe deficiente y la falta de precisión.
Histerectomía vaginal (HV) versus histerectomía abdominal (HA) (nueve ECA, 762 mujeres)
El retorno a las actividades normales fue más corto en el grupo HV (diferencia de medias [DM] ‐9,5 días; intervalo de confianza [IC] del 95%: ‐12,6 a ‐6,4; tres ECA, 176 pacientes, I2 = 75%, pruebas de calidad moderada). No hubo pruebas de una diferencia entre los grupos en los otros resultados primarios.
Histerectomía laparoscópica (HL) versus HA) (25 ECA, 2983 mujeres)
El retorno a las actividades normales fue más corto en el grupo de HL (DM ‐13,6 días; IC del 95%: ‐15,4 a ‐11,8; seis ECA, 520 pacientes, I2 = 71%, pruebas de calidad baja), pero hubo más lesiones urinarias en el grupo de HL (odds ratio [OR] 2,4; IC del 95%: 1,2 a 4,8; 13 ECA, 2140 pacientes, I2 = 0%, pruebas de baja calidad). No hubo pruebas de una diferencia entre los grupos en los otros resultados primarios.
HL versus HV (16 ECA, 1440 mujeres)
No hubo pruebas de una diferencia entre los grupos en cualquier resultado primario.
Histerectomía robotizada (HR) versus HL (dos ECA, 152 mujeres)
No hubo pruebas de una diferencia entre los grupos en cualquier resultado primario. Ninguno de los estudios informó las tasas de satisfacción ni de calidad de vida.
En general, el número de eventos adversos fue bajo en los estudios incluidos.
Conclusiones de los autores
Entre las pacientes a las que se les realizó histerectomía para las enfermedades benignas, la HV parece ser superior a la HL y la HA, ya que se asocia con un retorno más rápido a las actividades normales. Cuando sea técnicamente factible, se debe realizar la HV de preferencia a la HA debido a su recuperación más rápida y a la aparición de menos episodios febriles posoperatorios. Cuando no sea posible realizar la HV, la HL tiene algunas ventajas sobre la HA (que incluyen una recuperación más rápida y menos episodios febriles e infecciones de la herida o de la pared abdominal), pero estas se compensan con un tiempo quirúrgico más prolongado. No fue posible hallar ventajas de la HL sobre la HV; La HL tiene un tiempo quirúrgico más prolongado y la histerectomía total laparoscópica (HTL) provoca más lesiones urinarias. De las tres subcategorías de HL, hay más datos de ECA para la histerectomía vaginal asistida por laparoscopia y la HL que para la HTL. La histerectomía laparoscópica de incisión de acceso única y la HR se deben dejar de realizar o se deben evaluar de forma adicional ya que existe una falta de pruebas de cualquier efecto beneficioso sobre la HL convencional. En general, las pruebas de esta revisión se tienen que interpretar con cuidado ya que las tasas de eventos adversos fueron bajas debido al bajo poder estadístico de estas comparaciones. El abordaje quirúrgico para la histerectomía se debe analizar y decidir según los efectos beneficios y los riesgos relativos. Estos efectos beneficiosos y riesgos parecen depender de la pericia quirúrgica y pueden influir en la decisión. En conclusión, cuando la HV no es factible, la HL puede evitar la necesidad de HA, pero la HL se asocia con más lesiones urinarias. No existen pruebas de que la HR tenga efectos beneficiosos en esta población. Preferentemente, el abordaje quirúrgico para la histerectomía se debe decidir por la paciente en conjunto con su cirujano.
PICO
Resumen en términos sencillos
Abordaje quirúrgico de la histerectomía para las enfermedades ginecológicas benignas
Pregunta de la revisión
Los autores Cochrane evaluaron cuál es la cirugía más eficaz y segura para la histerectomía en las pacientes con enfermedad ginecológica benigna.
Antecedentes
La histerectomía para las enfermedades ginecológicas benignas, fundamentalmente hemorragia uterina anormal, prolapso o fibromas uterinos, es uno de los procedimientos ginecológicos más frecuentes (30% de las mujeres con 60 años de edad; 590 000 procedimientos anualmente en los EE.UU.). Se puede realizar mediante varios abordajes. La histerectomía abdominal implica la extracción del útero mediante una incisión en el abdomen inferior. La histerectomía vaginal implica la extracción del útero por la vagina, sin incisión abdominal. La histerectomía laparoscópica comprende una "cirugía no invasiva" con incisiones abdominales pequeñas. El útero se puede extraer por vía vaginal, o después de la morcelación (cortar en partes), a través de una de las incisiones pequeñas. Hay diversos tipos de histerectomía laparoscópica, según la extensión de la cirugía realizada por laparoscopia en comparación con la realizada por vía vaginal. Más recientemente, la histerectomía laparoscópica se ha realizado mediante robot. En la cirugía robótica, la operación es realizada por un autómata, mientras el cirujano (humano) guía al autómata desde una silla en un extremo del quirófano. Es importante informarse bien acerca de los efectos beneficiosos y perjudiciales relativos de cada abordaje para elegir las alternativas mejor fundamentadas para cada paciente que necesita histerectomía para una enfermedad benigna.
Características de los estudios
Se analizaron 47 ensayos controlados aleatorios (ECA). Un ECA es un tipo de estudio en el que los pacientes estudiados se asignan al azar a uno u otro de los diferentes tratamientos que se investigan. Este tipo de estudio generalmente es la mejor manera de evaluar si un tratamiento es realmente efectivo, es decir, si realmente ayuda al paciente. Una revisión sistemática resume de forma metódica los ECA disponibles sobre un tema.
Participó un total de 5102 mujeres. Las comparaciones fueron histerectomía vaginal versus abdominal (nueve ensayos, 762 pacientes), histerectomía laparoscópica versus abdominal (25 ensayos, 2983 pacientes), histerectomía laparoscópica versus vaginal (16 ensayos, 1440 pacientes) e histerectomía laparoscópica versus robotizada (dos ensayos, 152 pacientes); además hubo estudios en los que se realizaron tres comparaciones (cuatro ensayos, 410 mujeres). También algunos de los estudios incluidos compararon diferentes tipos de histerectomías laparoscópicas, incluida con incisión de acceso única versus múltiples incisiones de acceso (tres ensayos, 203 pacientes), histerectomía total laparoscópica versus histerectomía vaginal asistida por laparoscopia (un ensayo, 101 pacientes) e histerectomía minilaparoscópica versus laparoscópica convencional (un ensayo, 76 pacientes). Los resultados principales fueron retorno a las actividades normales, satisfacción, calidad de vida y complicaciones quirúrgicas.
Resultados clave
Se encontró que la histerectomía vaginal dio lugar a un retorno más rápido a las actividades normales que la histerectomía abdominal. No hubo pruebas de una diferencia entre ellas en otros resultados importantes.
La histerectomía laparoscópica también dio lugar a un retorno más rápido a las actividades normales que la histerectomía abdominal. Sin embargo, las histerectomías laparoscópicas tuvieron un mayor riesgo de daño a la vejiga o al uréter. No hubo pruebas de una diferencia entre la histerectomía laparoscópica y vaginal o entre la histerectomía laparoscópica y la robotizada en los resultados principales.
Se concluye que la histerectomía vaginal se debe realizar siempre que sea posible. Cuando la histerectomía vaginal no es posible, el abordaje laparoscópico y la histerectomía abdominal tienen pros y contras que se deben considerar en el proceso de toma de decisiones.
Las pruebas están actualizadas hasta agosto de 2014.
Calidad de la evidencia
Las pruebas para la mayoría de las comparaciones fueron de calidad baja o moderada. Las limitaciones principales fueron el informe deficiente de los métodos de estudio y los amplios intervalos de confianza respecto a la estimación del efecto.
Conclusiones de los autores
Summary of findings
| Vaginal hysterectomy versus abdominal hysterectomy for benign gynaecological disease | ||||||
| Patient or population: patients with benign gynaecological disease | ||||||
| Outcomes | Illustrative comparative risks* (95% CI) | Relative effect | No of participants | Quality of the evidence | Comments | |
| Assumed risk | Corresponding risk | |||||
| Abdominal hysterectomy | Vaginal hysterectomy | |||||
| Return to normal activities (days) | The mean return to normal activities (days) in the AH group was | The mean return to normal activities (days) in the VH group was | — | 176 | ⊕⊕⊕⊝ | — |
| Urinary tract (bladder or ureter) injury | 0 per 1000 | 0 per 1000 | OR 3.09 | 439 | ⊕⊕⊕⊝ | There were no urinary tract injuries in one study |
| *The basis for the assumed risk is the median control group risk across studies. The corresponding risk (and its 95% confidence interval) is based on the assumed risk in the comparison group and the relative effect of the intervention (and its 95% CI). | ||||||
| GRADE Working Group grades of evidence | ||||||
| 1There was a large difference in return to normal activities between the different studies; the analysis had high heterogeneity (I2 = 75%) but consistent direction of effect. | ||||||
| Laparoscopic hysterectomy versus abdominal hysterectomy for benign gynaecological disease | ||||||
| Patient or population: patients with benign gynaecological disease | ||||||
| Outcomes | Illustrative comparative risks* (95% CI) | Relative effect | No of participants | Quality of the evidence | Comments | |
| Assumed risk | Corresponding risk | |||||
| Abdominal hysterectomy | Laparoscopic hysterectomy | |||||
| Return to normal activities (days) | The mean return to normal activities (days) in the AH group was | The mean return to normal activities (days) in the LH group was | — | 520 | ⊕⊕⊝⊝ | — |
| Urinary tract (bladder or ureter) injury | 10 per 1000 | 24 per 1000 | OR 2.44 | 2140 | ⊕⊕⊝⊝ | — |
| Bowel injury | 7 per 1000 | 1 per 1000 | OR 0.21 | 1175 | ⊕⊕⊕⊝ | — |
| Vascular injury | 9 per 1000 | 16 per 1000 | OR 1.76 | 956 | ⊕⊕⊕⊝ | — |
| Bleeding | 16 per 1000 | 6 per 1000 | OR 0.45 | 1266 | ⊕⊕⊝⊝ | — |
| *The basis for the assumed risk is the median control group risk across studies. The corresponding risk (and its 95% confidence interval) is based on the assumed risk in the comparison group and the relative effect of the intervention (and its 95% CI). | ||||||
| GRADE Working Group grades of evidence | ||||||
| 1In some studies there was doubt about the method used for random sequence generation or allocation of patients. Furthermore, one study did not perform an intention‐to‐treat analysis. | ||||||
| Laparoscopic hysterectomy versus vaginal hysterectomy for benign gynaecological disease | ||||||
| Patient or population: patients with benign gynaecological disease | ||||||
| Outcomes | Illustrative comparative risks* (95% CI) | Relative effect | No of participants | Quality of the evidence | Comments | |
| Assumed risk | Corresponding risk | |||||
| Vaginal hysterectomy | Laparoscopic hysterectomy | |||||
| Return to normal activities (days) | The mean return to normal activities (days) in the VH group was | The mean return to normal activities (days) in the LH group was | — | 140 | ⊕⊕⊕⊝ | — |
| Urinary tract (bladder or ureter) injury | 16 per 1000 | 16 per 1000 | OR 1.0 | 865 | ⊕⊕⊝⊝ | — |
| Vascular injury | 12 per 1000 | 18 per 1000 | OR 1.58 | 745 | ⊕⊕⊝⊝ | — |
| Bleeding | 29 per 1000 | 25 per 1000 | OR 2.45 | 644 | ⊕⊕⊝⊝ | — |
| Unintended laparotomy | 24 per 1000 | 37 per 1000 | OR 1.55 | 1160 | ⊕⊕⊝⊝ | — |
| *The basis for the assumed risk is the median control group risk across studies. The corresponding risk (and its 95% confidence interval) is based on the assumed risk in the comparison group and the relative effect of the intervention (and its 95% CI). | ||||||
| GRADE Working Group grades of evidence | ||||||
| 1Wide confidence intervals crossing the line of no effect. | ||||||
Antecedentes
Descripción de la afección
La histerectomía es la extracción quirúrgica del útero. Es el procedimiento quirúrgico ginecológico mayor realizado con más frecuencia, con millones de procedimientos realizados anualmente en todo el mundo (Garry 2005). La histerectomía se puede realizar para indicaciones benignas y malignas. Aproximadamente el 90% de las histerectomías se realizan para condiciones benignas, como fibromas que causan hemorragia uterina anormal (Flory 2005). Otras indicaciones incluyen endometriosis / adenomiosis, dismenorrea, dispareunia y prolapso.
La hemorragia menstrual anormal afecta a mujeres de todas las edades y es el motivo ginecológico más frecuente de derivación a la atención secundaria (Spencer 1999). Existen diversas causas posibles de hemorragia menstrual anormal o menorragia; estas causas incluyen los ya mencionados fibromas, los pólipos endometriales con hiperplasia, adenomiosis, enfermedades infecciosas, complicaciones del embarazo (temprano) o afecciones (pre)malignas del endometrio. Sin embargo, en una gran parte de las pacientes no se confirmará el diagnóstico definitivo. Existen varios tratamientos más o menos invasivos para la menorragia; los anticonceptivos orales o el sistema intrauterino que libera levonorgestrel (SIU‐LNG) se ofrecen con frecuencia como tratamiento de primera línea cuando se descartan anomalías uterinas. Una revisión reciente mostró que el SIU‐LNG es el tratamiento médico de primera línea para la menorragia y que los anticonceptivos hormonales combinados son la segunda opción (Lethaby 2015). Durante la última década se han desarrollado varias técnicas nuevas para la ablación endometrial. La efectividad de estas técnicas se ha descrito en otra revisión Cochrane(Lethaby 2013). Como resultado de esta variedad de opciones de tratamiento, la paciente con menorragia dispone de una gran variedad de posibles intervenciones médicas y quirúrgicas. Como la histerectomía es el único tratamiento que proporciona alivio permanente de los síntomas, una gran proporción de las pacientes con las afecciones antes mencionadas con el tiempo decidirá la extracción del útero. Lo anterior se demuestra por el hecho de que las tasas de histerectomía han descendido menos de lo esperado con la introducción de las nuevas formas de tratamiento (Pynnä 2014).
Descripción de la intervención
Los abordajes para la histerectomía se pueden categorizar ampliamente en cuatro opciones: histerectomía abdominal (HA); histerectomía vaginal (HV); histerectomía laparoscópica (HL) cuando al menos parte de la cirugía se realiza por laparoscopia (Garry 1994),e histerectomía robotizada (HR).
-
: Tradicionalmente, el abordaje abdominal (HA) ha sido el abordaje quirúrgico para la neoplasia ginecológica cuando existe otra patología pelviana, como endometriosis o adherencias, y en el contexto de un útero agrandado. Sigue siendo la alternativa ("fallback option") si el útero no se puede extraer mediante otro abordaje. La mini‐HA refiere a un abordaje para la histerectomía donde la incisión abdominal no excede los 7 cm (Sesti 2008a).
-
: La HV se utilizó originalmente solo para el prolapso, aunque posteriormente comenzó a utilizarse de manera más amplia para las anomalías menstruales como el sangrado uterino disfuncional, cuando el útero tiene un tamaño bastante normal. Comparada con la HA, la HV fue (y todavía es) considerada menos invasiva y parece tener las ventajas de menos transfusiones de sangre, menos morbilidad febril (fiebre) y menos riesgo de lesión ureteral. Sin embargo, las desventajas son más complicaciones hemorrágicas y mayor riesgo de lesión vesical (Mäkinen 2013; Moen 2014a).
-
: Generalmente, el término HL se refiere a una histerectomía en que al menos parte de la cirugía se realiza por laparoscopia(Garry 1994). Este abordaje requiere pericia quirúrgica laparoscópica general. La proporción de histerectomías realizadas por HL ha aumentado de manera gradual y, aunque la cirugía tiende a durar más, sus partidarios sostienen que las ventajas principales son la posibilidad de diagnosticar y tratar otras enfermedades pelvianas como la endometriosis, de realizar la cirugía anexial que incluye la extracción de los ovarios, la capacidad de asegurar una hemostasia intraperitoneal adecuada (la visión laparoscópica directa permite el cierre cuidadoso de los vasos sanguíneos al final del procedimiento) y una recuperación más rápida de la cirugía en comparación con la HA (Garry 1998). Se describieron tres subclasificaciones de la HL(Reich 2003), de la siguiente manera:
-
-
Histerectomía vaginal asistida por laparoscopia (HVAL): cuando parte de la histerectomía se realiza mediante cirugía laparoscópica y parte por vía vaginal, pero el componente laparoscópico de la operación no incluye división de los vasos uterinos.
-
Histerectomía laparoscópica (abreviada HL[a]): cuando los vasos uterinos son ligados por laparoscopia pero parte de la operación se realiza por vía vaginal.
-
Histerectomía total laparoscópica (HTL): cuando toda la operación (incluida la sutura de la bóveda vaginal) se realiza mediante laparoscopia y no hay componentes vaginales, excepto la extracción del útero. La HTL requiere el grado más alto de habilidad quirúrgica laparoscópica.
-
-
: En la última década, la histerectomía laparoscópica de incisión de acceso única (HL‐IAU) y la histerectomía minilaparoscópica (mini‐HL, cuando las incisiones no exceden los 3 mm, Ghezzi 2011) se han introducido en el campo endoscópico.
-
: La HR se realiza desde 1998. En esta revisión la HR se considera un abordaje aparte, que puede tener su propia curva de aprendizaje, escollos quirúrgicos y costos acompañantes.
Una histerectomía total es la extracción de todo el útero incluido el cuello uterino. La no extracción del cuello uterino se denomina histerectomía subtotal o supracervical. Las histerectomías subtotales se realizan más fácilmente por vía abdominal o laparoscópica, aunque es posible conservar el cuello uterino en una HV o HVAL.(Lethaby 2012).
La primera histerectomía electiva informada se realizó mediante un abordaje vaginal por Conrad Langenbeck en 1813. Charles Clay en Manchester en 1863 realizó la primera histerectomía abdominal electiva, una operación subtotal (en la que se conservó el cuello uterino) (Sutton 1997). Estos abordajes permanecieron como las únicas dos opciones hasta fines del siglo XX. Harry Reich realizó en 1989 la primera histerectomía laparoscópica (HVAL) (Reich 1989). También informó sobre la primera histerectomía total laparoscópica (HTL) en 1993. Las histerectomías robotizadas se han realizado desde 1998.
Varios factores relacionados con la paciente pueden influir en la elección del cirujano del abordaje para la histerectomía. Por ejemplo, las pacientes multíparas con menorragia que optan por histerectomía pueden ser apropiadas para un abordaje vaginal. Sin embargo, en el mismo caso pero con la sospecha de endometriosis basada en dismenorrea, dispareunia o ambas, es más probable que el cirujano sea propenso a un abordaje abdominal o laparoscópico. Con respecto al útero fibromatoso aumentado de tamaño, la experiencia y las habilidades del cirujano determinarán en gran medida el abordaje quirúrgico para la histerectomía.
Al igual que la tasa general de histerectomía, la proporción de histerectomías realizadas en la actualidad por diferentes abordajes varía notablemente entre los países, dentro del mismo país e incluso entre los cirujanos individuales que trabajan dentro de la misma unidad. Como se indicó anteriormente, cada ginecólogo tendrá sus propias indicaciones para la elección del abordaje para la histerectomía en las enfermedades benignas, que se basarán en gran parte en su propio rango de habilidades quirúrgicas y en las características de la paciente como el tamaño y el descenso uterino, la patología pelviana extrauterina, cirugías pelvianas anteriores y otras características como obesidad, nuliparidad y necesidad de ovariectomía. A pesar de que la HV se considera ampliamente como la intervención preferida para la hemorragia uterina disfuncional, el estudio VALUE reveló que en el Reino Unido en 1995, el 67% de las histerectomías realizadas por esta indicación fueron HA (Maresh 2002). A menudo, la cesárea anterior se considera, por ejemplo, una contraindicación para la HV. Sin embargo, lo anterior no está apoyado por los datos acumulados de cuatro estudios que no indican diferencias significativas en las tasas de complicación en las pacientes con histerectomía después de cesárea (ocho de 430 [1,86%] versus 11 de 1227 [0,89%], valor de p = 0,12) (Agostini 2005).
Mäkinen 2001 informó un estudio prospectivo sobre la curva de aprendizaje en 10 110 histerectomías por indicaciones benignas, de las cuales 5875 fueron HA; 1801 HV; y 2434 HL. En cuanto a las lesiones de órganos adyacentes, la experiencia de los cirujanos se correlacionó inversamente de manera significativa con la aparición de lesiones urinarias en la HL y la aparición de lesiones intestinales en la histerectomía vaginal. En un estudio posterior las tasas generales de complicación descendieron significativamente con la HL y notablemente con la HV en el transcurso de diez años (Mäkinen 2013). Se ha demostrado que alentar la cirugía vaginal entre los ginecólogos es un método efectivo para aumentar las tasas de HV (Mäkinen 2013; Moen 2014a). Finlandia tenía una tasa de HV tan baja como del 7% en los años ochenta. Después de reuniones anuales sobre cirugía ginecológica, donde se alentó a la realización de cirugías vaginales y laparoscópicas, y se proporcionó entrenamiento individual, la tasa de HV aumentó al 44% en 2006 (Mäkinen 2013). En el mismo período disminuyeron las lesiones ureterales, lo que representa una curva de aprendizaje nacional notable. Además, la tasa de HL aumentó (del 24% al 36%) y se redujeron las tasas de complicaciones (Mäkin‐en 2013).
De qué manera podría funcionar la intervención
Esta revisión se centrará en los efectos beneficiosos y perjudiciales de los diferentes abordajes quirúrgicos para la histerectomía en las indicaciones benignas. Desde la perspectiva de la paciente, la calidad de vida bien puede ser el resultado más importante, especialmente en la cirugía por indicaciones benignas. En consecuencia, se eligen las medidas de resultado informadas por la paciente (MRIP) como los resultados primarios. Las lesiones a los órganos adyacentes en la histerectomía son preocupantes y sus tasas de aparición difieren con los diversos abordajes de la histerectomía y el nivel de experiencia quirúrgica (Brummer 2011; Mäkinen 2001; Mäkinen 2013). Es importante tener un conocimiento adecuado de las diferencias en los resultados adversos de los diversos abordajes para la histerectomía para informar a las pacientes de forma adecuada y conseguir el consentimiento informado basado en una cantidad adecuada de datos. Además, los tiempos quirúrgicos difieren con los diferentes abordajes de la histerectomía. Los tiempos quirúrgicos más prolongados son incluso más probables con la HR. En general se asume que el abordaje vaginal y laparoscópico darán lugar a una recuperación más rápida en comparación con la cirugía abierta, principalmente debido a menos dolor y una movilización más rápida debido a incisiones más pequeñas.
En la era actual de recursos sanitarios limitados, es probable que los costos de la cirugía desempeñen una función más importante en la toma de decisiones. Varios estudios han analizado el tema de la relación entre costo y efectividad de varios tipos de histerectomía(Bijen 2009; Pynnä 2014; Sarlos 2010; Tapper 2014). En general, se espera que la HV tendrá los costos más bajos, seguida de la HA y la HL. Debido a los elevados costos de adquisición y a la utilización de materiales desechables costosos, es probable que la HR sea la menos efectiva en función de los costos. Sin embargo, se carece de estudios bien diseñados que también consideren los costos sociales (p.ej. los costos de licencia por enfermedad).
Además del abordaje quirúrgico de la histerectomía, otros aspectos de la técnica quirúrgica pueden tener un efecto sobre el resultado de la cirugía. Los ejemplos de esto incluyen histerectomía total versus subtotal (donde no se elimina el cuello uterino); (Lethaby 2012); HV o HVAL de Doderlein versus HV o HVAL estándar; técnicas para apoyar la bóveda vaginal; ovaricectomía electiva bilateral versus conservación ovárica (Orozco 2014); y otras estrategias, utilizadas principalmente por aquellos que realizan la cirugía laparoscópica para reducir la probabilidad de complicaciones, incluido el uso de delineadores vaginales, sondas rectales y cánulas ureterales iluminadas. Estos otros aspectos no están dentro del alcance de esta revisión (excepto para evaluar la calidad del ensayo).
Por qué es importante realizar esta revisión
Debido a que hay múltiples abordajes para la histerectomía, cada uno con sus ventajas y desventajas específicas del procedimiento, es importante saber qué procedimiento es superior con respecto a los resultados relacionados con la paciente. En general, los ensayos controlados aleatorios (ECA) proporcionan la calidad más alta de las pruebas. Cuando la calidad de los ECA de intervenciones quirúrgicas es suficientemente buena, se obtiene información de calidad incomparable con respecto a la obtenida de estudios con otros diseños que evalúan intervenciones quirúrgicas. Fue interesante observar que en 1998 no había ECA que compararan la HA y la HV (Garry 1998). La introducción de los abordajes más nuevos para la histerectomía (HL, HL‐IAU e HR) ha estimulado un interés mucho mayor en la evaluación científica de todas las formas de histerectomía. Sin embargo, existen más abordajes, y lo complicado es decidir el mejor abordaje para cada paciente individual. Esta decisión no se puede tomar sin pruebas actualizadas. Tampoco se puede tomar sin conocer y respetar las preferencias informadas de las pacientes. Esta revisión resume las pruebas existentes presentadas en todos los ECA publicados sobre la histerectomía para las afecciones benignas. Después de encontrar y evaluar las pruebas existentes y combinar sus deducciones con la pericia clínica, los médicos necesitan tomar una decisión que refleje los valores y las circunstancias de la paciente (Hoffmann 2014). Ésta es una actualización de una revisión Cochrane publicada por primera vez en 2004 y actualizada previamente en 2006, 2008 y 2009.
Objetivos
Evaluar la efectividad y la seguridad de diferentes abordajes quirúrgicos para la histerectomía en pacientes con enfermedades ginecológicas benignas.
Métodos
Criterios de inclusión de estudios para esta revisión
Tipos de estudios
Se incluyeron los ensayos controlados aleatorios (ECA) que compararon un abordaje quirúrgico para la histerectomía con otro abordaje.
Se excluyeron los estudios no aleatorios, ya que se asocian con un riesgo mayor de sesgo.
Tipos de participantes
Fueron elegibles para inclusión los estudios en pacientes que recibieron histerectomía por enfermedad benigna (fibromas uterinos, menorragia, metrorragia por [sospecha de] adenomiosis). Se excluyeron los estudios de las mujeres con cáncer ginecológico. Cuando los ensayos incluyeron pacientes con enfermedades benignas y malignas, se les solicitó a los autores que dividieran los datos para incluir solamente a las pacientes con enfermedades benignas. De no estar disponible esta información se excluyó el ensayo.
Los abandonos se definieron como los casos en los que se canceló la histerectomía después de la asignación al azar o cuando los investigadores excluyeron del análisis los casos asignados al azar. Las pérdidas durante el seguimiento no se consideraron abandonos.
Tipos de intervenciones
Fueron elegibles para inclusión los abordajes quirúrgicos para la extracción del útero cuando al menos un abordaje se comparó con otro. Los abordajes fueron los siguientes:
-
Histerectomía abdominal (HA, que incluye la mini‐HA): La HA incluye la extracción del útero mediante una incisión en el abdomen inferior.
-
Histerectomía vaginal (HV): La histerectomía vaginal incluye la extracción del útero por la vagina, sin incisión abdominal.
-
Histerectomía laparoscópica (HL, que incluye la mini‐HL y la HL‐IAU [de incisión de acceso única]): La HL incluye el uso de la laparoscopia para realizar la histerectomía. Se realizó una distinción entre las subcategorías de HL basada en si la ligadura de los vasos uterinos se realizó por laparoscopia y si la sutura de la bóveda vaginal se realizó por vía vaginal (ver Tabla 1), que se explica de forma más amplia en la sección "Antecedentes". Por lo tanto, la HL se subdividió de forma adicional en el análisis en HVAL, HL(a), HTL e HL no categorizable (cuando no hay información suficiente o los tipos de HL fueron demasiado heterogéneos para subcategorizarlos de otra manera). Hay otras dos clasificaciones principales de HL disponibles en la bibliografía (Nezhat 1995; Richardson 1995) y se resumen en la Tabla 2 y la Tabla 3, pero no se utilizaron en el metanálisis. La HL‐IAU se definió como la HL de incisión de acceso única. La mini‐HL incluye el abordaje para HL por incisiones de acceso que no exceden los 3 mm.
-
Histerectomía robotizada (RH): la HR incluye un abordaje para la histerectomía mediante un sistema automatizado que permite movimientos más ergonómicos que son más fáciles de realizar y son más precisos para filtrar el temblor. El cirujano se sienta en una consola automatizada y manipula el laparoscopio y de dos a tres instrumentos laparoscópicos. La HR generalmente se realiza de una manera similar a la HTL y la sutura de la bóveda vaginal se realiza mediante el autómata.
Por lo tanto, se excluyeron los ensayos que compararon, por ejemplo, diferentes técnicas de cierre de los vasos dentro de un abordaje.
La comparación histerectomía subtotal versus total pertenece al alcance de otra revisión Cochrane (Lethaby 2012); en la presente revisión se excluyeron los ensayos que hicieron esta comparación. También se excluyeron los ensayos que evaluaron diferentes abordajes quirúrgicos para la histerectomía subtotal. Sin embargo, el ensayo se incluyó si a una minoría de las pacientes (menos del 33%) se les había realizado una histerectomía subtotal y se comparó versus cualquiera de los tres abordajes esbozados anteriormente.
Los estudios incluidos tenían que informar datos clínicos, por lo que se excluyeron los estudios que informaron solamente las diferencias en los resultados de laboratorio. Si no se informaron resultados clínicos relevantes (es decir, no se informaron en las secciones "Métodos" y "Resultados"), éste fue un criterio de exclusión.
Tipos de medida de resultado
Se evaluaron los siguientes resultados:
Resultados primarios
-
Retorno a las actividades normales
-
Satisfacción y calidad de vida
-
Lesión visceral intraoperatoria
-
Lesión vesical
-
Lesión ureteral
-
Lesión urinaria (vejiga o uréter)
-
Lesión intestinal
-
Lesión vascular
-
-
Complicaciones graves a largo plazo
-
Fístula
-
Dolor pélvico‐abdominal
-
Trastorno urinario
-
Disfunción intestinal
-
Afección del suelo pelviano [prolapso])
-
Disfunción sexual
-
Resultados secundarios
-
Tiempo quirúrgico
-
Otra complicación intraoperatoria
-
-
(Secuelas de) la hemorragia, que incluye
-
Hemorragia significativa
-
Transfusión
-
Hematoma pélvico
-
-
Laparotomía no programada para abordajes que no incluyen la laparotomía de rutina
-
-
Medidas de resultado y complicaciones a corto plazo
-
Duración de la estancia hospitalaria
-
Infecciones
-
Manguito vaginal
-
Herida o pared abdominal
-
Infecciones del tracto urinario
-
Infección respiratoria
-
Episodios febriles o infecciones no especificadas
-
-
Tromboembolismo
-
-
-
Íleo postoperatorio
-
Dehiscencia de la herida
-
-
Costes
Se buscaron datos sobre el costo del tratamiento pero con el objetivo de describir estos datos cualitativamente y no incluirlos en el metanálisis, ya que el "costo" podría definirse de modo diferente en los distintos estudios en función de si incorporaban el costo de las secuelas. Los diferentes sistemas de asistencia sanitaria podrían producir resultados significativamente diferentes.
Se utilizaron todos los tipos de medidas de resultado para el metanálisis o se describieron en la revisión. Lo anterior incluyó medidas de resultado compuestas.
Results
Description of studies
Results of the search
In our initial search, we identified 4946 articles. Of these, 85 articles were potentially eligible and we retrieved them in full text. We identified nine of these as published abstracts from conference proceedings. The data from two abstracts were published in RCTs included in this review (Cucinella 2000; Hahlin 1994), and we included two studies after additional information was received from the authors (Darai 2001; Miskry 2003). We excluded two studies because they proved not to be randomised studies (Møller 2001; Park 2003). For three studies no inclusion or exclusion decision could be made because insufficient information was available (and there was no response to our request for additional information on study design) (Davies 1998; Pabuccu 1996; Petrucco 1999).
We included 47 studies that met our inclusion criteria. We excluded 36 further studies from the review for reasons that are listed in the Characteristics of excluded studies table. We identified no additional studies through searching reference lists. See the study tables: Characteristics of included studies; Characteristics of excluded studies; Characteristics of studies awaiting classification and the PRISMA flow chart (Figure 1).
Where Olsson 1996 is mentioned in the review, we have used the data from Ellstrom 1998b where applicable. The eVALuate trial population was studied in two papers (Garry 2004; Sculpher 2004), and study quality was summarised under Garry 2004. There were two more studies on different outcomes and outcome measures from the same randomised study population: Persson 2006 and Persson 2008 were summarised under Persson 2006; and the long‐term follow‐up study by Nieboer 2012 was summarised under Kluivers 2007. Both Persson 2006 and Kluivers 2007 were already included in the 2009 update. One additional study was identified, which is awaiting classification (Sesti 2014).
Included studies
See Characteristics of included studies for an overview of the included studies.
Study design
All of the included trials had a parallel‐group design. Thirty‐seven of the trials were single‐centre studies (nine from Italy; two from Sweden; four from Taiwan; three from the USA; two each from the UK, Korea, China, India, Brazil, France and Germany; and one each from Finland, the Netherlands, Switzerland, Thailand and Hong Kong). Of the 10 multicentre trials, four trials recruited from two centres (Darai 2001 based in France; Langebrekke 1996 based in Norway; Miskry 2003 based in the UK; Paraiso 2013 based in the USA). Three trials recruited from three centres (Summitt 1998 based in the USA; Lumsden 2000 based in the UK; Muzii 2007 based in Italy). One trial from Italy recruited from four centres (Marana 1999); one Swedish trial recruited from five centres (Persson 2006); and a trial based in the UK with additional centres in South Africa (Garry 2004) recruited from 30 centres.
Participants
The 47 studies involved 5102 women.
The reported mean age of participants in the study groups ranged from 38 (Summitt 1992) to 55 years (Agostini 2006).
All of the included studies recruited women who needed a hysterectomy for benign causes; seven studies specifically included women who underwent hysterectomy for symptomatic uterine fibroids (Benassi 2002; Ferrari 2000; Hwang 2002; Long 2002; Ribeiro 2003; Sesti 2008a; Tsai 2003).
-
Vaginal hysterectomy (VH) versus abdominal hysterectomy (AH)
Benassi 2002 included women with symptomatic enlarged fibroid uteri. Silva Filho 2006 included women with myoma and a uterine size less than 300 cm3. Chakraborty 2011 and Miskry 2003 included women who needed hysterectomy for a benign condition.
-
Laparoscopic hysterectomy (LH) versus AH (including LH with bilateral salpingo‐oophorectomy (LH‐BSO) versus AH‐BSO, and LAVH versus minilaparotomy‐AH)
Fourteen of the 21 studies that compared LH with AH specifically included women who were scheduled for an abdominal hysterectomy or who had contraindications for a vaginal hysterectomy (Ellstrom 1998; Falcone 1999; Ferrari 2000; Harkki‐Siren 2000; Kluivers 2007; Kongwattanakul 2012; Lumsden 2000; Marana 1999; Muzii 2007; Olsson 1996; Seracchioli 2002; Summitt 1998; Tsai 2003; Yuen 1998).
-
LH (including all forms of LH) versus VH
Studies (n = 3) either included women if their uterine size was larger than a certain number (e.g. more than 280 g (Darai 2001; Soriano 2001) or between 300 g and 1500 g (Roy 2012)) or studies (n = 5) excluded women if their uterine size was greater than, for instance, 14 (Ghezzi 2010) or 16 weeks of pregnancy (Richardson 1995; Sesti 2008b; Summitt 1992). One study specifically included women with symptomatic or rapidly growing myoma (Sesti 2008b).
-
VH versus LH (vLH as it was called in the trial) and AH versus LH (aLH as it was called in the trial)
Garry 2004 included women scheduled for hysterectomy for non‐malignant conditions.
-
LH (including laparoscopic‐assisted vaginal hysterectomy (LAVH)) versus AH (including mini‐AH) versus VH
Four of the five trials specifically included women with uterine fibroids: e.g. leiomyomas of less than 15 cm (Ottosen 2000), leiomyomas of more than 8 cm and a maximum of three myomas (Hwang 2002), symptomatic myoma (Sesti 2008a), or any fibroid (Ribeiro 2003). The fifth study included women who were scheduled for hysterectomy with a uterine volume of 10 to 12 weeks of gestation and who had delivered at least one child (Zhu 2009).
-
Robotic‐assisted hysterectomy (RH) versus LH
Both Paraiso 2013 and Sarlos 2012 included patients who were scheduled for a hysterectomy for benign conditions. In Sarlos 2012, uterine weight had to be less than 500 g.
-
Single‐port laparoscopic hysterectomy (SP‐LH) versus LH
The three trials included women who had an indication for hysterectomy, no evidence of gynaecologic malignancy and an appropriate status for laparoscopic surgery (ASA 1 or 2) (Chen 2011; Jung 2011; Song 2013). Uterine size was also used as an exclusion criterion: more than 12 weeks gestation (Jung 2011); more than 20 weeks (Song 2013), and greater than 120 mm x 80 mm x 80 mm (Chen 2011).
-
LAVH versus total laparoscopic hysterectomy (TLH)
In Long 2002, women were included if they had contraindications for vaginal hysterectomy (a uterine weight greater than 280 g, previous pelvic surgery, pelvic inflammatory disease, need for adnexectomy, lack of uterine descent and limited vaginal access).
-
LAVH versus TLH versus VH
In Roy 2011, women were included if they had benign pathology of the uterus and medical therapy had failed.
-
LH versus mini‐LH
Ghezzi 2011 included women with benign gynaecological conditions requiring hysterectomy.
Interventions
Surgical procedures
-
VH versus AH (five trials)
Five trials compared VH with AH (Benassi 2002; Chakraborty 2011; Miskry 2003; Silva Filho 2006); one included a laparoscopic arm as well (Ottosen 2000). Hysterectomies were performed by standard technique for each route.
-
LH versus AH (21 trials)
Twenty‐one trials compared LH to AH (Ellstrom 1998; Falcone 1999; Ferrari 2000; Garry 2004; Harkki‐Siren 2000; Hwang 2002; Kluivers 2007; Kunz 1996; Langebrekke 1996; Lumsden 2000; Marana 1999; Muzii 2007; Perino 1999; Raju 1994; Ribeiro 2003; Seracchioli 2002; Sesti 2008a; Schutz 2002; Summitt 1998; Tsai 2003; Yuen 1998). These included four trials that randomised women to LH, AH and VH (Garry 2004; Hwang 2002; Ottosen 2000; Ribeiro 2003). Raju 1994 compared LH and bilateral salpingo‐oophorectomy (LH‐BSO) with AH‐BSO. Ellstrom 1998 stratified the two randomised groups (LH and AH) into total and subtotal hysterectomies. Muzii 2007 performed mini‐laparotomy for AH (with a moving surgical field or window using three separate retractors). Sesti 2008a compared LAVH and AH.
-
LH versus VH (10 trials)
Ten trials included a comparison of laparoscopic hysterectomy (LH) with vaginal hysterectomy (VH) (Agostini 2006; Candiani 2009; Darai 2001; Garry 2004; Ghezzi 2010; Richardson 1995; Roy 2012; Sesti 2008b; Soriano 2001; Summitt 1992), including four trials randomising women to LH, AH and VH and including the trial comparing TLH, LAVH and VH. Garry 2004 was a very large RCT comparing LH (called vLH in the trial) with VH and LH (called aLH in the trial) with AH; it was essentially two concurrent RCTs as part of the same study.
-
RH versus LH (two trials)
Paraiso 2013 and Sarlos 2012 compared conventional laparoscopic to robotically assisted hysterectomy.
-
SP‐LH versus LH (three trials)
Chen 2011 compared SP‐LAVH versus LAVH, whereas Jung 2011 and Song 2013 compared SP‐LH versus TLH.
-
LAVH versus TLH (one trial)
Long 2002 compared two types of laparoscopic hysterectomy, which was LAVH versus TLH.
-
LH versus mini‐LH (one trial)
Ghezzi 2011 compared two types of laparoscopic hysterectomy, which was mini‐LH versus LH.
-
LH subcategories
Although all the trials used variations of the terms 'laparoscopic‐assisted vaginal hysterectomy' (LAVH) or 'laparoscopic hysterectomy', their definition varied according to what stages of the hysterectomy were completed laparoscopically and the point at which the operation continued vaginally. We included all trials with hysterectomies that had some laparoscopic component in the overall LH category. Using the Richardson 1995 'Staging of laparoscopic hysterectomy' table (see Table 2) we were able to categorise 39 of the 45 included studies that involved LH according to the amount of laparoscopic content. We also subcategorised these trials involving LH as either LAVH, LH(a) or TLH, depending on the extent of the surgery performed either laparoscopically or vaginally (see Table 1). If any trial included women undergoing different Richardson LH stages in the LH arm, we arbitrarily categorised the stage firstly, as the stage to which the surgeons had intended to go; secondly, if that information was not available, to the LH stage that most women underwent surgery; or thirdly, to the most advanced LH stage that women underwent. According to Richardson staging, one trial involved stage zero LH (Ottosen 2000), four trials were stage two (Agostini 2006; Kunz 1996; Marana 1999; Raju 1994), nine trials were stage three (Chen 2011; Ferrari 2000; Muzii 2007; Roy 2011; Roy 2012; Sesti 2008a; Sesti 2008b; Song 2013; Tsai 2003), 10 trials were stage four where the uterine artery was transected laparoscopically (Darai 2001; Ellstrom 1998; Olsson 1996; Persson 2006; Schutz 2002; Soriano 2001; Summitt 1992; Summitt 1998; Yuen 1998; Zhu 2009), and 14 trials were stage five (Candiani 2009; Falcone 1999; Ghezzi 2010; Ghezzi 2011; Harkki‐Siren 2000; Hwang 2002; Jung 2011; Kluivers 2007; Langebrekke 1996; Paraiso 2013; Perino 1999; Ribeiro 2003; Sarlos 2012; Seracchioli 2002). For two trials we were unable to sub‐categorise the LH procedures and we described these as 'non‐categorisable LH' (Chakraborty 2011; Kongwattanakul 2012). Richardson 1995 had LHs of all stages from 0 to 5, and two trials did not stipulate the LH stages performed (Garry 2004; Lumsden 2000). In Long 2002, the LAVH treatment arm was a stage three whilst the TLH arm was a stage five.
Surgeons' experience
The surgeons' experience or level of training was reported in 33 of the trials. Eighteen of these trials specified that the same group of surgeons performed operations for both interventions (Benassi 2002; Candiani 2009; Chen 2011; Ghezzi 2010; Ghezzi 2011; Hwang 2002; Jung 2011; Kongwattanakul 2012; Lumsden 2000; Paraiso 2013; Roy 2011; Roy 2012; Sarlos 2012; Seracchioli 2002; Sesti 2008a; Sesti 2008b; Silva Filho 2006; Song 2013). In seven of these trials, the experience was specified in detail, e.g. in Candiani 2009 at least 50 of both procedures and in Jung 2011 at least 100 LH and 30 SP‐LH. In five trials, surgeons for one intervention were different to those performing the other intervention (Kluivers 2007; Langebrekke 1996; Long 2002; Olsson 1996; Raju 1994). In some trials the surgeons consisted only or partly of residents operating under supervision (e.g. Kluivers 2007; Ottosen 2000; Schutz 2002; Summitt 1998). In five trials specific information on surgical experience was lacking (Agostini 2006; Darai 2001; Falcone 1999; Perino 1999; Zhu 2009).
Outcomes
With respect to our primary outcomes, 16 studies reported on time needed to return to normal activities (Harkki‐Siren 2000; Hwang 2002; Langebrekke 1996; Miskry 2003; Olsson 1996; Ottosen 2000; Paraiso 2013; Persson 2006; Raju 1994; Richardson 1995; Roy 2011; Roy 2012; Sarlos 2012; Schutz 2002; Seracchioli 2002; Summitt 1998).
Two studies reported on satisfaction (Benassi 2002; Lumsden 2000), and seven studies reported on quality of life (Garry 2004; Kluivers 2007; Lumsden 2000; Olsson 1996; Persson 2006; Roy 2011; Silva Filho 2006). Song 2013 reported the cosmetic satisfaction after single‐port and multi‐port laparoscopic hysterectomy as primary outcome.
Twenty‐three studies reported on intra‐operative visceral injury (Benassi 2002; Chakraborty 2011; Darai 2001; Garry 2004; Jung 2011; Kluivers 2007; Kongwattanakul 2012; Langebrekke 1996; Long 2002; Lumsden 2000; Marana 1999; Olsson 1996; Ottosen 2000; Perino 1999; Persson 2006; Raju 1994; Ribeiro 2003; Richardson 1995; Roy 2011; Sarlos 2012; Summitt 1992; Summitt 1998; Tsai 2003).
Six studies reported on major long‐term complications (Long 2002; Lumsden 2000; Olsson 1996; Ottosen 2000; Perino 1999; Summitt 1992).
. Forty‐five trials assessed the length of postoperative hospital stay and 10 included an analysis of costs. An assessment of quality of life was reported in 11 trials; four trials included sexual activity or body image in the analysis (Candiani 2009; Garry 2004; Long 2002; Song 2013).
Most of the trials assessed the operation times and intra or postoperative complications. Lumsden 2000 and Garry 2004 split the complications into major and minor. Ellstrom 1998 reported on the difference in erythrocyte volume fraction. Febrile morbidity was measured in 13 trials, pulmonary function in one trial (Ellstrom 1998), and 12 trials reported any operations that were converted to abdominal surgery (Darai 2001; Garry 2004; Kluivers 2007; Marana 1999; Muzii 2007; Ottosen 2000; Persson 2006; Richardson 1995; Seracchioli 2002; Soriano 2001; Summitt 1992; Summitt 1998).
Excluded studies
See Characteristics of excluded studies for an overview of the excluded studies, including the reasons why they were excluded from the review.
Risk of bias in included studies
An overview of the risk of bias is provided in Figure 2 and Figure 3. Two studies fulfilled all criteria for adequate management of risk of bias (Ghezzi 2011; Miskry 2003). Several studies fulfilled all criteria, except one (Candiani 2009; Garry 2004; Ottosen 2000; Paraiso 2013; Schutz 2002; Sesti 2008a; Song 2013). Three studies met none of the criteria for adequate management of risk of bias (Long 2002, LH versus LAVH; Roy 2011, TLH versus LAVH versus VH; Roy 2012, LH versus VH; and Zhu 2009, AH versus LH versus VH).

'Risk of bias' summary: review authors' judgements about each methodological quality item for each included study.
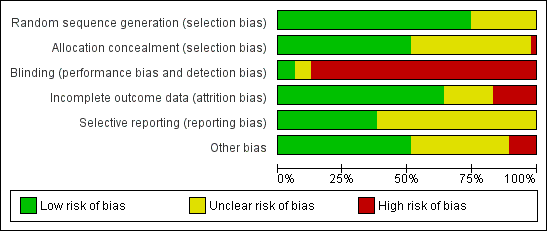
'Risk of bias' graph: review authors' judgements about each methodological quality item presented as percentages across all included studies.
Allocation
Sequence generation
Seventeen studies randomised using a computer (Agostini 2006; Candiani 2009; Chen 2011; Ferrari 2000; Garry 2004; Ghezzi 2010; Ghezzi 2011; Hwang 2002; Miskry 2003; Muzii 2007; Ottosen 2000; Raju 1994; Schutz 2002; Sesti 2008a; Sesti 2008b; Song 2013; Summitt 1998). Langebrekke 1996 and Richardson 1995 used a table of random digits for randomisation. Ten trials used a computer‐generated randomisation code (Benassi 2002; Darai 2001; Falcone 1999; Lumsden 2000; Marana 1999; Seracchioli 2002; Soriano 2001; Summitt 1992; Roy 2012; Tsai 2003; Yuen 1998); one performed randomisation through a computer‐generated randomisation schedule with random block sizes (Paraiso 2013). Eleven trials did not report the randomisation method (Chakraborty 2011; Ellstrom 1998; Harkki‐Siren 2000; Jung 2011; Kunz 1996; Long 2002; Olsson 1996; Perino 1999; Ribeiro 2003; Roy 2011; Zhu 2009). Overall, we considered 35 studies to have low risk of bias and 12 studies to have unclear risk of bias.
Allocation concealment
Twenty studies used sealed, opaque envelopes (Agostini 2006; Candiani 2009; Chen 2011; Ferrari 2000; Ghezzi 2010; Ghezzi 2011; Harkki‐Siren 2000; Hwang 2002; Kluivers 2007; Langebrekke 1996; Miskry 2003; Muzii 2007; Olsson 1996; Ottosen 2000; Persson 2006; Raju 1994; Sesti 2008a; Sesti 2008b; Song 2013; Summitt 1998). For instance, Persson 2006 numbered the envelopes according to a random list, and Kluivers 2007 sealed the envelopes after which they were shuffled and numbered by a third party. Two trials used a telephone (Garry 2004; Schutz 2002). Twenty trials did not report whether allocation was concealed (Benassi 2002; Chakraborty 2011; Darai 2001; Ellstrom 1998; Falcone 1999; Jung 2011; Kunz 1996; Long 2002; Lumsden 2000; Marana 1999; Paraiso 2013; Perino 1999; Ribeiro 2003; Roy 2011; Seracchioli 2002; Soriano 2001; Summitt 1992; Roy 2012; Tsai 2003; Yuen 1998; Zhu 2009). We identified no studies as having high risk of bias; in 21 studies it was unclear and 26 studies had low risk of bias.
Blinding
One trial reported sham abdominal dressings until discharge from hospital after VH (Miskry 2003). Another trial comparing mini‐LH and LH covered the incisions with the same size of plasters (Ghezzi 2011). Paraiso 2013 reported blinding of patients for the intervention. In Kongwattanakul 2012 and Sesti 2008a, the researchers were blinded. One trial reported blinding of the interviewer one month after surgery (Silva Filho 2006). All other trials included in this review did not apply any blinding of participants, clinicians or researchers, resulting in high risk of performance and detection bias. Overall, three studies had low risk of bias, three unclear risk of bias and 41 studies high risk of bias.
Incomplete outcome data
We considered attrition bias low in 32 trials, unclear in seven trials and high in eight trials.
Dropouts
Twenty‐eight trials reported no dropouts. Nineteen trials reported dropouts, with the dropout rate ranging from 1.7% to 20%. Table 4 lists the trials that reported dropouts with the dropout circumstances. In five trials the dropouts were excluded from the data analysis (Long 2002; Lumsden 2000; Persson 2006; Summitt 1998; Yuen 1998), whereas the other three either included the data in the analysis where possible (Falcone 1999; Kluivers 2007; Paraiso 2013; Sarlos 2012), or performed a sensitivity analysis for the missing data (Garry 2004). Three trials had women withdraw pre‐operatively: Falcone 1999 (4 out of 48), Garry 2004 (34 out of 1380) and Persson 2006 (1 out of 119). In the Lumsden 2000 study, seven women withdrew pre‐operatively and case records were not available for three more. Two and one women respectively refused their assigned procedure in the Summitt 1998 and Kluivers 2007 studies; in the Yuen 1998 study, four women declined their assigned operation and a further two women refused to participate postoperatively. In the Long 2002 trial, excluded post‐randomisation were: three women undergoing conversion to laparotomy, seven with incomplete records and three with combined procedures. A further 53 were excluded because they did not have indications of uterine fibroids or adenomyosis. In the Persson 2006 trial, five patients allocated to AH and one to LH withdrew after giving informed consent prior to the operation or withdrew in the postoperative period before the five‐week follow‐up. In the Paraiso 2013 trial, six patients dropped out before the intervention was performed after randomisation. These were analysed in the allocated intervention arm.
| Trial | No. dropouts | Details |
| Chen 2011 | 2 | Excluded from analysis postoperatively, because they underwent accessory adnexal surgery |
| Falcone 1999 | 4 (1 LH; 3 AH) | Withdrew pre‐operatively |
| Garry 2004 | 34 (23 LH (11 aLH; 12 vLH); 6 AH; 5 VH) | Withdrew pre‐operatively |
| Long 2002 | 13 | 3 laparotomy conversions were excluded from analysis; 7 incomplete records; 3 combined procedures that were excluded post‐randomisation |
| Lumsden 2000 | 10 | 10 dropouts were not analysed. 7 women did not attend surgery and 3 records were not available |
| Kluivers 2007 | 1 | Refused assignment procedure |
| Lumsden 2000 | 10 | 7 withdrew pre‐operatively; 3 case records not available |
| Paraiso 2013 | 6 | 6 withdrew after randomisation but before the intervention was performed |
| Persson 2006 | 6 | 5 allocated to AH and 1 to LH withdrew after informed consent prior to the operation or withdrew in the postoperative period before the 5‐week follow‐up |
| Roy 2011 | 9 | 5 excluded because they needed adenectomy during surgery and 4 excluded from all analyses because they did not show up for follow‐up after intervention |
| Roy 2012 | 1 | 1 LH patient excluded from analysis due to conversion |
| Sarlos 2012 | 5 | After randomisation 5 did not complete the study and were excluded from the analysis |
| Song 2013 | 1 | 1 lost to follow‐up because of dissatisfaction with hospital care |
| Summitt 1998 | 2 | Refused assignment procedure |
| Yuen 1998 | 6 | 4 declined operation; 2 refused to participate postoperatively |
AH: abdominal hysterectomy
aLH: laparoscopic cases in the abdominal arm of the eVALuate trial
LH: laparoscopic hysterectomy
VH: vaginal hysterectomy
vLH: laparoscopic cases in the vaginal arm of the eVALuate trial
Loss to follow‐up
In eight trials the follow‐up period was not specified (and considered an unclear risk of bias), the number analysed in the follow‐up period was not reported, or the loss to follow‐up was between 5% to 10% of the patient population (Persson 2006; Sarlos 2012; Summitt 1992; Tsai 2003; Yuen 1998; Zhu 2009). Seven studies lost more than 10% of their patient population in the follow‐up period (Candiani 2009; Kluivers 2007; Long 2002; Lumsden 2000; Roy 2011; Roy 2012; Schutz 2002).
Intention‐to‐treat
Twenty‐eight trials reported no dropouts. Of the 19 RCTs reporting dropouts, seven reported analysis by intention‐to‐treat (ITT), defined as all randomised women reported upon according to their group of randomised allocation (Falcone 1999; Garry 2004; Kluivers 2007; Paraiso 2013; Persson 2006; Sarlos 2012; Sesti 2008a). The remaining RCTs reporting dropouts did not report ITT analysis of all randomised women. One further trial that had no dropouts did not analyse by ITT but according to the treatment received, which was different to the assigned treatment in two cases: the operation was converted from LH to AH and these women were analysed in the AH group (Tsai 2003).
Selective reporting
In 29 studies insufficient information was available to determine whether primary or secondary outcomes had been predefined. These studies had therefore an unclear risk of reporting bias. Eighteen studies had low risk of bias. We considered no studies to have a high risk of bias.
Other potential sources of bias
We judged the risk of potential other bias as follows: low risk of bias in 24 studies, unclear risk of bias in 17 studies and high risk of bias (three or more other potential sources of bias) in six studies.
Differences in baseline characteristics
In three studies, baseline characteristics between intervention groups were not comparable (Chakraborty 2011; Hwang 2002), or baseline characteristics were not reported (Kongwattanakul 2012). In Kluivers 2007, the AH group had more residents as a first surgeon than the other two groups. In the other studies no other bias could be identified. In the Long 2002 trial, women were randomised to treatment groups before a large number (i.e. 66) of the women were excluded. Therefore, the women in each treatment group may not have been a true representation of the original randomised groups.
Surgeon's experience
The surgeon's experience or level of training was reported in 30 of the trials and was not considered as a potential source of bias. In the remaining 17 studies the surgeon's experience was not reported or specified or varied substantially between groups. The studies by Benassi 2002, Chakraborty 2011, Chen 2011, Ellstrom 1998, Ferrari 2000, Hwang 2002, Kunz 1996 and Tsai 2003 did not report or specify the surgeon's experience for the interventions evaluated. In five trials, surgeons for one intervention were different to those performing the other intervention: Olsson 1996 (LH carried out by two out of five senior registrar grade surgeons trained in LH, AH carried out by two out of 10 senior registrar grade surgeons trained in AH); Langebrekke 1996 (LH performed exclusively by the two authors, AH performed by any skilled gynaecologist in the department); Raju 1994 (LAVH performed by one of the authors, AH by one of the authors or a senior registrar grade surgeon); Kluivers 2007 (LH was performed or supervised (resident 39%) by three out of 10 experienced gynaecologists (at least 100 LHs), AH performed or supervised by all 10 gynaecologists); and Long 2002 (one surgeon performed all LAVH, another performed all TLH). Residents were the first surgeon in 39% of LH and 88% of AH. In Agostini 2006, the five surgeons were experienced in vaginal surgery but laparoscopic experience was not reported. In Ottosen 2000, 15 gynaecological surgeons with assistants performed the operations; their experience varied and there were cases of residents performing operations under supervision. In Schutz 2002, 71% of LH were performed by the attending physician and 29% by a resident under supervision, and 40% of AH were performed by the attending physician and 60% by the resident under supervision. One trial used only gynaecological residents to perform all the operations with the assistance of the attending physician (Summitt 1998). It is unlikely that any of the latter three trials used the same group of surgeons for both intervention groups. In three other trials it was unclear if the surgeons performing the operations were different: Darai 2001 (all experienced in laparoscopic and vaginal surgery but no mention of who performed each intervention); Perino 1999 (LH by team of three laparoscopic surgeons with experience of more than 100 LHs, no details provided for AH arm); and Falcone 1999 (one of the senior authors performed all the LH operations with the assistance of a pelvic surgery fellow or resident, but no mention of the AH group). In four of the trials, surgeons of all grades and experience carried out the operations. In Garry 2004, each surgeon recruited to the trial had to have performed 25 of each procedure, however cases could be used for teaching if the main assistant was the designated surgeon.
Source of funding
Three studies received funding from pharmaceutical or surgical instrumentation companies: Falcone 1999 received part of the funding from Ethicon Endosurgery Inc; Harkki‐Siren 2000 received a part of its funding from the Research Foundation of the Orion Corporation; Summitt 1998 received all of its funding from US Surgical Corporation, USA.
Other bias
If a trial lacked information, such as a description of one of the interventions or details on the inclusion or exclusion criteria, we considered this a possible source of other bias.
Effects of interventions
See: Summary of findings for the main comparison Vaginal hysterectomy versus abdominal hysterectomy for benign gynaecological disease; Summary of findings 2 Laparoscopic hysterectomy versus abdominal hysterectomy for benign gynaecological disease; Summary of findings 3 Laparoscopic hysterectomy versus vaginal hysterectomy for benign gynaecological disease
1 Vaginal hysterectomy (VH) versus abdominal hysterectomy (AH)
Primary outcomes
1.1 Return to normal activities
For vaginal versus abdominal hysterectomy, patients returned to normal activities sooner after VH (mean difference (MD) ‐12.33, 95% confidence interval (CI) ‐19.89 to ‐4.77; three randomised controlled trials (RCTs), 176 women, I2 = 75%, moderate quality evidence) (Figure 4; Analysis 1.1).

Forest plot of comparison: 1 VH versus AH, outcome: 1.1 Return to normal activities (days).
1.2 Satisfaction and quality of life
There was no evidence of a difference in patient satisfaction between vaginal and abdominal hysterectomy, although the point estimate clearly favoured VH (odds ratio (OR) 2.69, 95% CI 0.50 to 14.42, one RCT, 119 women, I2 = n/a, moderate quality evidence) (Analysis 1.2).
Silva Filho 2006 found better quality of life after vaginal hysterectomy, compared to abdominal hysterectomy, in the SF‐36 subscales for functional capacity (means VH versus AH: 95 versus 73), physical aspects (means VH versus AH: 100 versus 38), and pain (means VH versus AH: 84 versus 51). Additionally, a higher rate of patients who underwent vaginal hysterectomy would choose the same treatment again (Analysis 1.8).
1.3 Intra‐operative visceral injury
There were three times as many urinary tract injuries after vaginal versus abdominal hysterectomy, although there was no evidence of a difference (OR 3.09, 95% CI 0.48 to 19.97, four RCTs, 439 women, I2 = 0%, moderate quality evidence) (Analysis 1.3). No ureter, bowel or vascular injuries occurred in either group.
1.4 Major long‐term complications
No urinary dysfunction occurred in either group (OR n/a, one RCT, 80 women) (Analysis 1.4).
Fistula formation, pelvic‐abdominal pain, bowel dysfunction, pelvic floor condition (prolapse) and sexual dysfunction were not studied.
Secondary outcomes
1.5 Operation time
Four trials showed evidence of a difference: three in favour of vaginal hysterectomy, one in favour of abdominal hysterectomy (four RCTs, 359 women) (Analysis 1.5). The direction of the treatment effect differed amongst studies, therefore we did not pool the results.
Three trials reported descriptive data on operation times for this comparison. The trial by Hwang 2002 reported data as a median and range and found a shorter median operating time for VH (74 minutes, range 40 to 120) versus AH (98 minutes, range 85 to 150). Miskry 2003 reported mean and range (VH 68.8 minutes (30 to 180) versus AH 68.2 minutes (45 to 174), whereas Ribeiro 2003 reported mean only (VH 78 minutes versus AH 109 minutes) (Analysis 1.8).
1.6 Intra‐operative complications (other than visceral injury)
There was no evidence of a difference between the groups in the need for blood transfusion (OR 0.82, 95% CI 0.34 to 1.96, five RCTs, 495 women, I2 = 19%) and occurrence of pelvic haematoma (OR 0.99, 95% CI 0.34 to 2.89, five RCT, 535 women, I2 = 0%) (Analysis 1.6).
Substantial bleedings were not studied for this comparison.
Unintended laparotomy was not compared in meta‐analysis because AH involves routine laparotomy.
1.7 Short‐term outcomes and complications
Hospital stay was shorter in vaginal hysterectomy compared to standard abdominal hysterectomy (MD ‐1.07, 95% CI ‐1.22 to ‐0.92; four RCTs; 295 women; I2 = 0%) as well as compared to minilaparotomy AH (MD ‐2.10, 95% CI ‐2.19 to ‐2.01; one RCT; 100 women; I2 = n/a) (Analysis 1.7).
Wound/abdominal wall infection (OR 0.21, 95% CI 0.04 to 1.00, three RCTs, 355 women, I2 = 0%), urinary tract infection (OR 0.59, 95% CI 0.08 to 4.61, three RCTs, 176 women, I2 = 0%) and febrile episodes or unspecified infections (OR 0.62, 95% CI 0.36 to 1.08, five RCTs, 495 women, I2 = 15%) all occurred less after VH than after AH, but there was no evidence of a difference. The number of women included in studies that reported on chest infection (OR 1.00, 95% CI 0.13 to 7.60, one RCT, 60 women, I2 = n/a) or low backache (OR 0.57, 95% CI 0.20 to 1.65, one RCT, 200 women, I2 = n/a) were too low to make meaningful comparisons. There were no thromboembolisms in either group (one RCT, 119 women) (Analysis 1.6).
No data on perioperative mortality, postoperative ileus and wound dehiscence were reported for this comparison.
1.8 Cost
No studies reported this outcome in this comparison.
2 Laparoscopic hysterectomy (LH) versus abdominal hysterectomy (AH)
Primary outcomes
2.1 Return to normal activities
Return to normal activities was quicker after laparoscopic‐assisted vaginal hysterectomy (LAVH) than after AH (MD ‐8.40, 95% CI ‐12.15 to ‐4.65; one RCT; 80 women; I2 = n/a) and was quicker after LH than after AH (MD ‐15.17, 95% CI ‐17.21 to ‐13.14; five RCTs; 440 women; I2 = 48%) (Analysis 2.1). One study reported only the mean days and did not find evidence of a difference (Schutz 2002). For three additional RCTs the data could not be pooled. Median duration of return to normal activities was shorter for LH in these three trials (Langebrekke 1996; Persson 2006; Raju 1994) (Figure 5; Analysis 2.1)

Forest plot of comparison: 2 LH versus AH, outcome: 2.1 Return to normal activities (days).
2.2 Satisfaction and quality of life
There was no evidence of a difference in patient satisfaction between LH and AH (OR 0.65, 95% CI 0.32 to 1.30, one RCT, 166 women, I2 = n/a, low quality evidence) (Lumsden 2000) (Analysis 2.2).
For LH versus AH, Garry 2004 demonstrated that quality of life (measured by the SF12 scoring system) was better for LH at six weeks; body image was improved for LH versus AH at six weeks, but not at four and 12 months; and sexual frequency was higher at six weeks following LH. Kluivers 2007 found a treatment effect favouring LH in the RAND‐36 scale for vitality in the first 12 weeks postoperatively. In the long‐term follow‐up (four years) of Kluivers 2007, Nieboer 2012 found that the total RAND‐36 score favoured LH, as well as the RAND‐36 sub‐scale scores for vitality, physical functioning and social functioning. Lumsden 2000 used the EuroQol 5D thermometer, and there was no evidence of a difference at one month, six months or a year after surgery. Olsson 1996 asked the patients six to eight weeks after surgery whether the duration of postoperative hospital stay had been adequate and 9% (LH) versus 17% (AH) of patients reported that the stay had been too short. Persson 2006 applied four psychometric tests, but there was no evidence of a difference between the interventions in the first six months after surgery (Analysis 2.24).
2.3 Intra‐operative visceral injury
Although there was no proof of a difference in intra‐operative visceral injury, most point estimates indicated more harm after LH, i.e. bladder injury (OR 1.89, 95% CI 0.91 to 3.90, 12 RCTs, 2038 women, I2 = 0%) (Analysis 2.3), ureter injury (OR 3.46, 95% CI 0.94 to 12.71, seven RCTs, 1417 women, I2 = 0%) (Analysis 2.4), and vascular injury (OR 1.76, 95% CI 0.52 to 5.87, two RCTs, 956 women, I2 = 0%) (Analysis 2.7); with the exception of bowel injury (OR 0.21, 95% CI 0.03 to 1.33, four RCTs, 1175 women, I2 = 0%) (Analysis 2.6).
When we pooled bladder and ureter injuries as 'urinary tract injury', there was evidence of a difference (OR 2.44, 95% CI 1.24 to 4.80, 13 RCTs, 2140 women, I2 = 0%, low quality evidence) (Analysis 2.5).
2.4 Major long‐term complications
Comparisons of long‐term complications were either underpowered (fistula formation (OR 3.07, 95% CI 0.32 to 29.96, two RCTs, 245 women, I2 = 0%, low quality evidence) (Analysis 2.8) and urinary dysfunction (OR 0.94, 95% CI 0.48 to 1.84, two RCTs, 246 women, I2 = 0%, low quality evidence) (Analysis 2.9)) or were lacking (pelvi‐abdominal pain, bowel dysfunction, pelvic floor condition (prolapse), sexual dysfunction).
Secondary outcomes
2.5 Operation time
There was no evidence of a difference in operation time between LAVH versus AH (MD 0.27, 95% CI ‐23.39 to 23.93; four RCTs; 466 women; I2 = 96%) (Analysis 2.10). Other subcategories of laparoscopic hysterectomy (LH(a) and total laparoscopic hysterectomy (TLH)) took longer than abdominal hysterectomies (LH(a) versus AH: MD 33.45, 95% CI 14.82 to 52.08; five RCTs, 420 women, I2 = 90% (Analysis 2.10); TLH versus AH: MD 28.74, 95% CI 2.64 to 54.85; two RCTs, 161 women, I2 = 87%) (Analysis 2.10). Operation time was eight minutes shorter in LAVH compared to mini‐AH (MD ‐8.00 minutes, 95% CI ‐10.56 to ‐5.44, one RCT, 100 women, I2 = n/a, moderate quality evidence) (Analysis 2.10). These analyses used a random effects model. We considered clinical and methodological differences between the studies that might account for the high heterogeneity; training and experience of surgeons may play a role.
Eleven additional trials could not be pooled because of the descriptive format in which the data were presented. Except for Yuen 1998, all trials showed that abdominal hysterectomy had a shorter median operation time (Falcone 1999; Ferrari 2000; Garry 2004, Hwang 2002; Langebrekke 1996; Muzii 2007; Persson 2006; Raju 1994, Ribeiro 2003; Schutz 2002) (Analysis 2.25).
2.6 Intra‐operative complications (other than visceral injury)
There was no evidence of a difference in the number of women with substantial bleeding between laparoscopic and abdominal hysterectomy (OR 0.45, 95% CI 0.15 to 1.37, five RCTs, 1266 women, I2 = 0%) (Analysis 2.11).
Overall, laparoscopic versus abdominal hysterectomy did not show evidence of a difference in the need for blood transfusions (OR 0.58, 95% CI 0.30 to 1.10, 20 RCTs, 2638 women, I2 = 32%, moderate quality evidence) (Analysis 2.12). Pelvic haematomas occurred less after laparoscopic hysterectomy, but again there was no evidence of a difference (OR 0.75, 95% CI 0.38 to 1.47, eight RCTs, 782 women, I2 = 0%, low quality evidence) (Analysis 2.13).
Unintended laparotomy was not compared in meta‐analysis because AH involves routine laparotomy. In two trials there was no proof of a difference in unintended conventional laparotomies between the interventions (OR 0.49, 95% CI 0.08 to 2.82, two RCTs, 181 women, I2 = n/a) (Analysis 2.14).
2.7 Short‐term outcomes and complications
Hospital stay was generally shorter in LH compared to AH: LAVH versus AH (MD ‐2.64, 95% CI ‐4.16 to ‐1.12; four RCTs, 466 women, I2 = 97%), LH(a) versus AH (MD ‐1.82, 95% CI ‐2.34 to ‐1.31; four RCTs, 380 women, I2 = 70%), TLH versus AH (MD ‐2.53, 95% CI ‐5.08 to 0.01; two RCTs, 161 women, I2 = 95%) and LAVH versus minilaparotomy AH (MD ‐1.10, 95% CI ‐1.20 to ‐1.00; one RCT, 100 women, I2 = n/a) (Analysis 2.15). These analyses used a random effects model. We considered clinical and methodological differences between the studies that might account for the high heterogeneity; training and experience of surgeons may play a role.
Data from 11 trials on hospital stay could not be included in the meta‐analysis, because of the presentation of median numbers instead of means. In all of these trials, median duration of hospital stay was shorter. There was evidence of a difference, proving hospital stay was shorter for laparoscopic hysterectomy, in six trials (Falcone 1999; Ferrari 2000; Langebrekke 1996; Persson 2006; Raju 1994; Yuen 1998), whereas in one study there was no evidence of a difference (Muzii 2007). In the other four trials no statistical testing was applied (Analysis 2.26).
There were fewer wound or abdominal wall infections in laparoscopic hysterectomy (OR 0.29, 95% CI 0.12 to 0.71; six RCTs, 611 women, I2 = 5%, low quality evidence) (Analysis 2.17) and fewer febrile episodes or unspecified infections for the comparisons LAVH versus AH (OR 0.25, 95% CI 0.09 to 0.73; four RCTs, 339 women, I2 = 0%) and LH(a) versus AH (OR 0.55, 95% CI 0.33 to 0.90; seven RCTs, 572 women, I2 = 47%) (Analysis 2.20).
There was no evidence of a difference in the occurrence of vaginal cuff infection (OR 1.43, 95% CI 0.67 to 3.04, nine RCTs, 852 women, I2 = 0%, low quality evidence) (Analysis 2.16), urinary tract infections (OR 1.04, 95% CI 0.54 to 2.00, eight RCTs, 659 women, I2 = 0%, low quality evidence) (Analysis 2.18), chest infection (OR 0.31, 95% CI 0.07 to 1.35, three RCTs, 294 women, I2 = 17%, low quality evidence) (Analysis 2.19), and thromboembolic events (OR 0.89, 95% CI 0.23 to 3.39, three RCTs, 1125 women, I2 = 0%, low quality evidence) (Analysis 2.21).
With regard to the subcategory LAVH versus mini‐LH, no evidence of a difference was found for wound or abdominal wall infections (OR 0.20, 95% CI 0.01 to 4.19, one RCT, 81 women, I2 = n/a, low quality evidence) (Analysis 2.17), febrile episodes or unspecified infection (OR 0.14, 95% 0.01 to 2.72, one RCT, 81 women, I2 = n/a, low quality evidence) (Analysis 2.20). Other infections (vaginal cuff, urinary tract or chest infection) were not evaluated for this comparison. No evidence of a difference was found for wound dehiscence (OR 3.15, 95% CI 0.12 to 79.69, one RCT, 81 women, I2 = n/a, low quality evidence) (Analysis 2.22). Thromboembolism and perioperative mortality were not evaluated for this comparison.
Also the occurrence of wound dehiscence showed no evidence of a difference (OR 3.15, 95% CI 0.12 to 79.69, one RCT, 81 women, I2 = n/a, low quality evidence) (Analysis 2.22).
There were no reports on perioperative mortality for this comparison.
2.8 Cost
There was no evidence of a difference in the overall cost, but only six RCTs examined comparative cost in any detail (Ellstrom 1998; Garry 2004 (as published in Sculpher 2004); Falcone 1999; Lumsden 2000; Raju 1994; Summitt 1998).
3 Laparoscopic hysterectomy (LH) versus vaginal hysterectomy (VH)
Primary outcomes
3.1 Return to normal activities
Women undergoing laparoscopic hysterectomy returned to work one day earlier than women undergoing VH, but the time to return to normal activities showed no evidence of a difference (MD ‐1.07, 95% CI ‐4.21 to 2.06, two RCTs, 140 women, I2 = 0%, low quality evidence) (Figure 6; Analysis 3.1).
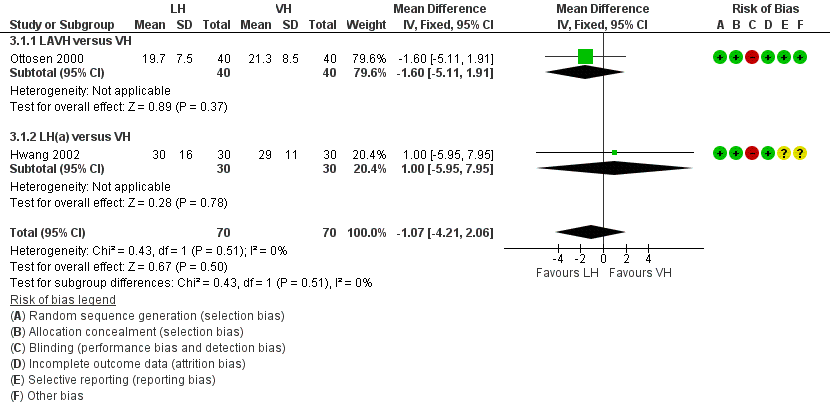
Forest plot of comparison: 3 LH versus VH, outcome: 3.1 Return to normal activities (days).
Data from three RCTs could not be included in the meta‐analysis because of their descriptive nature (Richardson 1995; Roy 2011; Roy 2012). These three trials did not show evidence of a difference in return to normal activities between LH and VH either (Analysis 3.21).
3.2 Satisfaction and quality of life
Roy 2011 showed that six months after surgery, patients were more satisfied after total laparoscopic hysterectomy and vaginal hysterectomy than those who underwent laparoscopic‐assisted vaginal hysterectomy (P value = 0.003). The satisfaction rate was similar between patients undergoing total laparoscopic hysterectomy and non‐descent vaginal hysterectomy (Analysis 3.22). The descriptive character of these data means that these could not be included in the meta‐analysis.
3.3 Intra‐operative visceral injury
There was no evidence of a difference in bladder injury (OR 0.91, 95% CI 0.32 to 2.56, seven RCTs, 895 women, I2 = 0%, low quality evidence) (Analysis 3.3), ureter injury (OR 1.51, 95% CI 0.06 to 37.18, two RCTs, 594 women, I2 = n/a, low quality evidence) (Analysis 3.2), urinary tract injury (OR 1.00, 95% CI 0.36 to 2.75, seven RCTs, 895 women, I2 = 0%, low quality evidence) (Analysis 3.4), and vascular injury (OR 1.58, 95% CI 0.48 to 5.27, four RCTs, 685 women, I2 = 0%, low quality evidence) (Analysis 3.6), but the power to detect a difference is low due to the numbers and low event rates. In the studies from Garry 2004 and Roy 2011 bowel injury did not occur.
3.4 Major long‐term complications
Also, there was no evidence of a difference in the following long‐term complications: fistula formation (OR 0.30, 95% CI 0.01 to 7.67, one RCT, 56 women, I2 = n/a, low quality evidence) (Analysis 3.7), and urinary dysfunction (OR 3.08, 95% CI 0.12 to 77.80, one RCT, 80 women, I2 = n/a, low quality evidence) (Analysis 3.8). Pelvi‐abdominal pain, bowel dysfunction, pelvic floor condition (prolapse) and sexual dysfunction were not studied for this comparison.
Secondary outcomes
3.5 Operation time
All subcategories of laparoscopic hysterectomy showed a longer operation time than vaginal hysterectomy. For LAVH versus VH: MD 33.60, 95% CI 20.13 to 47.07, 5 RCTs, 377 women, I2 = 98%. For LH(a) versus VH: MD 53.58, 95% CI 43.67 to 63.49, 3 RCTs, 213 women, I2 = 0%. For TLH versus VH: MD 17.30, 95% CI 3.34 to 31.26, 1 RCT, 60 women. These analyses used a random effects model. We considered clinical and methodological differences between the studies that might account for the high heterogeneity in the LAVH versus VH subgroup only; training and experience of surgeons may play a role but we were unable to explain why heterogeneity was not present in the LH(a) versus VH subgroup. (Analysis 3.9)
In the operation time analysis, four studies could not be pooled (Hwang 2002; Ribeiro 2003; Richardson 1995; Roy 2012). These studies all found longer operation times in laparoscopic hysterectomy with a statistical test result reported in two studies, of which one showed evidence of a difference (Hwang 2002) and one did not (Roy 2012) (Analysis 3.23).
3.6 Intra‐operative complications (other than visceral injury)
There was no evidence of a difference in other intra‐operative complications between laparoscopic and vaginal hysterectomy: substantial bleeding (OR 1.55, 95% CI 0.24 to 10.09, three RCTs, 614 women, I2 = 0%, low quality evidence) (Analysis 3.10), , the number of transfusions (OR 1.60, 95% CI 0.80 to 3.18, eight RCTs, 1039 women, I2 = 0%, low quality evidence) (Analysis 3.11), pelvic haematoma (OR 1.21, 95% CI 0.36 to 4.03, four RCTs, 308 women, I2 = 0%, moderate quality evidence) (Analysis 3.12) and unintended laparotomies (OR 1.55, 95% CI 0.76 to 3.15, 10 RCTs, 1160 women, I2 = 5%, moderate quality evidence) (Analysis 3.13).
3.7 Short‐term outcomes and complications
Hospital stay was one day shorter after vaginal hysterectomy (MD 0.99 days, 95% CI 0.94 to 1.03, seven RCTs, 525 women, I2 = 67%, moderate quality evidence) (Analysis 3.20). There was no evidence of a difference in short‐term outcomes between laparoscopic and vaginal hysterectomy, i.e. occurrence of pelvic haematoma (OR 1.21, 95% CI 0.36 to 4.03, four RCTs, 308 women, I2 = 0%, low quality evidence) (Analysis 3.12), vaginal cuff infection (OR 0.98, 95% CI 0.22 to 4.39, four RCTs, 276 women, I2 = 0%, low quality evidence) (Analysis 3.14), wound/abdominal wall infection (OR 2.88, 95% CI 0.31 to 27.06, two RCTs, 170 women, I2 = 0%, low quality evidence) (Analysis 3.15), urinary tract infection (OR 1.66, 95% CI 0.40 to 6.82, three RCTs, 230 women, I2 = 0%, low quality evidence) (Analysis 3.16), chest infection (OR 0.19, 95% CI 0.01 to 4.06, one RCT, 60 women, low quality evidence) (Analysis 3.17), febrile episodes or unspecified infection (OR 0.80, 95% CI 0.51 to 1.24, nine RCTs, 1074 women, I2 = 0%, low quality evidence) (Analysis 3.18), and thromboembolic events (OR 1.00, 95% CI 0.15 to 6.67, two RCTs, 564 women, I2 = 0%, low quality evidence) (Analysis 3.19), but again confidence intervals were wide.
Four studies reported on differences in hospital stay, which could not be pooled in the meta‐analysis because of the descriptive format of the presented data (Hwang 2002; Richardson 1995; Roy 2011; Roy 2012). Two studies performed statistical testing but did not find evidence of a difference (Roy 2011; Roy 2012).
3.8 Cost
Laparoscopic hysterectomy costs an average of GBP 401 more than vaginal hysterectomy (95% CI GBP 271 to GBP 542; Garry 2004 as published in Sculpher 2004). The mean total hospital cost was higher for LH than for VH (Summitt 1992).
4 Robotic‐assisted hysterectomy (RH) versus laparoscopic hysterectomy (LH)
Primary outcomes
4.1 Return to normal activities
One small RCT evaluated return to normal activities between robotic‐assisted and laparoscopic hysterectomy. It showed a difference of two days favouring the robotic‐assisted hysterectomy, but there was no conclusive evidence of a difference (MD 2.4 days, 95% CI ‐8.5 to 3.7 days, one RCT, 100 women, I2 = n/a, moderate quality evidence) (Figure 7; Analysis 4.1).
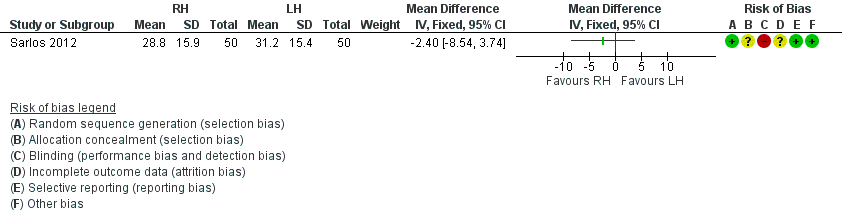
Forest plot of comparison: 4 RH versus LH, outcome: 4.1 Return to normal activities (days).
Data on return to normal baseline activities from the Paraiso 2013 study could not be pooled in the meta‐analysis, but there was no evidence of a difference between robotic‐assisted and laparoscopic hysterectomy.
4.2 Satisfaction and quality of life
These outcomes were not reported in studies comparing robotic‐assisted and laparoscopic hysterectomy.
4.3 Intra‐operative visceral injury
The one RCT comparing these interventions was underpowered regarding ureter injury (OR 0.33, 95% CI 0.0 to 8.21, one RCT, 100 women, I2 = n/a, low quality evidence) (Analysis 4.2) and vascular injury (OR 1.00, 95% CI 0.06 to 16.44, one RCT, 100 women, I2 = n/a, low quality evidence) (Analysis 4.2).
4.4 Major long‐term complications
Fistula formation, pelvi‐abdominal pain, urinary dysfunction, bowel dysfunction, pelvic floor condition (prolapse) and sexual dysfunction were not reported in studies comparing robotic‐assisted and laparoscopic hysterectomy.
Secondary outcomes
4.5 Operation time
Robotic‐assisted hysterectomy took 32 minutes longer than laparoscopic hysterectomy, which showed evidence of a difference (MD 32.42 minutes, 95% CI 22.67 to 42.18, two RCTs, 152 women, I2 = 58%, moderate quality evidence) (Analysis 4.3).
4.6 Intra‐operative complications (other than visceral injury)
No evidence of a difference was found between robotic‐assisted and laparoscopic hysterectomy regarding the need for transfusion (OR 2.08, 95% CI 0.18 to 24.51, one RCT, 52 women, I2 = n/a, low quality evidence) (Analysis 4.4). Sequelae of bleeding, drop in haemoglobin/haematocrit, pelvic haematoma or unintended laparotomy were not studied for this comparison.
4.7 Short‐term outcomes and complications
No evidence of a difference between robotic‐assisted and laparoscopic hysterectomy was found for wound/abdominal wall infection (OR 0.33, 95% CI 0.01 to 8.21, one RCT, 100 women, I2 = n/a, low quality evidence) (Analysis 4.2) and wound dehiscence (OR 0.33, 95% CI 0.01 to 8.21, one RCT, 100 women, I2 = n/a, low quality evidence) (Analysis 4.2). Length of hospital stay, other infections (urinary tract infection, chest infection, febrile episodes or unspecified infections), thromboembolism, perioperative mortality were not studied for this comparison.
4.8 Cost
Cost was not studied in studies comparing robotic‐assisted and laparoscopic hysterectomy.
5. Single‐port laparoscopic hysterectomy subcategory (SP‐LH) versus laparoscopic hysterectomy (LH) subcategories
Primary outcomes
5.1 Return to normal activities
No studies compared this outcome for this comparison.
5.2 Satisfaction and quality of life
No studies compared this outcome for this comparison.
5.3 Intra‐operative visceral injury
No evidence of a difference was found between total laparoscopic hysterectomy and single‐port total laparoscopic hysterectomy for bladder injury (OR 3.51, 95% CI 0.14 to 89.42, one RCT, 64 women, I2 = n/a, moderate quality evidence) (Analysis 5.1). Ureter, urinary tract, bowel and vascular injury were not reported in studies comparing SP‐LH and LH.
5.4 Major long‐term complications
No studies compared this outcome for this comparison.
Secondary outcomes
5.5 Operation time
No evidence of a difference in operation time between SP‐LH and LH was found (MD 1.95 minutes, 95% CI ‐7.03 to 10.93, two RCTs, 164 women, I2 = 57%, moderate quality evidence) (Analysis 5.2).
Data from Song 2013 on operation time could not be pooled, but also did not show evidence of a difference (LAVH median = 92 minutes; SP‐LAVH median = 95 minutes, P value = 0.47) (Analysis 5.9).
5.6 Intra‐operative complications (other than visceral injury)
No evidence of a difference between the groups was found for the following outcomes: , transfusion (OR 1.37, 95% CI 0.30 to 6.26, three RCTs, 203 women, I2 = 0%, low quality evidence) (Analysis 5.3), pelvic haematoma (OR 3.06, 95% CI 0.12 to 76.95, one RCT, 100 women, I2 = n/a, low quality evidence) (Analysis 5.4).
Numbers of bleeding and unintended laparotomy were not evaluated for this comparison.
5.7 Short‐term outcomes and complications
No evidence of a difference in hospital stay was found between TLH and SP‐TLH (MD ‐0.20, 95% CI ‐0.49 to 0.09, one RCT, 100 women, I2 = n/a, low quality evidence) (Analysis 5.8).
Further data on hospital stay from two RCTs on SP‐TLH versus TLH could not be pooled, but both did not show evidence of a difference (Song 2013: median TLH 3 days versus median SP‐TLH 3 days, P value = 0.95 and Jung 2011: TLH median 3 days versus SP‐TLH 3.4 days, P value = 0.075, Analysis 5.10).
No evidence of a difference was found for wound/abdominal wall infection between TLH and SP‐TLH (OR 0.33, 95% CI 0.01 to 8.21, one RCT, 100 women, I2 = n/a, low quality evidence) (Analysis 5.5). More febrile episodes or unspecified infections occurred in the SP‐TLH group than in the TLH group (OR 4.87, 95% CI 0.93 to 25.62, one RCT, 64 women, I2 = n/a, moderate quality evidence) (Analysis 5.6).
No evidence of a difference in postoperative ileus occurrence was found (OR 2.36, 95% CI 0.20 to 27.39, one RCT, 64 women, I2 = n/a, moderate quality evidence) (Analysis 5.7).
Other infections, i.e. vaginal cuff, urinary tract or chest infection, were not reported.
Thromboembolism, perioperative mortality or wound dehiscence were not studied.
5.8 Cost
Cost was not studied for this comparison.
6. Total laparoscopic hysterectomy (TLH) versus laparoscopic‐assisted vaginal hysterectomy (LAVH)
Primary outcomes
6.1 Return to normal activities
No studies compared TLH and LAVH for this outcome.
6.2 Satisfaction and quality of life
No studies compared TLH and LAVH for this outcome.
6.3 Intra‐operative visceral injury
There was no evidence of a difference in injury to bladder (OR 0.72, 95% CI 0.06 to 8.27, two RCTs, 161 women, I2 = n/a, low quality evidence) (Analysis 6.1), ureter (OR 3.03, 95% CI 0.27 to 34.52, two RCTs, 161 women, I2 = n/a, low quality evidence) (Analysis 6.1), urinary tract (OR 1.50, 95% CI 0.29 to 7.83, two RCTs, 161 women, I2 = n/a, low quality evidence) (Analysis 6.1), or vascular injury (OR 1.48, 95% CI 0.09 to 24.27, one RCT, 101 women, I2 = n/a, low quality evidence) (Analysis 6.1) for the comparison TLH versus LAVH. No bowel injuries occurred in either group.
6.4 Major long‐term complications
No evidence of a difference was found in the following long‐term complications: dyspareunia (OR 2.64, 95% CI 0.59 to 11.72, one RCT, 101 women, I2 = n/a, low quality evidence) (Analysis 6.2) or failure to orgasm (OR 0.84, 95% CI 0.38 to 1.86, one RCT, 101 women, I2 = n/a, low quality evidence, Analysis 6.2). Other major long‐term complications (i.e. fistula formation, pelvi‐abdominal pain, urinary dysfunction, bowel dysfunction, pelvic floor condition) were not studied for this comparison.
Secondary outcomes
6.5 Operation time
LAVH had a shorter operation time than TLH (MD ‐23.3 minutes, 95% CI ‐10.0 to ‐40.6; one RCT, 101 women, I2 = n/a, low quality evidence) (Analysis 6.3).
6.6 Intra‐operative complications (other than visceral injury)
There was no evidence of a difference in the number of unintended laparotomies (OR 1.28, 95% CI 0.21 to 7.85, two RCTs, 104 women, I2 = 0%, low quality evidence) (Analysis 6.1).
6.7 Short‐term outcomes and complications
There was no evidence of a difference in hospital stay for TLH versus LAVH (MD 0.00, 95% CI ‐0.45 to 0.45, one RCT, 101 women, I2 = n/a, low quality evidence) (Analysis 6.5). No evidence of difference was found between TLH and LAVH for vaginal cuff infection (OR 0.28, 95% CI 0.03 to 2.45, one RCT, 101 women, I2 = n/a, low quality evidence) (Analysis 6.4), abdominal wall/wound infection (OR 0.19, 95% CI 0.01 to 4.06, one RCT, 60 women, I2 = n/a, low quality evidence) (Analysis 6.4), urinary tract infection (OR 1.00, 95% CI 0.13 to 7.60, one RCT, 60 women, I2 = n/a, low quality evidence) (Analysis 6.4) and febrile episodes (OR 0.50, 95% CI 0.17 to 1.48, two RCTs, 161 women, I2 = 66%, low quality evidence) (Analysis 6.4). There was no evidence of a difference in the number of patients that needed transfusion between TLH and LAVH (OR 1.04, 95% CI 0.24 to 4.43, two RCTs, 161 women, I2 = 0%, low quality evidence) (Analysis 6.4).
Other short‐term outcomes (thromboembolism, perioperative mortality, postoperative ileus or wound dehiscence) were not reported in the studies included in this review.
6.8 Cost
Cost was not studied for this comparison.
7. Mini‐laparoscopic hysterectomy (mini‐LH) versus total laparoscopic hysterectomy (TLH)
Primary outcomes
7.1 Return to normal activities
No studies compared mini‐laparoscopic hysterectomy and total laparoscopic hysterectomy for this outcome.
7.2 Satisfaction and quality of life
No studies compared mini‐laparoscopic hysterectomy and total laparoscopic hysterectomy for these outcomes.
7.3 Intra‐operative visceral injury
No studies compared mini‐laparoscopic hysterectomy and total laparoscopic hysterectomy for these outcomes.
7.4 Major long‐term complications
No studies compared mini‐laparoscopic hysterectomy and total laparoscopic hysterectomy for these outcomes.
Secondary outcomes
7.5 Operation time
Data on operation time could not be included in the meta‐analysis, but showed no evidence of a difference between mini‐laparoscopic hysterectomy and total laparoscopic hysterectomy (median mini‐LH 58 minutes; median TLH 60 minutes; one RCT, 66 women, low quality evidence) (Analysis 7.1).
7.6 Intra‐operative complications (other than visceral injury)
. Bleeding, transfusion, pelvic haematoma or unintended laparotomy were not studied for this comparison.
7.7 Short‐term outcomes and complications
Women undergoing mini‐laparoscopic hysterectomy and total laparoscopic hysterectomy both had a median hospital stay of one day (one RCT, 66 women) (Analysis 7.2). The effect of these procedures on vaginal cuff, abdominal wall/wound, urinary tract or chest infections, or febrile episodes, were not studied.
7.8 Cost
Cost was not studied for this comparison.
Sensitivity analyses
Exclusion of trials susceptible to inadequate sequence generation during the randomisation process
Exclusion of seven trials with unclear or detrimental sequence generation (Ellstrom 1998; Kunz 1996; Long 2002; Olsson 1996; Perino 1999; Ribeiro 2003; Silva Filho 2006) altered the results as follows: bleeding and transfusion in LH versus VH were no longer significantly different; and transfusion in LH(a) versus AH was no longer significantly different.
Exclusion of trials susceptible to 'surgeon effect'
Exclusion of the four trials in which surgeons for one intervention were unequivocally different to those performing the other intervention did not alter the statistical significance of any meta‐analysis results (Kluivers 2007; Langebrekke 1996; Olsson 1996; Raju 1994).
Discusión
Resumen de los resultados principales
Con respecto a los resultados primarios de esta revisión, la histerectomía vaginal resultó el procedimiento superior ya que se asoció con un retorno más rápido a las actividades normales y un alta hospitalaria más temprana. Además, la histerectomía vaginal tuvo un tiempo quirúrgico más corto en comparación con la histerectomía laparoscópica y abdominal. La histerectomía vaginal resultó superior a la histerectomía laparoscópica con respecto a la hemorragia significativa, la administración oral de comprimidos para el dolor al segundo día y los costos hospitalarios. La histerectomía laparoscópica ofreció varias ventajas estadísticamente significativas sobre la histerectomía abdominal; entre estas ventajas estuvieron el retorno más rápido a las actividades normales, menos dolor postoperatorio, el alta hospitalaria más temprana y mejor calidad de vida en los primeros meses y a los cuatro años después de la cirugía; a costa de más infecciones urinarias y mayor duración de la cirugía. La histerectomía laparoscópica de incisión de acceso única no mostró ventajas significativas sobre la histerectomía laparoscópica convencional, aparte de mejores resultados cosméticos. La histerectomía robotizada no ofreció ventajas significativas sobre la histerectomía laparoscópica; Sin embargo el tiempo quirúrgico fue significativamente más prolongado. En conclusión, parece que cuando la histerectomía vaginal sea posible, debe ser la vía preferida sobre otros abordajes. Sin embargo, persiste la incertidumbre acerca de la seguridad de estos procedimientos debido al número bajo de eventos adversos en esta revisión. La HL pareció dar lugar a una mejor calidad de vida a largo plazo en comparación con la HA; este es un resultado importante para la orientación de las pacientes.
El daño de las vías urinarias, en particular la lesión ureteral, sigue siendo el principal motivo de preocupación relacionado con el abordaje laparoscópico. (Garry 2004; Garry 1995; Mäkinen 2013). Sin embargo, este metanálisis de ensayos clínicos controlados aleatorios (ECA) no tuvo el poder estadístico suficiente para detectar un aumento clínicamente significativo de la incidencia del daño vesical y el daño ureteral como efectos separados de un abordaje laparoscópico. Gran parte de los datos de una mayor incidencia de lesión en las vías urinarias proviene de estudios no aleatorios. Solo las series de casos clínicos grandes generalmente tienen el poder estadístico para detectar dichas complicaciones poco frecuentes; sin embargo, los ECA todavía son la manera menos sesgada de evaluar los efectos beneficiosos y perjudiciales de una intervención. Cuando se agruparon las lesiones vesicales y ureterales en los metanálisis bajo una categoría única "lesión urinaria", se detectó un aumento significativo de la lesión urinaria en la HL versus la HA.
Compleción y aplicabilidad general de las pruebas
Es particularmente difícil abordar el problema en relación con la efectividad y las complicaciones en las cirugías cuando las habilidades de los cirujanos no solo son variables, sino también diferentes entre las cirugías "tradicionales" y "laparoscópicas". Es probable que este hecho sea especialmente pertinente para las tasas en las que ocurren las complicaciones, como el daño ureteral. Los resultados de la histerectomía tienden a mejorar cuanto más experiencia adquiera el cirujano en una técnica particular (Mäkinen 2013). En contraste con la evaluación exclusiva del número de operaciones realizadas, otros han puesto énfasis en el factor de las habilidades intrínsecas de cada cirujano, que solamente se puede monitorizar con el transcurso del tiempo y con respecto a la variedad de casos quirúrgicos (Twijnstra 2012). No hay una buena manera de evaluar el riesgo individual de complicaciones poco frecuentes por cirujano aparte de la curva de aprendizaje, pero la monitorización continua de, por ejemplo, la puntuación CUSUM (una herramienta para evaluar la competencia clínica del médico) puede ayudar en el futuro en este sentido.
El número de estudios en la revisión fue demasiado escaso y la descripción de las habilidades quirúrgicas no fue lo bastante específica como para evaluar los efectos de la curva de aprendizaje en las diferentes vías para la histerectomía en un análisis de subgrupos. No se trata solo de una cuestión de la histerectomía, sino que involucra a muchos aspectos del tratamiento quirúrgico con innovaciones. No se aplica al mismo nivel cuando se estudian intervenciones de tratamientos farmacológicos, en los que la eficacia depende mucho menos de la habilidad del investigador que proporciona el tratamiento. Gran parte de la metodología Cochrane se desarrolló sobre la base del modelo médico de intervención.
Con respecto a la aplicabilidad general de las pruebas, se debe señalar que en su mayoría los estudios de esta revisión tuvieron criterios específicos de inclusión. Por ejemplo, los estudios que incluyeron la histerectomía vaginal en un brazo de tratamiento tuvieron diferentes criterios de exclusión, como tamaño uterino de más de 14 o más de 16 semanas de edad gestacional, prolapso de órganos pelvianos, dolor pélvico crónico y una vagina estrecha (evaluada de forma subjetiva). La misma cuestión es pertinente para la histerectomía laparoscópica y abdominal. Estos criterios de inclusión y exclusión específicos hacen más o menos difícil extrapolar los resultados a la práctica diaria, en la que el médico se enfrenta a pacientes que a menudo presentan más de un problema o tienen antecedentes quirúrgicos que superan los de la mayoría de las pacientes incluidas en los estudios de esta revisión.
Hasta la década de 1990, la gran mayoría de las histerectomías se realizaba por vía abdominal (Reich 2003; Vessey 1992), y las vías de la histerectomía todavía varían mucho por centro y país. En algunos países hay una tendencia a realizar menos histerectomías abdominales a favor de otras vías (Brummer 2008; Mäkinen 2013; Moen 2014a; Spilsbury 2006). En el estado actual de la práctica y formación ginecológicas, todos los ginecólogos tienden a estar completamente capacitados en las técnicas de la histerectomía abdominal, aunque hay una variación significativa en su posición dentro de la curva de aprendizaje en relación con las técnicas de histerectomía vaginal y laparoscópicas (Moen 2014b). La cantidad de histerectomías en general disminuye con la introducción de más técnicas que preservan el útero en la ginecología benigna (p.ej. técnicas de ablación, el dispositivo intrauterino [DIU] Mirena). Por ejemplo, en los Países Bajos, la subespecialidad ya se ha introducido en la formación ginecológica, lo que implica que no todos los ginecólogos podrán realizar de forma independiente una histerectomía al final de la formación. La ventaja esperada es que los médicos en formación que se deciden por un perfil quirúrgico estén mejor entrenados en la histerectomía.
En la práctica clínica, así como en los ensayos incluidos en esta revisión, la histerectomía vaginal se realizará principalmente sólo en condiciones óptimas, mientras que la histerectomía abdominal aún es la intervención predefinida para los casos más difíciles. Cada ginecólogo (como ha sido el caso desde que la histerectomía abdominal se convirtió en la alternativa a la vaginal, en 1863) tendrá sus propias indicaciones para la elección del abordaje para la histerectomía en las enfermedades benignas. Estas elecciones pueden verse influidas, hasta cierto punto, por los resultados de pruebas científicas (por ejemplo, esta revisión), pero las decisiones también se basarán en gran parte en las habilidades quirúrgicas del cirujano y las características de las pacientes. Es más incierto determinar si en el futuro habrá más consenso con respecto a estas indicaciones para el abordaje de la histerectomía del que se observó hasta la fecha. Sin embargo, probablemente alcanzar este consenso no sea el objetivo principal, ya que una decisión prudente de un abordaje a la histerectomía sobre el otro puede estar justificada y puede obtener mejores resultados después de todo.
Las medidas de resultado informadas por el paciente (MRIP) se reconocen cada vez más como los resultados importantes en las intervenciones médicas. Las MRIP (p.ej. calidad de vida, experiencias de las pacientes) pueden mostrar la repercusión de la cirugía y las complicaciones sobre la vida de las pacientes y, por lo tanto, pueden ser un argumento principal en la discusión acerca de la mejor manera de realizar una histerectomía (Dawson 2010). Por ejemplo, la rapidez de la recuperación se determina cuando se evita un procedimiento abdominal: la histerectomía abdominal se asoció con una recuperación más prolongada que todos los otros abordajes para la histerectomía. Solamente unos pocos estudios en el metanálisis utilizaron la calidad de vida como una medida de resultado y solamente un estudio informó el efecto a largo plazo (cuatro años) sobre la calidad de vida. Sin embargo, no es fácil incorporar los datos de la calidad de vida al metanálisis (debido al uso de herramientas, plazos y análisis estadísticos diferentes). Los datos disponibles indican que los procedimientos laparoscópicos y vaginales funcionaron mejor o igual en comparación con la histerectomía abdominal, en lo que respecta a la calidad de vida, en las primeras semanas después del procedimiento. La histerectomía laparoscópica funcionó mejor después de cuatro años. En la decisión sobre el abordaje para la histerectomía se debe comparar la ventaja de una mejor calidad de vida con las desventajas. En los estudios futuros, el metanálisis de las MRIP como la calidad de vida se beneficiaría del uso de instrumentos bien validados aplicados en forma estandarizada.
Una inquietud es la heterogeneidad estadística de los ensayos incluidos en esta revisión. La heterogeneidad en dichos resultados como la duración de la cirugía, incluso cuando se comparan las técnicas de histerectomía "tradicionales" de histerectomía vaginal versus abdominal, se relaciona directamente con el hecho de que algunos cirujanos están más capacitados para realizar uno u otro tipo de histerectomía, por lo que completan más rápido dichos procedimientos. Se podría esperar que esta heterogeneidad sea aún más evidente al comparar la histerectomía laparoscópica con la abdominal o la vaginal. Sculpher y cols. han analizado la curva de aprendizaje en el ensayo eVALuate (Sculpher 2004). La conclusión fue que después de completar los 25 casos obligatorios para calificar para la participación en el estudio, no hubo una curva de aprendizaje quirúrgico demostrada para la antigüedad y la experiencia, ni relacionada con el lugar en la tabla cronológica del estudio.
Otro punto de discusión está relacionado con los criterios de inclusión y exclusión en varios estudios. En particular los estudios que incluyeron un brazo de histerectomía abdominal excluyeron las pacientes que no fueron elegibles para los abordajes menos invasivos para la histerectomía. Esta exclusión da lugar a una población de histerectomía abdominal que no representa a toda la población de histerectomía abdominal en la práctica clínica, sino solamente a una población de pacientes que fueron elegibles también para histerectomía vaginal o laparoscópica.
Además, habitualmente los estudios no analizan los mismos resultados. Lo anterior dificulta establecer conclusiones clínicamente relevantes. Se reconoce cada vez más que se necesita un grupo estandarizado de resultados fundamentales. Esta necesidad ha dado lugar a la iniciativa CROWN (CoRe Outcomes in WomeN's health) en la que también participa el Grupo Cochrane de Trastornos Menstruales y Subfertilidad (Cochrane Menstrual Disorders and Subfertility Group) (Khan 2014). Con respecto a esta revisión, sería valioso realizar esfuerzos para desarrollar un grupo fundamental de resultados para la evaluación de la histerectomía.
Calidad de la evidencia
La calidad de las pruebas para las comparaciones incluidas en esta revisión se califica principalmente de baja o moderada, lo que provoca dudas con respecto a los efectos sobre los resultados primarios y secundarios entre los diferentes abordajes para la histerectomía ("Resumen de los hallazgos para la comparación principal"; Resumen de los hallazgos 2; Resumen de los hallazgos 3). Las limitaciones en las pruebas incluyeron la imprecisión de los resultados y el informe inadecuado de los métodos de estudio (p.ej. procedimiento de generación de la secuencia y de asignación al azar, resultados primarios y secundarios no definidos previamente). Las tablas "Resumen de los hallazgos" muestran la calidad de las pruebas para los resultados primarios en las tres comparaciones principales. Con respecto a la histerectomía abdominal versus vaginal hubo una diferencia grande en el retorno a las actividades normales entre los diferentes estudios, aunque todos los resultados favorecieron la histerectomía vaginal. En dos estudios que analizaron la lesión urinaria hubo dudas acerca del método utilizado para la generación de la secuencia aleatoria.
Con respecto a la histerectomía laparoscópica versus abdominal hubo dudas acerca del método utilizado para la generación de la secuencia aleatoria o la asignación de las pacientes. Hubo una gran diferencia en el retorno a las actividades normales entre los diferentes estudios, aunque todos los resultados favorecieron la histerectomía laparoscópica. Además, los intervalos de confianza fueron amplios y cruzaron la línea de ningún efecto.
Además, con respecto a la comparación entre la histerectomía laparoscópica y vaginal hubo intervalos de confianza amplios que cruzaron la línea de ningún efecto. En algunos estudios que analizaron la lesión urinaria y la laparotomía no intencional, hubo dudas acerca del método utilizado para la generación de la secuencia aleatoria o la asignación de las pacientes. En algunos ensayos que estudiaron las complicaciones no estuvo claro como se asignaron al azar las participantes ni cómo se asignaron al grupo de estudio.
En la mayoría de los ensayos las participantes no estaban cegadas, lo que se atribuyó principalmente a la naturaleza de la intervención (p.ej. la histerectomía vaginal no provoca cicatriz abdominal, a diferencia de la histerectomía abdominal). Sin embargo, como Miskry 2003y Paraiso 2013 mostraron, por ejemplo, se podrían aplicar apósitos abdominales simulados para cegar a las participantes. Lo anterior es particularmente beneficioso para obtener resultados informados por la paciente no sesgados como el dolor postoperatorio, la satisfacción o la calidad de vida. Los ensayos que estudiaron resultados a corto plazo en períodos de seguimiento cortos, tuvieron datos faltantes mínimos. Sin embargo, es importante señalar que algunos de los ensayos que evaluaron resultados a largo plazo, como la calidad de vida (p.ej. Garry 2004), tuvieron números significativos de pérdidas durante el seguimiento. Por lo tanto, los resultados de estos estudios deben ser interpretados con precaución. Un motivo importante para la mala calidad de las pruebas fue la imprecisión de los resultados, particularmente debido al escaso número de eventos adversos con respecto a las complicaciones intraoperatorias y a largo plazo graves por estudio. Es importante tener en cuenta este hecho al interpretar los resultados con respecto a la seguridad de cada tipo de histerectomía.
En su mayoría los resultados para las comparaciones entre la histerectomía laparoscópica y abdominal, así como la histerectomía laparoscópica y vaginal, se basan en el ensayo grande Garry 2004, con un riesgo moderado de sesgo y, lo que es más importante, una tasa alta de datos incompletos de resultado. Garry 2004 fue el ensayo más grande (n = 1380) y utilizó las complicaciones graves como resultado primario. El objetivo del reclutamiento se cumplió en el brazo de histerectomía laparoscópica versus abdominal, pero no en el brazo de histerectomía laparoscópica versus vaginal. Con respecto a la comparación entre histerectomía vaginal y abdominal, las conclusiones se basan en seis ensayos con tamaños de la muestra equivalentes y bajo riesgo de sesgo. El análisis de sensibilidad ha inducido algunos cambios en la significación estadística en diversas variables de hemorragia y pérdida de sangre. Las tasas de complicación, tiempo quirúrgico y tiempo de recuperación no cambiaron con la exclusión de los ensayos con una calidad más baja.
En conclusión, es al menos probable que las investigaciones adicionales tengan una repercusión importante sobre la confianza en la estimación del efecto y es probable que cambien la estimación.
Sesgos potenciales en el proceso de revisión
Se utilizó un proceso riguroso para identificar todos los estudios pertinentes, pero se excluyó la literatura gris. Algunos intentos de establecer contacto con los autores de los estudios que carecían de datos suficientes para incluirlos en esta revisión no fueron exitosos. En la revisión se incluyeron cuatro ensayos de brazos múltiples (Hwang 2002; Ottosen 2000; Ribeiro 2003; Sesti 2008a), donde los datos se usaron dos veces en diferentes comparaciones. No existe una respuesta simple a este problema. Como no se esperan grandes efectos de correlación y no independencia de los datos en las conclusiones resultantes, no se han tomado medidas especiales en la revisión para abordar este tema. Podría existir una similar correlación entre los dos brazos e interdependencia de los datos en el estudio Garry 2004, en el que el cirujano, y no la asignación al azar, decidió en qué brazo se incluyó la paciente. Se siguieron procedimientos para reducir otro sesgo potencial en el proceso de revisión.
Acuerdos y desacuerdos con otros estudios o revisiones
Algunas otras revisiones y estudios han evaluado diferentes abordajes para la histerectomía. Kovac 2014 informó que las pruebas demostraron que, en general, la histerectomía vaginal se asocia con mejores resultados y tiene menos complicaciones que la histerectomía laparoscópica o abdominal. Esta también es la conclusión del Committee on Gynecologic Practice of the American College of Obstetrics & Gynecology (ACOG 2009). Además, se menciona que la histerectomía laparoscópica es una alternativa a la histerectomía abdominal en las pacientes en las que la histerectomía vaginal no está indicada o no es posible. En general, lo anterior coincide con las conclusiones de esta revisión. Pynnä 2014 realizó una revisión sistemática de los estudios que han investigado la relación entre costo y efectividad de la histerectomía para la enfermedad ginecológica benigna. Los autores concluyeron que, sorprendentemente, la relación entre costo y efectividad de la histerectomía se ha estudiado de manera deficiente y es difícil establecer conclusiones debido a los diferentes diseños de los estudios, indicaciones, períodos de seguimiento e instrumentos utilizados para medir la calidad de vida. En dicha revisión la histerectomía laparoscópica pareció ser menos efectiva en función de los costos, aunque se necesitan datos adicionales de las cohortes originales de pacientes con un seguimiento a largo plazo. Sin embargo, esta revisión no incluyó estudios con histerectomía robotizada y no todos los estudios incluyeron el costo derivado de la licencia por enfermedad. Smorgick 2014 estudió los efectos beneficiosos y los desafíos de la histerectomía robotizada. En concordancia con la presente revisión, encontraron que los estudios recientes que compararon la histerectomía robotizada y laparoscópica para las indicaciones benignas no han demostrado una ventaja clara del abordaje en cuanto a las complicaciones, la pérdida de sangre y la estancia hospitalaria. El costo mayor de la histerectomía robotizada todavía es una desventaja significativa de este abordaje, aunque el costo total puede disminuir al aumentar la experiencia del cirujano (mediante un tiempo quirúrgico más corto) y se puede compensar en algunas circunstancias por la reducción en la duración de la estancia hospitalaria y del costo de las complicaciones en comparación con la histerectomía abdominal. Se espera que cuando lleguen al mercado más consolas automatizadas, los precios descenderán y la relación entre costo y efectividad pueda moverse en su dirección en la histerectomía laparoscópica. Además, las mejores circunstancias ergonómicas en la histerectomía robotizada probablemente tendrán el beneficio de menos molestias físicas para los cirujanos laparoscópicos y, por lo tanto, menos costos con respecto al ausentismo de los cirujanos.

Study flow diagram.
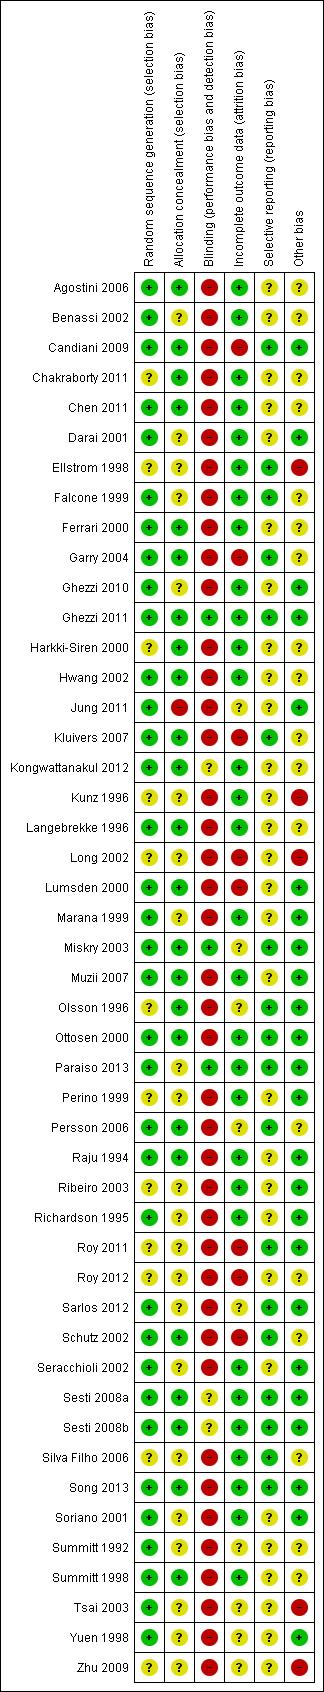
'Risk of bias' summary: review authors' judgements about each methodological quality item for each included study.

'Risk of bias' graph: review authors' judgements about each methodological quality item presented as percentages across all included studies.
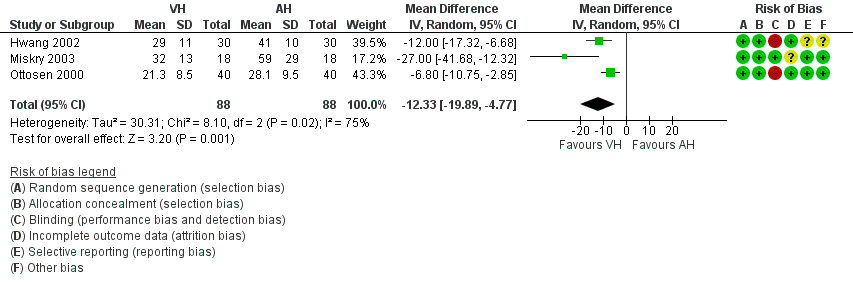
Forest plot of comparison: 1 VH versus AH, outcome: 1.1 Return to normal activities (days).
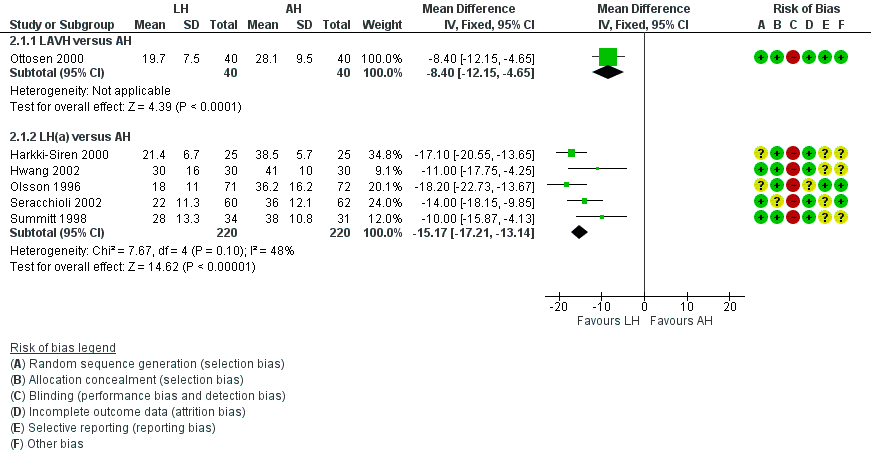
Forest plot of comparison: 2 LH versus AH, outcome: 2.1 Return to normal activities (days).

Forest plot of comparison: 3 LH versus VH, outcome: 3.1 Return to normal activities (days).

Forest plot of comparison: 4 RH versus LH, outcome: 4.1 Return to normal activities (days).

Comparison 1 VH versus AH, Outcome 1 Return to normal activities (days).

Comparison 1 VH versus AH, Outcome 2 Long‐term outcomes: satisfaction (dichotomous).

Comparison 1 VH versus AH, Outcome 3 Intraoperative visceral injury (dichotomous).
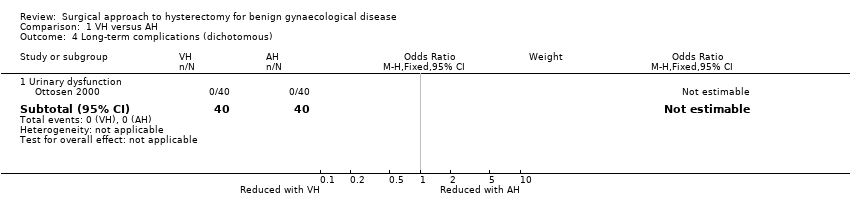
Comparison 1 VH versus AH, Outcome 4 Long‐term complications (dichotomous).

Comparison 1 VH versus AH, Outcome 5 Operation time (mins).

Comparison 1 VH versus AH, Outcome 6 Short‐term outcomes (dichotomous).
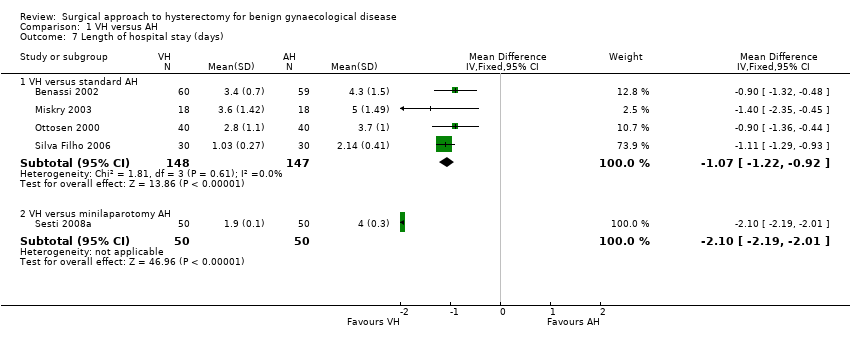
Comparison 1 VH versus AH, Outcome 7 Length of hospital stay (days).
| Study | VH | AH | Comments | |
| Quality of life (descriptive data) | ||||
| Silva Filho 2006 | Questionnaire SF‐36. Only data from functional capacity, physical aspect and pain are presented. A high score is a better quality of life | n = 30 | n = 30 | Functional capacity: VH mean = 95, IQ‐range = 75 to 100. AH mean = 72.5, IQ‐range = 55 to 90 A higher rate of patients in VH would choose the same therapeutic modality (90 % versus 65.5 %, P value = 0.021) |
| Operation time (descriptive data) | ||||
| Hwang 2002 | With 2nd procedure: | With 2nd procedure: | Not tested separately | |
| Miskry 2003 | Mean 68.8 (range 30 to 180) mins | Mean 68.2 (range 45 to 174) mins | — | |
| Ribeiro 2003 | Mean 78 mins | Mean 109 mins | No measure of spread stated | |
| Length of hospital stay (descriptive data) | ||||
| Hwang 2002 | n = 30 | n = 30 | Not tested separately | |
| Ribeiro 2003 | n = 20 | n = 20 | — | |
Comparison 1 VH versus AH, Outcome 8 All outcomes, descriptive data.
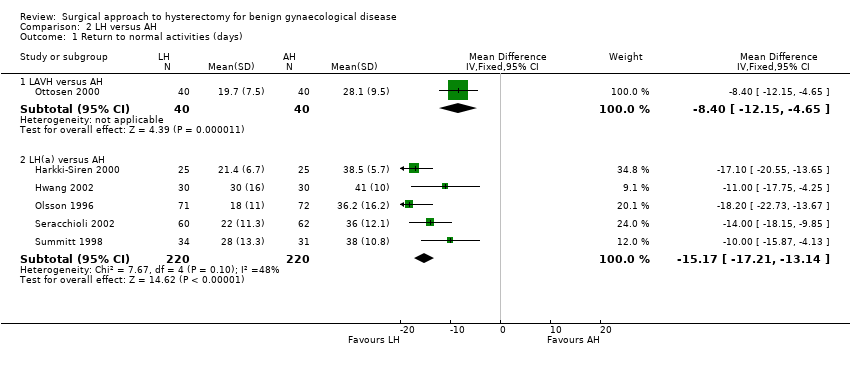
Comparison 2 LH versus AH, Outcome 1 Return to normal activities (days).
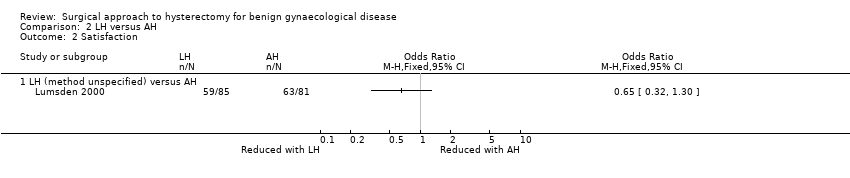
Comparison 2 LH versus AH, Outcome 2 Satisfaction.

Comparison 2 LH versus AH, Outcome 3 Bladder injury.
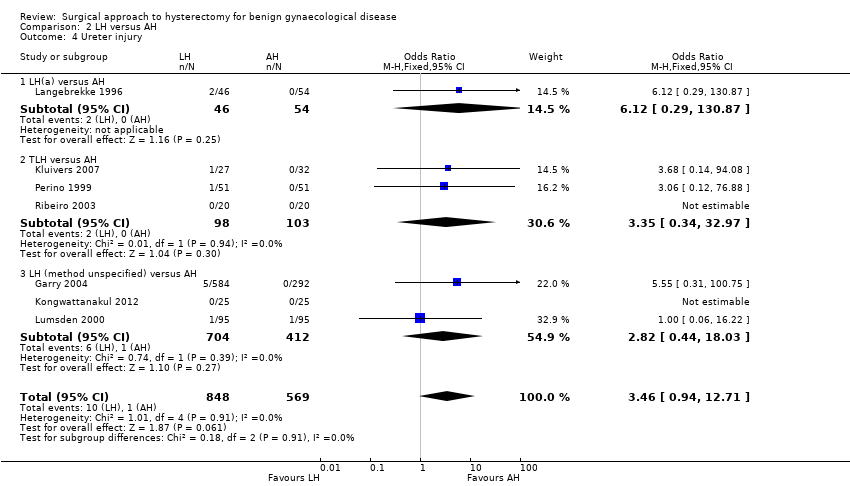
Comparison 2 LH versus AH, Outcome 4 Ureter injury.

Comparison 2 LH versus AH, Outcome 5 Urinary tract (bladder or ureter) injury.
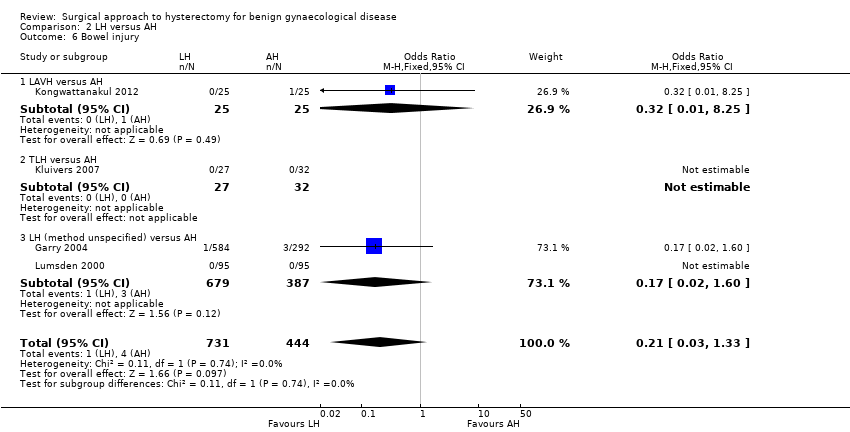
Comparison 2 LH versus AH, Outcome 6 Bowel injury.
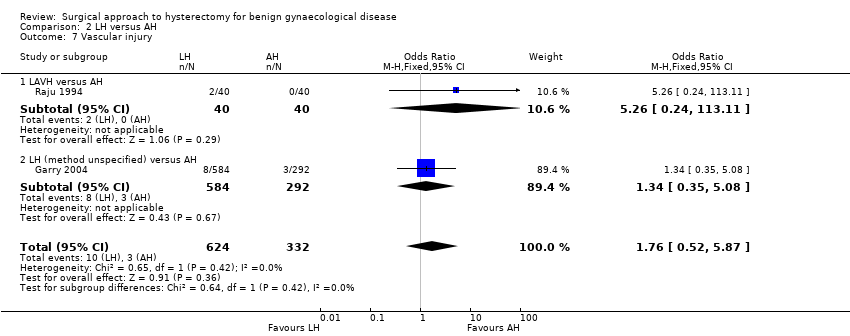
Comparison 2 LH versus AH, Outcome 7 Vascular injury.

Comparison 2 LH versus AH, Outcome 8 Fistula.

Comparison 2 LH versus AH, Outcome 9 Urinary dysfunction.
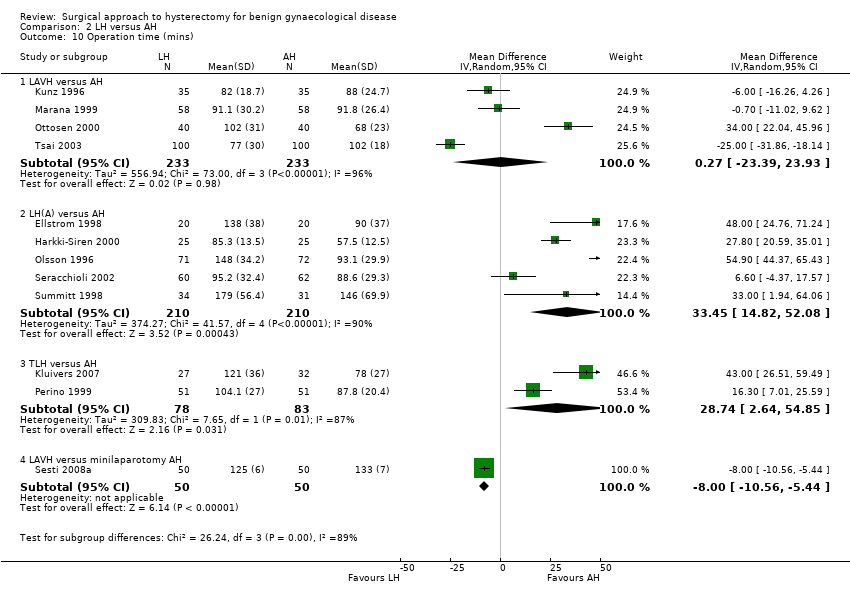
Comparison 2 LH versus AH, Outcome 10 Operation time (mins).

Comparison 2 LH versus AH, Outcome 11 Bleeding.

Comparison 2 LH versus AH, Outcome 12 Transfusion.

Comparison 2 LH versus AH, Outcome 13 Pelvic haematoma.

Comparison 2 LH versus AH, Outcome 14 Unintended laparotomy.

Comparison 2 LH versus AH, Outcome 15 Length of hospital stay (days).
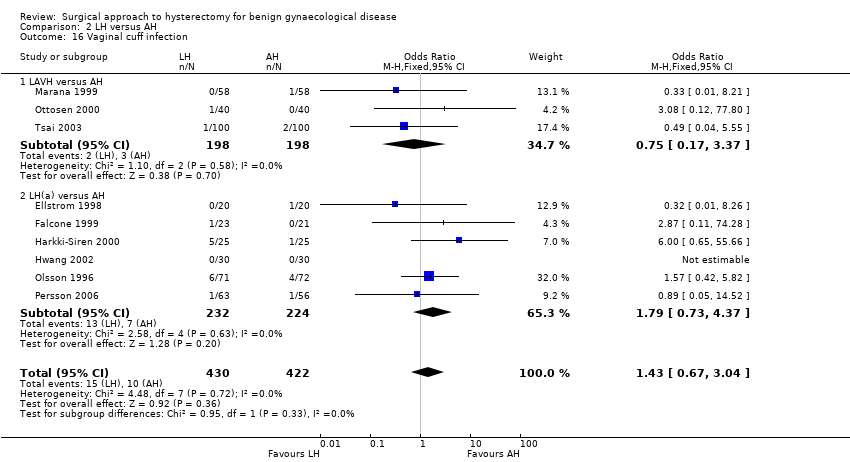
Comparison 2 LH versus AH, Outcome 16 Vaginal cuff infection.

Comparison 2 LH versus AH, Outcome 17 Wound/abdominal wall infection.
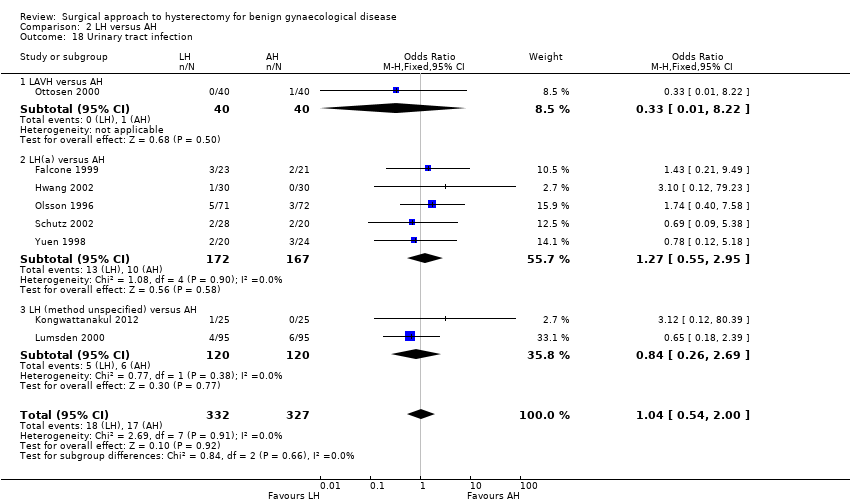
Comparison 2 LH versus AH, Outcome 18 Urinary tract infection.
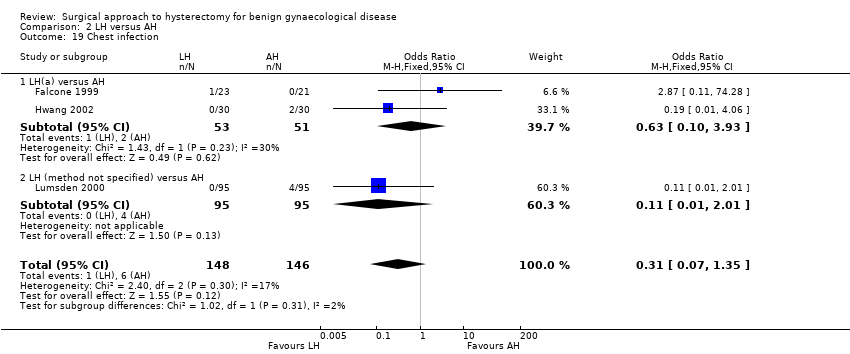
Comparison 2 LH versus AH, Outcome 19 Chest infection.
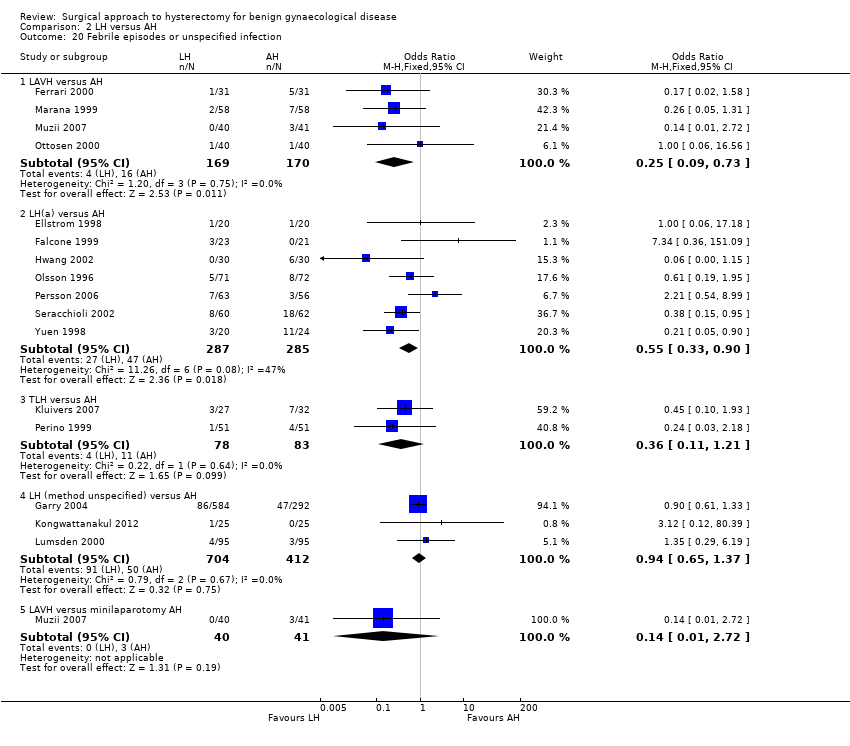
Comparison 2 LH versus AH, Outcome 20 Febrile episodes or unspecified infection.

Comparison 2 LH versus AH, Outcome 21 Thromboembolism.

Comparison 2 LH versus AH, Outcome 22 Wound dehiscence.
| Study | LH | AH | Comments |
| Langebrekke 1996 | n = 46 | n = 54 | P value < 0.001 |
| Persson 2006 | n = 63 | n = 56 | P value = 0.0081 |
| Raju 1994 | n = 40 | n = 40 | P value < 0.0001 |
| Schutz 2002 | n = 28 | n = 20 | — |
Comparison 2 LH versus AH, Outcome 23 Return to normal activities (descriptive data).
| Study | Description | LH | AH | Comments |
| Garry 2004 | Questionnaire assessment of sexual activity, body image (BIS) and health status (SF‐12) before and after surgery (6 weeks, 4 months and 1 year) | SF scores | SF scores | SF scores |
| Kluivers 2007 | Questionnaire RAND‐36. A high score is a better quality of life. Statistical analysis with use of linear mixed model to evaluate the differences between 2 and 12 weeks while accounting for baseline value In Nieboer 2012, the same patients were evaluated with use of the same questionnaire 4 years after surgery | n = 27 at baseline n = 23 at 4 years | n = 32 at baseline n = 26 at 4 years | Difference (95%CI) in favour of LH (the score range on subscales is 100, score range on total RAND‐36 scales is 800) over the first 12 weeks: Analysis over 4 years follow up after surgery: Total RAND‐36 scores overall mean difference 50.4 points (95% confidence interval 1.0 –99.7) in favour of LH. Statistically significant higher scores were also found on the domains physical role functioning, social role functioning and vitality |
| Lumsden 2000 | EuroQol Health Questionnaire used to measure women's evaluation of their health state post surgery (1, 6 and 12 months after surgery). Use of a visual analogue thermometer (0 is worst imaginable health state and 100 is best imaginable health state). | 1 month (post‐op minus pre‐op): n = 74. Mean = 7, SD = 24.1. Median = 10, range (‐50 to 50) 6 months: n = 62. Mean = 11.3, SD = 23.9. Median = 15, range (‐50 to 60) | 1 month: n = 76. Mean = 6.8, SD = 19.2. Median = 8, range (‐50 to 60). | Mean difference: 1 month: ‐1.6 (‐7.2 to 6.9) |
| Olsson 1996 | 6 to 8 weeks after surgery participants were asked in an anonymous questionnaire if they considered the duration of their post‐operative stay adequate | 9% of women in the LAVH group considered their time in hospital following surgery to be too short | 17% of women in the AH group considered their time in hospital following surgery to be too short | — |
| Persson 2006 | Questionnaires: Psychological General Wellbeing (PGWI), Women Health Questionnaire (WHQ), Spielberger Trait Anxiety Inventory (STAI) and Beck's Depression Inventory (BDI) Persson 2008 analysed wellbeing on a 0 to 100 VAS and stress coping ability | n = 63 | n = 56 | Main effect between groups: PGWB P value = 0.719, WHQ P value = 0.800, STAI P value = 0.418, BDI P value = 0.788. Main effect over time: PGWB P value < 0.0001, WHQ P value < 0.0001, STAI P value = 0.0002, BDI P value = 0.0002 In Persson 2008: No significant difference was found in the day‐by‐day recovery of the general wellbeing between the operating methods. Stress coping ability did significantly influence the day‐by‐day recovery of general wellbeing |
Comparison 2 LH versus AH, Outcome 24 Long‐term outcomes: quality of life (descriptive data).
| Study | LH | AH | Comments |
| Falcone 1999 | n = 23 | n = 21 | LH(a) vs AH |
| Ferrari 2000 | n = 31 | n = 31 | LAVH vs AH |
| Garry 2004 | n = 584 | n = 292 | non‐categorisable LH vs AH |
| Hwang 2002 | With 2nd procedure | With 2nd procedure | LH(a) vs AH |
| Langebrekke 1996 | n = 46 | n = 54 | LH(a) vs AH |
| Muzii 2007 | n = 40 median = 86 mins range (60 to 120) | n = 41 median = 58 mins range (45 to 75) | LAVH vs minilaparotomy AH |
| Persson 2006 | n = 63 | n = 56 | LH(a) vs AH |
| Raju 1994 | n = 40 | n = 40 | LAVH vs AH |
| Ribeiro 2003 | n = 20 | n = 20 | TLH vs AH |
| Schutz 2002 | n = 28 | n = 20 | LH(a) vs AH |
| Yuen 1998 | n = 20 | n = 24 | LH(a) vs AH |
Comparison 2 LH versus AH, Outcome 25 Operation time (descriptive data).
| Study | LH | AH | Comments |
| Falcone 1999 | n = 23 | n = 21 | P value = 0.038 |
| Ferrari 2000 | n = 31 | n = 31 | P value < 0.001 |
| Garry 2004 | n = 584 | n = 292 | — |
| Hwang 2002 | n = 30 | n = 30 | Not tested separately |
| Langebrekke 1996 | n = 46 | n = 54 | P value < 0.001 |
| Muzii 2007 | n = 40 median = 2 days range (1 to 3) | n = 41 median = 3 days range = (1 to 5) | P value = 0.53 |
| Persson 2006 | n = 63 | n = 56 | P value = 0.0006 In the same population (described in Persson 2008), duration of sick leave was associated with the occurrence of postoperative complications but not with stress‐coping ability |
| Raju 1994 | n = 40 | n = 40 | P value < 0.0001 |
| Ribeiro 2003 | n = 20 | n = 20 | — |
| Schutz 2002 | n = 28 | n = 20 | — |
| Yuen 1998 | n = 20 | n = 24 | P value < 0.001 |
Comparison 2 LH versus AH, Outcome 26 Length of hospital stay (descriptive data).
| Study | Description | LH | AH | Conclusions |
| Pain scales | ||||
| Ellstrom 1998 | Pain during rest and when coughing. 100 mm visual analogue scale, endpoints 'no pain' and 'worst pain possible'. Day 0, Day 1 (10am and 6pm) and Day 2 | n = 40 | n = 40 | Lower pain score following LAVH compared to AH at 10am on 1st and 2nd day when coughing (P value < 0.05 and P value < 0.01 respectively). No significant difference with the pain scores at rest |
| Falcone 1999 | Weekly visual analogue scales for pain (from "no pain" to "most severe pain". Reported in graph form | n = 22 | n = 20 | No significant difference in change over time (group by time interaction) between groups. No difference in mean pain scores over the postoperative interval (P value = 0.38). The number of weeks before a pain score of less than 1 was recorded was not significantly different between the 2 groups (P value = 0.95) |
| Garry 2004 | Daily diary using a visual analogue scale, scored on day 0 (operation day), and days 2, 7 and 21. Analysis of covariance used to adjust pain scores over days 0 to 6 by the number of days that opiates were used | VH: n = 168 | AH: n = 292 | A higher proportion of AH participants used opiates than aLH. AH is more painful than aLH and LH has a tendency to be less painful than vLH |
| Marana 1999 | 10‐point visual analogue scale. Evaluation of pain on postoperative days 1, 2 and 3 | n = 58 | n = 58 | Significant difference between 2 groups at 3 evaluations. Lower pain score following LAVH compared to AH |
| Muzii 2007 | VAS scores (no further description) Postoperative day 1 and 2 | n = 40 Day 1 median = 2.8 Range (0 to 6) Day 2 median = 0.8 Range (0 to 3.7) | n = 41 Day 1 median = 4.4 Range (2 to 6.2) Day 2 median = 2.9 Range (2 to 5.5) | Day 1 P value < 0.05 Day 2 P value < 0.05 |
| Olsson 1996 | Visual analogue scale (range 0 to 7), 2 days after surgery | n = 71 | n = 72 | Postoperative pain 2 days after surgery was significantly less following LAVH compared to AH |
| Perino 1999 | 10‐point visual analogue scale, 0 = no pain to 10 = maximum pain. Assessed pain for 3 days after surgery | n = 51 | n = 51 | Participants who underwent LH had less intense postoperative pain than those in the AH group |
| Schutz 2002 | 10‐point visual analogue scale on days 1, 3 and 5. Pain index on 4th postoperative day (WHO scale) | n = 28 | n = 20 | Pain index was 0 on postoperative day 4 in the LH group and 5 in the AH group, LH was significantly less painful than AH |
| Postoperative analgesics | ||||
| Falcone 1999 | Length of time PCA pump was required (hours) and number of narcotic (oxycodone) or acetaminophen pills used in the hospital and after discharge was recorded | n = 23 | n = 21 | Participants in the LH group required less PCA time |
| Ferrari 2000 | Analgesic requirement recorded daily for 3 groups (number who require analgesia for more than 24 hours after surgery): | Group 1: n = 31 | Group 1: n = 31. Median = 24, n% = 77, P value < 0.001. | LAVH was associated with a significantly lower administration of analgesics after the first 24 postoperative hours. Group 2, uteri weighing less than 500 g, LAVH was associated with less analgesic administration |
| Kluivers 2007 | Number of participants receiving opioids during the first 3 days after surgery were recorded | n = 27 | n = 32 | Less women in LH versus AH group required opioids (P value < 0.01) |
| Langebrekke 1996 | Number of participants receiving analgesics (parenterally, oral and rectal analgesics) during the hospital stay and 5 days postoperatively | n = 46 | n = 54 | The need for both kinds of analgesics was reduced in the LH group |
| Raju 1994 | Duration of postoperative analgesia (days) | n = 40 | n = 40 | Participants in the LAVH group required fewer days of analgesia than participants in the AH group |
| Summitt 1998 | Use of intramuscular narcotics and oral pain medication | n = 34 | n = 31 | A statistically greater number of patients in the AH group required IM narcotics on the day of surgery compared to those in the LH group |
| Recovery from pain (days) | ||||
| Raju 1994 | Number of days until participants are free from pain | n = 40 | n = 40 | Participants who had LAVH recovered from pain quicker than those who had AH |
Comparison 2 LH versus AH, Outcome 27 Pain relief (descriptive data).
| Study | Description | LH | AH | Comments |
| Ellstrom 1998 | Analysis of cost over a period of 12 weeks, starting on the day the participant entered the hospital. Direct costs (hospital costs) and indirect costs (loss of production value) were analysed separately. Units of currency = Swedish crowns (SEK) | n = 38 | n = 38 | The change in costs between LH and AH are negligible as approximately 50% of hospital costs are fixed costs |
| Falcone 1999 | Hospital costs (amount a provider must pay for goods and services) were assessed through the hospital accounting system. The direct and indirect costs were calculated for each patient from 3 different components: operating room costs, anaesthesia costs and ward costs | n = 24 | n = 24 | Total hospital costs were not significantly higher in the LH group than the AH group |
| Lumsden 2000 | Single set of unit costs applied to each unit of resource to provide a NHS cost for each woman. 1997/98 prices | n = 95 | n = 95 | AH had significantly lower total costs than LH, resulting principally from the difference in operation costs. When the cost of disposable equipment was removed, the difference was non‐significant |
| Raju 1994 | Cost analysis of each type of procedure on the major points of difference between either operation: cost of disposable consumables and the comparative costs of postoperative lengths of stay in hospital | n = 40 | n = 40 | — |
| Summitt 1998 | Hospital charges for both groups | n = 34 | n = 31 | Lack of a statistical difference in total hospital charges |
Comparison 2 LH versus AH, Outcome 28 Cost (descriptive data).

Comparison 3 LH versus VH, Outcome 1 Return to normal activities (days).

Comparison 3 LH versus VH, Outcome 2 Ureter injury.

Comparison 3 LH versus VH, Outcome 3 Bladder injury.
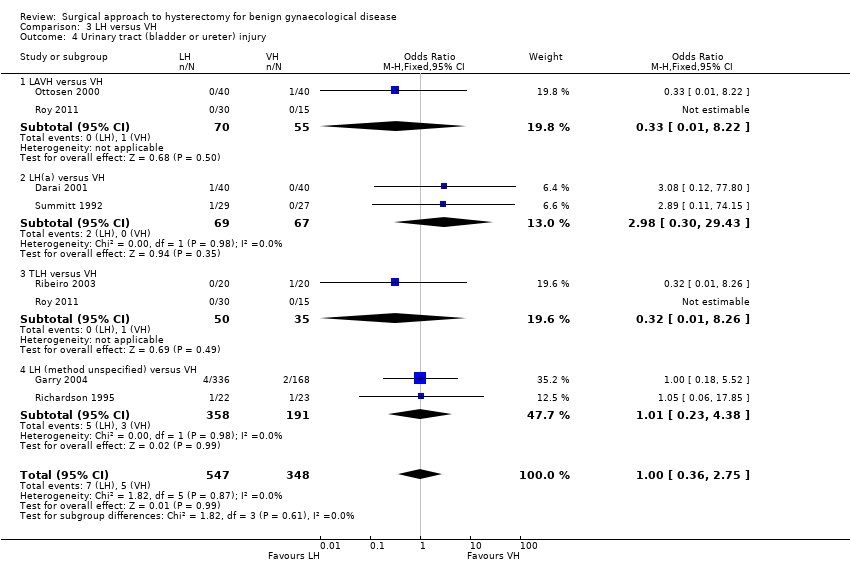
Comparison 3 LH versus VH, Outcome 4 Urinary tract (bladder or ureter) injury.
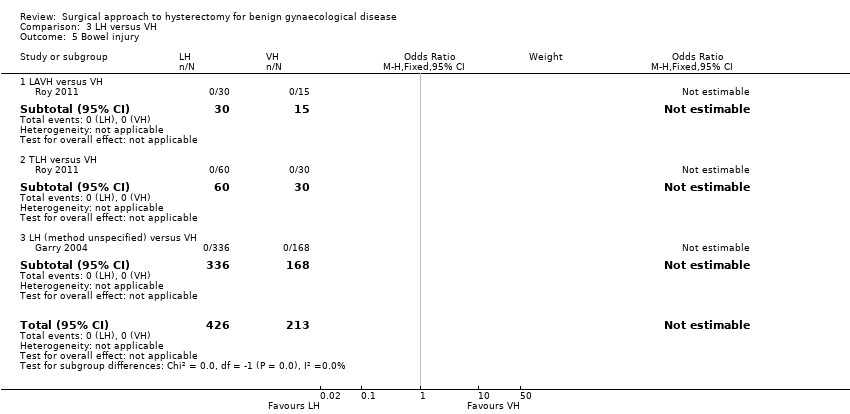
Comparison 3 LH versus VH, Outcome 5 Bowel injury.

Comparison 3 LH versus VH, Outcome 6 Vascular injury.

Comparison 3 LH versus VH, Outcome 7 Fistula.

Comparison 3 LH versus VH, Outcome 8 Urinary dysfunction.
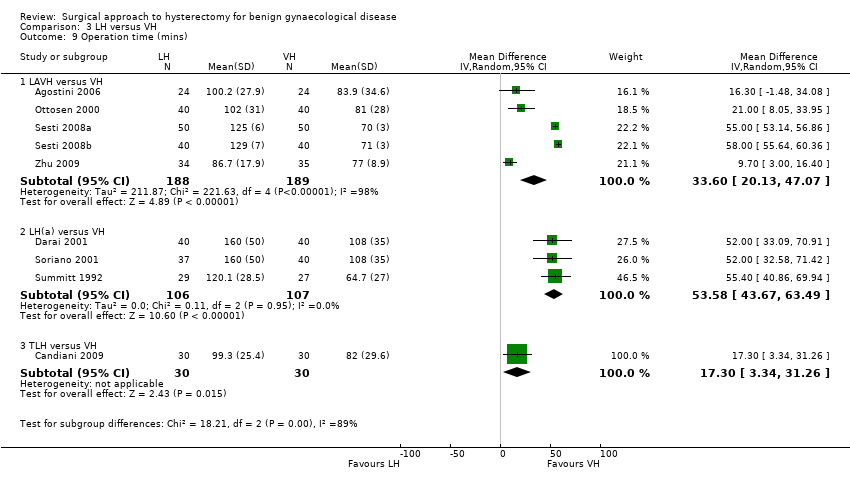
Comparison 3 LH versus VH, Outcome 9 Operation time (mins).
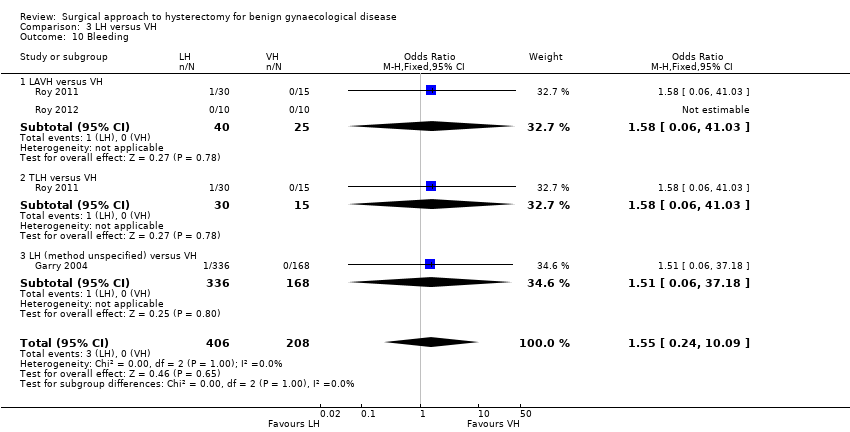
Comparison 3 LH versus VH, Outcome 10 Bleeding.

Comparison 3 LH versus VH, Outcome 11 Transfusion.

Comparison 3 LH versus VH, Outcome 12 Pelvic haematoma.

Comparison 3 LH versus VH, Outcome 13 Unintended laparotomy.

Comparison 3 LH versus VH, Outcome 14 Vaginal cuff infection.
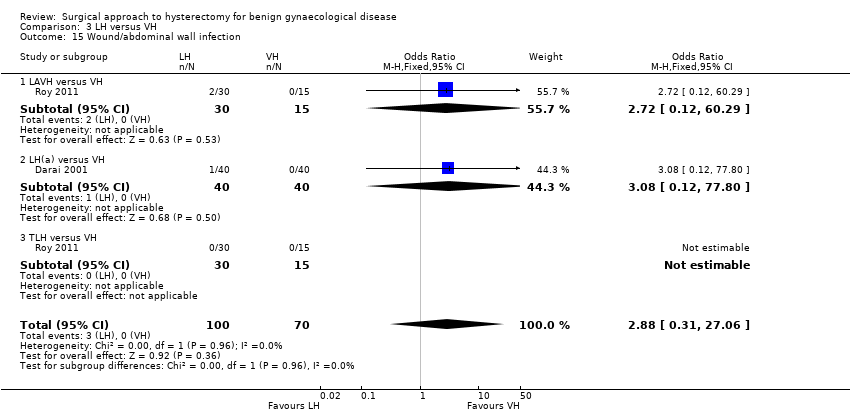
Comparison 3 LH versus VH, Outcome 15 Wound/abdominal wall infection.

Comparison 3 LH versus VH, Outcome 16 Urinary tract infection.
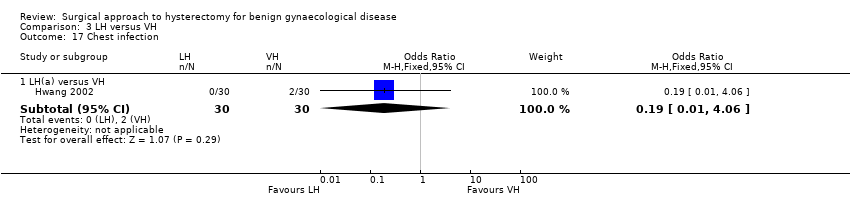
Comparison 3 LH versus VH, Outcome 17 Chest infection.

Comparison 3 LH versus VH, Outcome 18 Febrile episodes or unspecified infection.
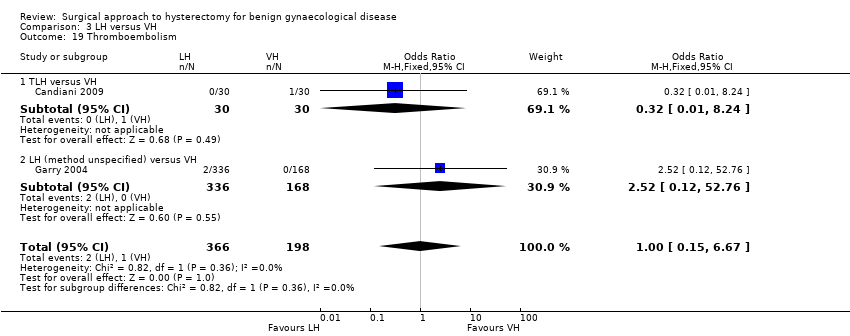
Comparison 3 LH versus VH, Outcome 19 Thromboembolism.
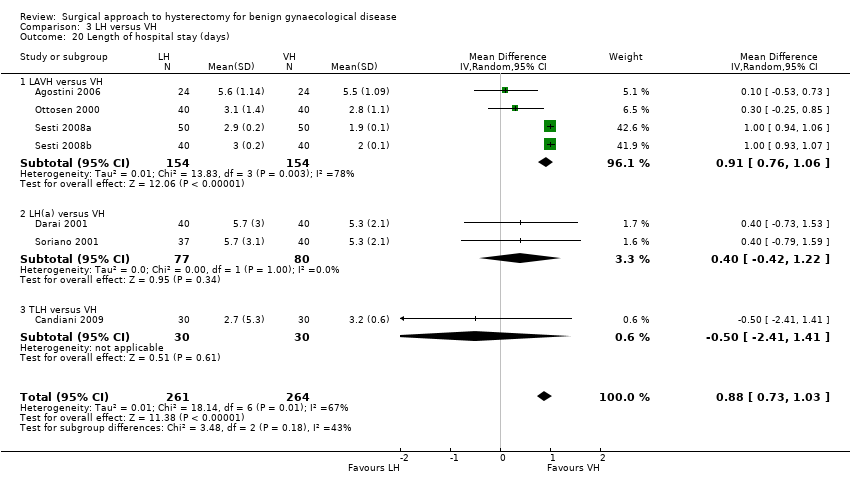
Comparison 3 LH versus VH, Outcome 20 Length of hospital stay (days).
| Study | LH | VH | Comments |
| Richardson 1995 | n = 22 | n = 23 | |
| Roy 2011 | TLH: n = 30 median = 15 days min‐max = 7 to 30 days LAVH: n = 30 median = 20 days min‐max = 8 to 40 days | n = 30 median = 14 days min‐max = 7 to 25 days | P value = 0.7 |
| Roy 2012 | n = 10 median = 20 days min‐max = 10 to 30 days | n = 10 median = 16 days min‐max = 12 to 24 days | P value = 0.05 |
Comparison 3 LH versus VH, Outcome 21 Return to normal activities (descriptive data).
| Study | Description | LH | VH | Comment |
| Roy 2011 | Patient satisfaction was evaluated using HRQOL (Health Related Quality Of Life) questionnaire and SF‐12 (12‐item Short Form health survey) and follow‐up visits in outpatient clinic were done at 1, 3 and 6 months | TLH: n = 30 LAVH: n = 30 | n = 30 | After 6 months of surgery, there was significant higher satisfaction rate among patients who underwent TLH and NDVH (non‐descent vaginal hysterectomy) than those who underwent LAVH (P value = 0.003). The satisfaction was similar between the TLH and NDVH group |
Comparison 3 LH versus VH, Outcome 22 Long‐term outcomes: quality of life (descriptive data).
| Study | LH | VH | Comments |
| Hwang 2002 | With 2nd proc: | With 2nd proc: | Kruskal Wallis test: |
| Ribeiro 2003 | n = 20 | n = 20 | — |
| Richardson 1995 | n = 22 | n = 23 | Some of these cases include oophorectomies. Oophorectomy (mean): LH 129.7 mins, VH 95.3 mins; no oophorectomy (mean): LH 132.7 mins, VH 64.7 mins |
| Roy 2012 | n = 10 median = 90 mins min‐max = 60 to 165 mins | n = 10 median = 75 min‐max = 40 to 105 | Not statistically significant |
Comparison 3 LH versus VH, Outcome 23 Operation time (descriptive data).
| Study | LH | VH | Comments |
| Hwang 2002 | n = 30 | n = 30 | Not tested separately |
| Richardson 1995 | n = 22 | n = 23 | — |
| Roy 2011 | TLH: n = 30 median = 2 days min‐max = 2 to 12 days LAVH: n = 30 median = 3 days min‐max = 4 days | VH: n = 30 median = 2 days min‐max = 1 to 4 days | P value = 0.15 |
| Roy 2012 | n = 10 median = 3 days min‐max = 2 to 4 days | n = 10 median = 2 days min‐max = 2 to 4 days | Not statistically significant |
Comparison 3 LH versus VH, Outcome 24 Length of hospital stay (descriptive data).
| Study | Description | LH | VH | Conclusion |
| Pain scales | ||||
| Ghezzi 2010 | VAS pain scores at several times post surgery | n = 41 VAS score after 1 h: mean = 4.7, SD = 2.6 VAS score after 3 h: mean = 3.2, SD = 2.5 VAS score after 8 h: mean = 2.1, SD = 2.2 VAS score after 24 h: mean = 1.8, SD = 1.7 | n = 41 VAS score after 1 h: mean = 7.8, SD = 1.7 VAS score after 3 h: mean = 6.6, SD = 2.0 VAS score after 8 h: mean = 5.3, SD = 2.1 VAS score after 24 h: mean = 3.6, SD = 2.6 | P value < 0.0001 P value < 0.0001 P value < 0.0001 P value = 0.001 |
| Sesti 2008b | VAS pain 24 hours post surgery | 6 patients (15%) reported absence of pain 24 hours post surgery | 20 patients (50%) reported absence of pain (VAS = 0) 24 hours post surgery | Patients undergoing LAVH had more postoperative pain compared with patients undergoing VH |
| Postoperative analgesics | ||||
| Ghezzi 2010 | The need for additional use of analgesics after the operation | n = 41 7 (17.1%) | n = 41 32 (78.0%) | P value < 0.0001 |
| Richardson 1995 | The number of postoperative opoid injections and the number of days analgesia was required was recorded | n = 22 | n = 23 | The number of opoid injections and analgesia requirements were similar in each group |
| Soriano 2001 | Total consumption of paracetamol, NSAID and subcutaneous opoid | n = 37 | n = 40 | No significant difference in the total consumption of paracetamol, NSAID and subcutaneous opoid between the 2 groups |
| Summitt 1992 | Pain control was assessed by documenting the intramuscular narcotic use on the day of surgery and the number of pain tablets used on the day of surgery and the first 2 postoperative days | n = 28 | n = 27 | — |
Comparison 3 LH versus VH, Outcome 25 Pain relief (descriptive data).
| Study | Description | LH | VH |
| Summitt 1992 | Mean total hospital charge when surgery was performed on an outpatient basis. Charges consisted of: operating room fee, operating room time, anaesthesia time, charges for disposable staples, scissors, graspers and a charge for recovery in the ambulatory surgery unit, including laboratory fees | n = 29 | n = 27 |
Comparison 3 LH versus VH, Outcome 26 Cost (descriptive data).
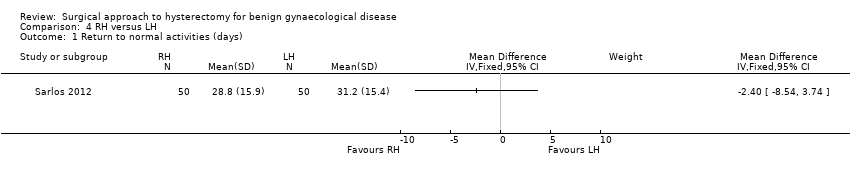
Comparison 4 RH versus LH, Outcome 1 Return to normal activities (days).

Comparison 4 RH versus LH, Outcome 2 Intraoperative visceral injury (dichotomous).

Comparison 4 RH versus LH, Outcome 3 Operation time.
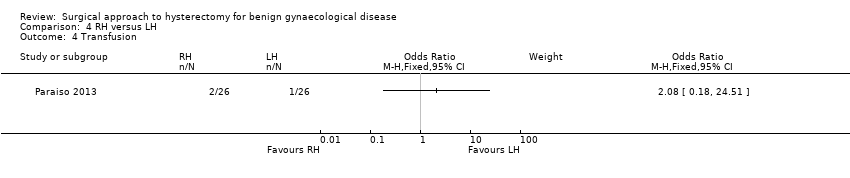
Comparison 4 RH versus LH, Outcome 4 Transfusion.
| Study | Description | RH | LH | Comment |
| Paraiso 2013 | Percentage to return to normal baseline activities at 1, 2, 3, 4, 5 and 6 weeks postoperatively | 1 week (n = 17): 22% 2 weeks (n = 17): 46% 3 weeks (n = 17): 54% 4 weeks (n = 17): 60% 5 weeks (n = 17): 66% 6 weeks (n = 16): 72% | 1 week (n = 19): 29% 2 weeks (n = 19): 46% 3 weeks (n = 18): 58% 4 weeks (n = 18): 64% 5 weeks (n = 17): 73% 6 weeks (n = 17): 82% | P value (overall) = 0.25 |
Comparison 4 RH versus LH, Outcome 5 Return to normal activities (descriptive data).

Comparison 5 SP‐LH versus LH, Outcome 1 Bladder injury.

Comparison 5 SP‐LH versus LH, Outcome 2 Operation time (mins).
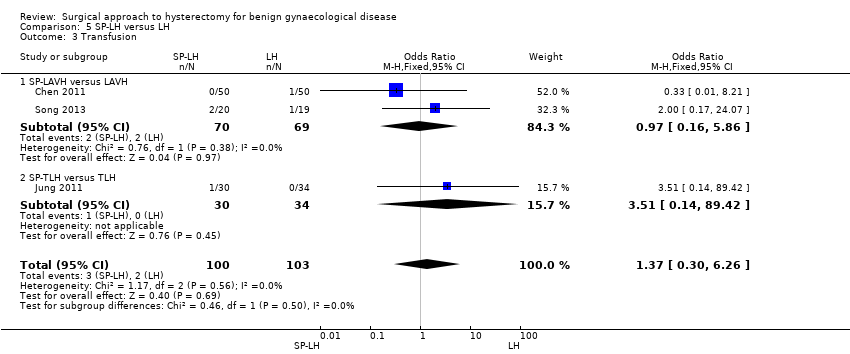
Comparison 5 SP‐LH versus LH, Outcome 3 Transfusion.
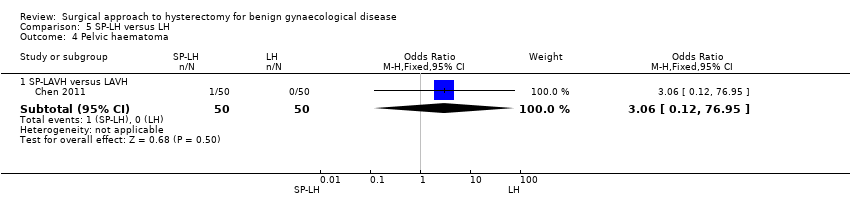
Comparison 5 SP‐LH versus LH, Outcome 4 Pelvic haematoma.
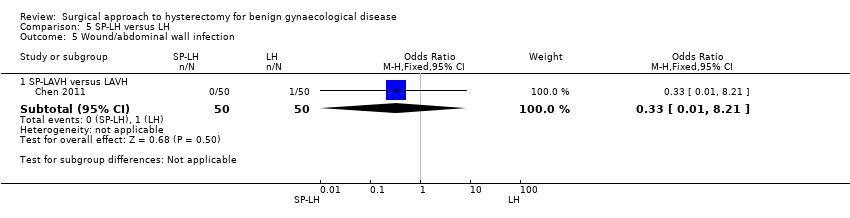
Comparison 5 SP‐LH versus LH, Outcome 5 Wound/abdominal wall infection.

Comparison 5 SP‐LH versus LH, Outcome 6 Febrile episodes or unspecified infection.

Comparison 5 SP‐LH versus LH, Outcome 7 Postoperative ileus.

Comparison 5 SP‐LH versus LH, Outcome 8 Length of hospital stay (days).
| Study | SP‐LH | Conventional LH | Comments |
| Song 2013 | n = 20 SP‐LAVH Mean = 92 min Range 57 to 220 min | n = 19 LAVH Mean = 95 min Range 70 to 154 min | P value = 0.47 |
Comparison 5 SP‐LH versus LH, Outcome 9 Operation time (descriptive data).
| Study | SP‐LH | LAVH | Comments |
| Jung 2011 | n = 30 SP‐TLH Median postoperative hospital stay = 3.4 days Range 3.0 to 4.3 days | n = 34 TLH Median postoperative hospital stay = 3.0 days Range 3.0 to 3.0 days | P value = 0.075 |
| Song 2013 | n = 20 SP‐LAVH Mean = 3 days Range 2 to 4 days | n = 19 LAVH Mean = 3 days Range 2 to 4 days | P value = 0.95 |
Comparison 5 SP‐LH versus LH, Outcome 10 Length of hospital stay (descriptive data).

Comparison 6 TLH versus LAVH, Outcome 1 Intraoperative visceral injury (dich).

Comparison 6 TLH versus LAVH, Outcome 2 Long‐term complications (dich).
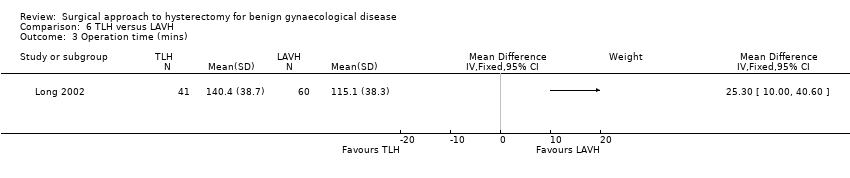
Comparison 6 TLH versus LAVH, Outcome 3 Operation time (mins).

Comparison 6 TLH versus LAVH, Outcome 4 Short‐term outcomes (dich).
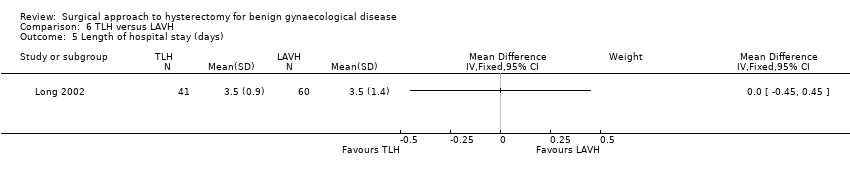
Comparison 6 TLH versus LAVH, Outcome 5 Length of hospital stay (days).
| Study | Mini‐TLH | Conventional TLH | Comments |
| Ghezzi 2011 | n = 38 Median = 58 mins Range: 30 to 135 mins | n = 38 Median = 60 mins Range: 30 to 155 mins | P value = 0.55 |
Comparison 7 Mini‐LH versus TLH, Outcome 1 Operation time (descriptive data).
| Study | mini‐TLH | Conventional TLH | Comment |
| Ghezzi 2011 | n = 38 Median = 1 day Range: 0 to 2 | n = 38 Median = 1 day Range: 1 to 2 | P value = 0.73 |
Comparison 7 Mini‐LH versus TLH, Outcome 2 Length of hospital stay (descriptive data).
| Vaginal hysterectomy versus abdominal hysterectomy for benign gynaecological disease | ||||||
| Patient or population: patients with benign gynaecological disease | ||||||
| Outcomes | Illustrative comparative risks* (95% CI) | Relative effect | No of participants | Quality of the evidence | Comments | |
| Assumed risk | Corresponding risk | |||||
| Abdominal hysterectomy | Vaginal hysterectomy | |||||
| Return to normal activities (days) | The mean return to normal activities (days) in the AH group was | The mean return to normal activities (days) in the VH group was | — | 176 | ⊕⊕⊕⊝ | — |
| Urinary tract (bladder or ureter) injury | 0 per 1000 | 0 per 1000 | OR 3.09 | 439 | ⊕⊕⊕⊝ | There were no urinary tract injuries in one study |
| *The basis for the assumed risk is the median control group risk across studies. The corresponding risk (and its 95% confidence interval) is based on the assumed risk in the comparison group and the relative effect of the intervention (and its 95% CI). | ||||||
| GRADE Working Group grades of evidence | ||||||
| 1There was a large difference in return to normal activities between the different studies; the analysis had high heterogeneity (I2 = 75%) but consistent direction of effect. | ||||||
| Laparoscopic hysterectomy versus abdominal hysterectomy for benign gynaecological disease | ||||||
| Patient or population: patients with benign gynaecological disease | ||||||
| Outcomes | Illustrative comparative risks* (95% CI) | Relative effect | No of participants | Quality of the evidence | Comments | |
| Assumed risk | Corresponding risk | |||||
| Abdominal hysterectomy | Laparoscopic hysterectomy | |||||
| Return to normal activities (days) | The mean return to normal activities (days) in the AH group was | The mean return to normal activities (days) in the LH group was | — | 520 | ⊕⊕⊝⊝ | — |
| Urinary tract (bladder or ureter) injury | 10 per 1000 | 24 per 1000 | OR 2.44 | 2140 | ⊕⊕⊝⊝ | — |
| Bowel injury | 7 per 1000 | 1 per 1000 | OR 0.21 | 1175 | ⊕⊕⊕⊝ | — |
| Vascular injury | 9 per 1000 | 16 per 1000 | OR 1.76 | 956 | ⊕⊕⊕⊝ | — |
| Bleeding | 16 per 1000 | 6 per 1000 | OR 0.45 | 1266 | ⊕⊕⊝⊝ | — |
| *The basis for the assumed risk is the median control group risk across studies. The corresponding risk (and its 95% confidence interval) is based on the assumed risk in the comparison group and the relative effect of the intervention (and its 95% CI). | ||||||
| GRADE Working Group grades of evidence | ||||||
| 1In some studies there was doubt about the method used for random sequence generation or allocation of patients. Furthermore, one study did not perform an intention‐to‐treat analysis. | ||||||
| Laparoscopic hysterectomy versus vaginal hysterectomy for benign gynaecological disease | ||||||
| Patient or population: patients with benign gynaecological disease | ||||||
| Outcomes | Illustrative comparative risks* (95% CI) | Relative effect | No of participants | Quality of the evidence | Comments | |
| Assumed risk | Corresponding risk | |||||
| Vaginal hysterectomy | Laparoscopic hysterectomy | |||||
| Return to normal activities (days) | The mean return to normal activities (days) in the VH group was | The mean return to normal activities (days) in the LH group was | — | 140 | ⊕⊕⊕⊝ | — |
| Urinary tract (bladder or ureter) injury | 16 per 1000 | 16 per 1000 | OR 1.0 | 865 | ⊕⊕⊝⊝ | — |
| Vascular injury | 12 per 1000 | 18 per 1000 | OR 1.58 | 745 | ⊕⊕⊝⊝ | — |
| Bleeding | 29 per 1000 | 25 per 1000 | OR 2.45 | 644 | ⊕⊕⊝⊝ | — |
| Unintended laparotomy | 24 per 1000 | 37 per 1000 | OR 1.55 | 1160 | ⊕⊕⊝⊝ | — |
| *The basis for the assumed risk is the median control group risk across studies. The corresponding risk (and its 95% confidence interval) is based on the assumed risk in the comparison group and the relative effect of the intervention (and its 95% CI). | ||||||
| GRADE Working Group grades of evidence | ||||||
| 1Wide confidence intervals crossing the line of no effect. | ||||||
| Type of LH | LH versus AH RCTs | LH versus VH RCTs | LH versus LH RCTs |
| LAVH | Ferrari 2000 | Agostini 2006 | Chen 2011 |
| Kunz 1996 | Ottosen 2000 | Roy 2011 | |
| Marana 1999 | Roy 2011 | Song 2013 | |
| Muzii 2007 | Roy 2012 | ||
| Ottosen 2000 | Sesti 2008(a) | ||
| Raju 1994b | Sesti 2008(b) | ||
| Sesti 2008(a) | |||
| Tsai 2003 | |||
| LH(a) | Ellstrom 1998 | Darai 2001 | |
| Falcone 1999 | Hwang 2002 | ||
| Harkki‐Siren 2000 | Soriano 2001 | ||
| Hwang 2002 | Summitt 1992 | ||
| Langebrekke 1998 | Zhu 2009 | ||
| Olsson 1996 | |||
| Persson 2006 | |||
| Schutz 2002 | |||
| Seracchioli 2002 | |||
| Summitt 1998 | |||
| Yuen 1998 | |||
| Zhu 2009 | |||
| TLH | Kluivers 2007 | Candiani 2009 | Ghezzi 2011 |
| Perino 1999 | Ghezzi 2010 | Jung 2011 | |
| Ribeiro 2003 | Morelli 2007 | Paraiso 2013 | |
| Ribeiro 2003 | Roy 2011 | ||
| Roy 2011 | Sarlos 2012 | ||
| Non‐categorisable LH | Garry 2004 | Garry 2004 | |
| Kongwattanakul 2012 | Richardson 1998 | ||
| Lumsden 2000 | |||
| AH: abdominal hysterectomy | |||
| Stage | Laparoscopic content |
| 0 | Laparoscopy done but no laparoscopic procedure before vaginal hysterectomy |
| 1 | Procedure includes laparoscopic adhesiolysis and/or excision of endometriosis |
| 2 | Either or both adnexa freed laparoscopically |
| 3 | Bladder dissected from the uterus laparoscopically |
| 4 | Uterine artery transected laparoscopically |
| 5 | Anterior and/or posterior colpotomy or entire uterus freed laparoscopically |
| Step | Laparoscopic content |
| 1 | Severing the round ligaments and dissection of the upper portion of the broad ligament |
| 2 | Severing the tubo‐uterine junction and the utero‐ovarian ligament if the adnexa are to be preserved, or severing the infundibulopelvic ligaments |
| 3 | Severing the uterine vessels |
| 4 | Preparation of the bladder flap |
| 5 | Severing the cardinal uterosacral ligaments complex |
| 6 | Performing anterior and posterior culdotomy and separation of the cervix |
| 7 | Closure of the vaginal cuff |
| Trial | No. dropouts | Details |
| Chen 2011 | 2 | Excluded from analysis postoperatively, because they underwent accessory adnexal surgery |
| Falcone 1999 | 4 (1 LH; 3 AH) | Withdrew pre‐operatively |
| Garry 2004 | 34 (23 LH (11 aLH; 12 vLH); 6 AH; 5 VH) | Withdrew pre‐operatively |
| Long 2002 | 13 | 3 laparotomy conversions were excluded from analysis; 7 incomplete records; 3 combined procedures that were excluded post‐randomisation |
| Lumsden 2000 | 10 | 10 dropouts were not analysed. 7 women did not attend surgery and 3 records were not available |
| Kluivers 2007 | 1 | Refused assignment procedure |
| Lumsden 2000 | 10 | 7 withdrew pre‐operatively; 3 case records not available |
| Paraiso 2013 | 6 | 6 withdrew after randomisation but before the intervention was performed |
| Persson 2006 | 6 | 5 allocated to AH and 1 to LH withdrew after informed consent prior to the operation or withdrew in the postoperative period before the 5‐week follow‐up |
| Roy 2011 | 9 | 5 excluded because they needed adenectomy during surgery and 4 excluded from all analyses because they did not show up for follow‐up after intervention |
| Roy 2012 | 1 | 1 LH patient excluded from analysis due to conversion |
| Sarlos 2012 | 5 | After randomisation 5 did not complete the study and were excluded from the analysis |
| Song 2013 | 1 | 1 lost to follow‐up because of dissatisfaction with hospital care |
| Summitt 1998 | 2 | Refused assignment procedure |
| Yuen 1998 | 6 | 4 declined operation; 2 refused to participate postoperatively |
| AH: abdominal hysterectomy | ||
| Outcome or subgroup title | No. of studies | No. of participants | Statistical method | Effect size |
| 1 Return to normal activities (days) Show forest plot | 3 | 176 | Mean Difference (IV, Random, 95% CI) | ‐12.33 [‐19.89, ‐4.77] |
| 2 Long‐term outcomes: satisfaction (dichotomous) Show forest plot | 1 | Odds Ratio (M‐H, Fixed, 95% CI) | Subtotals only | |
| 3 Intraoperative visceral injury (dichotomous) Show forest plot | 4 | Odds Ratio (M‐H, Fixed, 95% CI) | Subtotals only | |
| 3.1 Bladder injury | 4 | 439 | Odds Ratio (M‐H, Fixed, 95% CI) | 3.09 [0.48, 19.97] |
| 3.2 Ureter injury | 1 | 119 | Odds Ratio (M‐H, Fixed, 95% CI) | 0.0 [0.0, 0.0] |
| 3.3 Urinary tract (bladder or ureter) injury | 4 | 439 | Odds Ratio (M‐H, Fixed, 95% CI) | 3.09 [0.48, 19.97] |
| 3.4 Bowel injury | 2 | 319 | Odds Ratio (M‐H, Fixed, 95% CI) | 0.0 [0.0, 0.0] |
| 3.5 Vascular injury | 1 | 119 | Odds Ratio (M‐H, Fixed, 95% CI) | 0.0 [0.0, 0.0] |
| 4 Long‐term complications (dichotomous) Show forest plot | 1 | Odds Ratio (M‐H, Fixed, 95% CI) | Subtotals only | |
| 4.1 Urinary dysfunction | 1 | 80 | Odds Ratio (M‐H, Fixed, 95% CI) | 0.0 [0.0, 0.0] |
| 5 Operation time (mins) Show forest plot | 4 | Mean Difference (IV, Random, 95% CI) | Subtotals only | |
| 5.1 VH versus standard AH | 3 | 259 | Mean Difference (IV, Random, 95% CI) | ‐11.01 [‐35.09, 13.08] |
| 5.2 VH versus minilaparotomy AH | 1 | 100 | Mean Difference (IV, Random, 95% CI) | ‐63.0 [‐65.11, ‐60.89] |
| 6 Short‐term outcomes (dichotomous) Show forest plot | 6 | Odds Ratio (M‐H, Fixed, 95% CI) | Subtotals only | |
| 6.1 Transfusion | 5 | 495 | Odds Ratio (M‐H, Fixed, 95% CI) | 0.82 [0.34, 1.96] |
| 6.2 Pelvic haematoma | 5 | 535 | Odds Ratio (M‐H, Fixed, 95% CI) | 0.99 [0.34, 2.89] |
| 6.3 Vaginal cuff infection | 2 | 140 | Odds Ratio (M‐H, Fixed, 95% CI) | 3.08 [0.12, 77.80] |
| 6.4 Wound/abdominal wall infection | 3 | 355 | Odds Ratio (M‐H, Fixed, 95% CI) | 0.21 [0.04, 1.00] |
| 6.5 UTI | 3 | 176 | Odds Ratio (M‐H, Fixed, 95% CI) | 0.59 [0.08, 4.61] |
| 6.6 Chest infection | 1 | 60 | Odds Ratio (M‐H, Fixed, 95% CI) | 1.0 [0.13, 7.60] |
| 6.7 Febrile episodes or unspecified infection | 5 | 495 | Odds Ratio (M‐H, Fixed, 95% CI) | 0.62 [0.36, 1.08] |
| 6.8 Thromboembolism | 1 | 119 | Odds Ratio (M‐H, Fixed, 95% CI) | 0.0 [0.0, 0.0] |
| 7 Length of hospital stay (days) Show forest plot | 5 | Mean Difference (IV, Fixed, 95% CI) | Subtotals only | |
| 7.1 VH versus standard AH | 4 | 295 | Mean Difference (IV, Fixed, 95% CI) | ‐1.07 [‐1.22, ‐0.92] |
| 7.2 VH versus minilaparotomy AH | 1 | 100 | Mean Difference (IV, Fixed, 95% CI) | ‐2.1 [‐2.19, ‐2.01] |
| 8 All outcomes, descriptive data Show forest plot | Other data | No numeric data | ||
| 8.1 Quality of life (descriptive data) | Other data | No numeric data | ||
| 8.2 Operation time (descriptive data) | Other data | No numeric data | ||
| 8.3 Length of hospital stay (descriptive data) | Other data | No numeric data | ||
| Outcome or subgroup title | No. of studies | No. of participants | Statistical method | Effect size |
| 1 Return to normal activities (days) Show forest plot | 6 | Mean Difference (IV, Fixed, 95% CI) | Subtotals only | |
| 1.1 LAVH versus AH | 1 | 80 | Mean Difference (IV, Fixed, 95% CI) | ‐8.40 [‐12.15, ‐4.65] |
| 1.2 LH(a) versus AH | 5 | 440 | Mean Difference (IV, Fixed, 95% CI) | ‐15.17 [‐17.21, ‐13.14] |
| 2 Satisfaction Show forest plot | 1 | Odds Ratio (M‐H, Fixed, 95% CI) | Totals not selected | |
| 2.1 LH (method unspecified) versus AH | 1 | Odds Ratio (M‐H, Fixed, 95% CI) | 0.0 [0.0, 0.0] | |
| 3 Bladder injury Show forest plot | 12 | 2038 | Odds Ratio (M‐H, Fixed, 95% CI) | 1.89 [0.91, 3.90] |
| 3.1 LAVH versus AH | 3 | 396 | Odds Ratio (M‐H, Fixed, 95% CI) | 1.0 [0.14, 7.17] |
| 3.2 LH(a) versus AH | 4 | 427 | Odds Ratio (M‐H, Fixed, 95% CI) | 2.02 [0.49, 8.24] |
| 3.3 TLH versus AH | 2 | 99 | Odds Ratio (M‐H, Fixed, 95% CI) | 0.58 [0.05, 6.73] |
| 3.4 LH (method unspecified) versus AH | 3 | 1116 | Odds Ratio (M‐H, Fixed, 95% CI) | 2.65 [0.88, 7.93] |
| 4 Ureter injury Show forest plot | 7 | 1417 | Odds Ratio (M‐H, Fixed, 95% CI) | 3.46 [0.94, 12.71] |
| 4.1 LH(a) versus AH | 1 | 100 | Odds Ratio (M‐H, Fixed, 95% CI) | 6.12 [0.29, 130.87] |
| 4.2 TLH versus AH | 3 | 201 | Odds Ratio (M‐H, Fixed, 95% CI) | 3.35 [0.34, 32.97] |
| 4.3 LH (method unspecified) versus AH | 3 | 1116 | Odds Ratio (M‐H, Fixed, 95% CI) | 2.82 [0.44, 18.03] |
| 5 Urinary tract (bladder or ureter) injury Show forest plot | 13 | 2140 | Odds Ratio (M‐H, Fixed, 95% CI) | 2.44 [1.24, 4.80] |
| 5.1 LAVH versus AH | 3 | 396 | Odds Ratio (M‐H, Fixed, 95% CI) | 1.0 [0.14, 7.17] |
| 5.2 LH(a) versus AH | 4 | 427 | Odds Ratio (M‐H, Fixed, 95% CI) | 2.79 [0.73, 10.68] |
| 5.3 TLH versus AH | 3 | 201 | Odds Ratio (M‐H, Fixed, 95% CI) | 1.61 [0.30, 8.63] |
| 5.4 LH (method unspecified) versus AH | 3 | 1116 | Odds Ratio (M‐H, Fixed, 95% CI) | 3.13 [1.12, 8.78] |
| 6 Bowel injury Show forest plot | 4 | 1175 | Odds Ratio (M‐H, Fixed, 95% CI) | 0.21 [0.03, 1.33] |
| 6.1 LAVH versus AH | 1 | 50 | Odds Ratio (M‐H, Fixed, 95% CI) | 0.32 [0.01, 8.25] |
| 6.2 TLH versus AH | 1 | 59 | Odds Ratio (M‐H, Fixed, 95% CI) | 0.0 [0.0, 0.0] |
| 6.3 LH (method unspecified) versus AH | 2 | 1066 | Odds Ratio (M‐H, Fixed, 95% CI) | 0.17 [0.02, 1.60] |
| 7 Vascular injury Show forest plot | 2 | 956 | Odds Ratio (M‐H, Fixed, 95% CI) | 1.76 [0.52, 5.87] |
| 7.1 LAVH versus AH | 1 | 80 | Odds Ratio (M‐H, Fixed, 95% CI) | 5.26 [0.24, 113.11] |
| 7.2 LH (method unspecified) versus AH | 1 | 876 | Odds Ratio (M‐H, Fixed, 95% CI) | 1.34 [0.35, 5.08] |
| 8 Fistula Show forest plot | 2 | 245 | Odds Ratio (M‐H, Fixed, 95% CI) | 3.07 [0.32, 29.96] |
| 8.1 LH(a) versus AH | 1 | 143 | Odds Ratio (M‐H, Fixed, 95% CI) | 3.09 [0.12, 77.01] |
| 8.2 TLH versus AH | 1 | 102 | Odds Ratio (M‐H, Fixed, 95% CI) | 3.06 [0.12, 76.88] |
| 9 Urinary dysfunction Show forest plot | 2 | 246 | Odds Ratio (M‐H, Fixed, 95% CI) | 0.94 [0.48, 1.84] |
| 9.1 LAVH versus AH | 1 | 80 | Odds Ratio (M‐H, Fixed, 95% CI) | 3.08 [0.12, 77.80] |
| 9.2 LH (method unspecified) versus AH | 1 | 166 | Odds Ratio (M‐H, Fixed, 95% CI) | 0.88 [0.44, 1.76] |
| 10 Operation time (mins) Show forest plot | 12 | Mean Difference (IV, Random, 95% CI) | Subtotals only | |
| 10.1 LAVH versus AH | 4 | 466 | Mean Difference (IV, Random, 95% CI) | 0.27 [‐23.39, 23.93] |
| 10.2 LH(A) versus AH | 5 | 420 | Mean Difference (IV, Random, 95% CI) | 33.45 [14.82, 52.08] |
| 10.3 TLH versus AH | 2 | 161 | Mean Difference (IV, Random, 95% CI) | 28.74 [2.64, 54.85] |
| 10.4 LAVH versus minilaparotomy AH | 1 | 100 | Mean Difference (IV, Random, 95% CI) | ‐8.0 [‐10.56, ‐5.44] |
| 11 Bleeding Show forest plot | 5 | 1266 | Odds Ratio (M‐H, Fixed, 95% CI) | 0.45 [0.15, 1.37] |
| 11.1 LAVH versus AH | 2 | 197 | Odds Ratio (M‐H, Fixed, 95% CI) | 0.60 [0.08, 4.64] |
| 11.2 LH(a) versus AH | 2 | 193 | Odds Ratio (M‐H, Fixed, 95% CI) | 0.16 [0.02, 1.34] |
| 11.3 LH (method unspecified) versus AH | 1 | 876 | Odds Ratio (M‐H, Fixed, 95% CI) | 1.50 [0.16, 14.51] |
| 12 Transfusion Show forest plot | 19 | 2638 | Odds Ratio (M‐H, Random, 95% CI) | 0.58 [0.30, 1.10] |
| 12.1 LAVH versus AH | 5 | 539 | Odds Ratio (M‐H, Random, 95% CI) | 0.38 [0.11, 1.34] |
| 12.2 LH(a) versus AH | 8 | 641 | Odds Ratio (M‐H, Random, 95% CI) | 0.47 [0.17, 1.35] |
| 12.3 TLH versus AH | 2 | 161 | Odds Ratio (M‐H, Random, 95% CI) | 0.27 [0.03, 2.47] |
| 12.4 LH (method unspecified) versus AH | 3 | 1116 | Odds Ratio (M‐H, Random, 95% CI) | 0.91 [0.08, 9.85] |
| 12.5 LAVH versus minilaparotomy AH | 2 | 181 | Odds Ratio (M‐H, Random, 95% CI) | 1.38 [0.09, 20.52] |
| 13 Pelvic haematoma Show forest plot | 8 | 782 | Odds Ratio (M‐H, Fixed, 95% CI) | 0.75 [0.38, 1.47] |
| 13.1 LAVH versus AH | 3 | 276 | Odds Ratio (M‐H, Fixed, 95% CI) | 0.33 [0.05, 2.10] |
| 13.2 LH(a) versus AH | 4 | 406 | Odds Ratio (M‐H, Fixed, 95% CI) | 0.93 [0.44, 1.97] |
| 13.3 LAVH versus minilaparotomy AH | 1 | 100 | Odds Ratio (M‐H, Fixed, 95% CI) | 0.33 [0.01, 8.21] |
| 14 Unintended laparotomy Show forest plot | 2 | Odds Ratio (M‐H, Fixed, 95% CI) | Subtotals only | |
| 14.1 LAVH versus minilaparotomy AH | 2 | 181 | Odds Ratio (M‐H, Fixed, 95% CI) | 0.49 [0.08, 2.82] |
| 15 Length of hospital stay (days) Show forest plot | 11 | Mean Difference (IV, Random, 95% CI) | Subtotals only | |
| 15.1 LAVH versus AH | 4 | 466 | Mean Difference (IV, Random, 95% CI) | ‐2.64 [‐4.16, ‐1.12] |
| 15.2 LH(a) versus AH | 4 | 380 | Mean Difference (IV, Random, 95% CI) | ‐1.82 [‐2.34, ‐1.31] |
| 15.3 TLH versus AH | 2 | 161 | Mean Difference (IV, Random, 95% CI) | ‐2.53 [‐5.08, 0.01] |
| 15.4 LAVH versus minilaparotomy AH | 1 | 100 | Mean Difference (IV, Random, 95% CI) | ‐1.1 [‐1.20, ‐1.00] |
| 16 Vaginal cuff infection Show forest plot | 9 | 852 | Odds Ratio (M‐H, Fixed, 95% CI) | 1.43 [0.67, 3.04] |
| 16.1 LAVH versus AH | 3 | 396 | Odds Ratio (M‐H, Fixed, 95% CI) | 0.75 [0.17, 3.37] |
| 16.2 LH(a) versus AH | 6 | 456 | Odds Ratio (M‐H, Fixed, 95% CI) | 1.79 [0.73, 4.37] |
| 17 Wound/abdominal wall infection Show forest plot | 6 | 611 | Odds Ratio (M‐H, Fixed, 95% CI) | 0.29 [0.12, 0.71] |
| 17.1 LAVH versus AH | 1 | 81 | Odds Ratio (M‐H, Fixed, 95% CI) | 0.20 [0.01, 4.19] |
| 17.2 LH(a) versus AH | 4 | 259 | Odds Ratio (M‐H, Fixed, 95% CI) | 0.35 [0.12, 1.03] |
| 17.3 LH (method unspecified) versus AH | 1 | 190 | Odds Ratio (M‐H, Fixed, 95% CI) | 0.24 [0.03, 2.21] |
| 17.4 LAVH versus minilaparotomy AH | 1 | 81 | Odds Ratio (M‐H, Fixed, 95% CI) | 0.20 [0.01, 4.19] |
| 18 Urinary tract infection Show forest plot | 8 | 659 | Odds Ratio (M‐H, Fixed, 95% CI) | 1.04 [0.54, 2.00] |
| 18.1 LAVH versus AH | 1 | 80 | Odds Ratio (M‐H, Fixed, 95% CI) | 0.33 [0.01, 8.22] |
| 18.2 LH(a) versus AH | 5 | 339 | Odds Ratio (M‐H, Fixed, 95% CI) | 1.27 [0.55, 2.95] |
| 18.3 LH (method unspecified) versus AH | 2 | 240 | Odds Ratio (M‐H, Fixed, 95% CI) | 0.84 [0.26, 2.69] |
| 19 Chest infection Show forest plot | 3 | 294 | Odds Ratio (M‐H, Fixed, 95% CI) | 0.31 [0.07, 1.35] |
| 19.1 LH(a) versus AH | 2 | 104 | Odds Ratio (M‐H, Fixed, 95% CI) | 0.63 [0.10, 3.93] |
| 19.2 LH (method not specified) versus AH | 1 | 190 | Odds Ratio (M‐H, Fixed, 95% CI) | 0.11 [0.01, 2.01] |
| 20 Febrile episodes or unspecified infection Show forest plot | 16 | Odds Ratio (M‐H, Fixed, 95% CI) | Subtotals only | |
| 20.1 LAVH versus AH | 4 | 339 | Odds Ratio (M‐H, Fixed, 95% CI) | 0.25 [0.09, 0.73] |
| 20.2 LH(a) versus AH | 7 | 572 | Odds Ratio (M‐H, Fixed, 95% CI) | 0.55 [0.33, 0.90] |
| 20.3 TLH versus AH | 2 | 161 | Odds Ratio (M‐H, Fixed, 95% CI) | 0.36 [0.11, 1.21] |
| 20.4 LH (method unspecified) versus AH | 3 | 1116 | Odds Ratio (M‐H, Fixed, 95% CI) | 0.94 [0.65, 1.37] |
| 20.5 LAVH versus minilaparotomy AH | 1 | 81 | Odds Ratio (M‐H, Fixed, 95% CI) | 0.14 [0.01, 2.72] |
| 21 Thromboembolism Show forest plot | 3 | 1125 | Odds Ratio (M‐H, Fixed, 95% CI) | 0.89 [0.23, 3.39] |
| 21.1 TLH versus AH | 1 | 59 | Odds Ratio (M‐H, Fixed, 95% CI) | 0.38 [0.01, 9.76] |
| 21.2 LH (method unspecified) versus AH | 2 | 1066 | Odds Ratio (M‐H, Fixed, 95% CI) | 1.11 [0.24, 5.13] |
| 22 Wound dehiscence Show forest plot | 1 | Odds Ratio (M‐H, Fixed, 95% CI) | Subtotals only | |
| 22.1 LAVH versus minilaparotomy AH | 1 | 81 | Odds Ratio (M‐H, Fixed, 95% CI) | 3.15 [0.12, 79.69] |
| 23 Return to normal activities (descriptive data) Show forest plot | Other data | No numeric data | ||
| 24 Long‐term outcomes: quality of life (descriptive data) Show forest plot | Other data | No numeric data | ||
| 25 Operation time (descriptive data) Show forest plot | Other data | No numeric data | ||
| 26 Length of hospital stay (descriptive data) Show forest plot | Other data | No numeric data | ||
| 27 Pain relief (descriptive data) Show forest plot | Other data | No numeric data | ||
| 27.1 Pain scales | Other data | No numeric data | ||
| 27.2 Postoperative analgesics | Other data | No numeric data | ||
| 27.3 Recovery from pain (days) | Other data | No numeric data | ||
| 28 Cost (descriptive data) Show forest plot | Other data | No numeric data | ||
| Outcome or subgroup title | No. of studies | No. of participants | Statistical method | Effect size |
| 1 Return to normal activities (days) Show forest plot | 2 | 140 | Mean Difference (IV, Fixed, 95% CI) | ‐1.07 [‐4.21, 2.06] |
| 1.1 LAVH versus VH | 1 | 80 | Mean Difference (IV, Fixed, 95% CI) | ‐1.60 [‐5.11, 1.91] |
| 1.2 LH(a) versus VH | 1 | 60 | Mean Difference (IV, Fixed, 95% CI) | 1.0 [‐5.95, 7.95] |
| 2 Ureter injury Show forest plot | 2 | 594 | Odds Ratio (M‐H, Fixed, 95% CI) | 1.51 [0.06, 37.18] |
| 2.1 LAVH versus VH | 1 | 45 | Odds Ratio (M‐H, Fixed, 95% CI) | 0.0 [0.0, 0.0] |
| 2.2 TLH versus VH | 1 | 45 | Odds Ratio (M‐H, Fixed, 95% CI) | 0.0 [0.0, 0.0] |
| 2.3 LH (method unspecified) versus VH | 1 | 504 | Odds Ratio (M‐H, Fixed, 95% CI) | 1.51 [0.06, 37.18] |
| 3 Bladder injury Show forest plot | 7 | 895 | Odds Ratio (M‐H, Fixed, 95% CI) | 0.91 [0.32, 2.56] |
| 3.1 LAVH versus VH | 2 | 125 | Odds Ratio (M‐H, Fixed, 95% CI) | 0.33 [0.01, 8.22] |
| 3.2 LH(a) versus VH | 2 | 136 | Odds Ratio (M‐H, Fixed, 95% CI) | 2.98 [0.30, 29.43] |
| 3.3 TLH versus VH | 2 | 85 | Odds Ratio (M‐H, Fixed, 95% CI) | 0.32 [0.01, 8.26] |
| 3.4 LH (method unspecified) versus VH | 2 | 549 | Odds Ratio (M‐H, Fixed, 95% CI) | 0.83 [0.18, 3.79] |
| 4 Urinary tract (bladder or ureter) injury Show forest plot | 7 | 895 | Odds Ratio (M‐H, Fixed, 95% CI) | 1.00 [0.36, 2.75] |
| 4.1 LAVH versus VH | 2 | 125 | Odds Ratio (M‐H, Fixed, 95% CI) | 0.33 [0.01, 8.22] |
| 4.2 LH(a) versus VH | 2 | 136 | Odds Ratio (M‐H, Fixed, 95% CI) | 2.98 [0.30, 29.43] |
| 4.3 TLH versus VH | 2 | 85 | Odds Ratio (M‐H, Fixed, 95% CI) | 0.32 [0.01, 8.26] |
| 4.4 LH (method unspecified) versus VH | 2 | 549 | Odds Ratio (M‐H, Fixed, 95% CI) | 1.01 [0.23, 4.38] |
| 5 Bowel injury Show forest plot | 2 | 639 | Odds Ratio (M‐H, Fixed, 95% CI) | 0.0 [0.0, 0.0] |
| 5.1 LAVH versus VH | 1 | 45 | Odds Ratio (M‐H, Fixed, 95% CI) | 0.0 [0.0, 0.0] |
| 5.2 TLH versus VH | 1 | 90 | Odds Ratio (M‐H, Fixed, 95% CI) | 0.0 [0.0, 0.0] |
| 5.3 LH (method unspecified) versus VH | 1 | 504 | Odds Ratio (M‐H, Fixed, 95% CI) | 0.0 [0.0, 0.0] |
| 6 Vascular injury Show forest plot | 4 | 685 | Odds Ratio (M‐H, Fixed, 95% CI) | 1.58 [0.48, 5.27] |
| 6.1 LH(a) versus VH | 2 | 136 | Odds Ratio (M‐H, Fixed, 95% CI) | 2.89 [0.11, 74.15] |
| 6.2 LH (method unspecified) versus VH | 2 | 549 | Odds Ratio (M‐H, Fixed, 95% CI) | 1.42 [0.39, 5.22] |
| 7 Fistula Show forest plot | 1 | Odds Ratio (M‐H, Fixed, 95% CI) | Subtotals only | |
| 7.1 LH(a) versus VH | 1 | 56 | Odds Ratio (M‐H, Fixed, 95% CI) | 0.30 [0.01, 7.67] |
| 8 Urinary dysfunction Show forest plot | 1 | Odds Ratio (M‐H, Fixed, 95% CI) | Subtotals only | |
| 8.1 LAVH versus VH | 1 | 80 | Odds Ratio (M‐H, Fixed, 95% CI) | 3.08 [0.12, 77.80] |
| 9 Operation time (mins) Show forest plot | 9 | Mean Difference (IV, Random, 95% CI) | Subtotals only | |
| 9.1 LAVH versus VH | 5 | 377 | Mean Difference (IV, Random, 95% CI) | 33.60 [20.13, 47.07] |
| 9.2 LH(a) versus VH | 3 | 213 | Mean Difference (IV, Random, 95% CI) | 53.58 [43.67, 63.49] |
| 9.3 TLH versus VH | 1 | 60 | Mean Difference (IV, Random, 95% CI) | 17.30 [3.34, 31.26] |
| 10 Bleeding Show forest plot | 3 | 614 | Odds Ratio (M‐H, Fixed, 95% CI) | 1.55 [0.24, 10.09] |
| 10.1 LAVH versus VH | 2 | 65 | Odds Ratio (M‐H, Fixed, 95% CI) | 1.58 [0.06, 41.03] |
| 10.2 TLH versus VH | 1 | 45 | Odds Ratio (M‐H, Fixed, 95% CI) | 1.58 [0.06, 41.03] |
| 10.3 LH (method unspecified) versus VH | 1 | 504 | Odds Ratio (M‐H, Fixed, 95% CI) | 1.51 [0.06, 37.18] |
| 11 Transfusion Show forest plot | 8 | 1039 | Odds Ratio (M‐H, Fixed, 95% CI) | 1.60 [0.80, 3.18] |
| 11.1 LAVH versus VH | 4 | 273 | Odds Ratio (M‐H, Fixed, 95% CI) | 0.74 [0.16, 3.41] |
| 11.2 LH(a) versus VH | 3 | 217 | Odds Ratio (M‐H, Fixed, 95% CI) | 2.49 [0.63, 9.86] |
| 11.3 TLH versus VH | 1 | 45 | Odds Ratio (M‐H, Fixed, 95% CI) | 1.58 [0.06, 41.03] |
| 11.4 LH (method unspecified) versus VH | 1 | 504 | Odds Ratio (M‐H, Fixed, 95% CI) | 1.74 [0.63, 4.79] |
| 12 Pelvic haematoma Show forest plot | 4 | 308 | Odds Ratio (M‐H, Fixed, 95% CI) | 1.21 [0.36, 4.03] |
| 12.1 LAVH versus VH | 3 | 228 | Odds Ratio (M‐H, Fixed, 95% CI) | 1.70 [0.40, 7.26] |
| 12.2 LH(a) versus VH | 1 | 80 | Odds Ratio (M‐H, Fixed, 95% CI) | 0.49 [0.04, 5.60] |
| 13 Unintended laparotomy Show forest plot | 10 | 1160 | Odds Ratio (M‐H, Fixed, 95% CI) | 1.55 [0.76, 3.16] |
| 13.1 LAVH versus VH | 5 | 353 | Odds Ratio (M‐H, Fixed, 95% CI) | 4.33 [0.46, 40.61] |
| 13.2 LH(a) versus VH | 3 | 213 | Odds Ratio (M‐H, Fixed, 95% CI) | 6.11 [1.06, 35.21] |
| 13.3 TLH versus VH | 1 | 45 | Odds Ratio (M‐H, Fixed, 95% CI) | 1.58 [0.06, 41.03] |
| 13.4 LH (method unspecified) versus VH | 2 | 549 | Odds Ratio (M‐H, Fixed, 95% CI) | 0.67 [0.26, 1.74] |
| 14 Vaginal cuff infection Show forest plot | 4 | 276 | Odds Ratio (M‐H, Fixed, 95% CI) | 0.98 [0.22, 4.39] |
| 14.1 LAVH versus VH | 1 | 80 | Odds Ratio (M‐H, Fixed, 95% CI) | 1.0 [0.06, 16.56] |
| 14.2 LH(a) versus VH | 3 | 196 | Odds Ratio (M‐H, Fixed, 95% CI) | 0.97 [0.16, 5.73] |
| 15 Wound/abdominal wall infection Show forest plot | 2 | 170 | Odds Ratio (M‐H, Fixed, 95% CI) | 2.88 [0.31, 27.06] |
| 15.1 LAVH versus VH | 1 | 45 | Odds Ratio (M‐H, Fixed, 95% CI) | 2.72 [0.12, 60.29] |
| 15.2 LH(a) versus VH | 1 | 80 | Odds Ratio (M‐H, Fixed, 95% CI) | 3.08 [0.12, 77.80] |
| 15.3 TLH versus VH | 1 | 45 | Odds Ratio (M‐H, Fixed, 95% CI) | 0.0 [0.0, 0.0] |
| 16 Urinary tract infection Show forest plot | 3 | 230 | Odds Ratio (M‐H, Fixed, 95% CI) | 1.66 [0.40, 6.82] |
| 16.1 LAVH versus VH | 2 | 125 | Odds Ratio (M‐H, Fixed, 95% CI) | 1.02 [0.15, 6.89] |
| 16.2 LH(a) versus VH | 1 | 60 | Odds Ratio (M‐H, Fixed, 95% CI) | 3.10 [0.12, 79.23] |
| 16.3 TLH versus VH | 1 | 45 | Odds Ratio (M‐H, Fixed, 95% CI) | 2.72 [0.12, 60.29] |
| 17 Chest infection Show forest plot | 1 | Odds Ratio (M‐H, Fixed, 95% CI) | Subtotals only | |
| 17.1 LH(a) versus VH | 1 | 60 | Odds Ratio (M‐H, Fixed, 95% CI) | 0.19 [0.01, 4.06] |
| 18 Febrile episodes or unspecified infection Show forest plot | 9 | 1074 | Odds Ratio (M‐H, Fixed, 95% CI) | 0.80 [0.51, 1.24] |
| 18.1 LAVH versus VH | 4 | 253 | Odds Ratio (M‐H, Fixed, 95% CI) | 1.55 [0.49, 4.85] |
| 18.2 LH(a) versus VH | 3 | 196 | Odds Ratio (M‐H, Fixed, 95% CI) | 0.99 [0.28, 3.51] |
| 18.3 TLH versus VH | 2 | 121 | Odds Ratio (M‐H, Fixed, 95% CI) | 0.33 [0.06, 1.74] |
| 18.4 LH (method unspecified) versus VH | 1 | 504 | Odds Ratio (M‐H, Fixed, 95% CI) | 0.72 [0.41, 1.25] |
| 19 Thromboembolism Show forest plot | 2 | 564 | Odds Ratio (M‐H, Fixed, 95% CI) | 1.00 [0.15, 6.67] |
| 19.1 TLH versus VH | 1 | 60 | Odds Ratio (M‐H, Fixed, 95% CI) | 0.32 [0.01, 8.24] |
| 19.2 LH (method unspecified) versus VH | 1 | 504 | Odds Ratio (M‐H, Fixed, 95% CI) | 2.52 [0.12, 52.76] |
| 20 Length of hospital stay (days) Show forest plot | 7 | 525 | Mean Difference (IV, Random, 95% CI) | 0.88 [0.73, 1.03] |
| 20.1 LAVH versus VH | 4 | 308 | Mean Difference (IV, Random, 95% CI) | 0.91 [0.76, 1.06] |
| 20.2 LH(a) versus VH | 2 | 157 | Mean Difference (IV, Random, 95% CI) | 0.40 [‐0.42, 1.22] |
| 20.3 TLH versus VH | 1 | 60 | Mean Difference (IV, Random, 95% CI) | ‐0.5 [‐2.41, 1.41] |
| 21 Return to normal activities (descriptive data) Show forest plot | Other data | No numeric data | ||
| 22 Long‐term outcomes: quality of life (descriptive data) Show forest plot | Other data | No numeric data | ||
| 23 Operation time (descriptive data) Show forest plot | Other data | No numeric data | ||
| 24 Length of hospital stay (descriptive data) Show forest plot | Other data | No numeric data | ||
| 25 Pain relief (descriptive data) Show forest plot | Other data | No numeric data | ||
| 25.1 Pain scales | Other data | No numeric data | ||
| 25.2 Postoperative analgesics | Other data | No numeric data | ||
| 26 Cost (descriptive data) Show forest plot | Other data | No numeric data | ||
| Outcome or subgroup title | No. of studies | No. of participants | Statistical method | Effect size |
| 1 Return to normal activities (days) Show forest plot | 1 | Mean Difference (IV, Fixed, 95% CI) | Subtotals only | |
| 2 Intraoperative visceral injury (dichotomous) Show forest plot | 1 | Odds Ratio (M‐H, Fixed, 95% CI) | Subtotals only | |
| 2.1 Ureter injury | 1 | 100 | Odds Ratio (M‐H, Fixed, 95% CI) | 0.33 [0.01, 8.21] |
| 2.2 Vascular injury | 1 | 100 | Odds Ratio (M‐H, Fixed, 95% CI) | 1.0 [0.06, 16.44] |
| 2.3 Wound/abdominal wall infection | 1 | 100 | Odds Ratio (M‐H, Fixed, 95% CI) | 0.33 [0.01, 8.21] |
| 2.4 Wound dehiscence | 1 | 100 | Odds Ratio (M‐H, Fixed, 95% CI) | 0.33 [0.01, 8.21] |
| 3 Operation time Show forest plot | 2 | 152 | Mean Difference (IV, Random, 95% CI) | 44.09 [5.31, 82.88] |
| 4 Transfusion Show forest plot | 1 | Odds Ratio (M‐H, Fixed, 95% CI) | Subtotals only | |
| 5 Return to normal activities (descriptive data) Show forest plot | Other data | No numeric data | ||
| Outcome or subgroup title | No. of studies | No. of participants | Statistical method | Effect size |
| 1 Bladder injury Show forest plot | 1 | Odds Ratio (M‐H, Fixed, 95% CI) | Subtotals only | |
| 1.1 SP‐TLH versus TLH | 1 | 64 | Odds Ratio (M‐H, Fixed, 95% CI) | 3.51 [0.14, 89.42] |
| 2 Operation time (mins) Show forest plot | 2 | Mean Difference (IV, Fixed, 95% CI) | Totals not selected | |
| 2.1 SP‐LAVH versus LAVH | 1 | Mean Difference (IV, Fixed, 95% CI) | 0.0 [0.0, 0.0] | |
| 2.2 SP‐TLH versus TLH | 1 | Mean Difference (IV, Fixed, 95% CI) | 0.0 [0.0, 0.0] | |
| 3 Transfusion Show forest plot | 3 | 203 | Odds Ratio (M‐H, Fixed, 95% CI) | 1.37 [0.30, 6.26] |
| 3.1 SP‐LAVH versus LAVH | 2 | 139 | Odds Ratio (M‐H, Fixed, 95% CI) | 0.97 [0.16, 5.86] |
| 3.2 SP‐TLH versus TLH | 1 | 64 | Odds Ratio (M‐H, Fixed, 95% CI) | 3.51 [0.14, 89.42] |
| 4 Pelvic haematoma Show forest plot | 1 | Odds Ratio (M‐H, Fixed, 95% CI) | Subtotals only | |
| 4.1 SP‐LAVH versus LAVH | 1 | 100 | Odds Ratio (M‐H, Fixed, 95% CI) | 3.06 [0.12, 76.95] |
| 5 Wound/abdominal wall infection Show forest plot | 1 | Odds Ratio (M‐H, Fixed, 95% CI) | Subtotals only | |
| 5.1 SP‐LAVH versus LAVH | 1 | 100 | Odds Ratio (M‐H, Fixed, 95% CI) | 0.33 [0.01, 8.21] |
| 6 Febrile episodes or unspecified infection Show forest plot | 1 | Odds Ratio (M‐H, Fixed, 95% CI) | Subtotals only | |
| 6.1 SP‐TLH versus TLH | 1 | 64 | Odds Ratio (M‐H, Fixed, 95% CI) | 4.87 [0.93, 25.62] |
| 7 Postoperative ileus Show forest plot | 1 | Odds Ratio (M‐H, Fixed, 95% CI) | Subtotals only | |
| 7.1 SP‐TLH versus TLH | 1 | 64 | Odds Ratio (M‐H, Fixed, 95% CI) | 2.36 [0.20, 27.39] |
| 8 Length of hospital stay (days) Show forest plot | 1 | Mean Difference (IV, Fixed, 95% CI) | Subtotals only | |
| 8.1 SP‐LAVH versus LAVH | 1 | 100 | Mean Difference (IV, Fixed, 95% CI) | ‐0.20 [‐0.49, 0.09] |
| 9 Operation time (descriptive data) Show forest plot | Other data | No numeric data | ||
| 10 Length of hospital stay (descriptive data) Show forest plot | Other data | No numeric data | ||
| Outcome or subgroup title | No. of studies | No. of participants | Statistical method | Effect size |
| 1 Intraoperative visceral injury (dich) Show forest plot | 2 | Odds Ratio (M‐H, Fixed, 95% CI) | Subtotals only | |
| 1.1 Bladder injury | 2 | 161 | Odds Ratio (M‐H, Fixed, 95% CI) | 0.72 [0.06, 8.27] |
| 1.2 Ureter injury | 2 | 161 | Odds Ratio (M‐H, Fixed, 95% CI) | 3.03 [0.27, 34.52] |
| 1.3 Urinary tract (bladder or ureter) injury | 2 | 161 | Odds Ratio (M‐H, Fixed, 95% CI) | 1.5 [0.29, 7.83] |
| 1.4 Bowel injury | 2 | 161 | Odds Ratio (M‐H, Fixed, 95% CI) | 0.0 [0.0, 0.0] |
| 1.5 Vascular injury | 1 | 101 | Odds Ratio (M‐H, Fixed, 95% CI) | 1.48 [0.09, 24.27] |
| 1.6 Conversion to laparotomy | 2 | 164 | Odds Ratio (M‐H, Fixed, 95% CI) | 1.28 [0.21, 7.85] |
| 2 Long‐term complications (dich) Show forest plot | 1 | 202 | Odds Ratio (M‐H, Fixed, 95% CI) | 1.09 [0.54, 2.17] |
| 2.1 Dyspareunia | 1 | 101 | Odds Ratio (M‐H, Fixed, 95% CI) | 2.64 [0.59, 11.72] |
| 2.2 Orgasm (< 1 of 3) | 1 | 101 | Odds Ratio (M‐H, Fixed, 95% CI) | 0.84 [0.38, 1.86] |
| 3 Operation time (mins) Show forest plot | 1 | Mean Difference (IV, Fixed, 95% CI) | Subtotals only | |
| 4 Short‐term outcomes (dich) Show forest plot | 2 | Odds Ratio (M‐H, Random, 95% CI) | Totals not selected | |
| 4.1 Transfusion | 2 | Odds Ratio (M‐H, Random, 95% CI) | 0.0 [0.0, 0.0] | |
| 4.2 Vaginal cuff infection | 1 | Odds Ratio (M‐H, Random, 95% CI) | 0.0 [0.0, 0.0] | |
| 4.3 Abdominal wall/wound infection | 1 | Odds Ratio (M‐H, Random, 95% CI) | 0.0 [0.0, 0.0] | |
| 4.4 UTI | 1 | Odds Ratio (M‐H, Random, 95% CI) | 0.0 [0.0, 0.0] | |
| 4.5 Febrile episodes or unspecified infection | 2 | Odds Ratio (M‐H, Random, 95% CI) | 0.0 [0.0, 0.0] | |
| 5 Length of hospital stay (days) Show forest plot | 1 | Mean Difference (IV, Fixed, 95% CI) | Subtotals only | |
| Outcome or subgroup title | No. of studies | No. of participants | Statistical method | Effect size |
| 1 Operation time (descriptive data) Show forest plot | Other data | No numeric data | ||
| 2 Length of hospital stay (descriptive data) Show forest plot | Other data | No numeric data | ||