新生児における従量式人工呼吸と従圧式人工呼吸の比較
Referencias
References to studies included in this review
References to studies excluded from this review
References to studies awaiting assessment
References to ongoing studies
Additional references
References to other published versions of this review
Characteristics of studies
Characteristics of included studies [ordered by study ID]
| Methods | Single‐centre randomised trial. | |
| Participants | 40 infants. Inclusion criteria: ≥ 34 weeks of GA and mechanically ventilated < 24 h in the first 2 weeks of life. Exclusion criteria: > 2 weeks of age, ventilated > 24 h with or without supported by high‐frequency ventilation or diagnosed with congenital diaphragmatic hernia. | |
| Interventions | Ventilator: SLE5000 (software 4.3). Both groups initially: inflation time 0.3‐0.4 sec, inflation rate 40‐60/min, PEEP not reported.
Both groups: predefined weaning strategy either VTV mode or PLV mode. Not mentioned whether synchronisation used during weaning. Duration of intervention: until extubation. | |
| Outcomes | Primary outcome: time to extubation. Secondary outcomes: physiological measurements including work of breathing (assessed by transdiaphragmatic pressure time product), blood gas analyses and failure of ventilation mode. | |
| Supplemental data | Data on duration of ventilation presented as mean (SD). | |
| Notes | ||
| Risk of bias | ||
| Bias | Authors' judgement | Support for judgement |
| Random sequence generation (selection bias) | Low risk | Random number table generation (unspecified). |
| Allocation concealment (selection bias) | Low risk | Blinding of randomisation: sequential sealed opaque envelopes. |
| Blinding of participants and personnel (performance bias) | High risk | No. |
| Blinding of outcome assessment (detection bias) | High risk | No. |
| Intervention bias (strict vs hybrid studies) | Low risk | Not applicable. |
| Incomplete outcome data (attrition bias) | Low risk | Follow‐up: complete to end of intervention. Secondary postintervention outcomes reported during period of primary admission. |
| Selective reporting (reporting bias) | Unclear risk | Trial registration submitted after completion of the study. |
| Other bias | Low risk | |
| Methods | Dual‐centre randomised trial. | |
| Participants | 40 infants. Inclusion criteria: GA < 34 weeks and ventilated for RDS. Exclusion criteria: major surgical or congenital anomalies. | |
| Interventions | Ventilator: both groups used Drager Babylog 8000plus in SIPPV (AC) mode.
Duration of intervention: from onset of mechanical ventilation after admission to neonatal unit to first blood gas result (median duration 95 min). | |
| Outcomes | Data only collected from time between onset of ventilation and until first blood gas analysis. Primary: PaCO2 and proportion of infants with PaCO2 within target range (5‐7 kPa). Others: first pH, PaO2. Post hoc subgroup analysis 23‐25, 26‐33 weeks. | |
| Supplemental data | Blood gas data and data on randomisation procedure. Information about trial registration. | |
| Notes | ||
| Risk of bias | ||
| Bias | Authors' judgement | Support for judgement |
| Random sequence generation (selection bias) | Low risk | Permuted blocks within strata (< 1250 g and > 1250 g blocks). |
| Allocation concealment (selection bias) | Low risk | Blinding of randomisation: sealed envelopes. |
| Blinding of participants and personnel (performance bias) | High risk | No. |
| Blinding of outcome assessment (detection bias) | High risk | No (outcome measure defined end of intervention period). |
| Intervention bias (strict vs hybrid studies) | Low risk | Not applicable. |
| Incomplete outcome data (attrition bias) | Low risk | Follow‐up complete to discharge. |
| Selective reporting (reporting bias) | Unclear risk | Retrospectively registered. |
| Other bias | Low risk | |
| Methods | Single‐centre randomised trial. | |
| Participants | 40 infants. Inclusion criteria: < 34 weeks GA, mechanically ventilated in the first week after birth. Exclusion criteria: major congenital anomalies, ventilated > 24 h or supported by high‐frequency ventilation or both. | |
| Interventions | Ventilator: SLE5000 (software 4,3). Both groups: inflation time 0.3‐0.4 sec, inflation rate 40‐60/min, PEEP not reported.
Both groups: predefined weaning strategy; underlying trigger mode changed from SIMV to AC. Duration of intervention: until extubation. | |
| Outcomes | Primary: time to reach specified weaning criteria. Other: survival to discharge, BPD at 28 days, IVH grade 3 or 4, cystic PVL, PDA treated (medication/ligation), pneumothorax, postnatal steroids, duration of ventilation, failure of initial ventilation mode, blood gas analyses and work of breathing (assessed by transdiaphragmatic pressure time product). | |
| Supplemental data | Mortality, BPD at 36 weeks, detailed blood gas, duration of ventilation presented as mean (SD). | |
| Notes | Imbalance with regard to BW, GA and antenatal steroid use despite randomisation. Participants in the PLV group had lower median GA/BW than participants in the VTV group (median GA/BW 26 weeks/856 g vs 28 weeks/1016 g). In the published report, authors adjusted for this difference, but this review used the unadjusted outcomes. | |
| Risk of bias | ||
| Bias | Authors' judgement | Support for judgement |
| Random sequence generation (selection bias) | Low risk | Random number table generation. |
| Allocation concealment (selection bias) | Low risk | Blinding of randomisation: sealed opaque envelopes. |
| Blinding of participants and personnel (performance bias) | High risk | No. |
| Blinding of outcome assessment (detection bias) | High risk | No. |
| Intervention bias (strict vs hybrid studies) | Low risk | Not applicable. |
| Incomplete outcome data (attrition bias) | Low risk | Follow‐up: complete to end of intervention. Secondary postintervention outcomes reported during period of primary admission. |
| Selective reporting (reporting bias) | Unclear risk | Trial registration submitted after completion of study. |
| Other bias | High risk | Despite randomisation, there was imbalance with regard to BW, GA and antenatal steroid use. Participants in the PLV group had lower median GA/BW than participants in the VTV group (median GA/BW 26 weeks/856 g vs 28 weeks/1016 g). |
| Methods | Dual‐centre randomised trial. | |
| Participants | 213 infants enrolled, but 1 infant immediately withdrawn, see below. Data on 212 infants. Inclusion criteria: BW 500‐1249 g, GA ≥ 24 weeks and in need of mechanical ventilation. Enrolled before 6 h of age. Exclusion criteria: not specified. | |
| Interventions | Ventilator: both groups used primarily the Siemens Servo 300 ventilator. However, participants in the SIMV group were changed over to a VIP Bird ventilator (SIMV mode) if requiring a ventilator rate > 40/min. Target: PaO2 (mmHg): 45‐60 (GA 24‐26 weeks), 50‐70 (GA 27‐28 weeks), 60‐80 (GA > 28 weeks). PaCO2: 45‐55 mmHg (all GAs).
Duration of intervention: remained on randomised method until extubated, died or met failure criteria (hypoxia, hypercapnia or hypocapnia, or decision of clinical team). | |
| Outcomes | Primary: proportion of infants alive and extubated at 14 days. Other: FiO2, ventilator rate, PIP, VT, PaCO2, PaO2, oxygenation index, AaDO2, proportion alive and extubated at 28 days or 36 weeks, proportion died before discharge, age at final extubation, proportion extubated at 14 days without requiring subsequent reintubation. | |
| Supplemental data | BW, age of death in non‐survivors, BPD, duration of ventilation, pneumothorax, PIE, PVL, IVH. Information regarding blinding of assessors. Study protocol. | |
| Notes | 1 infant in VTV group enrolled in error and immediately withdrawn from study. No data collected on this participant. As such, study reported data on 212 infants; 104 in the VTV group and 108 in the PLV group. | |
| Risk of bias | ||
| Bias | Authors' judgement | Support for judgement |
| Random sequence generation (selection bias) | Low risk | Block randomisation (8 participants per block). Stratified by centre and BW. |
| Allocation concealment (selection bias) | Low risk | Blinding of randomisation: Sealed, opaque envelopes. |
| Blinding of participants and personnel (performance bias) | High risk | No. |
| Blinding of outcome assessment (detection bias) | High risk | No. |
| Intervention bias (strict vs hybrid studies) | High risk | Hybrid study: different trigger modes in VTV and PLV groups. |
| Incomplete outcome data (attrition bias) | Low risk | Follow‐up: complete to discharge. Long‐term follow‐up: 64 infants in each group were also assessed at 6‐18 months' corrected age (neurodevelopmental outcome). |
| Selective reporting (reporting bias) | Unclear risk | Study protocol sent to review authors. Study not registered. |
| Other bias | Low risk | |
| Methods | Single‐centre randomised trial. | |
| Participants | 45 infants. Inclusion criteria: GA < 32 weeks and mechanical ventilation for severe RDS for > 24 h. Exclusion criteria: major congenital anomalies and mechanical ventilation < 24 h. | |
| Interventions | Ventilator: both groups used Drager Babylog 8000plus. Initially in SIPPV(AC) mode and then switched to SIMV mode during weaning. Inflation time 0.3‐0.4 sec and PEEP 4‐6 cmH2O. During weaning, respiratory rate was gradually reduced to 18/min. Clear protocol for ventilation and weaning. Target: PaCO2 40‐60 mmHg.
Duration of intervention: until extubation. | |
| Outcomes | Primary: duration of ventilation (median and IQR). Other: mortality, BPD, PDA, IVH grade 3 or 4, PVL, pneumothorax. | |
| Supplemental data | Duration of ventilation (mean and SD), clarification about the randomisation process and inclusions/exclusions. | |
| Notes | ||
| Risk of bias | ||
| Bias | Authors' judgement | Support for judgement |
| Random sequence generation (selection bias) | Low risk | Block randomisation with random block sizes. |
| Allocation concealment (selection bias) | Low risk | Blinding of randomisation: sealed opaque envelopes. |
| Blinding of participants and personnel (performance bias) | High risk | No. |
| Blinding of outcome assessment (detection bias) | High risk | No. |
| Intervention bias (strict vs hybrid studies) | Low risk | Not applicable. |
| Incomplete outcome data (attrition bias) | Low risk | Follow‐up: complete to end of intervention. Secondary postintervention outcomes reported during period of primary admission. |
| Selective reporting (reporting bias) | Unclear risk | No trial registration. |
| Other bias | Low risk | |
| Methods | Single‐centre randomised trial. | |
| Participants | 60 infants. Inclusion criteria: GA < 33 weeks or BW < 1500 g (or both); ventilated for RDS. Exclusion criteria: admission at > 6 h of age; congenital cardiac, respiratory or CNS malformations; congenital metabolic diseases, congenital pneumonia, sepsis, perinatal asphyxia and leak < 20% around the ETT. | |
| Interventions | Ventilator: Babylog 8000plus. All participants initially ventilated using SIPPV (AC) mode (PEEP 4 cmH2O, inflation time 0.4 sec). Intervention started in weaning phase when FiO2 < 0.40, inflation rate < 60/min, PIP 16 cmH2O and PEEP 4 cmH2O with blood gas values within targeted area. Infants then switched to 2 randomised 'weaning modes.'
Duration of intervention: From "start of weaning" until extubation. | |
| Outcomes | Primary: "Reduction in ventilator‐associated lung injury." Other: mortality, BPD, pneumothorax, IVH (any), PDA and duration of ventilation. | |
| Supplemental data | ||
| Notes | Initial ventilation with SIPPV, before start of weaning, lasted 7.8 h in PLV group and 4.4 h in VTV group. Weaning phase lasted 32.4 h in PLV group and 21.1 h in VTV group. Intervention mode consisted of 80% of total duration of ventilation in PLV group and 83% of total duration of ventilation in VTV group. | |
| Risk of bias | ||
| Bias | Authors' judgement | Support for judgement |
| Random sequence generation (selection bias) | Unclear risk | Randomisation strategy not described. |
| Allocation concealment (selection bias) | Low risk | Blinding of randomisation: sealed opaque envelopes |
| Blinding of participants and personnel (performance bias) | High risk | No. |
| Blinding of outcome assessment (detection bias) | High risk | No. |
| Intervention bias (strict vs hybrid studies) | High risk | Hybrid study: different modes of flow termination. In PSV mode, inflation times varies (flow termination). In SIMV, there is a fixed inflation time. |
| Incomplete outcome data (attrition bias) | Low risk | Outcomes complete. |
| Selective reporting (reporting bias) | Unclear risk | No trial registration available. |
| Other bias | Low risk | |
| Methods | Single‐centre randomised trial. | |
| Participants | 72 infants. Inclusion criteria: GA < 32 weeks or BW < 1500 g (or both), and admitted with RDS and given surfactant within first 2 h of life. Exclusion criteria: major congenital anomalies, perinatal asphyxia and meconium aspiration. | |
| Interventions | Ventilator: both groups used Drager Babylog 8000plus in SIMV mode.
Duration of intervention: until extubation. | |
| Outcomes | Primary outcome: duration of ventilation (days) and need of total oxygen supplementation. Secondary outcomes: survival to discharge, air leak, BPD (36 weeks), IVH grade 3 or 4, PVL, PDA, ROP and NEC. | |
| Supplemental data | Information about postrandomisation loss sought from authors, see "Other bias." | |
| Notes | ||
| Risk of bias | ||
| Bias | Authors' judgement | Support for judgement |
| Random sequence generation (selection bias) | Low risk | Block randomisation with random block sizes. |
| Allocation concealment (selection bias) | Unclear risk | Not specified. |
| Blinding of participants and personnel (performance bias) | High risk | No. |
| Blinding of outcome assessment (detection bias) | High risk | No. |
| Intervention bias (strict vs hybrid studies) | Low risk | Not applicable. |
| Incomplete outcome data (attrition bias) | Low risk | Follow‐up: complete to end of intervention. |
| Selective reporting (reporting bias) | Unclear risk | No trial registration. |
| Other bias | High risk | Reported in paper that 90 participants were randomised. However, postrandomisation 15 participants were excluded in PLV group and 3 participants excluded in VTV group. After contact with authors, it seemed that randomisation occurred before they had considered exclusion criteria and before parents had given consent. |
| Methods | Single‐centre randomised cross‐over study. | |
| Participants | 17 infants. Inclusion criteria: appropriate for GA infants of 600‐1200 g, ventilated for RDS, > 48 h of age and clinically stable. Exclusion criteria: congenital malformations, sepsis, pneumothorax, other air leak, meconium aspiration and terminal state. | |
| Interventions | Ventilator: both groups used Draeger Babylog 8000plus. Prestudy settings, SIMV rate 16/min, PIP 15 cmH2O. Cross‐over study:
Duration of intervention: 1 + 1 h. | |
| Outcomes | Airflow, pressure, FiO2, TcCO2, minute volume. | |
| Supplemental data | ||
| Notes | Last 8 infants (of 17) randomised to an additional third VTV epoch of SIMV‐VG 3.0 mL/kg. For meta‐analysis, only SIMV‐VG 4.5 mL/kg (9 infants) vs SIMV data of all 17 infants used. | |
| Risk of bias | ||
| Bias | Authors' judgement | Support for judgement |
| Random sequence generation (selection bias) | Unclear risk | Randomised, but no further information about randomisation procedure. |
| Allocation concealment (selection bias) | Low risk | Blinding of randomisation: sealed envelopes. |
| Blinding of participants and personnel (performance bias) | High risk | No. |
| Blinding of outcome assessment (detection bias) | High risk | No. |
| Intervention bias (strict vs hybrid studies) | Low risk | Not applicable. |
| Incomplete outcome data (attrition bias) | Low risk | Data complete. |
| Selective reporting (reporting bias) | Unclear risk | Study protocol was unavailable for review. |
| Other bias | Low risk | |
| Methods | Single‐centre randomised cross‐over study. | |
| Participants | 15 infants. Inclusion criteria: infants ≤ 1500 g. Ventilator dependent with a ventilator rate ≥ 10/min and having recurrent hypoxaemic episodes (study definition). | |
| Interventions | Ventilator: Stephanie infant ventilator. Pressure controlled SIMV prior to study. Target: SpO2 82‐90%. Standardised protocols for FiO2 adjustment. Cross‐over study:
Duration of intervention: 4 + 4 h. | |
| Outcomes | Primary: time with SpO2 < lower limit of target range (80‐92%). Other: time with SpO2 above/within target range, incidence/duration/severity of desaturation episodes, FiO2, number of FiO2 adjustment necessary to target SpO2, VT, compliance, resistance. | |
| Supplemental data | ||
| Notes | ||
| Risk of bias | ||
| Bias | Authors' judgement | Support for judgement |
| Random sequence generation (selection bias) | Unclear risk | Randomised, but no further information about randomisation procedure. |
| Allocation concealment (selection bias) | Low risk | Blinding of randomisation: sealed envelopes. |
| Blinding of participants and personnel (performance bias) | High risk | No. |
| Blinding of outcome assessment (detection bias) | High risk | No. |
| Intervention bias (strict vs hybrid studies) | Low risk | Not applicable. |
| Incomplete outcome data (attrition bias) | Low risk | Data complete. |
| Selective reporting (reporting bias) | Unclear risk | Study protocol unavailable for review. |
| Other bias | Low risk | |
| Methods | Single‐centre randomised cross‐over study. | |
| Participants | 24 infants. Inclusion criteria: < 32 weeks' GA receiving PLV > 20/min, ≥ 4 episodes of hypoxaemia (SpO2 < 75%) in 8 h prior to study. Exclusion criteria: major congenital abnormalities, inotropes, sepsis or air leak within previous 72 h prior to study. | |
| Interventions | Ventilator: AVEA, CareFusion. Infants remained on mode of ventilation set by clinical team before study. Volume targeting was only difference between groups. Cross‐over study:
Duration of intervention: 24 + 24 h. | |
| Outcomes | Primary outcomes: proportion of time spent with arterial SpO2 < 75%. Secondary outcomes: number and characteristics of hypoxaemic episodes; FiO2 median and IQR, VT and minute ventilation. | |
| Supplemental data | FiO2, mean and SD. | |
| Notes | ||
| Risk of bias | ||
| Bias | Authors' judgement | Support for judgement |
| Random sequence generation (selection bias) | Unclear risk | Randomisation sequence: not specified. |
| Allocation concealment (selection bias) | Unclear risk | Blinding of randomisation: not specified. |
| Blinding of participants and personnel (performance bias) | High risk | No. |
| Blinding of outcome assessment (detection bias) | High risk | No. |
| Intervention bias (strict vs hybrid studies) | Low risk | Not applicable. |
| Incomplete outcome data (attrition bias) | Low risk | Follow‐up: complete to end of intervention. |
| Selective reporting (reporting bias) | Low risk | Trial registered: clinicaltrials.gov NCT01727505. |
| Other bias | Low risk | |
| Methods | Single‐centre randomised trial. | |
| Participants | 18 infants. Inclusion criteria: < 34 weeks' GA, ventilated for RDS before 6 h of age. | |
| Interventions | Ventilator: both groups used Drager Babylog 8000 plus with set backup rate 40/min. Target: PaCO2 of 35‐45 torr (mmHg).
Duration of intervention: 72 h or until extubation. | |
| Outcomes | Blood gas results, pneumothorax, PIE, mortality, cranial ultrasound scan. | |
| Supplemental data | BW, age of death in non‐survivors, BPD, duration of ventilation, pneumothorax, PIE, PVL, IVH, blood gas data. | |
| Notes | Requested trial registration. | |
| Risk of bias | ||
| Bias | Authors' judgement | Support for judgement |
| Random sequence generation (selection bias) | Low risk | Random number table used to randomise participants. |
| Allocation concealment (selection bias) | Low risk | Blinding of randomisation: sealed envelopes. |
| Blinding of participants and personnel (performance bias) | High risk | No. |
| Blinding of outcome assessment (detection bias) | High risk | No. |
| Intervention bias (strict vs hybrid studies) | Low risk | Not applicable. |
| Incomplete outcome data (attrition bias) | Low risk | Follow‐up: complete. |
| Selective reporting (reporting bias) | Unclear risk | Study protocol unavailable for review. |
| Other bias | Low risk | |
| Methods | Dual‐centre randomised trial. | |
| Participants | 53 infants. Inclusion criteria: 25‐32 weeks' GA, received ≥ 1 course of antenatal steroids, ventilated for RDS in first 24 h, treated with surfactant within 3 h. Exclusion criteria: lethal anomalies, receiving muscle relaxants at entry, IVH grade ≥ 2, actual or suspected sepsis. | |
| Interventions | Ventilator: both groups used Draeger Babylog 8000plus with set backup rate 40/min, PEEP 3.5‐4 cmH2O. Mean inflation time 0.4‐0.5 sec (upper limit in PSV mode). Target: FiO2 to maintain SpO2 90‐96%, pH > 7.25, PaO2 50‐75 mmHg, PaCO2 40‐65 mmHg.
Duration of intervention: until extubation. | |
| Outcomes | Lung inflammatory markers. Other outcomes reported: death in hospital, PDA, BPD/receiving oxygen at 28 days and 36 weeks, IVH, PVL, ROP, PIE, PVL, need for postnatal steroids. | |
| Supplemental data | BW, age of death in non‐survivors, BPD, duration of ventilation, pneumothorax, PIE, PVL, IVH, postrandomisation loss. | |
| Notes | Mean GA in PLV group was 29 weeks and mean GA in VTV group was 28 weeks. | |
| Risk of bias | ||
| Bias | Authors' judgement | Support for judgement |
| Random sequence generation (selection bias) | Low risk | Random number sequencing, stratified by GA (25‐28 weeks and 29‐32 weeks) and centre. |
| Allocation concealment (selection bias) | Unclear risk | Blinding of randomisation: not specified. |
| Blinding of participants and personnel (performance bias) | High risk | No. |
| Blinding of outcome assessment (detection bias) | High risk | No. |
| Intervention bias (strict vs hybrid studies) | Low risk | Not applicable. |
| Incomplete outcome data (attrition bias) | Low risk | Follow‐up: complete to discharge. |
| Selective reporting (reporting bias) | Unclear risk | Study protocol not available for review. |
| Other bias | High risk | Imbalance in numbers between the PLV and VTV groups. Postrandomisation, 7 infants excluded because placental histology identified chorioamnionitis (supplemental data), which could have influenced the primary outcome of this study. After postrandomisation exclusions, data from 30 infants in VTV group and 23 infants in PLV group were reported. In post hoc subgroup of infants weighing < 1000 g identified from supplemental data, 12/30 (40%) participants in VTV group were < 1000 g compared with 5/23 (22%) in PLV group. |
| Methods | Single‐centre randomised trial. | |
| Participants | 84 infants allocated to 3 ventilation groups: VTV (n = 31), PLV (n = 30) and high‐frequency ventilation (n = 23). Only data from the 61 infants ventilated with PLV and VTV are included in meta‐analysis. Inclusion criteria: neonatal RDS, defined blood gas/oxygenation criteria, age < 12 h, consent to surfactant. Exclusion criteria: congenital respiratory/cardiac malformations, pulmonary haemorrhage/gas leak/congenital pneumonia/meconium aspiration/wet lung/congenital heart disease/IVH grade III‐IV. | |
| Interventions | Ventilator: Draeger Babylog 8000 (VTV group) and VIP Bird (PLV group).
Duration of intervention: not stated. | |
| Outcomes | No clearly reported primary outcome.
| |
| Supplemental data | Protocol and clarification on methods and results sought, but not received. | |
| Notes | Denominators of outcomes beyond intervention periods were unclear due to challenges following up participants who had transferred to other hospitals or who were withdrawn from active clinical management for financial reasons. Only outcomes which occurred during intervention period were included in meta‐analysis. | |
| Risk of bias | ||
| Bias | Authors' judgement | Support for judgement |
| Random sequence generation (selection bias) | Unclear risk | Random number table used, method not specified. Unequal allocation to 3 groups (PLV, VTV and high‐frequency ventilation), and overall substantially more boys (n = 57) than girls (n = 27) included. |
| Allocation concealment (selection bias) | Unclear risk | No information provided. |
| Blinding of participants and personnel (performance bias) | High risk | No. |
| Blinding of outcome assessment (detection bias) | High risk | No. |
| Intervention bias (strict vs hybrid studies) | High risk | Hybrid study: different ventilators. |
| Incomplete outcome data (attrition bias) | High risk | Completeness of follow‐up not stated. |
| Selective reporting (reporting bias) | Unclear risk | No trial registration. |
| Other bias | Low risk | |
| Methods | Single‐centre randomised trial. | |
| Participants | 34 infants. Inclusion criteria: BW < 1500 g, clinical and radiographic RDS, < 12 h old, about to receive surfactant. Exclusion criteria: major congenital malformations, congenital heart disease, confirmed/suspected sepsis/pneumonia, pneumothorax, other air leak, requiring paralysis/heavy sedation, moribund. | |
| Interventions | Ventilator: both groups used Drager Babylog 8000plus. Ventilator rate adjusted to target blood gas values. Target: pH 7.25‐7.35, PaCO2 45‐55 mmHg, PaO2 50‐70 mmHg, SpO2 88‐95%.
Duration of intervention: 24 h. | |
| Outcomes | Primary: ventilatory pressures during first 24 h after surfactant administration or randomisation. Others: survival to discharge, BPD (36 weeks), IVH, PDA (requiring indomethacin or ligation), NEC (Bell ≥ 2), air leak (PIE, pneumothorax, pneumomediastinum). | |
| Supplemental data | BW, failure of assigned mode, pneumothorax, PIE, IVH. | |
| Notes | ||
| Risk of bias | ||
| Bias | Authors' judgement | Support for judgement |
| Random sequence generation (selection bias) | Low risk | Block randomisation, stratified by weight (500‐750 g, 751‐1000 g, 1001‐1250 g, 1251‐1500 g). |
| Allocation concealment (selection bias) | Low risk | Blinding of randomisation: sealed envelopes. |
| Blinding of participants and personnel (performance bias) | High risk | No. |
| Blinding of outcome assessment (detection bias) | High risk | No. |
| Intervention bias (strict vs hybrid studies) | High risk | Hybrid study: different modes of flow termination. In PSV mode, inflation times varies (flow termination). In SIMV, there is a fixed inflation time. |
| Incomplete outcome data (attrition bias) | Low risk | Follow‐up: complete to discharge. |
| Selective reporting (reporting bias) | Unclear risk | Study protocol unavailable for review. |
| Other bias | Low risk | |
| Methods | Single‐centre randomised trial. | |
| Participants | 57 infants. Inclusion criteria: BW < 2500 g, postnatal age < 72 h, and need for mechanical ventilation for lung disease at randomisation and Servo ventilator available. Exclusion criteria: sepsis/pneumonia, congenital malformation, pneumothorax or any other air leak, meconium aspiration. | |
| Interventions | Ventilator: different ventilators used for experimental group (Siemens Sevo 300 ventilator) and control group (Bear Cub or Sechrist ventilator). Both groups ventilated using PEEP 3‐5 cmH2O and inflation time 0.5 sec. Target: SpO2 88‐95%, pCO2 < 55 mmHg. Infants extubated once ventilator rate < 12/min, FiO2 < 0.25, and after 30‐60 min trial of ETT‐CPAP.
Duration of intervention: until extubation. | |
| Outcomes | Death in hospital, oxygen at 28 days, any air leak, pneumothorax, PIE, any IVH, IVH grade 3‐4, PDA, sepsis, use of muscle relaxants, duration of ventilation. | |
| Supplemental data | BW, age of death in non‐survivors, duration of ventilation. | |
| Notes | Mean GA in PLV group was 29 weeks and mean GA in VTV group was 30 weeks. | |
| Risk of bias | ||
| Bias | Authors' judgement | Support for judgement |
| Random sequence generation (selection bias) | Unclear risk | Randomised, but no further information about randomisation procedure. |
| Allocation concealment (selection bias) | Low risk | Blinding of randomisation: sealed envelopes. |
| Blinding of participants and personnel (performance bias) | High risk | No. |
| Blinding of outcome assessment (detection bias) | High risk | No. |
| Intervention bias (strict vs hybrid studies) | High risk | Hybrid study; the VTV group and PLV group used different ventilator models, modes and synchronisation settings. |
| Incomplete outcome data (attrition bias) | Low risk | Follow‐up: complete. |
| Selective reporting (reporting bias) | Unclear risk | Study protocol unavailable for review. |
| Other bias | Low risk | |
| Methods | Single‐centre randomised trial. | |
| Participants | 56 infants. Inclusion criteria: GA 24‐32 weeks with RDS, requiring ventilation for ≥ 24 h. Exclusion criteria: severe congenital malformation, lack of parental consent and pulmonary air leak on admission. | |
| Interventions | Ventilator: VTV group (PRVC) used Siemens Servo 300. PLV group (SIMV) used 1 of the 4 different ventilators (depending on availability): Bear Cub (CEM)/Bear 750 PSV, Sechrist Millenium, Draeger Babylog 8000 plus or SLE 5000. Both groups: inflation time 0.4 sec, inflation rate 40/min, PEEP 3‐5 cmH2O.
Duration of intervention: until extubation. | |
| Outcomes | Primary outcome: ≥ 12 h with "effective ventilation" (SpO2 > 90 %, PaCO2 < 50 mmHg) with FiO2 < 0.23 and PIP < 15 cmH2O. Secondary outcomes: time to extubation, BPD (28 days), air leak, IVH and PDA. | |
| Supplemental data | Results translated into English. Information regarding stratification sought. | |
| Notes | Despite randomisation, there were imbalances between VTV and PLV groups in FiO2 in first 6 h of life and surfactant use (higher FiO2 and more surfactant used in the VTV group). In published report, authors adjusted for this difference, but in this review the unadjusted outcomes were used. Median GA in PLV group was 28 weeks and median GA in VTV group was 28 weeks. | |
| Risk of bias | ||
| Bias | Authors' judgement | Support for judgement |
| Random sequence generation (selection bias) | Low risk | Sequential numbers. Stratified by GA (24‐28 weeks and 29‐33 weeks). |
| Allocation concealment (selection bias) | Low risk | Blinding of randomisation: sealed envelopes. |
| Blinding of participants and personnel (performance bias) | High risk | No. |
| Blinding of outcome assessment (detection bias) | High risk | No. |
| Intervention bias (strict vs hybrid studies) | High risk | Hybrid study: different ventilators. |
| Incomplete outcome data (attrition bias) | Low risk | Follow‐up: complete to discharge. |
| Selective reporting (reporting bias) | Unclear risk | Study protocol unavailable for review. |
| Other bias | High risk | Although randomised, infants in the VTV (PRVC) group had increased surfactant use and increased FiO2 in first 6 h after admission. |
| Methods | Single‐centre randomised cross‐over study. | |
| Participants | 32 Infants. Inclusion criteria: BW <1500 g, recovered from RDS, presenting with hypoxaemic episodes. | |
| Interventions | Ventilator: both groups used Draeger Babylog 8000plus. Cross‐over study: 12 infants with expired VTtarget 4.5 mL/kg. 20 infants with expired VTtarget 6.0 mL/kg. 1st group (n = 12)
2nd group (n = 20)
Duration of intervention: 2 + 2 h. | |
| Outcomes | Primary: frequency and severity of hypoxaemic episodes. Other: PIP, distribution of VT, frequency and duration of hypoxaemia (SpO2 < 88%, < 75%), FiO2. | |
| Supplemental data | Study protocol. | |
| Notes | ||
| Risk of bias | ||
| Bias | Authors' judgement | Support for judgement |
| Random sequence generation (selection bias) | Unclear risk | Randomised, but no further information about randomisation procedure. |
| Allocation concealment (selection bias) | Unclear risk | No information provided. |
| Blinding of participants and personnel (performance bias) | High risk | No. |
| Blinding of outcome assessment (detection bias) | High risk | No. |
| Intervention bias (strict vs hybrid studies) | Low risk | Not applicable. |
| Incomplete outcome data (attrition bias) | Low risk | Data complete. |
| Selective reporting (reporting bias) | Low risk | Study protocol sent to review authors. Study retrospectively registered. |
| Other bias | Low risk | |
| Methods | Dual‐centre randomised trial. | |
| Participants | Initially 2 centres, but reduced to one; 109 infants. Inclusion criteria: BW 600‐1500 g, GA 24‐31 weeks with RDS requiring mechanical ventilation. Exclusion criteria: severe congenital malformations. All participants included as intention to treat. Some analyses only performed for participants from main centre. | |
| Interventions | Ventilator: both groups used VIP Bird Gold.
Duration of intervention: until infants were recovering from their acute respiratory illness. At that point, the ventilatory mode was changed to SIMV with pressure support ("weaning mode") for participants in both groups. | |
| Outcomes | Primary outcome criteria: time from entry into the study until achievement of either AaDO2 < 13 kPa for > 12 h or MAP < 8.0 cmH2O for > 12 h. Other: total duration of mechanical ventilation, duration of MV + CPAP, survival to discharge, frequency of complications: BPD (36 weeks), IVH, PVL, PDA (requiring treatment), NEC (Bell grade ≥ 2), FiO2 (data from Swamy 2008). Follow‐up (Singh 2009): need for home oxygen, cough, wheeze, inhaler use, rate of hospital readmission, rate of respiratory readmission, neurodisability (cerebral palsy, deaf, behavioural problems, blindness) by questionnaire. | |
| Supplemental data | BW, age of death in non‐survivors, BPD, duration of ventilation, pneumothorax, PIE, PVL, IVH, PDA. | |
| Notes | 109 infants enrolled in Singh 2006, of whom 94 survived to discharge. 3 infants died post‐discharge. Follow‐up studies: Singh 2009: 85/91 (93%) infants eligible for follow‐up assessed at median of 22 months' corrected age; 45 in VTV group and 40 in PLV group (Singh 2009). Reported on pulmonary morbidities and gross neurodevelopmental outcomes and mortality Swamy 2008: reported on respiratory parameters | |
| Risk of bias | ||
| Bias | Authors' judgement | Support for judgement |
| Random sequence generation (selection bias) | Low risk | Random block randomisation. Stratified by BW. |
| Allocation concealment (selection bias) | Low risk | Blinding of randomisation: sealed, opaque envelopes. |
| Blinding of participants and personnel (performance bias) | High risk | No. |
| Blinding of outcome assessment (detection bias) | High risk | Blinding of outcome measurements to discharge: no. Investigators involved in long‐term follow‐up were blinded to original treatment modality. |
| Intervention bias (strict vs hybrid studies) | Low risk | Not applicable. |
| Incomplete outcome data (attrition bias) | Low risk | Follow‐up: complete to discharge. 85/91 (93%) infants eligible for follow‐up were assessed at a median of 22 months' corrected age. |
| Selective reporting (reporting bias) | Unclear risk | Study protocol unavailable for review. |
| Other bias | Unclear risk | Both arms weaned using PLV mode. |
| Methods | Single‐centre randomised trial. | |
| Participants | 50 infants. Inclusion criteria: BW > 1200 g and had RDS requiring mechanical ventilation. Exclusion criteria: confirmed/suspected sepsis/pneumonia, congenital malformation or lack of arterial access. | |
| Interventions | Ventilator: both groups used VIP Bird ventilator in AC mode with inflation time at 0.3‐0.5 sec. Target: pH 7.27‐7.40, PaCO2 4.5 to 6 kPa, PaO2 8‐11 kPa.
Duration of intervention: until weaning from ventilation. | |
| Outcomes | "Success" criteria outcome: time from entry into study until achievement of either AaDO2< 13 kPa for > 12 h or MAP < 8.0 cmH2O for > 12 h or extubation. Other outcome criteria: death in hospital, failed allocated treatment, IVH or PVL (not reported separately), BPD (in oxygen at 36 weeks), pneumothorax, PDA. | |
| Supplemental data | Requested study protocol/trial registration. | |
| Notes | ||
| Risk of bias | ||
| Bias | Authors' judgement | Support for judgement |
| Random sequence generation (selection bias) | Unclear risk | Randomised, but no further information about randomisation procedure. |
| Allocation concealment (selection bias) | Low risk | Blinding of randomisation: sealed envelopes. |
| Blinding of participants and personnel (performance bias) | High risk | No. |
| Blinding of outcome assessment (detection bias) | High risk | Was done for chest x‐ray findings, but not for other outcome. |
| Intervention bias (strict vs hybrid studies) | High risk | Hybrid study: VTV mode was pressure triggered. PLV mode was flow triggered. |
| Incomplete outcome data (attrition bias) | Low risk | Follow‐up: complete. |
| Selective reporting (reporting bias) | Unclear risk | Study protocol not available. |
| Other bias | Unclear risk | Both arms weaned using a PLV mode. |
| Methods | Single‐centre randomised trial. | |
| Participants | 30 infants. Inclusion criteria: very low BW (≤ 1500 g, ≤ 32 weeks GA) infants with hyaline membrane disease. Exclusion criteria: perinatal infection, positive lower respiratory tract culture, blood in ETT secretion or pulmonary haemorrhage, severe congenital malformation. | |
| Interventions | Ventilator: both groups used Drager Babylog 8000plus in SIMV mode.
Rest of ventilator parameters regulated according to blood gases analysis. Duration of intervention: not described. | |
| Outcomes | Primary: proinflammatory cytokines in bronchoalveolar lavage fluid. Other: FiO2, pneumothorax (data included in meta‐analysis). BPD and IVH (incomplete information), death (data not included in meta‐analysis). | |
| Supplemental data | Protocol and clarification on methods and results sought, but not received. | |
| Notes | Denominators of outcomes beyond intervention periods were unclear due to challenges following up participants who had transferred to other hospitals or who were withdrawn from active clinical management for financial reasons. Only outcomes which occurred during intervention period were included in meta‐analysis. | |
| Risk of bias | ||
| Bias | Authors' judgement | Support for judgement |
| Random sequence generation (selection bias) | Unclear risk | Randomised, but no further information about randomisation procedure. |
| Allocation concealment (selection bias) | Unclear risk | Not described. |
| Blinding of participants and personnel (performance bias) | High risk | No. |
| Blinding of outcome assessment (detection bias) | High risk | No. |
| Intervention bias (strict vs hybrid studies) | Low risk | Not applicable. |
| Incomplete outcome data (attrition bias) | High risk | Postintervention outcomes report on 25/30 (83%) participants. Stated reasons included financial dropouts and withdrawal from study due to IVH. |
| Selective reporting (reporting bias) | Unclear risk | Review authors requested study protocol, but received no response. |
| Other bias | Low risk | |
AaDO2: alveolar to arterial oxygen pressure difference; AC: assist control; BPD: bronchopulmonary dysplasia; BW: birth weight; CPAP: continuous positive airway pressure; CNS: central nervous system; ETT: endotracheal tube; FiO2: fraction of inspired oxygen; GA: gestational age; h: hour; IQR: interquartile range; IMV: intermittent mandatory ventilation; IVH: intraventricular haemorrhage; MAP: mean airway pressure; min: minute; MV: mandatory ventilation; n: number of infants; NEC: necrotising enterocolitis; Pmax: maximum peak inflation pressure; pCO2: partial pressure of carbon dioxide; PaCO2: partial pressure of carbon dioxide in arterial blood; PaO2: partial pressure of oxygen in arterial blood; PDA: patent ductus arteriosus; PEEP: positive end‐expiratory pressure; PIE: pulmonary interstitial emphysema; PIP: peak inflation pressure; PLV: pressure‐limited ventilation; Pmax: maximum peak inflation pressure; PRVC: pressure‐regulated volume control; PSV: pressure support ventilation; PVL: periventricular leukomalacia; RDS: respiratory distress syndrome; ROP: retinopathy of prematurity; SD: standard deviation; sec: second; SIMV: synchronised intermittent mandatory ventilation; SIPPV: synchronised intermittent positive pressure ventilation (same as AC); SpO2: blood oxygen saturation level; TcCO2: transcutaneous carbon dioxide; Timax: maximal inspiratory time; TTV: targeted tidal volume; VG: volume guarantee; VTtarget: target tidal volume; VTV: volume‐targeted ventilation.
Characteristics of excluded studies [ordered by study ID]
| Study | Reason for exclusion |
| Journal publication. Cross‐over study, but not randomised. | |
| Journal publication. Order of ventilatory modes not randomised in this cross‐over study which means that an effect of fatigue cannot be excluded. Additionally, study did not report outcomes specified in this Cochrane Review. | |
| Abstract presentation. Study investigating time to recovery after ETT suction in infants randomised to ventilation with/without VG mode. Study did not report outcomes specified in this Cochrane Review. | |
| Journal publication. Short‐term cross‐over study did not address any of the outcomes of this Cochrane Review. Also, the cross‐over was made from PLV to VG mode without changing Pmax, which may have interfered with the ventilator's capacity to deliver the set VT and hence affected the outcomes. | |
| Abstract presentation. Randomised trial comparing 3 groups ventilated with Draeger Babylog 8000plus: group 1: PSV; group 2: PSV + VG; group 3: AC + VG. However, outcomes were biochemical assays of inflammatory markers in serum and tracheal aspirates. Study did not report outcomes specified in this Cochrane Review. Despite randomisation, there were inception differences in study group characteristics. We attempted to contact authors for further information. | |
| Abstract presentation. Randomised study, but authors did not report outcomes specified in this Cochrane Review. | |
| Abstract presentation. Abstract did not report whether interventions randomised. Study outcomes did not include those specified in this Cochrane Review. | |
| Journal publication (in Italian). A non‐randomised study. | |
| Randomised study, but later the studies were terminated. | |
| Study designed to compare effects of VG with pressure supported vs synchronised intermittent mandatory ventilation in very low birth weight infants. Study started in 2006, but later participant recruitment was suspended due to suboptimal enrolment after 18 months, and study was terminated. | |
| Journal publication. Cross‐over study that did not discuss outcome measurements of this Cochrane Review. | |
| Abstract presentation. Randomised study, but authors did not report the outcomes specified in this Cochrane Review. | |
| Journal publication. Non‐randomised study. | |
| Abstract presentation. Outcomes did not include those specified in this Cochrane Review. | |
| Journal publication. Non‐randomised study. | |
| Abstract presentation. Comparing 2 VTV modes, no comparison with PLV mode. | |
| Abstract presentation. No information in the abstract whether intervention was randomised. Outcomes did not include those specified in this Cochrane Review. |
AC: assist control; ETT: endotracheal tube; Pmax: maximum peak inflation pressure; PLV: pressure‐limited ventilation; PSV: pressure support ventilation; VG: volume guarantee; VT: tidal volume; VTV: volume‐targeted ventilation.
Characteristics of studies awaiting assessment [ordered by study ID]
| Methods | Article published in Chinese. We have not been able to obtain a translated version. |
| Participants | |
| Interventions | |
| Outcomes | |
| Notes | Translated manuscript sought. |
| Methods | Randomised parallel study. |
| Participants | 35 preterm infants 25‐32 weeks' gestation. |
| Interventions | SIMV, PSV + VG |
| Outcomes | |
| Notes | Final published data awaited. Published as abstract only. |
PSV: pressure support ventilation; SIMV: synchronised intermittent mandatory ventilation; VG: volume guarantee.
Characteristics of ongoing studies [ordered by study ID]
| Trial name or title | A Randomised Controlled Trial of Modes of Ventilatory Support in Preterm Infants from Point of Delivery to the Neonatal Intensive Care Unit. |
| Methods | Randomisation (sealed enveloped). |
| Participants | Preterm infants < 32 weeks, ventilated in delivery room. |
| Interventions | VTV group: triggered VG mode. PLV group: IMV. |
| Outcomes | PaCO2, PaO2, cerebral blood flow, IVH grade 3‐4, PVL, BPD, neurodevelopmental impairment at 1 and 3 years. |
| Starting date | 29 November 2006. |
| Contact information | Dr Mark Tracey. The ACTRN12609000986279 trial of VTV from the point of delivery was registered with the Australian New Zealand Clinical Trials Registry. Recruitment commenced November 2006 and has now closed. At this stage, no outcomes have been reported. |
| Notes | We have attempted to contact the authors for further information. |
| Trial name or title | Effect of VG Combined with SIMV vs SIMV in the Extremely Premature Infant. |
| Methods | Randomisation (unspecified). |
| Participants | 60 very low birth weight infants. |
| Interventions | VTV group: SIMV + VG. PLV group: SIMV. |
| Outcomes | PIP, MAP, VT, CO2, FiO2/SpO2. Duration of mechanical ventilation, oxygen therapy, duration of admission, PDA, IVH, PVL, BPD, 2‐year follow‐up data. |
| Starting date | Not reported. |
| Contact information | Dr Salvia. |
| Notes | Studied from 30 min after first surfactant dose. Study is ongoing and collecting 2‐year follow‐up data. Hitherto only short‐term outcomes have been presented in abstract form. Longer‐term follow‐up is in progress (information from author), and the final published data are awaited. We have attempted to contact the authors for further information. |
BPD: bronchopulmonary dysplasia; FiO2: fraction of inspired oxygen; IMV: intermittent mandatory ventilation; IVH: intraventricular haemorrhage; MAP: mean airway pressure; PaCO2: partial pressure of carbon dioxide in arterial blood; PaO2: partial pressure of oxygen in arterial blood; PDA: patent ductus arteriosus; PIP: peak inflation pressure; PLV: pressure‐limited ventilation; PVL: periventricular leukomalacia; SIMV: synchronised intermittent mandatory ventilation; SpO2: blood oxygen saturation level; VG: volume guarantee; VT: tidal volume; VTV: volume‐targeted ventilation.
Data and analyses
| Outcome or subgroup title | No. of studies | No. of participants | Statistical method | Effect size |
| 1 Death before discharge from hospital Show forest plot | 11 | 771 | Risk Ratio (M‐H, Fixed, 95% CI) | 0.75 [0.53, 1.07] |
| Analysis 1.1  Comparison 1 Volume‐targeted ventilation (VTV) versus pressure‐limited ventilation (PLV) ‐ subgroup by mode of ventilation, Outcome 1 Death before discharge from hospital. | ||||
| 1.1 Strict studies | 4 | 220 | Risk Ratio (M‐H, Fixed, 95% CI) | 0.60 [0.31, 1.15] |
| 1.2 Hybrid studies | 7 | 551 | Risk Ratio (M‐H, Fixed, 95% CI) | 0.83 [0.55, 1.25] |
| 2 Death or bronchopulmonary dysplasia (BPD) (36 weeks) Show forest plot | 8 | 584 | Risk Ratio (M‐H, Fixed, 95% CI) | 0.73 [0.59, 0.89] |
| Analysis 1.2  Comparison 1 Volume‐targeted ventilation (VTV) versus pressure‐limited ventilation (PLV) ‐ subgroup by mode of ventilation, Outcome 2 Death or bronchopulmonary dysplasia (BPD) (36 weeks). | ||||
| 2.1 Strict studies | 4 | 220 | Risk Ratio (M‐H, Fixed, 95% CI) | 0.68 [0.50, 0.94] |
| 2.2 Hybrid studies | 4 | 364 | Risk Ratio (M‐H, Fixed, 95% CI) | 0.76 [0.58, 0.99] |
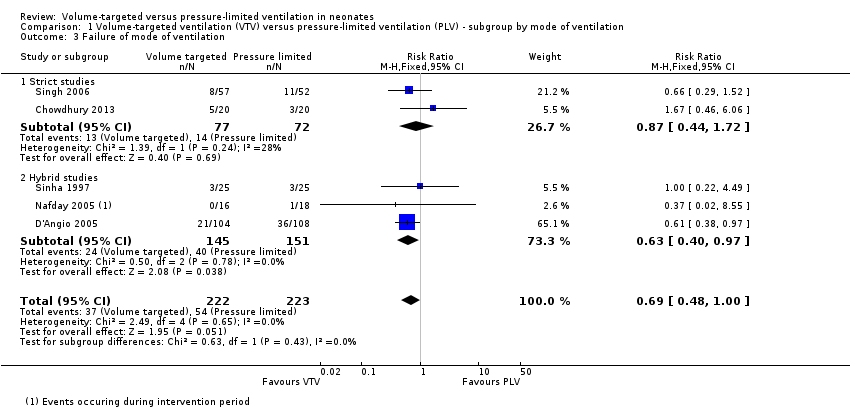
| 3 Failure of mode of ventilation Show forest plot | 5 | 445 | Risk Ratio (M‐H, Fixed, 95% CI) | 0.69 [0.48, 1.00] |
| Analysis 1.3  Comparison 1 Volume‐targeted ventilation (VTV) versus pressure‐limited ventilation (PLV) ‐ subgroup by mode of ventilation, Outcome 3 Failure of mode of ventilation. | ||||
| 3.1 Strict studies | 2 | 149 | Risk Ratio (M‐H, Fixed, 95% CI) | 0.87 [0.44, 1.72] |
| 3.2 Hybrid studies | 3 | 296 | Risk Ratio (M‐H, Fixed, 95% CI) | 0.63 [0.40, 0.97] |
| 4 Addition of neuromuscular paralysis where previously not paralysed Show forest plot | 2 | 75 | Risk Ratio (M‐H, Fixed, 95% CI) | 0.32 [0.07, 1.40] |
| Analysis 1.4 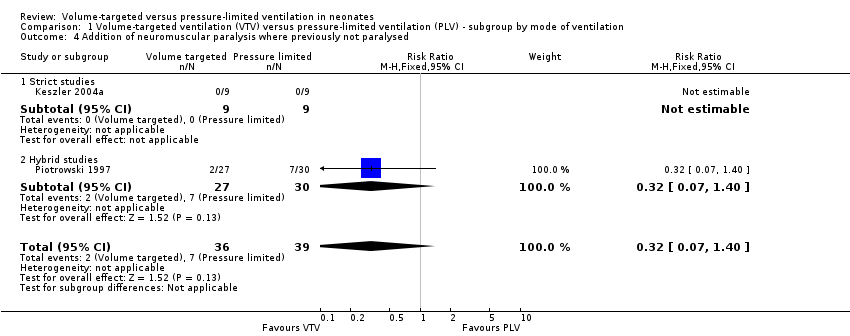 Comparison 1 Volume‐targeted ventilation (VTV) versus pressure‐limited ventilation (PLV) ‐ subgroup by mode of ventilation, Outcome 4 Addition of neuromuscular paralysis where previously not paralysed. | ||||
| 4.1 Strict studies | 1 | 18 | Risk Ratio (M‐H, Fixed, 95% CI) | 0.0 [0.0, 0.0] |
| 4.2 Hybrid studies | 1 | 57 | Risk Ratio (M‐H, Fixed, 95% CI) | 0.32 [0.07, 1.40] |
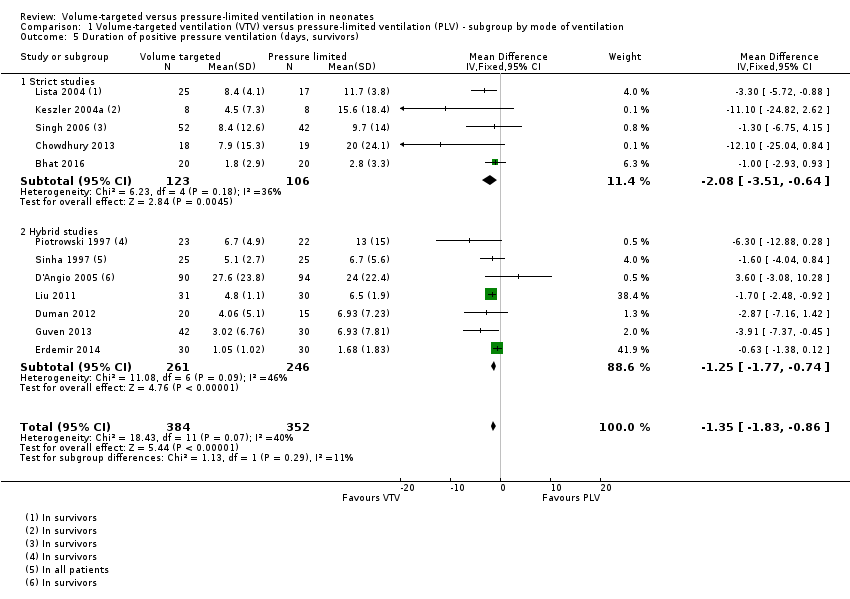
| 5 Duration of positive pressure ventilation (days, survivors) Show forest plot | 12 | 736 | Mean Difference (IV, Fixed, 95% CI) | ‐1.35 [‐1.83, ‐0.86] |
| Analysis 1.5  Comparison 1 Volume‐targeted ventilation (VTV) versus pressure‐limited ventilation (PLV) ‐ subgroup by mode of ventilation, Outcome 5 Duration of positive pressure ventilation (days, survivors). | ||||
| 5.1 Strict studies | 5 | 229 | Mean Difference (IV, Fixed, 95% CI) | ‐2.08 [‐3.51, ‐0.64] |
| 5.2 Hybrid studies | 7 | 507 | Mean Difference (IV, Fixed, 95% CI) | ‐1.25 [‐1.77, ‐0.74] |
| 6 Duration of positive pressure ventilation (log data, survivors) Show forest plot | 5 | 381 | Mean Difference (IV, Fixed, 95% CI) | ‐0.08 [‐0.16, ‐0.00] |
| Analysis 1.6 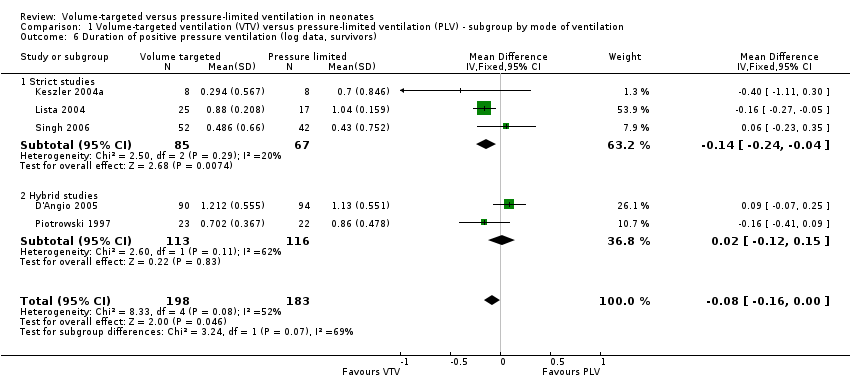 Comparison 1 Volume‐targeted ventilation (VTV) versus pressure‐limited ventilation (PLV) ‐ subgroup by mode of ventilation, Outcome 6 Duration of positive pressure ventilation (log data, survivors). | ||||
| 6.1 Strict studies | 3 | 152 | Mean Difference (IV, Fixed, 95% CI) | ‐0.14 [‐0.24, ‐0.04] |
| 6.2 Hybrid studies | 2 | 229 | Mean Difference (IV, Fixed, 95% CI) | 0.02 [‐0.12, 0.15] |
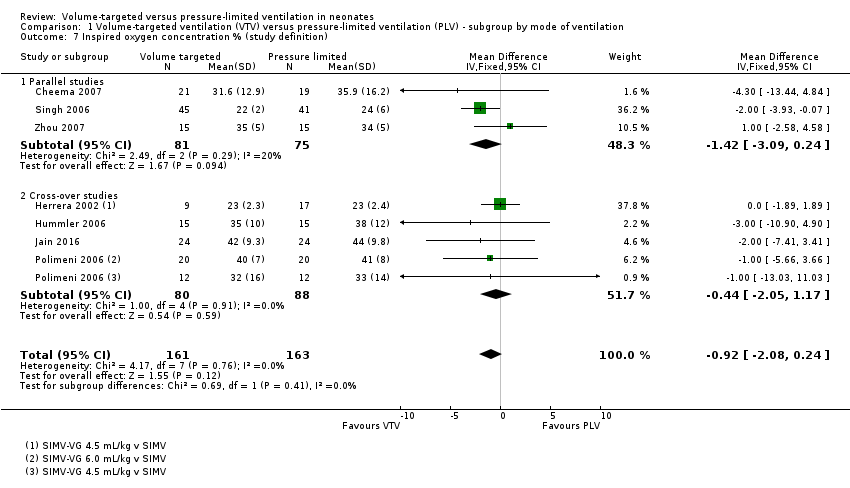
| 7 Inspired oxygen concentration % (study definition) Show forest plot | 7 | 324 | Mean Difference (IV, Fixed, 95% CI) | ‐0.92 [‐2.08, 0.24] |
| Analysis 1.7  Comparison 1 Volume‐targeted ventilation (VTV) versus pressure‐limited ventilation (PLV) ‐ subgroup by mode of ventilation, Outcome 7 Inspired oxygen concentration % (study definition). | ||||
| 7.1 Parallel studies | 3 | 156 | Mean Difference (IV, Fixed, 95% CI) | ‐1.42 [‐3.09, 0.24] |
| 7.2 Cross‐over studies | 4 | 168 | Mean Difference (IV, Fixed, 95% CI) | ‐0.44 [‐2.05, 1.17] |
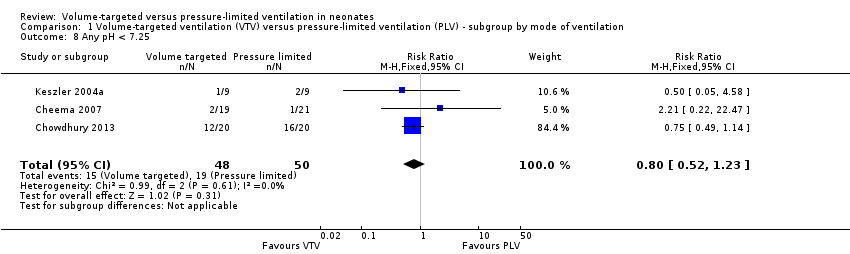
| 8 Any pH < 7.25 Show forest plot | 3 | 98 | Risk Ratio (M‐H, Fixed, 95% CI) | 0.80 [0.52, 1.23] |
| Analysis 1.8  Comparison 1 Volume‐targeted ventilation (VTV) versus pressure‐limited ventilation (PLV) ‐ subgroup by mode of ventilation, Outcome 8 Any pH < 7.25. | ||||
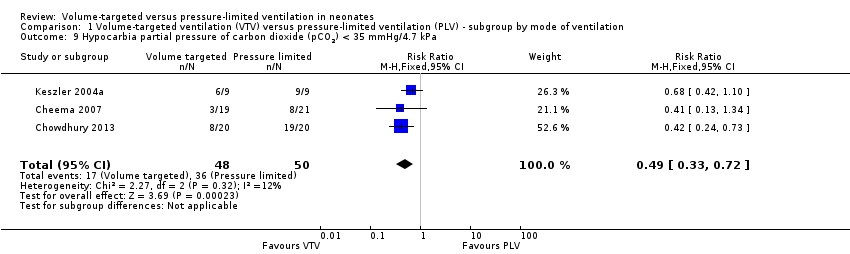
| 9 Hypocarbia partial pressure of carbon dioxide (pCO2) < 35 mmHg/4.7 kPa Show forest plot | 3 | 98 | Risk Ratio (M‐H, Fixed, 95% CI) | 0.49 [0.33, 0.72] |
| Analysis 1.9  Comparison 1 Volume‐targeted ventilation (VTV) versus pressure‐limited ventilation (PLV) ‐ subgroup by mode of ventilation, Outcome 9 Hypocarbia partial pressure of carbon dioxide (pCO2) < 35 mmHg/4.7 kPa. | ||||
| 10 Respiratory acidosis; pH < 7.25 and pCO2 > 8 kPa Show forest plot | 3 | 98 | Risk Ratio (M‐H, Fixed, 95% CI) | 0.93 [0.51, 1.70] |
| Analysis 1.10 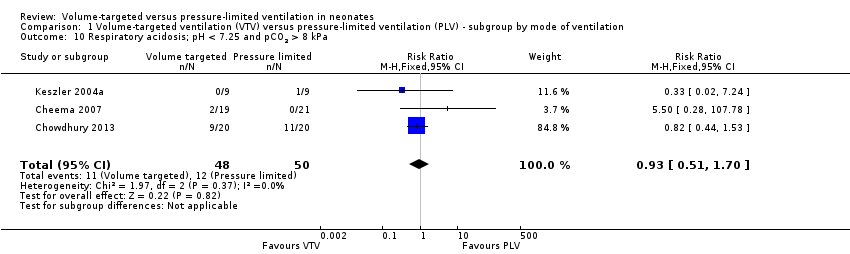 Comparison 1 Volume‐targeted ventilation (VTV) versus pressure‐limited ventilation (PLV) ‐ subgroup by mode of ventilation, Outcome 10 Respiratory acidosis; pH < 7.25 and pCO2 > 8 kPa. | ||||
| 11 Incidence of hypocarbia or respiratory acidosis Show forest plot | 2 | 58 | Risk Ratio (M‐H, Fixed, 95% CI) | 0.69 [0.42, 1.12] |
| Analysis 1.11  Comparison 1 Volume‐targeted ventilation (VTV) versus pressure‐limited ventilation (PLV) ‐ subgroup by mode of ventilation, Outcome 11 Incidence of hypocarbia or respiratory acidosis. | ||||
| 12 Patent ductus arteriosus Show forest plot | 10 | 754 | Risk Ratio (M‐H, Fixed, 95% CI) | 0.95 [0.80, 1.12] |
| Analysis 1.12 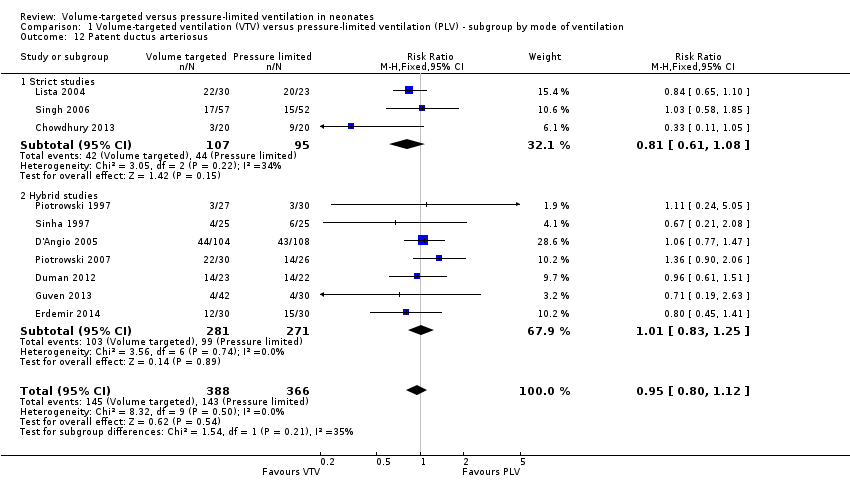 Comparison 1 Volume‐targeted ventilation (VTV) versus pressure‐limited ventilation (PLV) ‐ subgroup by mode of ventilation, Outcome 12 Patent ductus arteriosus. | ||||
| 12.1 Strict studies | 3 | 202 | Risk Ratio (M‐H, Fixed, 95% CI) | 0.81 [0.61, 1.08] |
| 12.2 Hybrid studies | 7 | 552 | Risk Ratio (M‐H, Fixed, 95% CI) | 1.01 [0.83, 1.25] |
| 13 Air leak (any) Show forest plot | 5 | 374 | Risk Ratio (M‐H, Fixed, 95% CI) | 0.79 [0.44, 1.43] |
| Analysis 1.13  Comparison 1 Volume‐targeted ventilation (VTV) versus pressure‐limited ventilation (PLV) ‐ subgroup by mode of ventilation, Outcome 13 Air leak (any). | ||||
| 13.1 Strict studies | 2 | 71 | Risk Ratio (M‐H, Fixed, 95% CI) | 0.51 [0.09, 2.81] |
| 13.2 Hybrid Studies | 3 | 303 | Risk Ratio (M‐H, Fixed, 95% CI) | 0.84 [0.45, 1.58] |
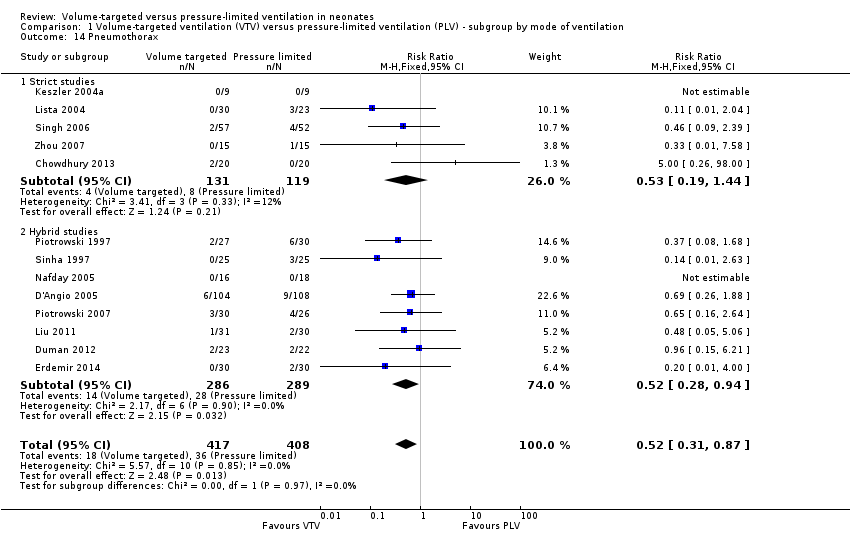
| 14 Pneumothorax Show forest plot | 13 | 825 | Risk Ratio (M‐H, Fixed, 95% CI) | 0.52 [0.31, 0.87] |
| Analysis 1.14  Comparison 1 Volume‐targeted ventilation (VTV) versus pressure‐limited ventilation (PLV) ‐ subgroup by mode of ventilation, Outcome 14 Pneumothorax. | ||||
| 14.1 Strict studies | 5 | 250 | Risk Ratio (M‐H, Fixed, 95% CI) | 0.53 [0.19, 1.44] |
| 14.2 Hybrid studies | 8 | 575 | Risk Ratio (M‐H, Fixed, 95% CI) | 0.52 [0.28, 0.94] |
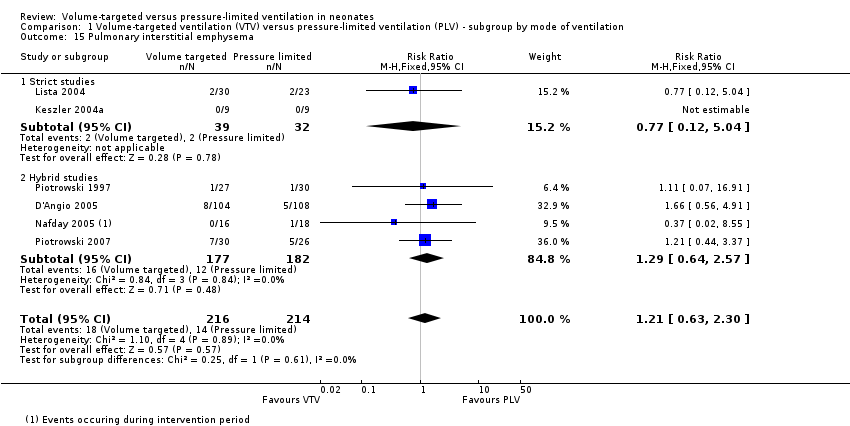
| 15 Pulmonary interstitial emphysema Show forest plot | 6 | 430 | Risk Ratio (M‐H, Fixed, 95% CI) | 1.21 [0.63, 2.30] |
| Analysis 1.15  Comparison 1 Volume‐targeted ventilation (VTV) versus pressure‐limited ventilation (PLV) ‐ subgroup by mode of ventilation, Outcome 15 Pulmonary interstitial emphysema. | ||||
| 15.1 Strict studies | 2 | 71 | Risk Ratio (M‐H, Fixed, 95% CI) | 0.77 [0.12, 5.04] |
| 15.2 Hybrid studies | 4 | 359 | Risk Ratio (M‐H, Fixed, 95% CI) | 1.29 [0.64, 2.57] |
| 16 Any intraventricular haemorrhage (IVH) Show forest plot | 6 | 501 | Risk Ratio (M‐H, Fixed, 95% CI) | 0.90 [0.70, 1.15] |
| Analysis 1.16 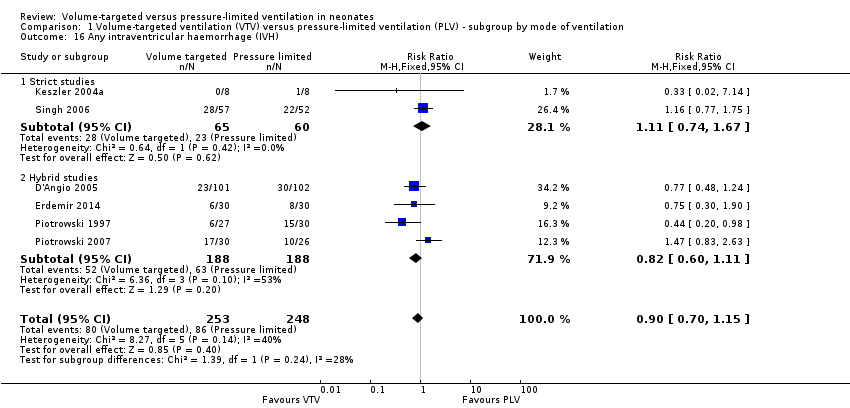 Comparison 1 Volume‐targeted ventilation (VTV) versus pressure‐limited ventilation (PLV) ‐ subgroup by mode of ventilation, Outcome 16 Any intraventricular haemorrhage (IVH). | ||||
| 16.1 Strict studies | 2 | 125 | Risk Ratio (M‐H, Fixed, 95% CI) | 1.11 [0.74, 1.67] |
| 16.2 Hybrid studies | 4 | 376 | Risk Ratio (M‐H, Fixed, 95% CI) | 0.82 [0.60, 1.11] |
| 17 Periventricular leukomalacia (PVL) Show forest plot | 7 | 508 | Risk Ratio (M‐H, Fixed, 95% CI) | 0.45 [0.21, 0.98] |
| Analysis 1.17  Comparison 1 Volume‐targeted ventilation (VTV) versus pressure‐limited ventilation (PLV) ‐ subgroup by mode of ventilation, Outcome 17 Periventricular leukomalacia (PVL). | ||||
| 17.1 Strict studies | 4 | 218 | Risk Ratio (M‐H, Fixed, 95% CI) | 0.53 [0.17, 1.65] |
| 17.2 Hybrid studies | 3 | 290 | Risk Ratio (M‐H, Fixed, 95% CI) | 0.40 [0.14, 1.14] |
| 18 IVH grade 3‐4 Show forest plot | 10 | 712 | Risk Difference (M‐H, Fixed, 95% CI) | ‐0.09 [‐0.14, ‐0.04] |
| Analysis 1.18  Comparison 1 Volume‐targeted ventilation (VTV) versus pressure‐limited ventilation (PLV) ‐ subgroup by mode of ventilation, Outcome 18 IVH grade 3‐4. | ||||
| 18.1 Strict studies | 4 | 218 | Risk Difference (M‐H, Fixed, 95% CI) | ‐0.05 [‐0.13, 0.02] |
| 18.2 Hybrid studies | 6 | 494 | Risk Difference (M‐H, Fixed, 95% CI) | ‐0.10 [‐0.17, ‐0.04] |
| 19 Any IVH or PVL Show forest plot | 3 | 298 | Risk Ratio (M‐H, Fixed, 95% CI) | 0.83 [0.58, 1.18] |
| Analysis 1.19  Comparison 1 Volume‐targeted ventilation (VTV) versus pressure‐limited ventilation (PLV) ‐ subgroup by mode of ventilation, Outcome 19 Any IVH or PVL. | ||||
| 19.1 Strict studies | 2 | 125 | Risk Ratio (M‐H, Fixed, 95% CI) | 0.83 [0.52, 1.35] |
| 19.2 Hybrid studies | 1 | 173 | Risk Ratio (M‐H, Fixed, 95% CI) | 0.82 [0.48, 1.39] |
| 20 IVH grade 3‐4 or PVL Show forest plot | 6 | 441 | Risk Ratio (M‐H, Fixed, 95% CI) | 0.47 [0.27, 0.80] |
| Analysis 1.20  Comparison 1 Volume‐targeted ventilation (VTV) versus pressure‐limited ventilation (PLV) ‐ subgroup by mode of ventilation, Outcome 20 IVH grade 3‐4 or PVL. | ||||
| 20.1 Strict studies | 4 | 218 | Risk Ratio (M‐H, Fixed, 95% CI) | 0.51 [0.25, 1.03] |
| 20.2 Hybrid studies | 2 | 223 | Risk Ratio (M‐H, Fixed, 95% CI) | 0.42 [0.19, 0.96] |
| 21 BPD (supplemental oxygen in survivors at 36 weeks only) Show forest plot | 9 | 620 | Risk Ratio (M‐H, Fixed, 95% CI) | 0.68 [0.53, 0.87] |
| Analysis 1.21 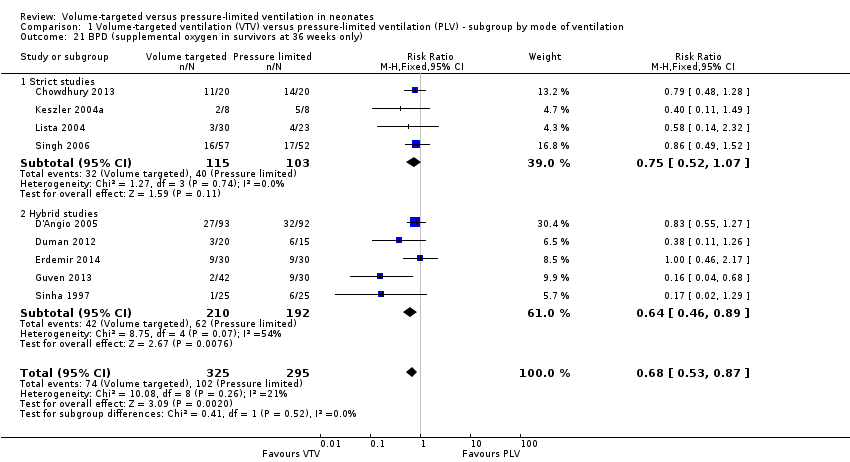 Comparison 1 Volume‐targeted ventilation (VTV) versus pressure‐limited ventilation (PLV) ‐ subgroup by mode of ventilation, Outcome 21 BPD (supplemental oxygen in survivors at 36 weeks only). | ||||
| 21.1 Strict studies | 4 | 218 | Risk Ratio (M‐H, Fixed, 95% CI) | 0.75 [0.52, 1.07] |
| 21.2 Hybrid studies | 5 | 402 | Risk Ratio (M‐H, Fixed, 95% CI) | 0.64 [0.46, 0.89] |
| Outcome or subgroup title | No. of studies | No. of participants | Statistical method | Effect size |
| 1 Death in hospital Show forest plot | 5 | 246 | Risk Ratio (M‐H, Fixed, 95% CI) | 0.71 [0.42, 1.21] |
| Analysis 2.1  Comparison 2 Volume‐targeted ventilation (VTV) versus pressure‐limited ventilation (PLV) ‐ infants weighing less than 1000 g, Outcome 1 Death in hospital. | ||||
| 1.1 Strict studies | 4 | 226 | Risk Ratio (M‐H, Fixed, 95% CI) | 0.80 [0.46, 1.39] |
| 1.2 Hybrid studies | 1 | 20 | Risk Ratio (M‐H, Fixed, 95% CI) | 0.25 [0.03, 1.86] |
| 2 Death or bronchopulmonary dysplasia (BPD) (36 weeks) Show forest plot | 4 | 224 | Risk Ratio (M‐H, Fixed, 95% CI) | 0.79 [0.62, 1.01] |
| Analysis 2.2  Comparison 2 Volume‐targeted ventilation (VTV) versus pressure‐limited ventilation (PLV) ‐ infants weighing less than 1000 g, Outcome 2 Death or bronchopulmonary dysplasia (BPD) (36 weeks). | ||||
| 2.1 Strict studies | 3 | 81 | Risk Ratio (M‐H, Fixed, 95% CI) | 0.75 [0.52, 1.10] |
| 2.2 Hybrid studies | 1 | 143 | Risk Ratio (M‐H, Fixed, 95% CI) | 0.82 [0.59, 1.12] |
| 3 Duration of positive pressure ventilation (days, survivors) Show forest plot | 5 | 198 | Mean Difference (IV, Fixed, 95% CI) | ‐0.82 [‐4.43, 2.80] |
| Analysis 2.3  Comparison 2 Volume‐targeted ventilation (VTV) versus pressure‐limited ventilation (PLV) ‐ infants weighing less than 1000 g, Outcome 3 Duration of positive pressure ventilation (days, survivors). | ||||
| 3.1 Strict studies | 3 | 63 | Mean Difference (IV, Fixed, 95% CI) | ‐0.32 [‐4.53, 3.89] |
| 3.2 Hybrid studies | 2 | 135 | Mean Difference (IV, Fixed, 95% CI) | ‐2.21 [‐9.29, 4.87] |
| 4 Duration of positive pressure ventilation (log data, survivors) Show forest plot | 5 | 198 | Mean Difference (IV, Fixed, 95% CI) | ‐0.01 [‐0.12, 0.10] |
| Analysis 2.4 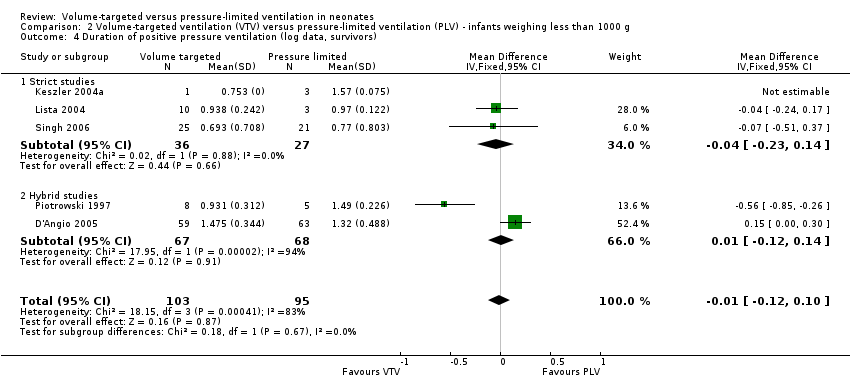 Comparison 2 Volume‐targeted ventilation (VTV) versus pressure‐limited ventilation (PLV) ‐ infants weighing less than 1000 g, Outcome 4 Duration of positive pressure ventilation (log data, survivors). | ||||
| 4.1 Strict studies | 3 | 63 | Mean Difference (IV, Fixed, 95% CI) | ‐0.04 [‐0.23, 0.14] |
| 4.2 Hybrid studies | 2 | 135 | Mean Difference (IV, Fixed, 95% CI) | 0.01 [‐0.12, 0.14] |
| 5 Any pH < 7.25 Show forest plot | 2 | 46 | Risk Ratio (M‐H, Fixed, 95% CI) | 0.71 [0.46, 1.09] |
| Analysis 2.5 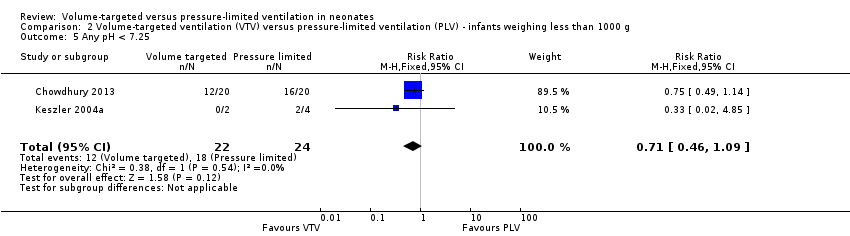 Comparison 2 Volume‐targeted ventilation (VTV) versus pressure‐limited ventilation (PLV) ‐ infants weighing less than 1000 g, Outcome 5 Any pH < 7.25. | ||||
| 6 Hypocarbia partial pressure of carbon dioxide (pCO2) < 35 mmHg/4.7 kPa Show forest plot | 1 | 6 | Risk Ratio (M‐H, Fixed, 95% CI) | 0.19 [0.01, 2.36] |
| Analysis 2.6 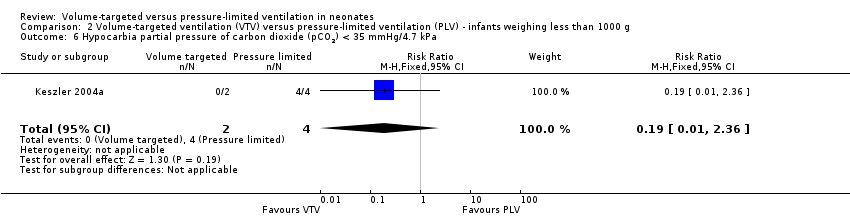 Comparison 2 Volume‐targeted ventilation (VTV) versus pressure‐limited ventilation (PLV) ‐ infants weighing less than 1000 g, Outcome 6 Hypocarbia partial pressure of carbon dioxide (pCO2) < 35 mmHg/4.7 kPa. | ||||
| 7 Respiratory acidosis pH < 7.25 and pCO2 > 60 mmHg/8 kPa Show forest plot | 2 | 46 | Risk Ratio (M‐H, Fixed, 95% CI) | 0.79 [0.43, 1.47] |
| Analysis 2.7  Comparison 2 Volume‐targeted ventilation (VTV) versus pressure‐limited ventilation (PLV) ‐ infants weighing less than 1000 g, Outcome 7 Respiratory acidosis pH < 7.25 and pCO2 > 60 mmHg/8 kPa. | ||||
| 8 Hypocarbia or respiratory acidosis Show forest plot | 1 | 6 | Risk Ratio (M‐H, Fixed, 95% CI) | 0.19 [0.01, 2.36] |
| Analysis 2.8  Comparison 2 Volume‐targeted ventilation (VTV) versus pressure‐limited ventilation (PLV) ‐ infants weighing less than 1000 g, Outcome 8 Hypocarbia or respiratory acidosis. | ||||
| 9 Patent ductus arteriosus Show forest plot | 4 | 241 | Risk Ratio (M‐H, Fixed, 95% CI) | 1.09 [0.85, 1.39] |
| Analysis 2.9  Comparison 2 Volume‐targeted ventilation (VTV) versus pressure‐limited ventilation (PLV) ‐ infants weighing less than 1000 g, Outcome 9 Patent ductus arteriosus. | ||||
| 9.1 Strict studies | 2 | 75 | Risk Ratio (M‐H, Fixed, 95% CI) | 1.10 [0.77, 1.57] |
| 9.2 Hybrid studies | 2 | 166 | Risk Ratio (M‐H, Fixed, 95% CI) | 1.08 [0.78, 1.50] |
| 10 Air leak (any) Show forest plot | 4 | 189 | Risk Ratio (M‐H, Fixed, 95% CI) | 1.11 [0.55, 2.23] |
| Analysis 2.10 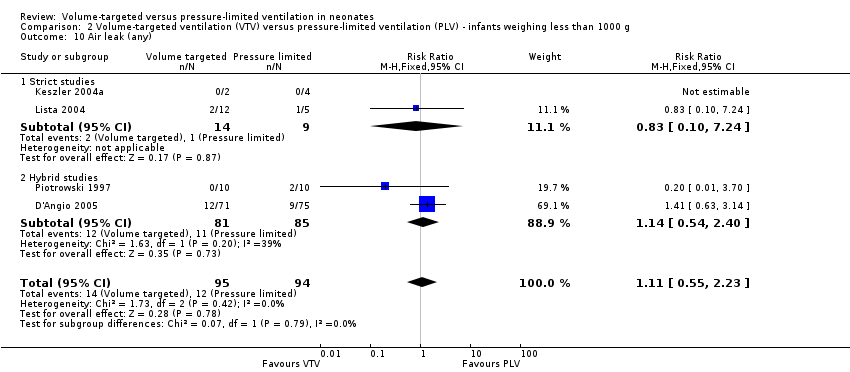 Comparison 2 Volume‐targeted ventilation (VTV) versus pressure‐limited ventilation (PLV) ‐ infants weighing less than 1000 g, Outcome 10 Air leak (any). | ||||
| 10.1 Strict studies | 2 | 23 | Risk Ratio (M‐H, Fixed, 95% CI) | 0.83 [0.10, 7.24] |
| 10.2 Hybrid studies | 2 | 166 | Risk Ratio (M‐H, Fixed, 95% CI) | 1.14 [0.54, 2.40] |
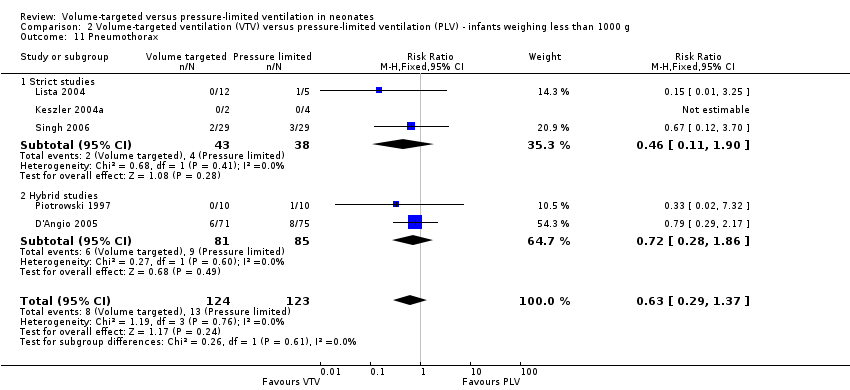
| 11 Pneumothorax Show forest plot | 5 | 247 | Risk Ratio (M‐H, Fixed, 95% CI) | 0.63 [0.29, 1.37] |
| Analysis 2.11  Comparison 2 Volume‐targeted ventilation (VTV) versus pressure‐limited ventilation (PLV) ‐ infants weighing less than 1000 g, Outcome 11 Pneumothorax. | ||||
| 11.1 Strict studies | 3 | 81 | Risk Ratio (M‐H, Fixed, 95% CI) | 0.46 [0.11, 1.90] |
| 11.2 Hybrid studies | 2 | 166 | Risk Ratio (M‐H, Fixed, 95% CI) | 0.72 [0.28, 1.86] |
| 12 Pulmonary interstitial emphysema Show forest plot | 4 | 189 | Risk Ratio (M‐H, Fixed, 95% CI) | 1.45 [0.58, 3.67] |
| Analysis 2.12 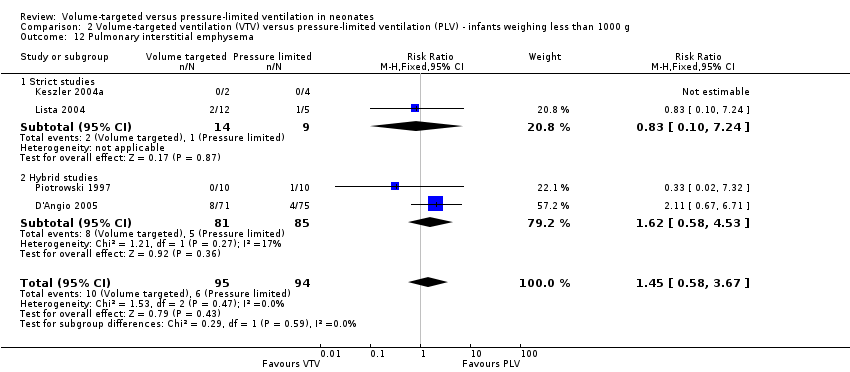 Comparison 2 Volume‐targeted ventilation (VTV) versus pressure‐limited ventilation (PLV) ‐ infants weighing less than 1000 g, Outcome 12 Pulmonary interstitial emphysema. | ||||
| 12.1 Strict studies | 2 | 23 | Risk Ratio (M‐H, Fixed, 95% CI) | 0.83 [0.10, 7.24] |
| 12.2 Hybrid studies | 2 | 166 | Risk Ratio (M‐H, Fixed, 95% CI) | 1.62 [0.58, 4.53] |
| 13 Any intraventricular haemorrhage (IVH) Show forest plot | 4 | 225 | Risk Ratio (M‐H, Fixed, 95% CI) | 0.79 [0.55, 1.16] |
| Analysis 2.13  Comparison 2 Volume‐targeted ventilation (VTV) versus pressure‐limited ventilation (PLV) ‐ infants weighing less than 1000 g, Outcome 13 Any intraventricular haemorrhage (IVH). | ||||
| 13.1 Strict studies | 2 | 62 | Risk Ratio (M‐H, Fixed, 95% CI) | 1.14 [0.62, 2.08] |
| 13.2 Hybrid studies | 2 | 163 | Risk Ratio (M‐H, Fixed, 95% CI) | 0.66 [0.40, 1.06] |
| 14 IVH grade 3‐4 Show forest plot | 4 | 184 | Risk Ratio (M‐H, Fixed, 95% CI) | 0.53 [0.27, 1.04] |
| Analysis 2.14 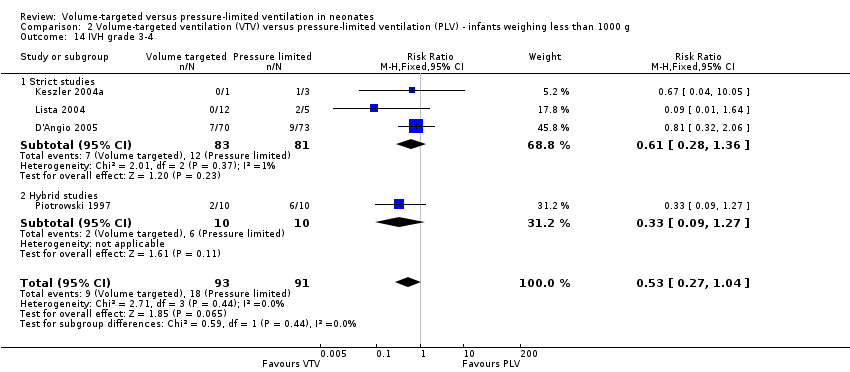 Comparison 2 Volume‐targeted ventilation (VTV) versus pressure‐limited ventilation (PLV) ‐ infants weighing less than 1000 g, Outcome 14 IVH grade 3‐4. | ||||
| 14.1 Strict studies | 3 | 164 | Risk Ratio (M‐H, Fixed, 95% CI) | 0.61 [0.28, 1.36] |
| 14.2 Hybrid studies | 1 | 20 | Risk Ratio (M‐H, Fixed, 95% CI) | 0.33 [0.09, 1.27] |
| 15 Periventricular leukomalacia (PVL) Show forest plot | 4 | 203 | Risk Ratio (M‐H, Fixed, 95% CI) | 0.43 [0.15, 1.24] |
| Analysis 2.15  Comparison 2 Volume‐targeted ventilation (VTV) versus pressure‐limited ventilation (PLV) ‐ infants weighing less than 1000 g, Outcome 15 Periventricular leukomalacia (PVL). | ||||
| 15.1 Strict studies | 3 | 79 | Risk Ratio (M‐H, Fixed, 95% CI) | 0.38 [0.10, 1.53] |
| 15.2 Hybrid studies | 1 | 124 | Risk Ratio (M‐H, Fixed, 95% CI) | 0.5 [0.10, 2.63] |
| 16 Any IVH or PVL Show forest plot | 3 | 186 | Risk Ratio (M‐H, Fixed, 95% CI) | 0.90 [0.60, 1.35] |
| Analysis 2.16  Comparison 2 Volume‐targeted ventilation (VTV) versus pressure‐limited ventilation (PLV) ‐ infants weighing less than 1000 g, Outcome 16 Any IVH or PVL. | ||||
| 16.1 Strict studies | 2 | 62 | Risk Ratio (M‐H, Fixed, 95% CI) | 1.05 [0.61, 1.80] |
| 16.2 Hybrid studies | 1 | 124 | Risk Ratio (M‐H, Fixed, 95% CI) | 0.78 [0.43, 1.42] |
| 17 IVH grade 3‐4 or PVL Show forest plot | 3 | 145 | Odds Ratio (M‐H, Fixed, 95% CI) | 0.39 [0.15, 0.99] |
| Analysis 2.17  Comparison 2 Volume‐targeted ventilation (VTV) versus pressure‐limited ventilation (PLV) ‐ infants weighing less than 1000 g, Outcome 17 IVH grade 3‐4 or PVL. | ||||
| 17.1 Strict studies | 2 | 21 | Odds Ratio (M‐H, Fixed, 95% CI) | 0.10 [0.01, 1.04] |
| 17.2 Hybrid studies | 1 | 124 | Odds Ratio (M‐H, Fixed, 95% CI) | 0.56 [0.19, 1.64] |
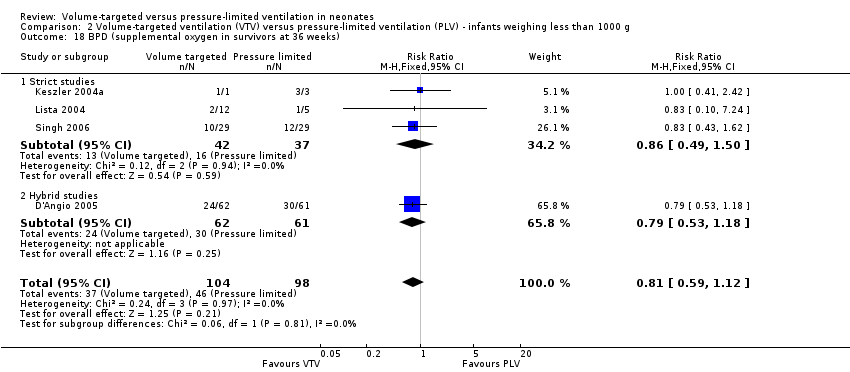
| 18 BPD (supplemental oxygen in survivors at 36 weeks) Show forest plot | 4 | 202 | Risk Ratio (M‐H, Fixed, 95% CI) | 0.81 [0.59, 1.12] |
| Analysis 2.18  Comparison 2 Volume‐targeted ventilation (VTV) versus pressure‐limited ventilation (PLV) ‐ infants weighing less than 1000 g, Outcome 18 BPD (supplemental oxygen in survivors at 36 weeks). | ||||
| 18.1 Strict studies | 3 | 79 | Risk Ratio (M‐H, Fixed, 95% CI) | 0.86 [0.49, 1.50] |
| 18.2 Hybrid studies | 1 | 123 | Risk Ratio (M‐H, Fixed, 95% CI) | 0.79 [0.53, 1.18] |
| Outcome or subgroup title | No. of studies | No. of participants | Statistical method | Effect size |
| 1 Severe disability (any definition) Show forest plot | 2 | 209 | Risk Ratio (M‐H, Fixed, 95% CI) | 0.86 [0.47, 1.59] |
| Analysis 3.1  Comparison 3 Miscellaneous post hoc analyses, Outcome 1 Severe disability (any definition). | ||||
| 2 Severe disability (any definition) or death Show forest plot | 1 | 109 | Risk Ratio (M‐H, Fixed, 95% CI) | 0.54 [0.27, 1.06] |
| Analysis 3.2 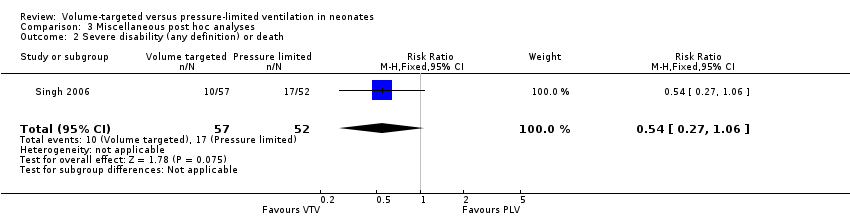 Comparison 3 Miscellaneous post hoc analyses, Outcome 2 Severe disability (any definition) or death. | ||||
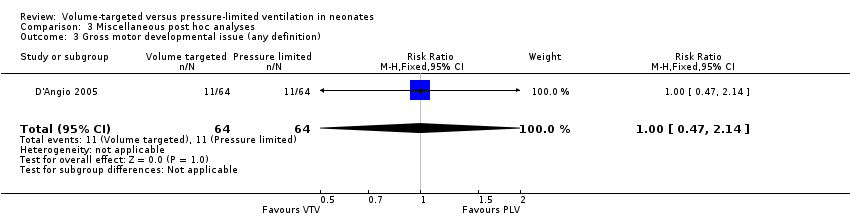
| 3 Gross motor developmental issue (any definition) Show forest plot | 1 | 128 | Risk Ratio (M‐H, Fixed, 95% CI) | 1.0 [0.47, 2.14] |
| Analysis 3.3  Comparison 3 Miscellaneous post hoc analyses, Outcome 3 Gross motor developmental issue (any definition). | ||||
| 4 Steroids for bronchopulmonary dysplasia Show forest plot | 1 | 203 | Risk Ratio (M‐H, Fixed, 95% CI) | 0.93 [0.65, 1.31] |
| Analysis 3.4 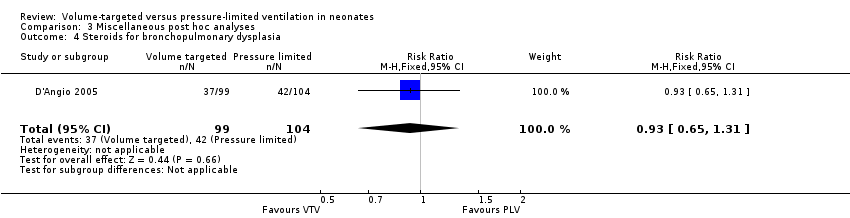 Comparison 3 Miscellaneous post hoc analyses, Outcome 4 Steroids for bronchopulmonary dysplasia. | ||||
| 5 Need for home oxygen (survivors) Show forest plot | 2 | 270 | Risk Ratio (M‐H, Fixed, 95% CI) | 0.64 [0.30, 1.36] |
| Analysis 3.5 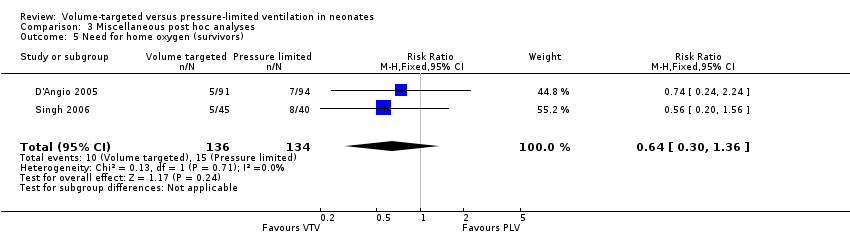 Comparison 3 Miscellaneous post hoc analyses, Outcome 5 Need for home oxygen (survivors). | ||||
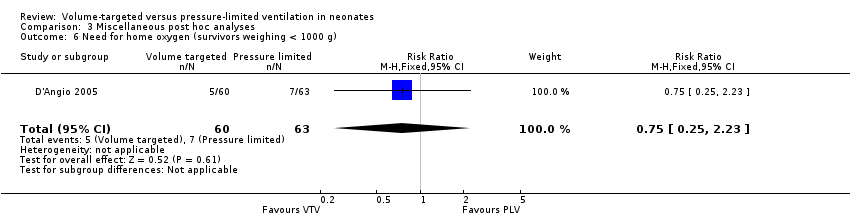
| 6 Need for home oxygen (survivors weighing < 1000 g) Show forest plot | 1 | 123 | Risk Ratio (M‐H, Fixed, 95% CI) | 0.75 [0.25, 2.23] |
| Analysis 3.6  Comparison 3 Miscellaneous post hoc analyses, Outcome 6 Need for home oxygen (survivors weighing < 1000 g). | ||||

Study flow diagram: review update. PLV: pressure‐limited ventilation; VTV: volume‐targeted ventilation.

Risk of bias graph: review authors' judgements about each risk of bias item presented as percentages across all included studies.

Risk of bias summary: review authors' judgements about each risk of bias item for each included study.

Comparison 1 Volume‐targeted ventilation (VTV) versus pressure‐limited ventilation (PLV) ‐ subgroup by mode of ventilation, Outcome 1 Death before discharge from hospital.
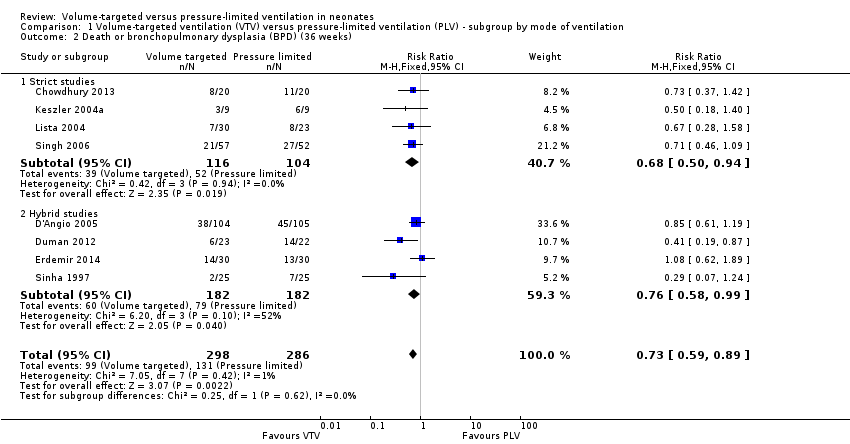
Comparison 1 Volume‐targeted ventilation (VTV) versus pressure‐limited ventilation (PLV) ‐ subgroup by mode of ventilation, Outcome 2 Death or bronchopulmonary dysplasia (BPD) (36 weeks).
Comparison 1 Volume‐targeted ventilation (VTV) versus pressure‐limited ventilation (PLV) ‐ subgroup by mode of ventilation, Outcome 3 Failure of mode of ventilation.

Comparison 1 Volume‐targeted ventilation (VTV) versus pressure‐limited ventilation (PLV) ‐ subgroup by mode of ventilation, Outcome 4 Addition of neuromuscular paralysis where previously not paralysed.
Comparison 1 Volume‐targeted ventilation (VTV) versus pressure‐limited ventilation (PLV) ‐ subgroup by mode of ventilation, Outcome 5 Duration of positive pressure ventilation (days, survivors).

Comparison 1 Volume‐targeted ventilation (VTV) versus pressure‐limited ventilation (PLV) ‐ subgroup by mode of ventilation, Outcome 6 Duration of positive pressure ventilation (log data, survivors).
Comparison 1 Volume‐targeted ventilation (VTV) versus pressure‐limited ventilation (PLV) ‐ subgroup by mode of ventilation, Outcome 7 Inspired oxygen concentration % (study definition).
Comparison 1 Volume‐targeted ventilation (VTV) versus pressure‐limited ventilation (PLV) ‐ subgroup by mode of ventilation, Outcome 8 Any pH < 7.25.
Comparison 1 Volume‐targeted ventilation (VTV) versus pressure‐limited ventilation (PLV) ‐ subgroup by mode of ventilation, Outcome 9 Hypocarbia partial pressure of carbon dioxide (pCO2) < 35 mmHg/4.7 kPa.

Comparison 1 Volume‐targeted ventilation (VTV) versus pressure‐limited ventilation (PLV) ‐ subgroup by mode of ventilation, Outcome 10 Respiratory acidosis; pH < 7.25 and pCO2 > 8 kPa.

Comparison 1 Volume‐targeted ventilation (VTV) versus pressure‐limited ventilation (PLV) ‐ subgroup by mode of ventilation, Outcome 11 Incidence of hypocarbia or respiratory acidosis.

Comparison 1 Volume‐targeted ventilation (VTV) versus pressure‐limited ventilation (PLV) ‐ subgroup by mode of ventilation, Outcome 12 Patent ductus arteriosus.

Comparison 1 Volume‐targeted ventilation (VTV) versus pressure‐limited ventilation (PLV) ‐ subgroup by mode of ventilation, Outcome 13 Air leak (any).
Comparison 1 Volume‐targeted ventilation (VTV) versus pressure‐limited ventilation (PLV) ‐ subgroup by mode of ventilation, Outcome 14 Pneumothorax.
Comparison 1 Volume‐targeted ventilation (VTV) versus pressure‐limited ventilation (PLV) ‐ subgroup by mode of ventilation, Outcome 15 Pulmonary interstitial emphysema.

Comparison 1 Volume‐targeted ventilation (VTV) versus pressure‐limited ventilation (PLV) ‐ subgroup by mode of ventilation, Outcome 16 Any intraventricular haemorrhage (IVH).

Comparison 1 Volume‐targeted ventilation (VTV) versus pressure‐limited ventilation (PLV) ‐ subgroup by mode of ventilation, Outcome 17 Periventricular leukomalacia (PVL).

Comparison 1 Volume‐targeted ventilation (VTV) versus pressure‐limited ventilation (PLV) ‐ subgroup by mode of ventilation, Outcome 18 IVH grade 3‐4.

Comparison 1 Volume‐targeted ventilation (VTV) versus pressure‐limited ventilation (PLV) ‐ subgroup by mode of ventilation, Outcome 19 Any IVH or PVL.

Comparison 1 Volume‐targeted ventilation (VTV) versus pressure‐limited ventilation (PLV) ‐ subgroup by mode of ventilation, Outcome 20 IVH grade 3‐4 or PVL.

Comparison 1 Volume‐targeted ventilation (VTV) versus pressure‐limited ventilation (PLV) ‐ subgroup by mode of ventilation, Outcome 21 BPD (supplemental oxygen in survivors at 36 weeks only).

Comparison 2 Volume‐targeted ventilation (VTV) versus pressure‐limited ventilation (PLV) ‐ infants weighing less than 1000 g, Outcome 1 Death in hospital.

Comparison 2 Volume‐targeted ventilation (VTV) versus pressure‐limited ventilation (PLV) ‐ infants weighing less than 1000 g, Outcome 2 Death or bronchopulmonary dysplasia (BPD) (36 weeks).

Comparison 2 Volume‐targeted ventilation (VTV) versus pressure‐limited ventilation (PLV) ‐ infants weighing less than 1000 g, Outcome 3 Duration of positive pressure ventilation (days, survivors).

Comparison 2 Volume‐targeted ventilation (VTV) versus pressure‐limited ventilation (PLV) ‐ infants weighing less than 1000 g, Outcome 4 Duration of positive pressure ventilation (log data, survivors).

Comparison 2 Volume‐targeted ventilation (VTV) versus pressure‐limited ventilation (PLV) ‐ infants weighing less than 1000 g, Outcome 5 Any pH < 7.25.

Comparison 2 Volume‐targeted ventilation (VTV) versus pressure‐limited ventilation (PLV) ‐ infants weighing less than 1000 g, Outcome 6 Hypocarbia partial pressure of carbon dioxide (pCO2) < 35 mmHg/4.7 kPa.

Comparison 2 Volume‐targeted ventilation (VTV) versus pressure‐limited ventilation (PLV) ‐ infants weighing less than 1000 g, Outcome 7 Respiratory acidosis pH < 7.25 and pCO2 > 60 mmHg/8 kPa.

Comparison 2 Volume‐targeted ventilation (VTV) versus pressure‐limited ventilation (PLV) ‐ infants weighing less than 1000 g, Outcome 8 Hypocarbia or respiratory acidosis.

Comparison 2 Volume‐targeted ventilation (VTV) versus pressure‐limited ventilation (PLV) ‐ infants weighing less than 1000 g, Outcome 9 Patent ductus arteriosus.

Comparison 2 Volume‐targeted ventilation (VTV) versus pressure‐limited ventilation (PLV) ‐ infants weighing less than 1000 g, Outcome 10 Air leak (any).
Comparison 2 Volume‐targeted ventilation (VTV) versus pressure‐limited ventilation (PLV) ‐ infants weighing less than 1000 g, Outcome 11 Pneumothorax.

Comparison 2 Volume‐targeted ventilation (VTV) versus pressure‐limited ventilation (PLV) ‐ infants weighing less than 1000 g, Outcome 12 Pulmonary interstitial emphysema.

Comparison 2 Volume‐targeted ventilation (VTV) versus pressure‐limited ventilation (PLV) ‐ infants weighing less than 1000 g, Outcome 13 Any intraventricular haemorrhage (IVH).

Comparison 2 Volume‐targeted ventilation (VTV) versus pressure‐limited ventilation (PLV) ‐ infants weighing less than 1000 g, Outcome 14 IVH grade 3‐4.

Comparison 2 Volume‐targeted ventilation (VTV) versus pressure‐limited ventilation (PLV) ‐ infants weighing less than 1000 g, Outcome 15 Periventricular leukomalacia (PVL).

Comparison 2 Volume‐targeted ventilation (VTV) versus pressure‐limited ventilation (PLV) ‐ infants weighing less than 1000 g, Outcome 16 Any IVH or PVL.

Comparison 2 Volume‐targeted ventilation (VTV) versus pressure‐limited ventilation (PLV) ‐ infants weighing less than 1000 g, Outcome 17 IVH grade 3‐4 or PVL.
Comparison 2 Volume‐targeted ventilation (VTV) versus pressure‐limited ventilation (PLV) ‐ infants weighing less than 1000 g, Outcome 18 BPD (supplemental oxygen in survivors at 36 weeks).

Comparison 3 Miscellaneous post hoc analyses, Outcome 1 Severe disability (any definition).

Comparison 3 Miscellaneous post hoc analyses, Outcome 2 Severe disability (any definition) or death.
Comparison 3 Miscellaneous post hoc analyses, Outcome 3 Gross motor developmental issue (any definition).

Comparison 3 Miscellaneous post hoc analyses, Outcome 4 Steroids for bronchopulmonary dysplasia.

Comparison 3 Miscellaneous post hoc analyses, Outcome 5 Need for home oxygen (survivors).
Comparison 3 Miscellaneous post hoc analyses, Outcome 6 Need for home oxygen (survivors weighing < 1000 g).
| Volume‐targeted ventilation compared to pressure‐limited ventilation | ||||||
| Patient or population: neonates up to 44 weeks' postmenstrual age | ||||||
| Outcomes | Anticipated absolute effects* (95% CI) | Relative effect | No of participants | Quality of the evidence | Comments | |
| Risk with PLV | Risk with VTV | |||||
| Death before discharge from hospital | Study population | RR 0.75 | 771 | ⊕⊕⊝⊝ | Unblinded studies. Imprecision of estimates. 95% CI < 0.75. | |
| 163 per 1000 | 122 per 1000 | |||||
| Death or BPD (36 weeks) | Study population | RR 0.73 | 584 | ⊕⊕⊕⊝ | Unblinded studies. | |
| 458 per 1000 | 334 per 1000 | |||||
| Duration of positive pressure ventilation (days) | MD of positive pressure ventilation (days); PLV group 0 | MD 1.35 lower | ‐ | 736 | ⊕⊕⊕⊝ | Unblinded studies. |
| Pneumothorax | Study population | RR 0.52 (0.31 to 0.87) | 825 | ⊕⊕⊕⊝ | Unblinded studies. | |
| 88 per 1000 | 46 per 1000 (27 to 77) | |||||
| IVH grade 3‐4 | Study population | RR 0.53 (0.37 to 0.77) | 712 (10 RCTs) | ⊕⊕⊕⊝ | Unblinded studies. | |
| 184 per 1000 | 97 per 1000 (68 to 141) | |||||
| IVH grade 3‐4 or PVL | Study population | RR 0.47 (0.27 to 0.80) | 441 | ⊕⊕⊕⊝ | Unblinded studies. | |
| 164 per 1000 | 77 per 1000 (44 to 131) | |||||
| BPD (supplemental oxygen at 36 weeks) | Study population | RR 0.68 (0.53 to 0.87) | 620 | ⊕⊕⊝⊝ | Unblinded studies. Possible publication bias based on funnel plot. | |
| 346 per 1000 | 235 per 1000 (183 to 301) | |||||
| *The risk in the intervention group (and its 95% confidence interval) is based on the assumed risk in the comparison group and the relative effect of the intervention (and its 95% CI). BPD: bronchopulmonary dysplasia; CI: confidence interval; IVH: intraventricular haemorrhage; MD: mean difference; PLV: pressure‐limited ventilation; PVL: periventricular leukomalacia; RCT: randomised controlled trial; RR: risk ratio; VTV: volume‐targeted ventilation. | ||||||
| GRADE Working Group grades of evidence | ||||||
| Volume‐targeted ventilation compared to pressure‐limited ventilation | ||||||
| Patient or population: neonates up to 44 weeks' postmenstrual age | ||||||
| Outcomes | Anticipated absolute effects* (95% CI) | Relative effect | No of participants | Quality of the evidence | Comments | |
| Risk with PLV | Risk with VTV | |||||
| Death or BPD (28 days) | Study population | RR 0.87 (0.64 to 1.18) | 149 | ⊕⊕⊝⊝ | Unblinded studies. Imprecision of estimates, 95% CI < 0.75. Few participants. | |
| 536 per 1000 | 467 per 1000 (343 to 633) | |||||
| Failure of mode of ventilation | Study population | RR 0.69 | 445 | ⊕⊕⊕⊝ | Unblinded studies. | |
| 242 per 1000 | 167 per 1000 | |||||
| Addition of neuromuscular paralysis where previously not paralysed | Study population | RR 0.32 | 75 | ⊕⊕⊝⊝ | Unblinded studies. Small numbers of participants. | |
| 179 per 1000 | 57 per 1000 | |||||
| Duration of positive pressure ventilation (log data) | The mean duration of IPPV (log data) was 0 | MD 0.08 lower | ‐ | 381 | ⊕⊕⊝⊝ | Unblinded studies. Heterogeneity of study results. |
| Inspired oxygen concentration % (study definition) | The mean difference in inspired oxygen concentration %; PLV group 0 | The mean inspired oxygen concentration % was 0.92 lower (2.08 lower to 0.24 higher) in VTV group | ‐ | 324 | ⊕⊕⊕⊝ | Unblinded studies. |
| Any pH < 7.25 | Study population | RR 0.80 | 98 | ⊕⊕⊝⊝ | Unblinded studies. Imprecision of estimates, 95% CI < 0.75. Few participants. | |
| 380 per 1000 | 304 per 1000 | |||||
| Hypocarbia pCO2 < 35 mmHg/4.7 kPa | Study population | RR 0.49 (0.33 to 0.72) | 98 | ⊕⊕⊕⊝ | Unblinded studies. Small trials, but large effect and biologically plausible. | |
| 720 per 1000 | 353 per 1000 (238 to 518) | |||||
| Respiratory acidosis pH < 7.25 and pCO2 > 60 mmHg/8 kPa | Study population | RR 0.93 | 98 | ⊕⊕⊝⊝ | Unblinded studies. Imprecision of estimates, 95% CI < 0.75. Few participants. | |
| 240 per 1000 | 223 per 1000 | |||||
| Either hypocarbia or respiratory acidosis | Study population | RR 0.68 | 37 | ‐ | No quality assessment possible. | |
| 1889 per 1000 | 1000 per 1000 | |||||
| Patent ductus arteriosus | Study population | RR 0.95 | 754 | ⊕⊕⊝⊝ | Unblinded studies. Variable diagnostic practices employed. | |
| 391 per 1000 | 371 per 1000 | |||||
| Air leak (any) | Study population | RR 0.79 | 374 | ⊕⊕⊝⊝ | Unblinded studies. Imprecision of estimates, 95% CI < 0.75. Few participants. | |
| 117 per 1000 | 92 per 1000 | |||||
| Pulmonary interstitial emphysema | Study population | RR 1.21 | 430 | ⊕⊕⊝⊝ | Unblinded studies. Imprecision of estimates, 95% CI < 0.75. | |
| 65 per 1000 | 79 per 1000 | |||||
| Any IVH | Study population | RR 0.82 | 445 | ⊕⊕⊝⊝ | Unblinded studies. Imprecision of estimates, 95% CI < 0.75. | |
| 342 per 1000 | 281 per 1000 | |||||
| PVL | Study population | OR 0.43 (0.19 to 0.98) | 508 | ⊕⊕⊕⊝ | Unblinded studies. | |
| 71 per 1000 | 32 per 1000 (14 to 69) | |||||
| Any IVH or PVL | Study population | RR 0.83 | 298 | ⊕⊕⊕⊝ | Unblinded studies. | |
| 308 per 1000 | 256 per 1000 | |||||
| BPD (supplemental oxygen at 28 days) | Study population | RR 0.91 | 206 | ⊕⊕⊝⊝ | Unblinded studies. Imprecision of estimates, 95% CI < 0.75. | |
| 354 per 1000 | 322 per 1000 | |||||
| *The risk in the intervention group (and its 95% confidence interval) is based on the assumed risk in the comparison group and the relative effect of the intervention (and its 95% CI). BPD: bronchopulmonary dysplasia; CI: confidence interval; IPPV: intermittent positive pressure ventilation; IVH: intraventricular haemorrhage; MD: mean difference; pCO2: partial pressure of carbon dioxide; PLV: pressure‐limited ventilation; PVL: periventricular leukomalacia; RCT: randomised controlled trial; RR: risk ratio; VTV: volume‐targeted ventilation. | ||||||
| GRADE Working Group grades of evidence | ||||||
| Outcome or subgroup title | No. of studies | No. of participants | Statistical method | Effect size |
| 1 Death before discharge from hospital Show forest plot | 11 | 771 | Risk Ratio (M‐H, Fixed, 95% CI) | 0.75 [0.53, 1.07] |
| 1.1 Strict studies | 4 | 220 | Risk Ratio (M‐H, Fixed, 95% CI) | 0.60 [0.31, 1.15] |
| 1.2 Hybrid studies | 7 | 551 | Risk Ratio (M‐H, Fixed, 95% CI) | 0.83 [0.55, 1.25] |
| 2 Death or bronchopulmonary dysplasia (BPD) (36 weeks) Show forest plot | 8 | 584 | Risk Ratio (M‐H, Fixed, 95% CI) | 0.73 [0.59, 0.89] |
| 2.1 Strict studies | 4 | 220 | Risk Ratio (M‐H, Fixed, 95% CI) | 0.68 [0.50, 0.94] |
| 2.2 Hybrid studies | 4 | 364 | Risk Ratio (M‐H, Fixed, 95% CI) | 0.76 [0.58, 0.99] |
| 3 Failure of mode of ventilation Show forest plot | 5 | 445 | Risk Ratio (M‐H, Fixed, 95% CI) | 0.69 [0.48, 1.00] |
| 3.1 Strict studies | 2 | 149 | Risk Ratio (M‐H, Fixed, 95% CI) | 0.87 [0.44, 1.72] |
| 3.2 Hybrid studies | 3 | 296 | Risk Ratio (M‐H, Fixed, 95% CI) | 0.63 [0.40, 0.97] |
| 4 Addition of neuromuscular paralysis where previously not paralysed Show forest plot | 2 | 75 | Risk Ratio (M‐H, Fixed, 95% CI) | 0.32 [0.07, 1.40] |
| 4.1 Strict studies | 1 | 18 | Risk Ratio (M‐H, Fixed, 95% CI) | 0.0 [0.0, 0.0] |
| 4.2 Hybrid studies | 1 | 57 | Risk Ratio (M‐H, Fixed, 95% CI) | 0.32 [0.07, 1.40] |
| 5 Duration of positive pressure ventilation (days, survivors) Show forest plot | 12 | 736 | Mean Difference (IV, Fixed, 95% CI) | ‐1.35 [‐1.83, ‐0.86] |
| 5.1 Strict studies | 5 | 229 | Mean Difference (IV, Fixed, 95% CI) | ‐2.08 [‐3.51, ‐0.64] |
| 5.2 Hybrid studies | 7 | 507 | Mean Difference (IV, Fixed, 95% CI) | ‐1.25 [‐1.77, ‐0.74] |
| 6 Duration of positive pressure ventilation (log data, survivors) Show forest plot | 5 | 381 | Mean Difference (IV, Fixed, 95% CI) | ‐0.08 [‐0.16, ‐0.00] |
| 6.1 Strict studies | 3 | 152 | Mean Difference (IV, Fixed, 95% CI) | ‐0.14 [‐0.24, ‐0.04] |
| 6.2 Hybrid studies | 2 | 229 | Mean Difference (IV, Fixed, 95% CI) | 0.02 [‐0.12, 0.15] |
| 7 Inspired oxygen concentration % (study definition) Show forest plot | 7 | 324 | Mean Difference (IV, Fixed, 95% CI) | ‐0.92 [‐2.08, 0.24] |
| 7.1 Parallel studies | 3 | 156 | Mean Difference (IV, Fixed, 95% CI) | ‐1.42 [‐3.09, 0.24] |
| 7.2 Cross‐over studies | 4 | 168 | Mean Difference (IV, Fixed, 95% CI) | ‐0.44 [‐2.05, 1.17] |
| 8 Any pH < 7.25 Show forest plot | 3 | 98 | Risk Ratio (M‐H, Fixed, 95% CI) | 0.80 [0.52, 1.23] |
| 9 Hypocarbia partial pressure of carbon dioxide (pCO2) < 35 mmHg/4.7 kPa Show forest plot | 3 | 98 | Risk Ratio (M‐H, Fixed, 95% CI) | 0.49 [0.33, 0.72] |
| 10 Respiratory acidosis; pH < 7.25 and pCO2 > 8 kPa Show forest plot | 3 | 98 | Risk Ratio (M‐H, Fixed, 95% CI) | 0.93 [0.51, 1.70] |
| 11 Incidence of hypocarbia or respiratory acidosis Show forest plot | 2 | 58 | Risk Ratio (M‐H, Fixed, 95% CI) | 0.69 [0.42, 1.12] |
| 12 Patent ductus arteriosus Show forest plot | 10 | 754 | Risk Ratio (M‐H, Fixed, 95% CI) | 0.95 [0.80, 1.12] |
| 12.1 Strict studies | 3 | 202 | Risk Ratio (M‐H, Fixed, 95% CI) | 0.81 [0.61, 1.08] |
| 12.2 Hybrid studies | 7 | 552 | Risk Ratio (M‐H, Fixed, 95% CI) | 1.01 [0.83, 1.25] |
| 13 Air leak (any) Show forest plot | 5 | 374 | Risk Ratio (M‐H, Fixed, 95% CI) | 0.79 [0.44, 1.43] |
| 13.1 Strict studies | 2 | 71 | Risk Ratio (M‐H, Fixed, 95% CI) | 0.51 [0.09, 2.81] |
| 13.2 Hybrid Studies | 3 | 303 | Risk Ratio (M‐H, Fixed, 95% CI) | 0.84 [0.45, 1.58] |
| 14 Pneumothorax Show forest plot | 13 | 825 | Risk Ratio (M‐H, Fixed, 95% CI) | 0.52 [0.31, 0.87] |
| 14.1 Strict studies | 5 | 250 | Risk Ratio (M‐H, Fixed, 95% CI) | 0.53 [0.19, 1.44] |
| 14.2 Hybrid studies | 8 | 575 | Risk Ratio (M‐H, Fixed, 95% CI) | 0.52 [0.28, 0.94] |
| 15 Pulmonary interstitial emphysema Show forest plot | 6 | 430 | Risk Ratio (M‐H, Fixed, 95% CI) | 1.21 [0.63, 2.30] |
| 15.1 Strict studies | 2 | 71 | Risk Ratio (M‐H, Fixed, 95% CI) | 0.77 [0.12, 5.04] |
| 15.2 Hybrid studies | 4 | 359 | Risk Ratio (M‐H, Fixed, 95% CI) | 1.29 [0.64, 2.57] |
| 16 Any intraventricular haemorrhage (IVH) Show forest plot | 6 | 501 | Risk Ratio (M‐H, Fixed, 95% CI) | 0.90 [0.70, 1.15] |
| 16.1 Strict studies | 2 | 125 | Risk Ratio (M‐H, Fixed, 95% CI) | 1.11 [0.74, 1.67] |
| 16.2 Hybrid studies | 4 | 376 | Risk Ratio (M‐H, Fixed, 95% CI) | 0.82 [0.60, 1.11] |
| 17 Periventricular leukomalacia (PVL) Show forest plot | 7 | 508 | Risk Ratio (M‐H, Fixed, 95% CI) | 0.45 [0.21, 0.98] |
| 17.1 Strict studies | 4 | 218 | Risk Ratio (M‐H, Fixed, 95% CI) | 0.53 [0.17, 1.65] |
| 17.2 Hybrid studies | 3 | 290 | Risk Ratio (M‐H, Fixed, 95% CI) | 0.40 [0.14, 1.14] |
| 18 IVH grade 3‐4 Show forest plot | 10 | 712 | Risk Difference (M‐H, Fixed, 95% CI) | ‐0.09 [‐0.14, ‐0.04] |
| 18.1 Strict studies | 4 | 218 | Risk Difference (M‐H, Fixed, 95% CI) | ‐0.05 [‐0.13, 0.02] |
| 18.2 Hybrid studies | 6 | 494 | Risk Difference (M‐H, Fixed, 95% CI) | ‐0.10 [‐0.17, ‐0.04] |
| 19 Any IVH or PVL Show forest plot | 3 | 298 | Risk Ratio (M‐H, Fixed, 95% CI) | 0.83 [0.58, 1.18] |
| 19.1 Strict studies | 2 | 125 | Risk Ratio (M‐H, Fixed, 95% CI) | 0.83 [0.52, 1.35] |
| 19.2 Hybrid studies | 1 | 173 | Risk Ratio (M‐H, Fixed, 95% CI) | 0.82 [0.48, 1.39] |
| 20 IVH grade 3‐4 or PVL Show forest plot | 6 | 441 | Risk Ratio (M‐H, Fixed, 95% CI) | 0.47 [0.27, 0.80] |
| 20.1 Strict studies | 4 | 218 | Risk Ratio (M‐H, Fixed, 95% CI) | 0.51 [0.25, 1.03] |
| 20.2 Hybrid studies | 2 | 223 | Risk Ratio (M‐H, Fixed, 95% CI) | 0.42 [0.19, 0.96] |
| 21 BPD (supplemental oxygen in survivors at 36 weeks only) Show forest plot | 9 | 620 | Risk Ratio (M‐H, Fixed, 95% CI) | 0.68 [0.53, 0.87] |
| 21.1 Strict studies | 4 | 218 | Risk Ratio (M‐H, Fixed, 95% CI) | 0.75 [0.52, 1.07] |
| 21.2 Hybrid studies | 5 | 402 | Risk Ratio (M‐H, Fixed, 95% CI) | 0.64 [0.46, 0.89] |
| Outcome or subgroup title | No. of studies | No. of participants | Statistical method | Effect size |
| 1 Death in hospital Show forest plot | 5 | 246 | Risk Ratio (M‐H, Fixed, 95% CI) | 0.71 [0.42, 1.21] |
| 1.1 Strict studies | 4 | 226 | Risk Ratio (M‐H, Fixed, 95% CI) | 0.80 [0.46, 1.39] |
| 1.2 Hybrid studies | 1 | 20 | Risk Ratio (M‐H, Fixed, 95% CI) | 0.25 [0.03, 1.86] |
| 2 Death or bronchopulmonary dysplasia (BPD) (36 weeks) Show forest plot | 4 | 224 | Risk Ratio (M‐H, Fixed, 95% CI) | 0.79 [0.62, 1.01] |
| 2.1 Strict studies | 3 | 81 | Risk Ratio (M‐H, Fixed, 95% CI) | 0.75 [0.52, 1.10] |
| 2.2 Hybrid studies | 1 | 143 | Risk Ratio (M‐H, Fixed, 95% CI) | 0.82 [0.59, 1.12] |
| 3 Duration of positive pressure ventilation (days, survivors) Show forest plot | 5 | 198 | Mean Difference (IV, Fixed, 95% CI) | ‐0.82 [‐4.43, 2.80] |
| 3.1 Strict studies | 3 | 63 | Mean Difference (IV, Fixed, 95% CI) | ‐0.32 [‐4.53, 3.89] |
| 3.2 Hybrid studies | 2 | 135 | Mean Difference (IV, Fixed, 95% CI) | ‐2.21 [‐9.29, 4.87] |
| 4 Duration of positive pressure ventilation (log data, survivors) Show forest plot | 5 | 198 | Mean Difference (IV, Fixed, 95% CI) | ‐0.01 [‐0.12, 0.10] |
| 4.1 Strict studies | 3 | 63 | Mean Difference (IV, Fixed, 95% CI) | ‐0.04 [‐0.23, 0.14] |
| 4.2 Hybrid studies | 2 | 135 | Mean Difference (IV, Fixed, 95% CI) | 0.01 [‐0.12, 0.14] |
| 5 Any pH < 7.25 Show forest plot | 2 | 46 | Risk Ratio (M‐H, Fixed, 95% CI) | 0.71 [0.46, 1.09] |
| 6 Hypocarbia partial pressure of carbon dioxide (pCO2) < 35 mmHg/4.7 kPa Show forest plot | 1 | 6 | Risk Ratio (M‐H, Fixed, 95% CI) | 0.19 [0.01, 2.36] |
| 7 Respiratory acidosis pH < 7.25 and pCO2 > 60 mmHg/8 kPa Show forest plot | 2 | 46 | Risk Ratio (M‐H, Fixed, 95% CI) | 0.79 [0.43, 1.47] |
| 8 Hypocarbia or respiratory acidosis Show forest plot | 1 | 6 | Risk Ratio (M‐H, Fixed, 95% CI) | 0.19 [0.01, 2.36] |
| 9 Patent ductus arteriosus Show forest plot | 4 | 241 | Risk Ratio (M‐H, Fixed, 95% CI) | 1.09 [0.85, 1.39] |
| 9.1 Strict studies | 2 | 75 | Risk Ratio (M‐H, Fixed, 95% CI) | 1.10 [0.77, 1.57] |
| 9.2 Hybrid studies | 2 | 166 | Risk Ratio (M‐H, Fixed, 95% CI) | 1.08 [0.78, 1.50] |
| 10 Air leak (any) Show forest plot | 4 | 189 | Risk Ratio (M‐H, Fixed, 95% CI) | 1.11 [0.55, 2.23] |
| 10.1 Strict studies | 2 | 23 | Risk Ratio (M‐H, Fixed, 95% CI) | 0.83 [0.10, 7.24] |
| 10.2 Hybrid studies | 2 | 166 | Risk Ratio (M‐H, Fixed, 95% CI) | 1.14 [0.54, 2.40] |
| 11 Pneumothorax Show forest plot | 5 | 247 | Risk Ratio (M‐H, Fixed, 95% CI) | 0.63 [0.29, 1.37] |
| 11.1 Strict studies | 3 | 81 | Risk Ratio (M‐H, Fixed, 95% CI) | 0.46 [0.11, 1.90] |
| 11.2 Hybrid studies | 2 | 166 | Risk Ratio (M‐H, Fixed, 95% CI) | 0.72 [0.28, 1.86] |
| 12 Pulmonary interstitial emphysema Show forest plot | 4 | 189 | Risk Ratio (M‐H, Fixed, 95% CI) | 1.45 [0.58, 3.67] |
| 12.1 Strict studies | 2 | 23 | Risk Ratio (M‐H, Fixed, 95% CI) | 0.83 [0.10, 7.24] |
| 12.2 Hybrid studies | 2 | 166 | Risk Ratio (M‐H, Fixed, 95% CI) | 1.62 [0.58, 4.53] |
| 13 Any intraventricular haemorrhage (IVH) Show forest plot | 4 | 225 | Risk Ratio (M‐H, Fixed, 95% CI) | 0.79 [0.55, 1.16] |
| 13.1 Strict studies | 2 | 62 | Risk Ratio (M‐H, Fixed, 95% CI) | 1.14 [0.62, 2.08] |
| 13.2 Hybrid studies | 2 | 163 | Risk Ratio (M‐H, Fixed, 95% CI) | 0.66 [0.40, 1.06] |
| 14 IVH grade 3‐4 Show forest plot | 4 | 184 | Risk Ratio (M‐H, Fixed, 95% CI) | 0.53 [0.27, 1.04] |
| 14.1 Strict studies | 3 | 164 | Risk Ratio (M‐H, Fixed, 95% CI) | 0.61 [0.28, 1.36] |
| 14.2 Hybrid studies | 1 | 20 | Risk Ratio (M‐H, Fixed, 95% CI) | 0.33 [0.09, 1.27] |
| 15 Periventricular leukomalacia (PVL) Show forest plot | 4 | 203 | Risk Ratio (M‐H, Fixed, 95% CI) | 0.43 [0.15, 1.24] |
| 15.1 Strict studies | 3 | 79 | Risk Ratio (M‐H, Fixed, 95% CI) | 0.38 [0.10, 1.53] |
| 15.2 Hybrid studies | 1 | 124 | Risk Ratio (M‐H, Fixed, 95% CI) | 0.5 [0.10, 2.63] |
| 16 Any IVH or PVL Show forest plot | 3 | 186 | Risk Ratio (M‐H, Fixed, 95% CI) | 0.90 [0.60, 1.35] |
| 16.1 Strict studies | 2 | 62 | Risk Ratio (M‐H, Fixed, 95% CI) | 1.05 [0.61, 1.80] |
| 16.2 Hybrid studies | 1 | 124 | Risk Ratio (M‐H, Fixed, 95% CI) | 0.78 [0.43, 1.42] |
| 17 IVH grade 3‐4 or PVL Show forest plot | 3 | 145 | Odds Ratio (M‐H, Fixed, 95% CI) | 0.39 [0.15, 0.99] |
| 17.1 Strict studies | 2 | 21 | Odds Ratio (M‐H, Fixed, 95% CI) | 0.10 [0.01, 1.04] |
| 17.2 Hybrid studies | 1 | 124 | Odds Ratio (M‐H, Fixed, 95% CI) | 0.56 [0.19, 1.64] |
| 18 BPD (supplemental oxygen in survivors at 36 weeks) Show forest plot | 4 | 202 | Risk Ratio (M‐H, Fixed, 95% CI) | 0.81 [0.59, 1.12] |
| 18.1 Strict studies | 3 | 79 | Risk Ratio (M‐H, Fixed, 95% CI) | 0.86 [0.49, 1.50] |
| 18.2 Hybrid studies | 1 | 123 | Risk Ratio (M‐H, Fixed, 95% CI) | 0.79 [0.53, 1.18] |
| Outcome or subgroup title | No. of studies | No. of participants | Statistical method | Effect size |
| 1 Severe disability (any definition) Show forest plot | 2 | 209 | Risk Ratio (M‐H, Fixed, 95% CI) | 0.86 [0.47, 1.59] |
| 2 Severe disability (any definition) or death Show forest plot | 1 | 109 | Risk Ratio (M‐H, Fixed, 95% CI) | 0.54 [0.27, 1.06] |
| 3 Gross motor developmental issue (any definition) Show forest plot | 1 | 128 | Risk Ratio (M‐H, Fixed, 95% CI) | 1.0 [0.47, 2.14] |
| 4 Steroids for bronchopulmonary dysplasia Show forest plot | 1 | 203 | Risk Ratio (M‐H, Fixed, 95% CI) | 0.93 [0.65, 1.31] |
| 5 Need for home oxygen (survivors) Show forest plot | 2 | 270 | Risk Ratio (M‐H, Fixed, 95% CI) | 0.64 [0.30, 1.36] |
| 6 Need for home oxygen (survivors weighing < 1000 g) Show forest plot | 1 | 123 | Risk Ratio (M‐H, Fixed, 95% CI) | 0.75 [0.25, 2.23] |