Вентиляция с целевым объемом в сравнении с вентиляцией с ограниченным давлением у новорожденных
Appendices
Appendix 1. Standard search methodology
PubMed: ((infant, newborn[MeSH] OR newborn OR neonate OR neonatal OR premature OR low birth weight OR VLBW OR LBW or infan* or neonat*) AND (randomised controlled trial [pt] OR controlled clinical trial [pt] OR randomised [tiab] OR placebo [tiab] OR drug therapy [sh] OR randomly [tiab] OR trial [tiab] OR groups [tiab]) NOT (animals [mh] NOT humans [mh]))
Embase: (infant, newborn or newborn or neonate or neonatal or premature or very low birth weight or low birth weight or VLBW or LBW or Newborn or infan* or neonat*) AND (human not animal) AND (randomised controlled trial or controlled clinical trial or randomised or placebo or clinical trials as topic or randomly or trial or clinical trial)
CINAHL: (infant, newborn OR newborn OR neonate OR neonatal OR premature OR low birth weight OR VLBW OR LBW or Newborn or infan* or neonat*) AND (randomised controlled trial OR controlled clinical trial OR randomised OR placebo OR clinical trials as topic OR randomly OR trial OR PT clinical trial)
Cochrane Library: (infant or newborn or neonate or neonatal or premature or preterm or very low birth weight or low birth weight or VLBW or LBW)
Appendix 2. 'Risk of bias' tool
We used the standard methods of Cochrane and Cochrane Neonatal to assess the methodological quality (to meet the validity criteria) of the trials. For each trial, we sought information regarding the method of randomisation, and the blinding and reporting of all outcomes of all the infants enrolled in the trial. We assessed each criterion as low, high or unclear risk. Two review authors separately assessed each study. We resolved any disagreement by discussion. We added this information to the 'Characteristics of included studies' table. We evaluated the following issues and entered the findings into the 'Risk of bias' table:
Sequence generation (checking for possible selection bias). Was the allocation sequence adequately generated?
For each included study, we categorised the method used to generate the allocation sequence as:
-
low risk (any truly random process, e.g. random number table; computer random number generator);
-
high risk (any non‐random process, e.g. odd or even date of birth; hospital or clinic record number);
-
unclear risk.
Allocation concealment (checking for possible selection bias). Was allocation adequately concealed?
For each included study, we categorised the method used to conceal the allocation sequence as:
-
low risk (e.g. telephone or central randomisation; consecutively numbered sealed opaque envelopes);
-
high risk (open random allocation; unsealed or non‐opaque envelopes, alternation; date of birth);
-
unclear risk.
Blinding of participants and personnel (checking for possible performance bias). Was knowledge of the allocated intervention adequately prevented during the study?
For each included study, we categorised the methods used to blind study participants and personnel from knowledge of which intervention a participant received. Blinding was assessed separately for different outcomes or class of outcomes. We categorised the methods as:
-
low risk, high risk or unclear risk for participants;
-
low risk, high risk or unclear risk for personnel.
Blinding of outcome assessment (checking for possible detection bias). Was knowledge of the allocated intervention adequately prevented at the time of outcome assessment?
For each included study, we categorised the methods used to blind outcome assessment. Blinding was assessed separately for different outcomes or class of outcomes. We categorised the methods as:
-
low risk for outcome assessors;
-
high risk for outcome assessors;
-
unclear risk for outcome assessors.
Intervention bias (other differences in ventilator management than purely volume‐targeted ventilation versus pressure‐limited ventilation).
For each included study, we described whether the only difference between the intervention (ventilator management) was volume‐targeted ventilation (VTV) versus pressure‐limited ventilation (PLV). If there were no other obvious differences in the intervention we defined these studies as 'strict studies.' In contrast, for some studies there were also other differences between the VTV group and the PLV group such as use of different ventilators between the groups and use of different triggering modes/devices between groups. These studies were termed as 'hybrid studies.'
Incomplete outcome data (checking for possible attrition bias through withdrawals, dropouts, protocol deviations). Were incomplete outcome data adequately addressed?
For each included study and for each outcome, we described the completeness of data including attrition and exclusions from the analysis. We noted whether attrition and exclusions were reported, the numbers included in the analysis at each stage (compared with the total randomised participants), reasons for attrition or exclusion where reported and whether missing data were balanced across groups or were related to outcomes. Where sufficient information was reported or supplied by the trial authors, we reincluded missing data in the analyses. We categorised the methods as:
-
low risk (less than 20% missing data);
-
high risk (20% or greater missing data);
-
unclear risk.
Selective reporting bias. Are reports of the study free of suggestion of selective outcome reporting?
For each included study, we described how we investigated the possibility of selective outcome reporting bias and what we found. We assessed the methods as:
-
low risk (where it was clear that all of the study's prespecified outcomes and all expected outcomes of interest to the review were reported);
-
high risk (where not all the study's prespecified outcomes were reported; one or more reported primary outcomes were not prespecified outcomes of interest and were reported incompletely and so could not be used; study failed to include results of a key outcome that would have been expected to have been reported);
-
unclear risk.
Other sources of bias. Was the study apparently free of other problems that could put it at a high risk of bias?
For each included study, we described any important concerns we had about other possible sources of bias (e.g. whether there was a potential source of bias related to the specific study design or whether the trial was stopped early due to some data‐dependent process). We assessed whether each study was free of other problems that could put it at risk of bias as:
-
low risk;
-
high risk;
-
unclear risk
If needed, we explored the impact of the level of bias through undertaking sensitivity analyses.

Study flow diagram: review update. PLV: pressure‐limited ventilation; VTV: volume‐targeted ventilation.

Risk of bias graph: review authors' judgements about each risk of bias item presented as percentages across all included studies.

Risk of bias summary: review authors' judgements about each risk of bias item for each included study.

Comparison 1 Volume‐targeted ventilation (VTV) versus pressure‐limited ventilation (PLV) ‐ subgroup by mode of ventilation, Outcome 1 Death before discharge from hospital.
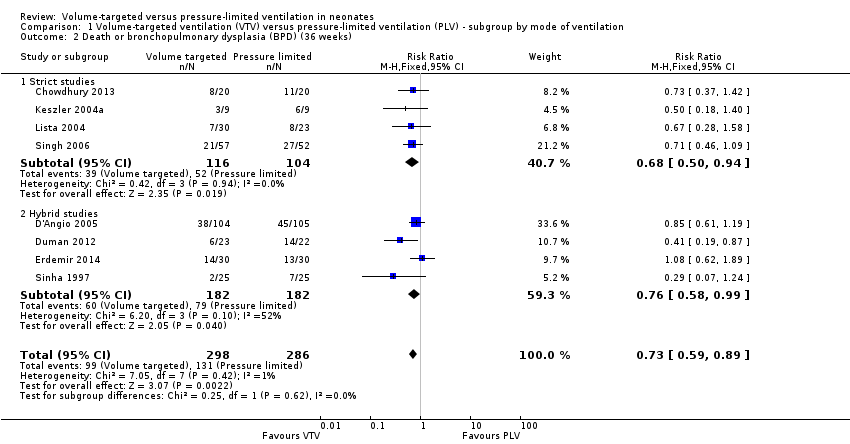
Comparison 1 Volume‐targeted ventilation (VTV) versus pressure‐limited ventilation (PLV) ‐ subgroup by mode of ventilation, Outcome 2 Death or bronchopulmonary dysplasia (BPD) (36 weeks).
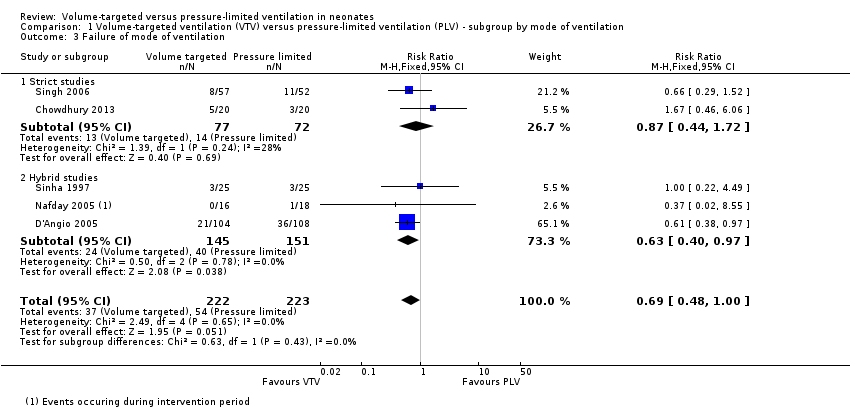
Comparison 1 Volume‐targeted ventilation (VTV) versus pressure‐limited ventilation (PLV) ‐ subgroup by mode of ventilation, Outcome 3 Failure of mode of ventilation.

Comparison 1 Volume‐targeted ventilation (VTV) versus pressure‐limited ventilation (PLV) ‐ subgroup by mode of ventilation, Outcome 4 Addition of neuromuscular paralysis where previously not paralysed.
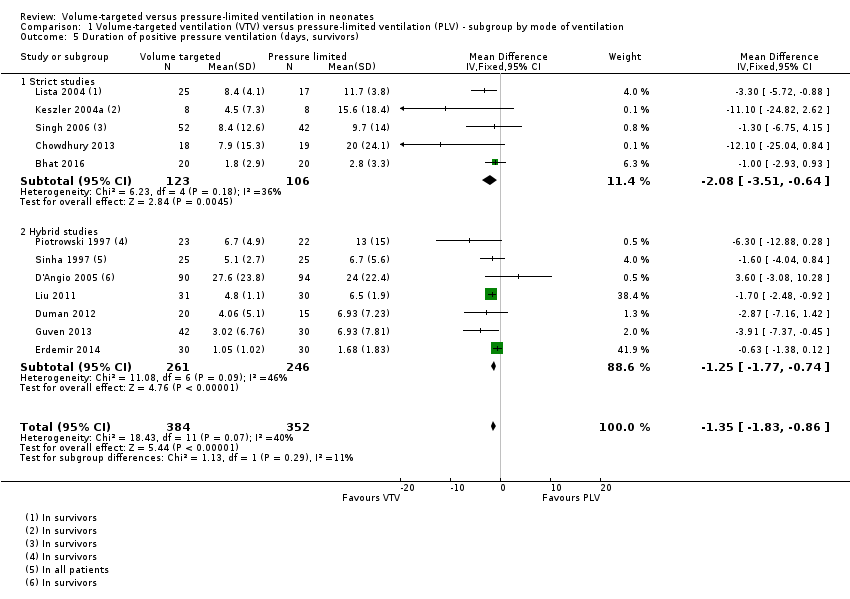
Comparison 1 Volume‐targeted ventilation (VTV) versus pressure‐limited ventilation (PLV) ‐ subgroup by mode of ventilation, Outcome 5 Duration of positive pressure ventilation (days, survivors).

Comparison 1 Volume‐targeted ventilation (VTV) versus pressure‐limited ventilation (PLV) ‐ subgroup by mode of ventilation, Outcome 6 Duration of positive pressure ventilation (log data, survivors).
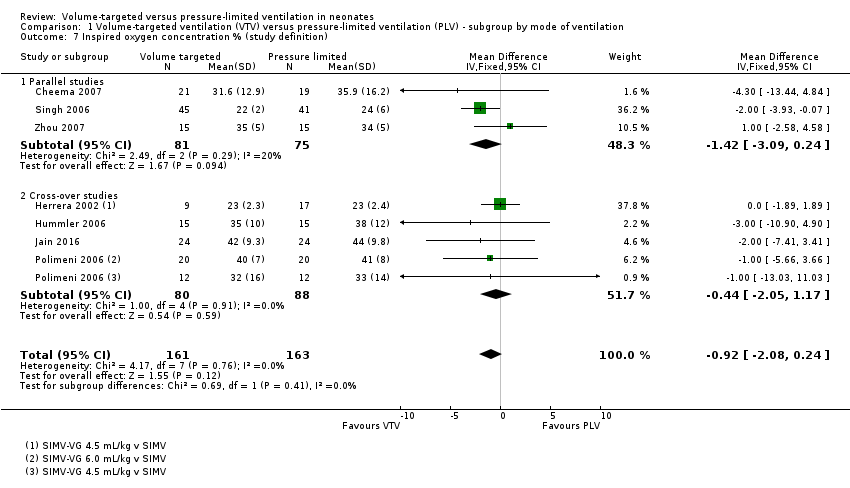
Comparison 1 Volume‐targeted ventilation (VTV) versus pressure‐limited ventilation (PLV) ‐ subgroup by mode of ventilation, Outcome 7 Inspired oxygen concentration % (study definition).
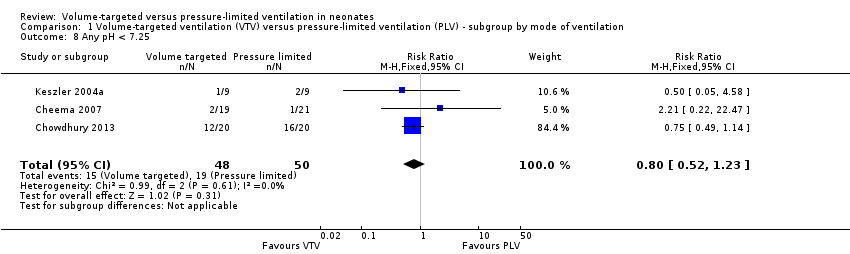
Comparison 1 Volume‐targeted ventilation (VTV) versus pressure‐limited ventilation (PLV) ‐ subgroup by mode of ventilation, Outcome 8 Any pH < 7.25.
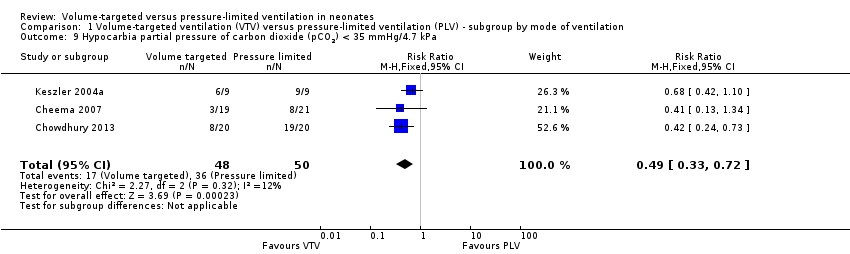
Comparison 1 Volume‐targeted ventilation (VTV) versus pressure‐limited ventilation (PLV) ‐ subgroup by mode of ventilation, Outcome 9 Hypocarbia partial pressure of carbon dioxide (pCO2) < 35 mmHg/4.7 kPa.

Comparison 1 Volume‐targeted ventilation (VTV) versus pressure‐limited ventilation (PLV) ‐ subgroup by mode of ventilation, Outcome 10 Respiratory acidosis; pH < 7.25 and pCO2 > 8 kPa.

Comparison 1 Volume‐targeted ventilation (VTV) versus pressure‐limited ventilation (PLV) ‐ subgroup by mode of ventilation, Outcome 11 Incidence of hypocarbia or respiratory acidosis.
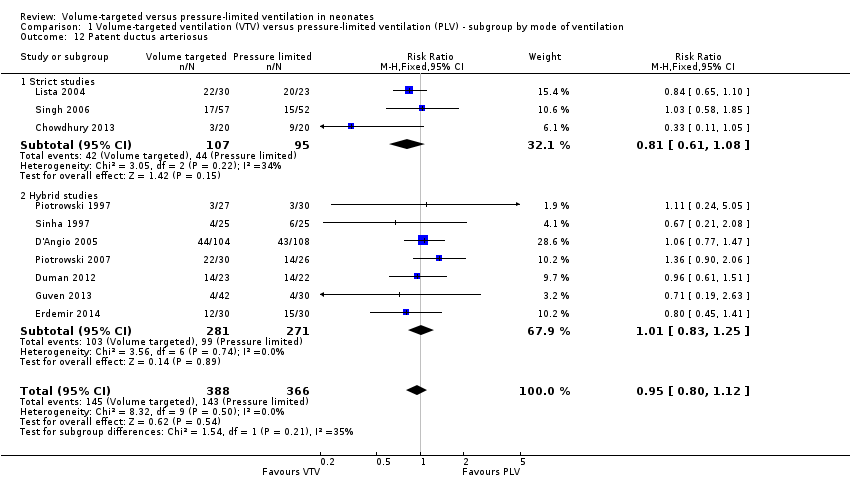
Comparison 1 Volume‐targeted ventilation (VTV) versus pressure‐limited ventilation (PLV) ‐ subgroup by mode of ventilation, Outcome 12 Patent ductus arteriosus.

Comparison 1 Volume‐targeted ventilation (VTV) versus pressure‐limited ventilation (PLV) ‐ subgroup by mode of ventilation, Outcome 13 Air leak (any).
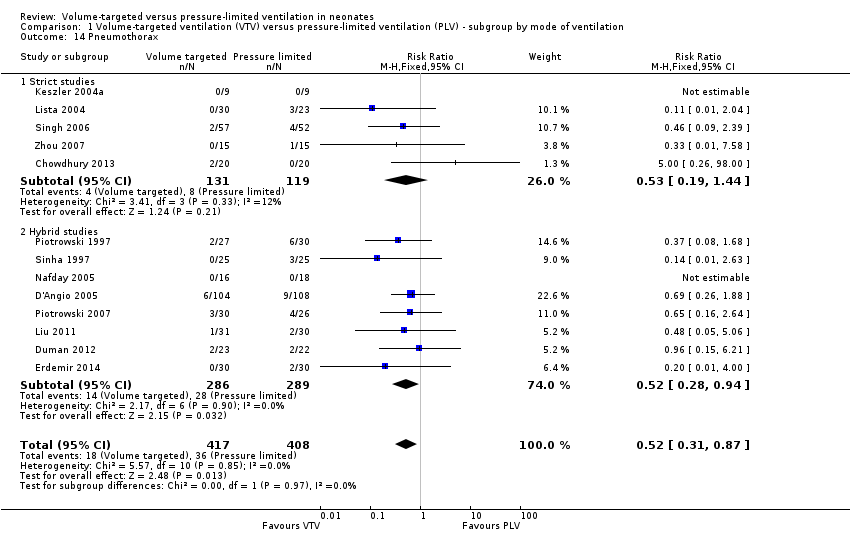
Comparison 1 Volume‐targeted ventilation (VTV) versus pressure‐limited ventilation (PLV) ‐ subgroup by mode of ventilation, Outcome 14 Pneumothorax.
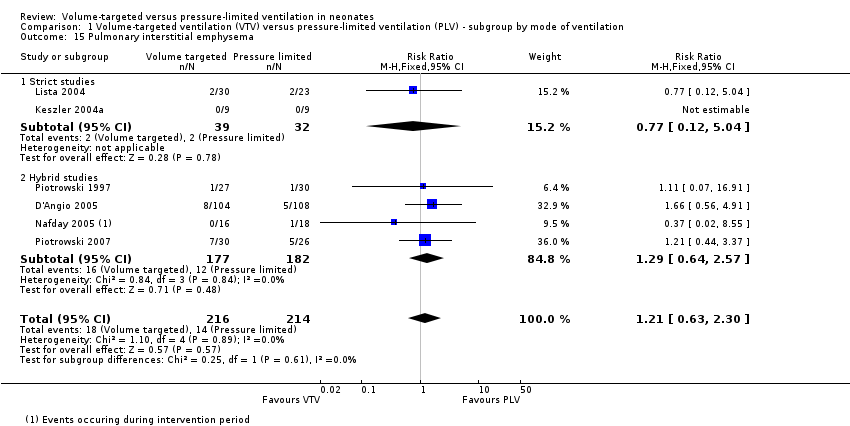
Comparison 1 Volume‐targeted ventilation (VTV) versus pressure‐limited ventilation (PLV) ‐ subgroup by mode of ventilation, Outcome 15 Pulmonary interstitial emphysema.

Comparison 1 Volume‐targeted ventilation (VTV) versus pressure‐limited ventilation (PLV) ‐ subgroup by mode of ventilation, Outcome 16 Any intraventricular haemorrhage (IVH).

Comparison 1 Volume‐targeted ventilation (VTV) versus pressure‐limited ventilation (PLV) ‐ subgroup by mode of ventilation, Outcome 17 Periventricular leukomalacia (PVL).

Comparison 1 Volume‐targeted ventilation (VTV) versus pressure‐limited ventilation (PLV) ‐ subgroup by mode of ventilation, Outcome 18 IVH grade 3‐4.

Comparison 1 Volume‐targeted ventilation (VTV) versus pressure‐limited ventilation (PLV) ‐ subgroup by mode of ventilation, Outcome 19 Any IVH or PVL.

Comparison 1 Volume‐targeted ventilation (VTV) versus pressure‐limited ventilation (PLV) ‐ subgroup by mode of ventilation, Outcome 20 IVH grade 3‐4 or PVL.

Comparison 1 Volume‐targeted ventilation (VTV) versus pressure‐limited ventilation (PLV) ‐ subgroup by mode of ventilation, Outcome 21 BPD (supplemental oxygen in survivors at 36 weeks only).

Comparison 2 Volume‐targeted ventilation (VTV) versus pressure‐limited ventilation (PLV) ‐ infants weighing less than 1000 g, Outcome 1 Death in hospital.

Comparison 2 Volume‐targeted ventilation (VTV) versus pressure‐limited ventilation (PLV) ‐ infants weighing less than 1000 g, Outcome 2 Death or bronchopulmonary dysplasia (BPD) (36 weeks).

Comparison 2 Volume‐targeted ventilation (VTV) versus pressure‐limited ventilation (PLV) ‐ infants weighing less than 1000 g, Outcome 3 Duration of positive pressure ventilation (days, survivors).

Comparison 2 Volume‐targeted ventilation (VTV) versus pressure‐limited ventilation (PLV) ‐ infants weighing less than 1000 g, Outcome 4 Duration of positive pressure ventilation (log data, survivors).

Comparison 2 Volume‐targeted ventilation (VTV) versus pressure‐limited ventilation (PLV) ‐ infants weighing less than 1000 g, Outcome 5 Any pH < 7.25.

Comparison 2 Volume‐targeted ventilation (VTV) versus pressure‐limited ventilation (PLV) ‐ infants weighing less than 1000 g, Outcome 6 Hypocarbia partial pressure of carbon dioxide (pCO2) < 35 mmHg/4.7 kPa.

Comparison 2 Volume‐targeted ventilation (VTV) versus pressure‐limited ventilation (PLV) ‐ infants weighing less than 1000 g, Outcome 7 Respiratory acidosis pH < 7.25 and pCO2 > 60 mmHg/8 kPa.

Comparison 2 Volume‐targeted ventilation (VTV) versus pressure‐limited ventilation (PLV) ‐ infants weighing less than 1000 g, Outcome 8 Hypocarbia or respiratory acidosis.

Comparison 2 Volume‐targeted ventilation (VTV) versus pressure‐limited ventilation (PLV) ‐ infants weighing less than 1000 g, Outcome 9 Patent ductus arteriosus.

Comparison 2 Volume‐targeted ventilation (VTV) versus pressure‐limited ventilation (PLV) ‐ infants weighing less than 1000 g, Outcome 10 Air leak (any).
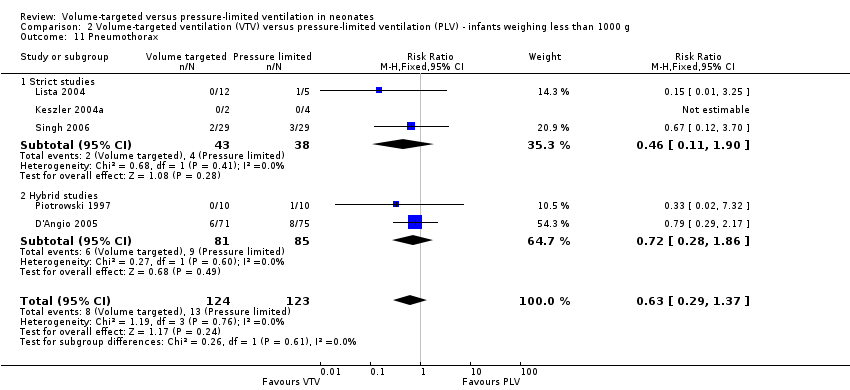
Comparison 2 Volume‐targeted ventilation (VTV) versus pressure‐limited ventilation (PLV) ‐ infants weighing less than 1000 g, Outcome 11 Pneumothorax.

Comparison 2 Volume‐targeted ventilation (VTV) versus pressure‐limited ventilation (PLV) ‐ infants weighing less than 1000 g, Outcome 12 Pulmonary interstitial emphysema.

Comparison 2 Volume‐targeted ventilation (VTV) versus pressure‐limited ventilation (PLV) ‐ infants weighing less than 1000 g, Outcome 13 Any intraventricular haemorrhage (IVH).
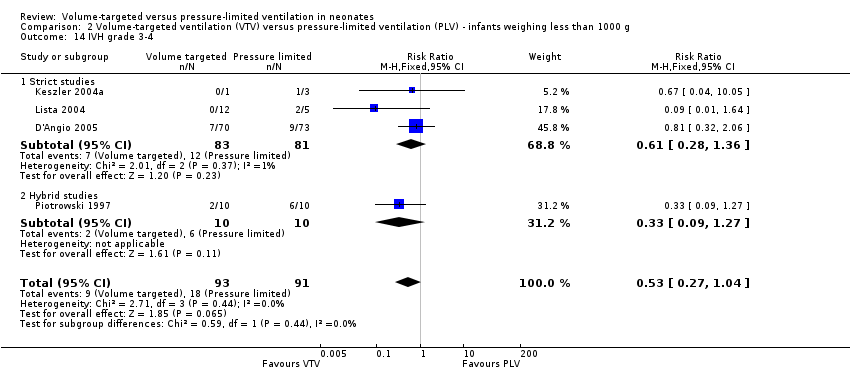
Comparison 2 Volume‐targeted ventilation (VTV) versus pressure‐limited ventilation (PLV) ‐ infants weighing less than 1000 g, Outcome 14 IVH grade 3‐4.

Comparison 2 Volume‐targeted ventilation (VTV) versus pressure‐limited ventilation (PLV) ‐ infants weighing less than 1000 g, Outcome 15 Periventricular leukomalacia (PVL).

Comparison 2 Volume‐targeted ventilation (VTV) versus pressure‐limited ventilation (PLV) ‐ infants weighing less than 1000 g, Outcome 16 Any IVH or PVL.

Comparison 2 Volume‐targeted ventilation (VTV) versus pressure‐limited ventilation (PLV) ‐ infants weighing less than 1000 g, Outcome 17 IVH grade 3‐4 or PVL.
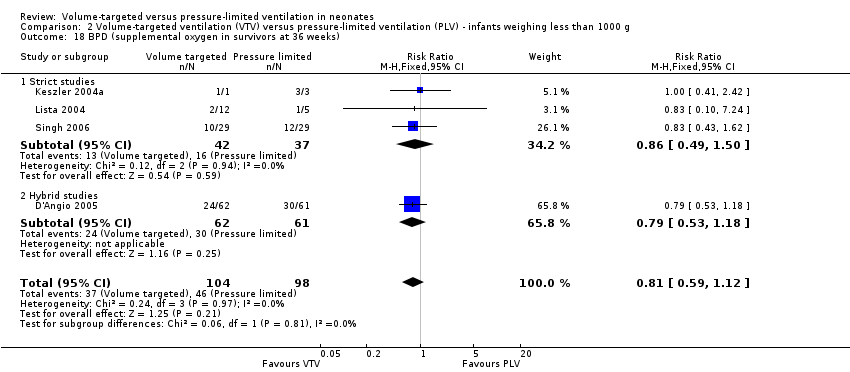
Comparison 2 Volume‐targeted ventilation (VTV) versus pressure‐limited ventilation (PLV) ‐ infants weighing less than 1000 g, Outcome 18 BPD (supplemental oxygen in survivors at 36 weeks).

Comparison 3 Miscellaneous post hoc analyses, Outcome 1 Severe disability (any definition).

Comparison 3 Miscellaneous post hoc analyses, Outcome 2 Severe disability (any definition) or death.
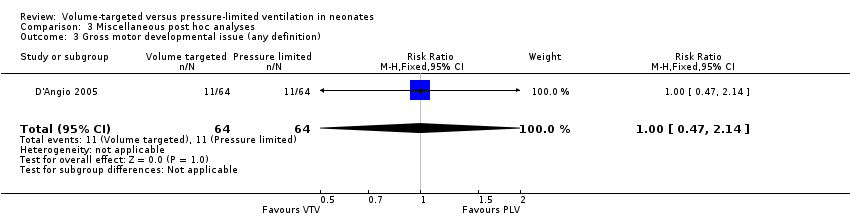
Comparison 3 Miscellaneous post hoc analyses, Outcome 3 Gross motor developmental issue (any definition).

Comparison 3 Miscellaneous post hoc analyses, Outcome 4 Steroids for bronchopulmonary dysplasia.

Comparison 3 Miscellaneous post hoc analyses, Outcome 5 Need for home oxygen (survivors).
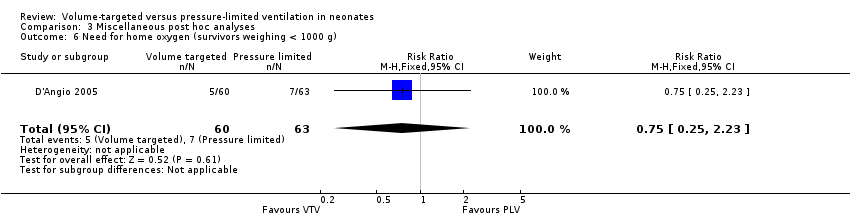
Comparison 3 Miscellaneous post hoc analyses, Outcome 6 Need for home oxygen (survivors weighing < 1000 g).
| Volume‐targeted ventilation compared to pressure‐limited ventilation | ||||||
| Patient or population: neonates up to 44 weeks' postmenstrual age | ||||||
| Outcomes | Anticipated absolute effects* (95% CI) | Relative effect | No of participants | Quality of the evidence | Comments | |
| Risk with PLV | Risk with VTV | |||||
| Death before discharge from hospital | Study population | RR 0.75 | 771 | ⊕⊕⊝⊝ | Unblinded studies. Imprecision of estimates. 95% CI < 0.75. | |
| 163 per 1000 | 122 per 1000 | |||||
| Death or BPD (36 weeks) | Study population | RR 0.73 | 584 | ⊕⊕⊕⊝ | Unblinded studies. | |
| 458 per 1000 | 334 per 1000 | |||||
| Duration of positive pressure ventilation (days) | MD of positive pressure ventilation (days); PLV group 0 | MD 1.35 lower | ‐ | 736 | ⊕⊕⊕⊝ | Unblinded studies. |
| Pneumothorax | Study population | RR 0.52 (0.31 to 0.87) | 825 | ⊕⊕⊕⊝ | Unblinded studies. | |
| 88 per 1000 | 46 per 1000 (27 to 77) | |||||
| IVH grade 3‐4 | Study population | RR 0.53 (0.37 to 0.77) | 712 (10 RCTs) | ⊕⊕⊕⊝ | Unblinded studies. | |
| 184 per 1000 | 97 per 1000 (68 to 141) | |||||
| IVH grade 3‐4 or PVL | Study population | RR 0.47 (0.27 to 0.80) | 441 | ⊕⊕⊕⊝ | Unblinded studies. | |
| 164 per 1000 | 77 per 1000 (44 to 131) | |||||
| BPD (supplemental oxygen at 36 weeks) | Study population | RR 0.68 (0.53 to 0.87) | 620 | ⊕⊕⊝⊝ | Unblinded studies. Possible publication bias based on funnel plot. | |
| 346 per 1000 | 235 per 1000 (183 to 301) | |||||
| *The risk in the intervention group (and its 95% confidence interval) is based on the assumed risk in the comparison group and the relative effect of the intervention (and its 95% CI). BPD: bronchopulmonary dysplasia; CI: confidence interval; IVH: intraventricular haemorrhage; MD: mean difference; PLV: pressure‐limited ventilation; PVL: periventricular leukomalacia; RCT: randomised controlled trial; RR: risk ratio; VTV: volume‐targeted ventilation. | ||||||
| GRADE Working Group grades of evidence | ||||||
| Volume‐targeted ventilation compared to pressure‐limited ventilation | ||||||
| Patient or population: neonates up to 44 weeks' postmenstrual age | ||||||
| Outcomes | Anticipated absolute effects* (95% CI) | Relative effect | No of participants | Quality of the evidence | Comments | |
| Risk with PLV | Risk with VTV | |||||
| Death or BPD (28 days) | Study population | RR 0.87 (0.64 to 1.18) | 149 | ⊕⊕⊝⊝ | Unblinded studies. Imprecision of estimates, 95% CI < 0.75. Few participants. | |
| 536 per 1000 | 467 per 1000 (343 to 633) | |||||
| Failure of mode of ventilation | Study population | RR 0.69 | 445 | ⊕⊕⊕⊝ | Unblinded studies. | |
| 242 per 1000 | 167 per 1000 | |||||
| Addition of neuromuscular paralysis where previously not paralysed | Study population | RR 0.32 | 75 | ⊕⊕⊝⊝ | Unblinded studies. Small numbers of participants. | |
| 179 per 1000 | 57 per 1000 | |||||
| Duration of positive pressure ventilation (log data) | The mean duration of IPPV (log data) was 0 | MD 0.08 lower | ‐ | 381 | ⊕⊕⊝⊝ | Unblinded studies. Heterogeneity of study results. |
| Inspired oxygen concentration % (study definition) | The mean difference in inspired oxygen concentration %; PLV group 0 | The mean inspired oxygen concentration % was 0.92 lower (2.08 lower to 0.24 higher) in VTV group | ‐ | 324 | ⊕⊕⊕⊝ | Unblinded studies. |
| Any pH < 7.25 | Study population | RR 0.80 | 98 | ⊕⊕⊝⊝ | Unblinded studies. Imprecision of estimates, 95% CI < 0.75. Few participants. | |
| 380 per 1000 | 304 per 1000 | |||||
| Hypocarbia pCO2 < 35 mmHg/4.7 kPa | Study population | RR 0.49 (0.33 to 0.72) | 98 | ⊕⊕⊕⊝ | Unblinded studies. Small trials, but large effect and biologically plausible. | |
| 720 per 1000 | 353 per 1000 (238 to 518) | |||||
| Respiratory acidosis pH < 7.25 and pCO2 > 60 mmHg/8 kPa | Study population | RR 0.93 | 98 | ⊕⊕⊝⊝ | Unblinded studies. Imprecision of estimates, 95% CI < 0.75. Few participants. | |
| 240 per 1000 | 223 per 1000 | |||||
| Either hypocarbia or respiratory acidosis | Study population | RR 0.68 | 37 | ‐ | No quality assessment possible. | |
| 1889 per 1000 | 1000 per 1000 | |||||
| Patent ductus arteriosus | Study population | RR 0.95 | 754 | ⊕⊕⊝⊝ | Unblinded studies. Variable diagnostic practices employed. | |
| 391 per 1000 | 371 per 1000 | |||||
| Air leak (any) | Study population | RR 0.79 | 374 | ⊕⊕⊝⊝ | Unblinded studies. Imprecision of estimates, 95% CI < 0.75. Few participants. | |
| 117 per 1000 | 92 per 1000 | |||||
| Pulmonary interstitial emphysema | Study population | RR 1.21 | 430 | ⊕⊕⊝⊝ | Unblinded studies. Imprecision of estimates, 95% CI < 0.75. | |
| 65 per 1000 | 79 per 1000 | |||||
| Any IVH | Study population | RR 0.82 | 445 | ⊕⊕⊝⊝ | Unblinded studies. Imprecision of estimates, 95% CI < 0.75. | |
| 342 per 1000 | 281 per 1000 | |||||
| PVL | Study population | OR 0.43 (0.19 to 0.98) | 508 | ⊕⊕⊕⊝ | Unblinded studies. | |
| 71 per 1000 | 32 per 1000 (14 to 69) | |||||
| Any IVH or PVL | Study population | RR 0.83 | 298 | ⊕⊕⊕⊝ | Unblinded studies. | |
| 308 per 1000 | 256 per 1000 | |||||
| BPD (supplemental oxygen at 28 days) | Study population | RR 0.91 | 206 | ⊕⊕⊝⊝ | Unblinded studies. Imprecision of estimates, 95% CI < 0.75. | |
| 354 per 1000 | 322 per 1000 | |||||
| *The risk in the intervention group (and its 95% confidence interval) is based on the assumed risk in the comparison group and the relative effect of the intervention (and its 95% CI). BPD: bronchopulmonary dysplasia; CI: confidence interval; IPPV: intermittent positive pressure ventilation; IVH: intraventricular haemorrhage; MD: mean difference; pCO2: partial pressure of carbon dioxide; PLV: pressure‐limited ventilation; PVL: periventricular leukomalacia; RCT: randomised controlled trial; RR: risk ratio; VTV: volume‐targeted ventilation. | ||||||
| GRADE Working Group grades of evidence | ||||||
| Outcome or subgroup title | No. of studies | No. of participants | Statistical method | Effect size |
| 1 Death before discharge from hospital Show forest plot | 11 | 771 | Risk Ratio (M‐H, Fixed, 95% CI) | 0.75 [0.53, 1.07] |
| 1.1 Strict studies | 4 | 220 | Risk Ratio (M‐H, Fixed, 95% CI) | 0.60 [0.31, 1.15] |
| 1.2 Hybrid studies | 7 | 551 | Risk Ratio (M‐H, Fixed, 95% CI) | 0.83 [0.55, 1.25] |
| 2 Death or bronchopulmonary dysplasia (BPD) (36 weeks) Show forest plot | 8 | 584 | Risk Ratio (M‐H, Fixed, 95% CI) | 0.73 [0.59, 0.89] |
| 2.1 Strict studies | 4 | 220 | Risk Ratio (M‐H, Fixed, 95% CI) | 0.68 [0.50, 0.94] |
| 2.2 Hybrid studies | 4 | 364 | Risk Ratio (M‐H, Fixed, 95% CI) | 0.76 [0.58, 0.99] |
| 3 Failure of mode of ventilation Show forest plot | 5 | 445 | Risk Ratio (M‐H, Fixed, 95% CI) | 0.69 [0.48, 1.00] |
| 3.1 Strict studies | 2 | 149 | Risk Ratio (M‐H, Fixed, 95% CI) | 0.87 [0.44, 1.72] |
| 3.2 Hybrid studies | 3 | 296 | Risk Ratio (M‐H, Fixed, 95% CI) | 0.63 [0.40, 0.97] |
| 4 Addition of neuromuscular paralysis where previously not paralysed Show forest plot | 2 | 75 | Risk Ratio (M‐H, Fixed, 95% CI) | 0.32 [0.07, 1.40] |
| 4.1 Strict studies | 1 | 18 | Risk Ratio (M‐H, Fixed, 95% CI) | 0.0 [0.0, 0.0] |
| 4.2 Hybrid studies | 1 | 57 | Risk Ratio (M‐H, Fixed, 95% CI) | 0.32 [0.07, 1.40] |
| 5 Duration of positive pressure ventilation (days, survivors) Show forest plot | 12 | 736 | Mean Difference (IV, Fixed, 95% CI) | ‐1.35 [‐1.83, ‐0.86] |
| 5.1 Strict studies | 5 | 229 | Mean Difference (IV, Fixed, 95% CI) | ‐2.08 [‐3.51, ‐0.64] |
| 5.2 Hybrid studies | 7 | 507 | Mean Difference (IV, Fixed, 95% CI) | ‐1.25 [‐1.77, ‐0.74] |
| 6 Duration of positive pressure ventilation (log data, survivors) Show forest plot | 5 | 381 | Mean Difference (IV, Fixed, 95% CI) | ‐0.08 [‐0.16, ‐0.00] |
| 6.1 Strict studies | 3 | 152 | Mean Difference (IV, Fixed, 95% CI) | ‐0.14 [‐0.24, ‐0.04] |
| 6.2 Hybrid studies | 2 | 229 | Mean Difference (IV, Fixed, 95% CI) | 0.02 [‐0.12, 0.15] |
| 7 Inspired oxygen concentration % (study definition) Show forest plot | 7 | 324 | Mean Difference (IV, Fixed, 95% CI) | ‐0.92 [‐2.08, 0.24] |
| 7.1 Parallel studies | 3 | 156 | Mean Difference (IV, Fixed, 95% CI) | ‐1.42 [‐3.09, 0.24] |
| 7.2 Cross‐over studies | 4 | 168 | Mean Difference (IV, Fixed, 95% CI) | ‐0.44 [‐2.05, 1.17] |
| 8 Any pH < 7.25 Show forest plot | 3 | 98 | Risk Ratio (M‐H, Fixed, 95% CI) | 0.80 [0.52, 1.23] |
| 9 Hypocarbia partial pressure of carbon dioxide (pCO2) < 35 mmHg/4.7 kPa Show forest plot | 3 | 98 | Risk Ratio (M‐H, Fixed, 95% CI) | 0.49 [0.33, 0.72] |
| 10 Respiratory acidosis; pH < 7.25 and pCO2 > 8 kPa Show forest plot | 3 | 98 | Risk Ratio (M‐H, Fixed, 95% CI) | 0.93 [0.51, 1.70] |
| 11 Incidence of hypocarbia or respiratory acidosis Show forest plot | 2 | 58 | Risk Ratio (M‐H, Fixed, 95% CI) | 0.69 [0.42, 1.12] |
| 12 Patent ductus arteriosus Show forest plot | 10 | 754 | Risk Ratio (M‐H, Fixed, 95% CI) | 0.95 [0.80, 1.12] |
| 12.1 Strict studies | 3 | 202 | Risk Ratio (M‐H, Fixed, 95% CI) | 0.81 [0.61, 1.08] |
| 12.2 Hybrid studies | 7 | 552 | Risk Ratio (M‐H, Fixed, 95% CI) | 1.01 [0.83, 1.25] |
| 13 Air leak (any) Show forest plot | 5 | 374 | Risk Ratio (M‐H, Fixed, 95% CI) | 0.79 [0.44, 1.43] |
| 13.1 Strict studies | 2 | 71 | Risk Ratio (M‐H, Fixed, 95% CI) | 0.51 [0.09, 2.81] |
| 13.2 Hybrid Studies | 3 | 303 | Risk Ratio (M‐H, Fixed, 95% CI) | 0.84 [0.45, 1.58] |
| 14 Pneumothorax Show forest plot | 13 | 825 | Risk Ratio (M‐H, Fixed, 95% CI) | 0.52 [0.31, 0.87] |
| 14.1 Strict studies | 5 | 250 | Risk Ratio (M‐H, Fixed, 95% CI) | 0.53 [0.19, 1.44] |
| 14.2 Hybrid studies | 8 | 575 | Risk Ratio (M‐H, Fixed, 95% CI) | 0.52 [0.28, 0.94] |
| 15 Pulmonary interstitial emphysema Show forest plot | 6 | 430 | Risk Ratio (M‐H, Fixed, 95% CI) | 1.21 [0.63, 2.30] |
| 15.1 Strict studies | 2 | 71 | Risk Ratio (M‐H, Fixed, 95% CI) | 0.77 [0.12, 5.04] |
| 15.2 Hybrid studies | 4 | 359 | Risk Ratio (M‐H, Fixed, 95% CI) | 1.29 [0.64, 2.57] |
| 16 Any intraventricular haemorrhage (IVH) Show forest plot | 6 | 501 | Risk Ratio (M‐H, Fixed, 95% CI) | 0.90 [0.70, 1.15] |
| 16.1 Strict studies | 2 | 125 | Risk Ratio (M‐H, Fixed, 95% CI) | 1.11 [0.74, 1.67] |
| 16.2 Hybrid studies | 4 | 376 | Risk Ratio (M‐H, Fixed, 95% CI) | 0.82 [0.60, 1.11] |
| 17 Periventricular leukomalacia (PVL) Show forest plot | 7 | 508 | Risk Ratio (M‐H, Fixed, 95% CI) | 0.45 [0.21, 0.98] |
| 17.1 Strict studies | 4 | 218 | Risk Ratio (M‐H, Fixed, 95% CI) | 0.53 [0.17, 1.65] |
| 17.2 Hybrid studies | 3 | 290 | Risk Ratio (M‐H, Fixed, 95% CI) | 0.40 [0.14, 1.14] |
| 18 IVH grade 3‐4 Show forest plot | 10 | 712 | Risk Difference (M‐H, Fixed, 95% CI) | ‐0.09 [‐0.14, ‐0.04] |
| 18.1 Strict studies | 4 | 218 | Risk Difference (M‐H, Fixed, 95% CI) | ‐0.05 [‐0.13, 0.02] |
| 18.2 Hybrid studies | 6 | 494 | Risk Difference (M‐H, Fixed, 95% CI) | ‐0.10 [‐0.17, ‐0.04] |
| 19 Any IVH or PVL Show forest plot | 3 | 298 | Risk Ratio (M‐H, Fixed, 95% CI) | 0.83 [0.58, 1.18] |
| 19.1 Strict studies | 2 | 125 | Risk Ratio (M‐H, Fixed, 95% CI) | 0.83 [0.52, 1.35] |
| 19.2 Hybrid studies | 1 | 173 | Risk Ratio (M‐H, Fixed, 95% CI) | 0.82 [0.48, 1.39] |
| 20 IVH grade 3‐4 or PVL Show forest plot | 6 | 441 | Risk Ratio (M‐H, Fixed, 95% CI) | 0.47 [0.27, 0.80] |
| 20.1 Strict studies | 4 | 218 | Risk Ratio (M‐H, Fixed, 95% CI) | 0.51 [0.25, 1.03] |
| 20.2 Hybrid studies | 2 | 223 | Risk Ratio (M‐H, Fixed, 95% CI) | 0.42 [0.19, 0.96] |
| 21 BPD (supplemental oxygen in survivors at 36 weeks only) Show forest plot | 9 | 620 | Risk Ratio (M‐H, Fixed, 95% CI) | 0.68 [0.53, 0.87] |
| 21.1 Strict studies | 4 | 218 | Risk Ratio (M‐H, Fixed, 95% CI) | 0.75 [0.52, 1.07] |
| 21.2 Hybrid studies | 5 | 402 | Risk Ratio (M‐H, Fixed, 95% CI) | 0.64 [0.46, 0.89] |
| Outcome or subgroup title | No. of studies | No. of participants | Statistical method | Effect size |
| 1 Death in hospital Show forest plot | 5 | 246 | Risk Ratio (M‐H, Fixed, 95% CI) | 0.71 [0.42, 1.21] |
| 1.1 Strict studies | 4 | 226 | Risk Ratio (M‐H, Fixed, 95% CI) | 0.80 [0.46, 1.39] |
| 1.2 Hybrid studies | 1 | 20 | Risk Ratio (M‐H, Fixed, 95% CI) | 0.25 [0.03, 1.86] |
| 2 Death or bronchopulmonary dysplasia (BPD) (36 weeks) Show forest plot | 4 | 224 | Risk Ratio (M‐H, Fixed, 95% CI) | 0.79 [0.62, 1.01] |
| 2.1 Strict studies | 3 | 81 | Risk Ratio (M‐H, Fixed, 95% CI) | 0.75 [0.52, 1.10] |
| 2.2 Hybrid studies | 1 | 143 | Risk Ratio (M‐H, Fixed, 95% CI) | 0.82 [0.59, 1.12] |
| 3 Duration of positive pressure ventilation (days, survivors) Show forest plot | 5 | 198 | Mean Difference (IV, Fixed, 95% CI) | ‐0.82 [‐4.43, 2.80] |
| 3.1 Strict studies | 3 | 63 | Mean Difference (IV, Fixed, 95% CI) | ‐0.32 [‐4.53, 3.89] |
| 3.2 Hybrid studies | 2 | 135 | Mean Difference (IV, Fixed, 95% CI) | ‐2.21 [‐9.29, 4.87] |
| 4 Duration of positive pressure ventilation (log data, survivors) Show forest plot | 5 | 198 | Mean Difference (IV, Fixed, 95% CI) | ‐0.01 [‐0.12, 0.10] |
| 4.1 Strict studies | 3 | 63 | Mean Difference (IV, Fixed, 95% CI) | ‐0.04 [‐0.23, 0.14] |
| 4.2 Hybrid studies | 2 | 135 | Mean Difference (IV, Fixed, 95% CI) | 0.01 [‐0.12, 0.14] |
| 5 Any pH < 7.25 Show forest plot | 2 | 46 | Risk Ratio (M‐H, Fixed, 95% CI) | 0.71 [0.46, 1.09] |
| 6 Hypocarbia partial pressure of carbon dioxide (pCO2) < 35 mmHg/4.7 kPa Show forest plot | 1 | 6 | Risk Ratio (M‐H, Fixed, 95% CI) | 0.19 [0.01, 2.36] |
| 7 Respiratory acidosis pH < 7.25 and pCO2 > 60 mmHg/8 kPa Show forest plot | 2 | 46 | Risk Ratio (M‐H, Fixed, 95% CI) | 0.79 [0.43, 1.47] |
| 8 Hypocarbia or respiratory acidosis Show forest plot | 1 | 6 | Risk Ratio (M‐H, Fixed, 95% CI) | 0.19 [0.01, 2.36] |
| 9 Patent ductus arteriosus Show forest plot | 4 | 241 | Risk Ratio (M‐H, Fixed, 95% CI) | 1.09 [0.85, 1.39] |
| 9.1 Strict studies | 2 | 75 | Risk Ratio (M‐H, Fixed, 95% CI) | 1.10 [0.77, 1.57] |
| 9.2 Hybrid studies | 2 | 166 | Risk Ratio (M‐H, Fixed, 95% CI) | 1.08 [0.78, 1.50] |
| 10 Air leak (any) Show forest plot | 4 | 189 | Risk Ratio (M‐H, Fixed, 95% CI) | 1.11 [0.55, 2.23] |
| 10.1 Strict studies | 2 | 23 | Risk Ratio (M‐H, Fixed, 95% CI) | 0.83 [0.10, 7.24] |
| 10.2 Hybrid studies | 2 | 166 | Risk Ratio (M‐H, Fixed, 95% CI) | 1.14 [0.54, 2.40] |
| 11 Pneumothorax Show forest plot | 5 | 247 | Risk Ratio (M‐H, Fixed, 95% CI) | 0.63 [0.29, 1.37] |
| 11.1 Strict studies | 3 | 81 | Risk Ratio (M‐H, Fixed, 95% CI) | 0.46 [0.11, 1.90] |
| 11.2 Hybrid studies | 2 | 166 | Risk Ratio (M‐H, Fixed, 95% CI) | 0.72 [0.28, 1.86] |
| 12 Pulmonary interstitial emphysema Show forest plot | 4 | 189 | Risk Ratio (M‐H, Fixed, 95% CI) | 1.45 [0.58, 3.67] |
| 12.1 Strict studies | 2 | 23 | Risk Ratio (M‐H, Fixed, 95% CI) | 0.83 [0.10, 7.24] |
| 12.2 Hybrid studies | 2 | 166 | Risk Ratio (M‐H, Fixed, 95% CI) | 1.62 [0.58, 4.53] |
| 13 Any intraventricular haemorrhage (IVH) Show forest plot | 4 | 225 | Risk Ratio (M‐H, Fixed, 95% CI) | 0.79 [0.55, 1.16] |
| 13.1 Strict studies | 2 | 62 | Risk Ratio (M‐H, Fixed, 95% CI) | 1.14 [0.62, 2.08] |
| 13.2 Hybrid studies | 2 | 163 | Risk Ratio (M‐H, Fixed, 95% CI) | 0.66 [0.40, 1.06] |
| 14 IVH grade 3‐4 Show forest plot | 4 | 184 | Risk Ratio (M‐H, Fixed, 95% CI) | 0.53 [0.27, 1.04] |
| 14.1 Strict studies | 3 | 164 | Risk Ratio (M‐H, Fixed, 95% CI) | 0.61 [0.28, 1.36] |
| 14.2 Hybrid studies | 1 | 20 | Risk Ratio (M‐H, Fixed, 95% CI) | 0.33 [0.09, 1.27] |
| 15 Periventricular leukomalacia (PVL) Show forest plot | 4 | 203 | Risk Ratio (M‐H, Fixed, 95% CI) | 0.43 [0.15, 1.24] |
| 15.1 Strict studies | 3 | 79 | Risk Ratio (M‐H, Fixed, 95% CI) | 0.38 [0.10, 1.53] |
| 15.2 Hybrid studies | 1 | 124 | Risk Ratio (M‐H, Fixed, 95% CI) | 0.5 [0.10, 2.63] |
| 16 Any IVH or PVL Show forest plot | 3 | 186 | Risk Ratio (M‐H, Fixed, 95% CI) | 0.90 [0.60, 1.35] |
| 16.1 Strict studies | 2 | 62 | Risk Ratio (M‐H, Fixed, 95% CI) | 1.05 [0.61, 1.80] |
| 16.2 Hybrid studies | 1 | 124 | Risk Ratio (M‐H, Fixed, 95% CI) | 0.78 [0.43, 1.42] |
| 17 IVH grade 3‐4 or PVL Show forest plot | 3 | 145 | Odds Ratio (M‐H, Fixed, 95% CI) | 0.39 [0.15, 0.99] |
| 17.1 Strict studies | 2 | 21 | Odds Ratio (M‐H, Fixed, 95% CI) | 0.10 [0.01, 1.04] |
| 17.2 Hybrid studies | 1 | 124 | Odds Ratio (M‐H, Fixed, 95% CI) | 0.56 [0.19, 1.64] |
| 18 BPD (supplemental oxygen in survivors at 36 weeks) Show forest plot | 4 | 202 | Risk Ratio (M‐H, Fixed, 95% CI) | 0.81 [0.59, 1.12] |
| 18.1 Strict studies | 3 | 79 | Risk Ratio (M‐H, Fixed, 95% CI) | 0.86 [0.49, 1.50] |
| 18.2 Hybrid studies | 1 | 123 | Risk Ratio (M‐H, Fixed, 95% CI) | 0.79 [0.53, 1.18] |
| Outcome or subgroup title | No. of studies | No. of participants | Statistical method | Effect size |
| 1 Severe disability (any definition) Show forest plot | 2 | 209 | Risk Ratio (M‐H, Fixed, 95% CI) | 0.86 [0.47, 1.59] |
| 2 Severe disability (any definition) or death Show forest plot | 1 | 109 | Risk Ratio (M‐H, Fixed, 95% CI) | 0.54 [0.27, 1.06] |
| 3 Gross motor developmental issue (any definition) Show forest plot | 1 | 128 | Risk Ratio (M‐H, Fixed, 95% CI) | 1.0 [0.47, 2.14] |
| 4 Steroids for bronchopulmonary dysplasia Show forest plot | 1 | 203 | Risk Ratio (M‐H, Fixed, 95% CI) | 0.93 [0.65, 1.31] |
| 5 Need for home oxygen (survivors) Show forest plot | 2 | 270 | Risk Ratio (M‐H, Fixed, 95% CI) | 0.64 [0.30, 1.36] |
| 6 Need for home oxygen (survivors weighing < 1000 g) Show forest plot | 1 | 123 | Risk Ratio (M‐H, Fixed, 95% CI) | 0.75 [0.25, 2.23] |