Les laits maternisés contenant des protéines hydrolysées dans la prévention des maladies allergiques et des allergies alimentaires
Résumé scientifique
Contexte
Les allergies sont fréquentes et parfois associées à des aliments, notamment au lait maternisé à base de lait de vache. Des préparations contenant des protéines hydrolysées ont été utilisées pour traiter les nourrissons allergiques. Cependant, il est difficile de savoir précisément si ces laits maternisés hydrolysés peuvent être recommandés pour la prévention des allergies chez les nourrissons.
Objectifs
Comparer les effets sur les allergies (alimentaires et autres) de l’alimentation des nourrissons avec un lait maternisé à base de lait de vache hydrolysé et avec du lait maternel. Si les formules hydrolysées sont efficaces, déterminer quel type (fortement ou partiellement hydrolysé) est le plus efficace. Déterminer quels nourrissons sont à faible risque ou risque élevé d’allergie et quels nourrissons recevant une alimentation précoce, de courte durée ou prolongée avec des laits maternisés pourraient tirer bénéfice de l’utilisation de formulations hydrolysées.
Stratégie de recherche documentaire
Nous avons utilisé la stratégie de recherche standard du groupe de revue Cochrane sur la néonatologie, complétée par des références croisées à des revues précédentes et des publications (mise à jour en août 2016).
Critères de sélection
Nous avons recherché des essais randomisés et quasi‐randomisés qui comparaient l’utilisation d’un lait maternisé hydrolysé au lait maternel ou au lait maternisé à base de lait de vache. Les essais où le suivi des participants atteignait ou dépassait 80 % étaient éligibles à l’inclusion.
Recueil et analyse des données
Nous avons évalué l’éligibilité des études à l’inclusion et la qualité méthodologique et extrait les données de façon indépendante. Les critères d’évaluation principaux incluaient les allergies cliniques, spécifiques et alimentaires. Nous avons réalisé une méta‐analyse en utilisant un modèle à effets fixes (FE).
Résultats principaux
Deux études ont évalué l’effet d’une supplémentation de trois à quatre jours avec un lait maternisé fortement hydrolysé à la maternité, juste après la naissance, à l’alimentation avec du lait humain pasteurisé. Les résultats n’ont montré aucune différence en termes d’allergie au lait maternisé à base de lait de vache chez les nourrissons ou les petits enfants. Aucun essai éligible ne comparait l’alimentation prolongée avec un lait hydrolysé à l’allaitement maternel.
Deux études ont évalué l’effet d’une supplémentation de trois à quatre jours avec un lait maternisé fortement hydrolysé (LFH) avec un lait maternisé à base de lait de vache. Une seule grande étude quasi‐randomisée a rapporté une réduction de l’allergie des nourrissons au lait de vache à la limite de la significativité chez des nourrissons à faible risque (risque relatif (RR) 0,62, intervalle de confiance (IC) à 95 % de 0,38 à 1,00).
L’alimentation prolongée des nourrissons avec un lait hydrolysé était associée à une réduction des allergies chez les nourrissons (8 études, 2852 nourrissons ; FE RR 0,82, IC à 95% de 0,72 à 0,95 ; différence de risques (DR) ‐0,04, IC à 95 % de ‐0,08 à ‐0,01 ; nombre de sujets à traiter pour obtenir un résultat bénéfique supplémentaire (NSTb) 25, IC à 95 % de 12,5 à 100) et des allergies au lait de vache chez les nourrissons (2 études, 405 nourrissons ; FE RR 0,38, IC à 95 % 0,16 à 0,86) par rapport à un lait maternisé à base de lait de vache. La méthodologie des études nous a posé des problèmes non négligeables et nous avons soupçonné un biais de publication car plusieurs études, notamment chez des nourrissons à haut risque, n’ont pas rapporté leurs résultats d’allergie de manière exhaustive (données de « très mauvaise » qualité selon le classement GRADE).
L’alimentation prolongée des nourrissons avec un lait hydrolysé n’était pas associée à une différence des allergies dans l’enfance par rapport au lait maternisé à base de lait de vache et ne donnait aucune différence pour les allergies spécifiques, notamment l’asthme, l’eczéma et les rhinites infantiles ainsi que les allergies alimentaires du nourrisson. Beaucoup d’analyses évaluant les allergies spécifiques sont de faible puissance.
Les analyses par sous‐groupes ont montré que les allergies du nourrisson étaient réduites dans les études portant sur des nourrissons à haut risque d’allergie et comparant un lait hydrolysé à un lait maternisé à base de lait de vache, une formulation partiellement hydrolysée à un lait maternisé à base de lait de vache, une alimentation prolongée et exclusive avec un lait maternisé hydrolysé à un lait maternisé à base de lait de vache, ou une formulation à base de lactosérum partiellement hydrolysée à une formulation à base de lait de vache. Les études qui portaient sur des nourrissons à haut risque d’allergie, comparant une formulation partiellement hydrolysée à un lait maternisé à base de lait de vache, une alimentation prolongée et exclusive avec un lait maternisé hydrolysé à un lait maternisé à base de lait de vache ou une formulation à base de lactosérum partiellement hydrolysée à un lait maternisé à base de lait de vache, ont révélé une réduction des allergies au lait de vache chez les nourrissons.
Conclusions des auteurs
Nous n’avons trouvé aucune preuve à l’appui d’une alimentation de courte durée ou prolongée avec un lait maternisé hydrolysé par rapport à l’allaitement maternel exclusif pour la prévention des allergies. Des données de très mauvaise qualité indiquent que l’utilisation à court terme d’un lait maternisé fortement hydrolysé peut prévenir les allergies au lait de vache des nourrissons par rapport à une lait maternisé à base de lait de vache.
Chez les nourrissons à haut risque d’allergie qui ne sont pas exclusivement allaités, des données de très mauvaise qualité suggèrent que l’alimentation prolongée avec un lait maternisé hydrolysé réduit les allergies en général et l’allergie au lait de vache des nourrissons, en particulier, par rapport à l’alimentation avec du lait maternisé à base de lait de vache. Les études n’ont fait apparaître aucune différence pour les allergies dans l’enfance et aucune différence pour les allergies spécifiques, notamment l’asthme, l’eczéma et la rhinite de l’enfant et du nourrisson et les allergies alimentaires du nourrisson.
Des données de très mauvaise qualité montrent que l’utilisation prolongée, exclusive ou partielle, d’un lait maternisé partiellement hydrolysé était associée à une réduction de l’incidence des allergies du nourrisson et de l’incidence de l’allergie au lait de vache par rapport à un lait maternisé à base de lait de vache, et que l’utilisation prolongée d’un lait fortement hydrolysé réduisait les allergies alimentaires du nourrisson par rapport à un lait partiellement hydrolysé.
PICO
Résumé simplifié
Les laits maternisés contenant des protéines hydrolysées dans la prévention des maladies allergiques et des allergies alimentaires
Question de la revue
L’alimentation des nouveau‐nés avec un lait maternisé contenant des protéines hydrolysées permet‐elle de réduire le risque qu’ils développent des allergies (asthme, dermites ou eczéma, rhinite allergique) ou des allergies alimentaires pendant leur enfance ?
Contexte
Les allergies représentent un fardeau sanitaire considérable chez les nourrissons, les enfants et les adultes. Leur développement pourrait dépendre des apports alimentaires précoces. Pour les nourrissons qui ne sont pas exclusivement nourris au sein, l’utilisation de laits maternisés hydrolysés au lieu des formulations habituelles à base de lait de vache peut réduire l’apparition d’allergies pendant les premières années de vie, bien que des études supplémentaires soient nécessaires pour le confirmer. Des laits pour nourrissons ont été formulés dans le but de réduire le risque d'allergies, notamment des formulations hydrolysées à base de lait de vache ou de lait de soja dans lesquelles les protéines du lait sont fractionnées en plus petites molécules, potentiellement moins allergisantes.
Résultats
Cette revue d’essais n’a trouvé aucune preuve à l’appui de l’alimentation avec un lait maternisé hydrolysé de préférence à l’allaitement maternel exclusif en prévention des allergies. Pour les nourrissons à haut risque d’allergie qui ne peuvent pas être nourris exclusivement au sein, des données limitées indiquent que l’alimentation avec un lait hydrolysé réduit les allergies, notamment au lait de vache, dans les premières années de vie par rapport au lait maternisé à base de lait de vache. La qualité des données probantes et la cohérence des résultats sont cependant insuffisantes et l’étude de cette question doit être poursuivie.
Conclusions
Chez les nourrissons à haut risque d’allergie qui ne peuvent pas être nourris exclusivement au sein, des données de très mauvaise qualité suggèrent qu’une supplémentation prolongée avec un lait maternisé hydrolysé réduit le risque d’allergie, notamment au lait de vache, par rapport au lait maternisé à base de lait de vache. Des recherches supplémentaires sont cependant nécessaires pour confirmer ces résultats.
Authors' conclusions
Summary of findings
| Early short‐term feeding of hydrolysed formula versus human milk for prevention of allergic disease and food allergy | ||||||
| Patient or population: infants not selected for allergy risk | ||||||
| Outcomes | Illustrative comparative risks* (95% CI) | Relative effect | Number of participants | Quality of the evidence | Comments | |
| Assumed risk | Corresponding risk | |||||
| Control | Early short‐term feeding: hydrolysed formula vs human milk ‐ low‐risk infants | |||||
| Any allergy ‐ childhood (incidence) | Study population | RR 1.43 | 90 | ⊕⊝⊝⊝ | ||
| 75 per 1000 | 108 per 1000 | |||||
| Moderate | ||||||
| 76 per 1000 | 109 per 1000 | |||||
| Asthma ‐ childhood (incidence) | Study population | RR 0.48 | 90 | ⊕⊝⊝⊝ | ||
| 57 per 1000 | 27 per 1000 | |||||
| Moderate | ||||||
| 57 per 1000 | 27 per 1000 | |||||
| Eczema ‐ childhood (incidence) | Study population | RR 0.48 | 90 | ⊕⊝⊝⊝ | ||
| 57 per 1000 | 27 per 1000 | |||||
| Moderate | ||||||
| 57 per 1000 | 27 per 1000 | |||||
| Food allergy ‐ childhood (incidence) | Study population | RR 1.43 | 90 | ⊕⊝⊝⊝ | ||
| 75 per 1000 | 108 per 1000 | |||||
| Moderate | ||||||
| 76 per 1000 | 109 per 1000 | |||||
| Cow's milk allergy ‐ infancy (incidence) | Study population | RR 0.87 | 3559 | ⊕⊝⊝⊝ | ||
| 17 per 1000 | 15 per 1000 | |||||
| Moderate | ||||||
| 17 per 1000 | 15 per 1000 | |||||
| Cow's milk allergy ‐ childhood (incidence) | Study population | RR 7.11 | 90 | ⊕⊝⊝⊝ | ||
| 0 per 1000 | 0 per 1000 | |||||
| Moderate | ||||||
| 0 per 1000 | 0 per 1000 | |||||
| *The basis for the assumed risk (e.g. median control group risk across studies) is provided in footnotes. The corresponding risk (and its 95% confidence interval) is based on the assumed risk in the comparison group and the relative effect of the intervention (and its 95% CI) | ||||||
| GRADE Working Group grades of evidence | ||||||
| aMethodological concerns including quasi‐random sequence allocation, incomplete outcome data and imbalances at baseline | ||||||
| Early short‐term feeding of hydrolysed formula versus cow's milk formula for prevention of allergic disease and food allergy | ||||||
| Patient or population: infants not selected for allergy risk | ||||||
| Outcomes | Illustrative comparative risks* (95% CI) | Relative effect | Number of participants | Quality of the evidence | Comments | |
| Assumed risk | Corresponding risk | |||||
| Control | Early short‐term feeding: hydrolysed formula vs cow's milk formula ‐ low‐risk infants | |||||
| Any allergy ‐ childhood (incidence) | Study population | RR 1.37 | 77 | ⊕⊝⊝⊝ | ||
| 77 per 1000 | 105 per 1000 | |||||
| Moderate | ||||||
| 77 per 1000 | 105 per 1000 | |||||
| Asthma ‐ childhood (incidence) | Study population | RR 3.08 | 77 | ⊕⊝⊝⊝ | ||
| 0 per 1000 | 0 per 1000 | |||||
| Moderate | ||||||
| 0 per 1000 | 0 per 1000 | |||||
| Eczema ‐ childhood (incidence) | Study population | RR 0.34 | 77 | ⊕⊝⊝⊝ | ||
| 77 per 1000 | 26 per 1000 | |||||
| Moderate | ||||||
| 77 per 1000 | 26 per 1000 | |||||
| Food allergy ‐ childhood (incidence) | Study population | RR 1.37 | 77 | ⊕⊝⊝⊝ | ||
| 77 per 1000 | 105 per 1000 | |||||
| Moderate | ||||||
| 77 per 1000 | 105 per 1000 | |||||
| Cow's milk allergy ‐ infancy (incidence) | Study population | RR 0.62 | 3473 | ⊕⊝⊝⊝ | ||
| 24 per 1000 | 15 per 1000 | |||||
| Moderate | ||||||
| 25 per 1000 | 15 per 1000 | |||||
| Cow's milk allergy ‐ childhood (incidence) | Study population | RR 5.13 | 77 | ⊕⊝⊝⊝ | ||
| 0 per 1000 | 0 per 1000 | |||||
| Moderate | ||||||
| 0 per 1000 | 0 per 1000 | |||||
| *The basis for the assumed risk (e.g. median control group risk across studies) is provided in footnotes. The corresponding risk (and its 95% confidence interval) is based on the assumed risk in the comparison group and the relative effect of the intervention (and its 95% CI) | ||||||
| GRADE Working Group grades of evidence | ||||||
| aMethodological concerns including quasi‐random sequence allocation, incomplete outcome data and imbalances at baseline | ||||||
| Prolonged feeding of hydrolysed formula versus cow's milk formula for prevention of allergic disease and food allergy | ||||||
| Patient or population: infants | ||||||
| Outcomes | Illustrative comparative risks* (95% CI) | Relative effect | Number of participants | Quality of the evidence | Comments | |
| Assumed risk | Corresponding risk | |||||
| Control | Prolonged feeding: hydrolysed formula vs cow's milk formula | |||||
| Any allergy ‐ infancy (incidence) | Study population | RR 0.82 | 2852 | ⊕⊝⊝⊝ | ||
| 294 per 1000 | 241 per 1000 | |||||
| Moderate | ||||||
| 395 per 1000 | 324 per 1000 | |||||
| Any allergy ‐ childhood (incidence) | Study population | RR 0.85 | 950 | ⊕⊝⊝⊝ | ||
| 353 per 1000 | 300 per 1000 | |||||
| Moderate | ||||||
| 381 per 1000 | 324 per 1000 | |||||
| Asthma ‐ infancy (incidence) | Study population | RR 0.57 | 318 | ⊕⊝⊝⊝ | ||
| 175 per 1000 | 100 per 1000 | |||||
| Moderate | ||||||
| 149 per 1000 | 85 per 1000 | |||||
| Eczema ‐ infancy (incidence) | Study population | RR 0.86 | 2896 | ⊕⊝⊝⊝ | ||
| 223 per 1000 | 191 per 1000 | |||||
| Moderate | ||||||
| 200 per 1000 | 172 per 1000 | |||||
| Rhinitis ‐ infancy (incidence) | Study population | RR 0.52 | 256 | ⊕⊝⊝⊝ | ||
| 58 per 1000 | 30 per 1000 | |||||
| Moderate | ||||||
| 0 per 1000 | 0 per 1000 | |||||
| Food allergy ‐ infancy (incidence) | Study population | RR 0.95 | 479 | ⊕⊝⊝⊝ | ||
| 139 per 1000 | 132 per 1000 | |||||
| Moderate | ||||||
| 119 per 1000 | 113 per 1000 | |||||
| Cow's milk allergy ‐ infancy (incidence) | Study population | RR 0.38 | 405 | ⊕⊝⊝⊝ | ||
| 80 per 1000 | 30 per 1000 | |||||
| Moderate | ||||||
| 222 per 1000 | 84 per 1000 | |||||
| *The basis for the assumed risk (e.g. median control group risk across studies) is provided in footnotes. The corresponding risk (and its 95% confidence interval) is based on the assumed risk in the comparison group and the relative effect of the intervention (and its 95% CI) | ||||||
| GRADE Working Group grades of evidence | ||||||
| aSubstantial methodological concerns. Sensitivity analysis found no study considered at low risk of bias | ||||||
Background
Description of the condition
Food allergy and allergic disease are prevalent and represent a substantial health problem that may be increasing in developed countries (Burr 1989; Halken 2004; Prescott 2005; Schultz Larsen 1996). Although less than half of those who develop childhood allergic disease have a first‐degree relative with a history of allergy, the risk of allergy increases substantially with a positive family history (Bergmann 1994; Sears 1996; Tariq 1998). Approximately 10% of children without an allergic first‐degree relative develop allergic disease compared with 20% to 30% with an allergic first‐degree relative (parent or sibling) and 40% to 50% with two affected relatives (Arshad 2005; Bergmann 1997; Hansen 1993; Kjellman 1977). The predictive value of family history is increased with the addition of cord blood immunoglobulin (Ig) E antibody testing, although its accuracy may not be adequate for population screening (Bergmann 1997; Bergmann 1998; Tariq 1998).
Manifestations of allergic disease are age dependent. Infants commonly present with symptoms and signs of atopic eczema, gastrointestinal symptoms and recurrent wheezing. Asthma and rhinoconjunctivitis become prevalent in later childhood. Sensitisation to allergens tends to follow a characteristic pattern (Halken 2004), with sensitisation to food allergens in the first two to three years of life, followed by indoor allergens (e.g. house dust mite, pets) and subsequently outdoor allergens (e.g. rye, timothy grass). The cumulative prevalence of allergic disease during childhood is high, with up to 7% to 8% developing a food allergy, 15% to 20% atopic eczema and 31% to 34% asthma or recurrent wheezing (Halken 2004). Of these, 7% to 10% will continue to have asthma symptoms beyond five years of age (Halken 2004). Food hypersensitivities affect approximately 6% of infants younger than three years, and prevalence decreases over the first decade (Osterballe 2005; Sampson 2004).
Allergy may be diagnosed by questionnaire or clinician assessment, and the diagnosis may be confirmed by specific skin or serological testing, or by allergen challenge. Diagnostic criteria for different allergic diseases are not uniform, and the mode of ascertainment of allergic disease is variable. Although tests of bronchial hyperresponsiveness, challenge tests and classical tests of IgE‐mediated allergy have an imperfect correlation with allergy symptoms and clinical signs (Darsow 2000; Peat 2000), they are associated with an increased likelihood of allergy and disease (Ronmark 2001; Sears 1998; Sly 1999; Strachan 1996). In addition, some evidence suggests that questionnaires, although compromised by selection and recall bias (Peat 2001), are suitable for allergy screening (Kilpelainen 2001; Ravault 2001). This review includes trials that diagnosed allergy by questionnaire or by clinician assessment, with or without confirmation by laboratory testing. Criteria for diagnosis of allergic disease should include typical symptoms and/or signs, with evidence of precipitants, persistence or recurrence typical of allergic disease, or with test evidence confirming atopy or bronchial hyperreactivity.
The World Allergy Organization 2003 consensus (Johansson 2004) recommended that the term 'hypersensitivity' should be used to describe objectively reproducible symptoms or signs initiated by exposure to a defined stimulus at a dose tolerated by normal persons. 'Allergy' is a hypersensitivity reaction initiated by specific immunological mechanisms. The term 'food allergy' is used when immunological mechanisms have been demonstrated. Food‐specific IgG antibodies in serum are not of clinical importance but merely indicate previous exposure to a specific food. If IgE is involved in the reaction, the term 'IgE‐mediated food allergy' is appropriate. Food hypersensitivity is diagnosed by resolution of typical symptoms with elimination from the diet, with confirmation by blinded challenge. Around 2% to 3% of babies develop hypersensitivity to a particular food. Principal symptoms among infants with proven cow's milk protein hypersensitivity (CMPH) are gastrointestinal (˜ 50%), dermatological (˜ 31%) and respiratory (˜ 19%) in nature (Host 1994; Host 1995; Schrander 1993). Two of every three infants with CMPH have a family history of atopy (Schrander 1993). CMPH is strongly associated with feeding of cow's milk formula (CMF) to infants during the first month of life (Host 1991). Many infants with CMPH become tolerant over time, with approximately 30% at one year, 50% at two years and 70% at three years tolerant to cow's milk challenge. The risk of persisting hypersensitivity is increased with evidence of atopy (Host 1995).
Description of the intervention
Measures to prevent allergy and food allergy have included maternal allergen avoidance during pregnancy (Custovic 2000; Custovic 2001; Kramer 2001; Zeiger 1989) and/or lactation (Custovic 2000; Custovic 2001; Zeiger 1989), periods of exclusive breast feeding (Custovic 2000; Custovic 2001; Gruskay 1982; Oddy 1999; Saarinen 1995; Saarinen 2000) and avoidance of potential allergens including food and environmental antigens during the first year of life and beyond (Custovic 2000). Formulas prescribed for infants with the intention of preventing allergy and food allergy include hydrolysed cow's milk and elemental formula, as well as soy or hydrolysed soy formula. These formulas may be produced from cow's milk or soy milk, may be derived predominantly from whey or casein proteins and may be partially or extensively hydrolysed. Protein modification is performed through a variety of physiochemical processes including ultraheating and enzymatic cleavage, most often with trypsin and chymotrypsin.
The American Academy of Pediatrics (AAP) recommends that hypoallergenic formulas should be tested in trials in which investigators examine human infants for toxicity and suitability to maintain a positive nitrogen balance, while attempting to predict whether infants allergic to cow’s milk will react adversely to these formulas (AAP 2000). These formulas are studied in infants with cow’s milk or cow’s milk‐based formula allergic reactions verified by double‐blind placebo‐controlled challenge (DBPCC) (Bock 1988). At a minimum, these tests should ensure with 95% confidence that 90% of infants with documented cow’s milk allergy respond to treatment and do not react during challenge (Kleinman 1991). Protein particle size does not appear to be a prerequisite for defining a formula as hypoallergenic, although amino acid‐based formulas and those with more extensive hydrolysis are less likely to produce reactions among infants with cow's milk allergy (Hill 2007). Although universal agreement has not been reached on the definition (Chaffen 2010; Host 1999), for the purposes of this review an extensively hydrolysed formula (EHF) will be regarded as one meeting the AAP definition for hypoallergenic formula (AAP 2000), and those with less extensive hydrolysis will be regarded as partially hydrolysed.
How the intervention might work
Infants' immune systems become sensitised or tolerant to allergens in the order in which they are exposed. Early life exposure to allergens occurs frequently through ingested protein, particularly cow's milk protein in formula (Muraro 2004). Amino acid‐based and extensively hydrolysed protein formulas are produced so as to substantially reduce the antigenicity of the protein and prevent sensitisation of infants to commonly ingested antigens, including cow's milk protein. However, low concentrations of food allergens, especially cow's milk proteins, are present in human milk. It has been suggested that the low incidence of cow's milk protein allergy among exclusively breast fed infants ‐ at 0.5% in unselected infants and 1.3% in high‐risk infants ‐ in prospective birth cohort studies was due to low‐level exposure‐induced tolerance rather than to disease (Halken 2004). It has been proposed that prolonged exposure to allergenic proteins or to proteins with reduced but not absent allergenicity may induce tolerance over time (Allen 2009). Although most infants with cow’s milk hypersensitivity exhibit this in the first year of life, more than 80% subsequently develop clinical tolerance (Katz 2011; Sampson 2004). The concern is that early avoidance of cow's milk protein may reduce the likelihood that infants will subsequently develop tolerance to the allergen (Katz 2010).
Why it is important to do this review
The aim of this review is to gather evidence on the use of hydrolysed formulas for prevention of allergy and food allergy. This review does not include treatment of infants with clinically recognised allergy or food allergy.
Objectives
To compare effects on allergy and food allergy when infants are fed a hydrolysed formula versus CMF or human breast milk. If hydrolysed formulas are effective, to determine what type of hydrolysed formula is most effective, including extensively or partially hydrolysed formula (EHF/PHF). To determine which infants at low or high risk of allergy and which infants receiving early, short‐term or prolonged formula feeding may benefit from hydrolysed formulas.
Methods
Criteria for considering studies for this review
Types of studies
We searched for randomised and quasi‐randomised trials that compared the use of a hydrolysed formula versus human milk or cow's milk formula. Randomised and quasi‐randomised (e.g. using alternation) trials with ≥ 80% follow‐up of participants were eligible for inclusion.
Types of participants
Infants in the first six months of life without clinical evidence of allergy.
Types of interventions
Hydrolysed formulas included:
-
hydrolysed cow's milk and soy formulas; and
-
extensively and partially hydrolysed formulas.
Hydrolysed formulas may be used for:
-
early, short‐term supplementary or sole formula feeding of infants unable to be exclusively breast fed in the first days of life;
-
prolonged supplementation of breast fed infants or infants fed solely with formula in the first months of life; and
-
weaning from the breast with infant formula.
The control group may include infants who receive:
-
exclusive human milk (breast fed or expressed); and
-
cow's milk formula.
Study authors had to prespecify the following comparisons.
-
Early short‐term hydrolysed formula versus human milk.
-
Prolonged use of a hydrolysed formula versus human milk.
-
Early short‐term hydrolysed formula versus cow's milk formula.
-
Prolonged use of a hydrolysed formula versus cow's milk formula.
Prespecified subgroup analyses included the following (see Methods for definitions).
-
Infant risk of allergy or food allergy.
-
-
Low‐risk infants (no family history of allergy or food allergy among first‐degree relatives).
-
High‐risk infants (family history of allergy or food allergy among first‐degree relatives or high cord IgE level).
-
-
Extent of protein hydrolysis.
-
-
Extensively hydrolysed formula versus cow's milk formula.
-
Partially hydrolysed formula versus cow's milk formula.
-
Extensively hydrolysed formula versus partially hydrolysed formula.
-
-
Indication for use.
-
-
Prolonged sole formula feeding.
-
Supplemental feeding or weaning from the breast using infant formula.
-
-
Method of ascertainment of allergy.
-
-
Allergy/Food allergy confirmed by test.
-
Blinded measurement for allergy or food allergy.
-
-
Type of protein hydrolysate used.
-
-
Partially hydrolysed whey formula versus cow's milk formula.
-
Partially hydrolysed casein formula versus cow's milk formula.
-
Extensively hydrolysed whey formula versus cow's milk formula.
-
Extensively hydrolysed casein formula versus cow's milk formula.
-
Hydrolysed soy formula versus cow's milk formula.
-
We excluded studies that included other allergy prevention interventions (e.g. maternal dietary avoidance measures, environmental allergy reduction measures) in the treatment group and not in the control group. Studies that provided other allergy prevention interventions for both treatment and control groups were eligible.
Types of outcome measures
Primary outcomes
-
All allergies, including asthma, atopic dermatitis, allergic rhinitis and food allergy
Secondary outcomes
-
Asthma
-
Atopic dermatitis/Eczema
-
Allergic rhinitis
-
Cow's milk or soy protein allergy
-
Food allergy
-
Urticaria
-
Anaphylaxis
In the 2013 review update, we no longer reported previously reported food hypersensitivity and potential harms, including growth parameters, cost and infant feed refusal.
Researchers may have diagnosed a specific allergy on the basis of:
-
history of recurrent and persistent symptoms typical of the allergy;
-
clinician diagnosis of allergy; or
-
clinical allergy confirmed by testing including detection of allergen sensitisation by skin testing or by serological testing for specific IgE (e.g. radio‐allergosorbent (RAST), enzyme‐allergosorbent (EAST)), or asthma confirmed by respiratory function testing for the presence of bronchial hyperresponsiveness confirmed by elimination/challenge.
Investigators used the following definitions of age of allergy.
-
Infant allergy incidence: allergy occurring up to two years of age.
-
Childhood allergy incidence: allergy occurring up to 10 years of age (or up to age of latest report between two and 10 years).
-
Childhood allergy prevalence: reported allergy that was present between two and 10 years of age.
-
Adolescent allergy: allergy present from 10 to 18 years of age.
-
Adult allergy: allergy present after 18 years of age.
Search methods for identification of studies
Electronic searches
See the Collaborative Review Group search strategy.
2016 update: We performed an updated search of the Cochrane Central Register of Controlled Trials (CENTRAL; August 2016), MEDLINE (1948 to August 2016) and Embase (1974 to August 2016). We also searched citations of authors of included studies and citation lists of articles and reviews.
We documented the search strategies in Appendix 1,Appendix 2 and Appendix 3.
Searching other resources
We performed a search of previous reviews including cross references (all articles referenced), abstracts, conferences (Pediatric Academic Societies 2003 to 2016; Perinatal Society of Australia and New Zealand 2003 to 2016), recent review citations and expert informants.
We also updated in August 2016 our search of clinical trials registries for ongoing or recently completed trials (clinicaltrials.gov; controlled‐trials.com; who.int/ictrp).
Data collection and analysis
This review updates previous versions (Osborn 2003; Osborn 2006).
Each review author independently assessed eligibility of studies for inclusion. We included only studies with ≥ 80% reporting of randomised infants. We used the criteria and standard methods of the Cochrane Neonatal Review Group to assess the methodological quality of included trials regarding adequacy of randomisation and allocation concealment, blinding of parents or caregivers and assessors to intervention and completeness of assessment of all randomised individuals. We used a data collection form to aid extraction of relevant information and data from each included study. Each review author extracted the data separately, and review authors compared data and resolved differences by consensus. We used the standard methods of the Cochrane Neonatal Review Group to synthesise the data and expressed effects as risk ratio (RR), risk difference (RD) and 95% confidence intervals (CIs) for categorical data, and as mean difference (MD) and 95% CIs for continuous data. We used the Chi² test to examine data for heterogeneity, and we quantified heterogeneity using the I² statistic. We used the fixed‐effect model for meta‐analysis when enrolled infants and interventions were similar and no significant heterogeneity was found. We explored sources of heterogeneity by performing subgroup analysis.
The term 'hydrolysed formula' used without a reference to type refers to both extensively and partially hydrolysed formulas. We did not pool studies that used hydrolysed formula for early (first few days of life) supplemental or sole infant feeding with studies that used hydrolysed formula for prolonged feeding. We performed all comparisons by including only studies with no different co‐interventions prescribed for prevention of allergy in either study arm (e.g. in treatment group but not in control group). Allergy‐preventing co‐interventions included modifications to mother's diet when pregnant or breast feeding and environmental modifications such as avoidance of pet hair and host dust mite reduction measures. The protocol did not originally prespecify that we should restrict analyses to studies with no differential co‐interventions.
Selection of studies
We included all randomised and quasi‐randomised controlled trials fulfilling the selection criteria described in the previous section. Each review author reviewed the search results and separately selected studies for inclusion. Review authors resolved disagreements by discussion.
Data extraction and management
Each review author extracted the data separately. Review authors compared data and resolved differences by consensus.
We obtained additional method details and data from the authors of two studies (Hill 2000; von Berg 2003). For one study (Lam 1992), we extracted methods and data from a thesis.
For the 2013 update, we performed all analyses using Review Manager software (RevMan 2011).
Assessment of risk of bias in included studies
We used the criteria and standard methods of the Cochrane Neonatal Review Group to assess the methodological quality of included trials. We evaluated the quality of included trials in terms of adequacy of randomisation and allocation concealment, blinding of parents or caregivers and assessors to intervention and completeness of assessment in all randomised individuals.
For the 2016 update, we incorporated previous assessments into RevMan 5 'Risk of bias' tables. We assessed risk of bias for each study using the criteria outlined in the Cochrane Handbook for Systematic Reviews of Interventions (Higgins 2011) by examining the following.
Sequence generation (checking for possible selection bias)
-
Adequate (any truly random process, e.g. random number table; computer random number generator)
-
Inadequate (any non‐random process, e.g. odd or even date of birth; hospital or clinic record number)
-
Unclear
Allocation concealment (checking for possible selection bias)
-
Adequate (e.g. telephone or central randomisation; consecutively numbered sealed opaque envelopes)
-
Inadequate (open random allocation; unsealed or non‐opaque envelopes, alternation; date of birth)
-
Unclear
Blinding (checking for possible performance bias)
-
Adequate, inadequate or unclear for participants
-
Adequate, inadequate or unclear for personnel
-
Adequate, inadequate or unclear for outcome assessors
Incomplete outcome data (checking for possible attrition bias through withdrawals, dropouts, protocol deviations)
-
Adequate (< 20% missing data)
-
Inadequate
-
Unclear
Selective reporting bias
-
Adequate (when it is clear that all of the study’s prespecified outcomes and all expected outcomes of interest to the review have been reported)
-
Inadequate (when not all of the study’s prespecified outcomes have been reported; one or more reported primary outcomes were not prespecified; outcomes of interest were reported incompletely and so cannot be used; study failed to include results of a key outcome that would have been expected to have been reported)
-
Unclear
Other sources of bias
We assessed the possibility of other sources of bias (e.g. early termination of trial due to data‐dependent process, extreme baseline imbalance) as follows.
-
Yes.
-
No.
-
Unclear.
Overall risk of bias
We made explicit judgements about whether studies were at high risk of bias, according to the criteria given in the Cochrane Handbook for Systematic Reviews of Interventions (Higgins 2011). With reference to the criteria above, we assessed the likely magnitude and direction of bias, and whether it was likely to have an impact on study findings. We explored the impact of the level of bias by undertaking sensitivity analyses (see Sensitivity analysis section).
Measures of treatment effect
We used the standard methods of the Cochrane Neonatal Review Group to synthesise data and expressed effects as risk ratio (RR) and risk difference (RD) with 95% confidence intervals (CIs) for categorical data, and as mean difference (MD) with 95% CIs for continuous data.
Unit of analysis issues
The unit of analysis was the individual participant (infant).
Dealing with missing data
We recorded missing data in 'Risk of bias' tables and assessed the effect of missing data by performing sensitivity analysis.
We performed all analyses by 'intention to treat' when data were available. When intention‐to‐treat data were not available, we reported data as infants assessed by group of assignment as well as losses after randomisation.
Assessment of heterogeneity
We used the two formal statistics described here.
-
Chi2 test: to assess whether observed variability in effect sizes between studies is greater than would be expected by chance. This test has low power when the number of studies included in the meta‐analysis is small, so we planned to set the probability at the 10% level of significance.
-
I2 statistic: to ensure that pooling of data is valid. We planned to grade the degree of heterogeneity as follows: 0% to 30%: might not be important; 31% to 50%: moderate heterogeneity; 51% to 75%: substantial heterogeneity; 76% to 100%: considerable heterogeneity.
When we found evidence of apparent or statistical heterogeneity, we planned to assess the source of the heterogeneity by conducting sensitivity and subgroup analyses to look for evidence of bias or methodological differences between trials.
Assessment of reporting biases
We documented in the Characteristics of excluded studies table all studies that reported use of a prebiotic in a potentially eligible infant population but did not report allergy‐related outcomes. We assessed reporting and publication bias by examining the degree of asymmetry of a funnel plot.
Data synthesis
We used the fixed‐effect model and Mantel‐Haenszel methods for meta‐analysis.
Quality of evidence
We used the Grading of Recommendations Assessment, Development and Evaluation (GRADE) approach, as outlined in the GRADE Handbook (Schünemann 2013), to assess the quality of evidence for the following (clinically relevant) outcomes: all allergy; specific allergies including asthma, atopic dermatitis/eczema, allergic rhinitis, cow's milk or soy protein allergy, food allergy, urticarial allergy and anaphylaxis.
Two review authors independently assessed the quality of the evidence for each of the outcomes above. We considered evidence from randomised controlled trials as high quality but downgraded the evidence one level for serious (and two levels for very serious) limitations on the basis of the following: design (risk of bias), consistency across studies, directness of evidence, precision of estimates and presence of publication bias. We used the GRADEpro Guideline Development Tool to create a ‘Summary of findings’ table to report the quality of the evidence.
The GRADE approach yields an assessment of the quality of a body of evidence by one of four grades.
-
High: We are very confident that the true effect lies close to the estimate of effect.
-
Moderate: We are moderately confident in the effect estimate: The true effect is likely to be close to the estimate of effect but may be substantially different.
-
Low: Our confidence in the effect estimate is limited: The true effect may be substantially different from the estimate of effect.
-
Very low: We have very little confidence in the effect estimate: The true effect is likely to be substantially different from the estimate of effect.
Subgroup analysis and investigation of heterogeneity
We performed subgroup analyses according to the following.
-
Infant risk of allergy or food allergy: low‐risk infants (no family history of allergy or food allergy in first‐degree relatives); high‐risk infants (family history of allergy or food allergy in first‐degree relatives or high cord blood IgE level).
-
Extent of protein hydrolysis: EHF versus CMF; PHF versus CMF; EHF versus PHF. An EHF should meet the definition provided by the AAP Committee on Nutrition (AAP 2000) ‐ extensively hydrolysed proteins derived from cow's milk in which most of the nitrogen is present in the form of free amino acids and peptides ≤ 1500 kDaltons ‐ and should, at a minimum, ensure with 95% confidence that 90% of infants with documented CMA will not react with defined symptoms to the formula under double‐blind, placebo‐controlled conditions.
-
Indication for use: prolonged sole formula feeding; supplemental formula feeding; weaning from the breast with infant formula.
-
Method of ascertainment of allergy or food allergy: clinical allergy confirmed by challenge testing or by testing for atopy (e.g. skin testing or serological testing for specific IgE, asthma confirmed by testing for presence of bronchial hyperresponsiveness, food allergy confirmed by elimination/challenge). Included in this definition is clinical allergy in a patient for whom atopy has been confirmed by testing (e.g. asthma when atopy has been confirmed by skin prick testing or RAST for specific IgE); blinded measurement for allergy or food allergy ‐ when measurement of outcome was blinded to treatment allocation (this analysis was not prespecified).
-
Type of protein hydrolysate used: partially hydrolysed whey formula versus CMF; partially hydrolysed casein formula versus CMF; extensively hydrolysed whey formula versus CMF; extensively hydrolysed casein formula versus CMF; hydrolysed soy formula versus CMF.
Sensitivity analysis
We prespecified a sensitivity analysis to determine whether review findings were affected by including only studies at low risk of bias, defined as those with adequate randomisation and allocation concealment and < 10% loss to follow‐up.
Results
Description of studies
Results of the search
We performed searches on 22 January 2016 (see Figure 1 for study flow diagram). We searched MEDLINE using OVID and retrieved 198 reports (Appendix 1); CENTRAL and retrieved 242 reports (Appendix 2); and Embase and retrieved 199 reports (Appendix 3). We identified eight ongoing or unpublished studies (Baldassarre 2013; Barber 2009; Del Moral 2010; Knip 2012; Mennella 2012; Sorensen 2010; Vivatvakin 2009; Yin 2015) (see Appendix 3 and Appendix 4). We updated the search on 30 August 2016 and found one additional excluded study (Boyle 2016) and an additional 15‐year follow‐up report from a previously included study (von Berg 2003).

Study flow diagram: review update.
Included studies
We assessed 17 studies as eligible for inclusion ‐ see Characteristics of included studies table. The 2016 search revealed two additional studies that we assessed as included studies (Kwinta 2009; Sorensen 2007). We found an additional publication (Hill 2000) of a study that we had previously assessed as an excluded study as it had reported a per‐protocol analysis with excess losses. We combined a new report of an 'intention‐to‐treat' analysis with trial data obtained from study authors and have now assessed this trial as an included study. Sorensen 2007 (n = 242) has not reported extractable data to date that can be included in a meta‐analysis. This study compared a CMF versus a PHF versus an EHF in infants at high risk of allergy and is not included in the risk of bias assessment and analyses. Data from sequential publications of the GINI study (von Berg 2003) beyond three years remain ineligible for inclusion in this review owing to excess losses to follow‐up. As no new data have been made available, we have moved to the excluded studies list four previously included studies (Maggio 2005; Picaud 2001; Szajewska 2001; Vandenplas 1993) that provided no outcome data for the previous version (Osborn 2006).
Types of infants enrolled
-
High risk of allergy: A total of 14 studies (Chirico 1997; de Seta 1994; Halken 2000; Hill 2000; Lam 1992; Mallet 1992; Marini 1996; Nentwich 2001; Oldaeus 1997; Sorensen 2007; Tsai 1991; Vandenplas 1992; von Berg 2003; Willems 1993) enrolled infants at high risk of allergy on the basis of a history of allergy in a first‐degree relative and/or a high cord IgE level, although Lam 1992 did not report 'high risk' criteria.
-
Risk of allergy not specified: Three studies did not enrol infants on the basis of risk of allergy: Juvonen 1996 enrolled healthy term infants, although 62% had a family history of allergy; Kwinta 2009 enrolled very low birth weight infants (≤ 1500 g); and Saarinen 1999 enrolled healthy term infants requiring supplemental feeding in hospital.
-
Low risk of allergy: No study reporting allergy outcomes enrolled infants at low risk of allergy.
Types of interventions
See Characteristics of included studies for types of formula used in each study.
Early short‐term feeding: hydrolysed formula versus human milk feeding ‐ low‐risk infants
Two studies (Juvonen 1996; Saarinen 1999) compared a hydrolysed formula versus pasteurised donor human milk used for early short‐term infant feeding. Juvonen 1996 gave sole bottle feeds for three days, then all infants were exclusively breast fed. Saarinen 1999 gave supplemental feeds when required while infants were in hospital (average four days). Mothers were then encouraged to breast feed.
Early short‐term feeding: hydrolysed formula versus cow's milk formula ‐ low‐risk infants
Two studies (Juvonen 1996; Saarinen 1999) compared a hydrolysed formula versus CMF for early short‐term infant feeding. Juvonen 1996 gave sole bottle feeds for three days, then all infants were exclusively breast fed. Saarinen 1999 gave supplemental feeds when required while infants were in hospital (average four days). Mothers were then encouraged to breast feed.
Prolonged feeding: hydrolysed formula versus human milk feeding
We found no studies for this comparison.
Prolonged feeding: hydrolysed formula versus cow's milk formula
Thirteen studies compared prolonged supplemental or sole feeding with a hydrolysed formula versus CMF without differential co‐interventions (Chirico 1997; de Seta 1994; Hill 2000; Kwinta 2009; Lam 1992; Mallet 1992; Marini 1996; Oldaeus 1997; Sorensen 2007; Tsai 1991; Vandenplas 1992; von Berg 2003; Willems 1993). Three studies (Chirico 1997; Marini 1996; Oldaeus 1997) reported additional allergy avoidance measures in both hydrolysed formula and CMF groups.
Prolonged feeding: hydrolysed formula versus cow's milk formula ‐ low‐risk infants
Kwinta 2009 compared prolonged feeding with a hydrolysed formula versus CMF in low‐risk infants.
Prolonged feeding: hydrolysed formula versus cow's milk formula ‐ high‐risk infants
Twelve studies (Chirico 1997; de Seta 1994; Hill 2000; Lam 1992; Mallet 1992; Marini 1996; Oldaeus 1997; Sorensen 2007; Tsai 1991; Vandenplas 1992; von Berg 2003; Willems 1993) compared prolonged feeding with a hydrolysed formula versus CMF in high‐risk infants.
Prolonged feeding: partially hydrolysed formula versus cow's milk formula
Twelve studies (Chirico 1997; de Seta 1994; Kwinta 2009; Hill 2000; Lam 1992; Marini 1996; Oldaeus 1997; Sorensen 2007; Tsai 1991; Vandenplas 1992; von Berg 2003; Willems 1993) compared prolonged feeding with a PHF versus CMF.
Prolonged feeding: extensively hydrolysed formula versus cow's milk formula
Five studies (Kwinta 2009; Mallet 1992; Oldaeus 1997; Sorensen 2007; von Berg 2003) compared prolonged feeding with an EHF versus CMF.
Prolonged feeding: extensively hydrolysed formula versus partially hydrolysed formula
Five studies (Halken 2000; Nentwich 2001; Oldaeus 1997; Sorensen 2007; von Berg 2003) compared prolonged feeding with an EHF versus a PHF.
Prolonged exclusive feeding: hydrolysed formula versus cow's milk formula
Seven studies reported prolonged exclusive hydrolysed formula versus CMF (Chirico 1997; de Seta 1994; Kwinta 2009; Lam 1992; Marini 1996; Vandenplas 1992; Willems 1993). It is unclear whether the period of formula feeding was exclusive for one study (Sorensen 2007).
Prolonged feeding: hydrolysed formula versus cow's milk formula ‐ studies with blinded measurement
Four studies assessed allergy without knowledge of participant allocation (Kwinta 2009; Oldaeus 1997; Vandenplas 1992; von Berg 2003).
Prolonged feeding: hydrolysed formula versus cow's milk formula ‐ studies at low risk of bias
We assessed no studies as eligible for inclusion in the sensitivity analysis of adequate study methods (adequate randomisation, allocation concealment and < 10% losses to follow‐up).
Prolonged feeding: partially hydrolysed whey formula versus cow's milk formula
Ten studies (Chirico 1997; de Seta 1994; Hill 2000; Lam 1992; Marini 1996; Sorensen 2007; Tsai 1991; Vandenplas 1992; von Berg 2003; Willems 1993) compared a partially hydrolysed whey formula versus CMF.
Prolonged feeding: partially hydrolysed casein‐containing formula versus cow's milk formula
Two studies (Kwinta 2009; Oldaeus 1997) compared a PHF containing casein versus CMF.
Prolonged feeding: extensively hydrolysed whey formula versus cow's milk formula
Two studies (Sorensen 2007; von Berg 2003) compared an extensively hydrolysed whey formula versus CMF.
Prolonged feeding: extensively hydrolysed casein formula versus extensively hydrolysed whey formula
Two studies (Halken 2000; von Berg 2003) compared an extensively hydrolysed casein formula versus CMF.
No study compared a hydrolysed soy formula versus CMF. No study compared a hydrolysed soy formula versus hydrolysed CMF.
Types of outcomes
Definitions for allergy varied between studies but usually required persistent or recurring symptoms and signs in the absence of another obvious clinical explanation. For definitions of 'any allergy' and type of allergy for each study, see Characteristics of included studies.
Sorensen 2007 has not reported extractable data to date that can be included in a meta‐analysis. This study enrolled infants at high risk of allergy.
Studies (with timing) reporting clinician‐diagnosed allergy included Chirico 1997 (six months); de Seta 1994 (six and 24 months); Halken 2000 (six, 12 and 18 months); Hill 2000 (two and six to seven years); Juvonen 1996 (three years); Kwinta 2009 (five to seven years); Lam 1992 (six months); Mallet 1992 (one, two and four years); Marini 1996 (six months, one and three years); Nentwich 2001 (six and 12 months); Oldaeus 1997 (nurse examination at three, six, nine, 12 and 18 months and doctor visit at 18 months); Saarinen 1999 (mean age at follow‐up of 27 months, range 18 to 34 months); Sorensen 2007 (12 months); Tsai 1991 (one, two, four, six and 12 months); Vandenplas 1992 (12 months); and von Berg 2003 (12 months and three, six and 10 years ‐ note excess losses from three years of age).
Three studies reported using questionnaire‐diagnosed allergy: Hill 2000 (six to seven years); Kwinta 2009 (five to seven years); and Willems 1993 (three months and one year).
Seven studies reported specific food allergy (Halken 2000; Hill 2000; Juvonen 1996; Oldaeus 1997; Saarinen 1999; Vandenplas 1992; von Berg 2003).
Excluded studies
We excluded 79 studies and documented reasons for exclusion in the Characteristics of excluded studies table. Here, we document controlled trials of hydrolysed formula according to types of participants and reasons for exclusion.
Preterm or low birth weight infants
Agosti 2003 did not report allergy; Florendo 2009 did not report allergy; Maggio 2005 did not report allergy; Mihatsch 1999 (cross‐over trial) did not report allergy; Mihatsch 2002 (excess losses) did not report allergy; Pauls 1996 did not report allergy (abstract format only); Picaud 2001 did not report allergy; Raupp 1995 did not report allergy; Riezzo 2001 did not report allergy; Szajewska 2001 did not report allergy; and Yu 2014 (likely non‐random, cross‐over) did not report allergy.
Term healthy infants
Akimoto 1993 reported allergy (non‐random); Berseth 2009 (multiple formula differences) did not report allergy; Borschel 2013 did not report allergy; Borschel 2014 (multiple formula differences) did not report allergy; Borschel 2014a (multiple formula differences) did not report allergy; Burks 2008 (excess losses) did not report allergy; de Jong 1998 used protein‐free formula; Decsi 1992 did not report allergy; Decsi 1998 did not report allergy; Exl 1998 reported allergy (non‐random); Fukushima 1997 reported allergy (excess losses); Hartman 1994 reported intolerance not allergy and reported unclear losses (abstract format only); Hernell 2003 (unclear allocation) did not report allergy; Keller 1996 (unclear allocation) reported allergy; Lasekan 2006 did not report allergy; Medjad‐Guillou 1992 (cross‐over trial) did not report allergy; Mennella 2011a did not report allergy; Moran 1992 reported excess losses; Paronen 2000 enrolled infants at risk of diabetes and did not report allergy; Rigo 1994a (unclear allocation) did not report allergy; Rigo 1994b (unclear allocation) did not report allergy; Scalabrin 2009 (excess losses) reported adverse events including allergy; Schmelzle 2003 (excess losses) did not report allergy; Schmitz 1992 did not report allergy (excess losses); Schrander 1993 was observational; Silva Rey 1996 (unclear allocation; excess losses) reported in a thesis only; Staelens 2008 did not report allergy; Tariq 1998 was observational; Vaarala 1995 did not report allergy; Vaarala 2012 (enrolled infants at risk of diabetes) did not report allergy; and Vandenplas 1993 did not report allergy.
Term infants at high risk of allergy
Arshad 1992a reported multiple differential allergy‐reducing co‐interventions; Barberi 1993 reported unclear allocation, excess losses and allergy (abstract format only); Bergmann 1996a reported allergy and non‐random allocation; Boyle 2016 reported multiple differential allergy‐reducing co‐interventions ‐ prebiotic and hydrolysed formulas ‐ and reported allergy; Chan 2002 reported allergy and excess losses; Chan‐Yeung 2000 reported multiple differential allergy‐reducing co‐interventions; Chandra 1989a reported data that could not be verified after allegations of fraud; Chandra 1989b reported data that could not be verified after allegations of fraud; D'Agata 1996 reported unclear allocation, imbalances between groups and allergy; Giovannini 1994 reported excess losses and did not report allergy; Halken 1992 reported allergy and excess losses; Kuo 2011 was observational; Iikura 1995 reported unclear allocation and imbalances between groups (abstract format only); Martinez‐Valverde reported unclear allocation in a thesis only; Moran 1992 reported excess losses and allergy; Nentwich 2003 was observational; Odelram 1996 reported excess losses and allergy; Porch 1998 reported excess losses; Shao 2006 reported multiple differential allergy‐reducing co‐interventions; Szajewska 2004 reported excess losses and allergy; TRIGR study 2011 did not report allergy; Vandenplas 1988 reported unclear allocation and losses; Wopereis 2014 did not report allergy to date (abstract format only); and Zeiger 1989 reported multiple co‐interventions and excess losses.
Infants with infantile colic, gastro‐oesophageal reflux symptoms or feed intolerance
Arikan 2008 did not report allergy; Campbell 1989 did not report allergy (non‐random); Corvaglia 2013 did not report allergy; Corvaglia 2013a did not report allergy; Hill 1995b did not report allergy; Lucassen 2000 did not report allergy; Nocerino 2012 did not report allergy (abstract format only); Savino 2003 was observational; Savino 2006 reported multiple formula differences; Taubman 1988 did not report allergy; and Zeiger 1989 reported allergy and excess losses.
Risk of bias in included studies
We have summarised risk of bias in included studies in Figure 2; and Figure 3. Overall, we considered no studies to be at 'low risk' of bias.

Risk of bias graph: review authors' judgements about each risk of bias item presented as percentages across all included studies.
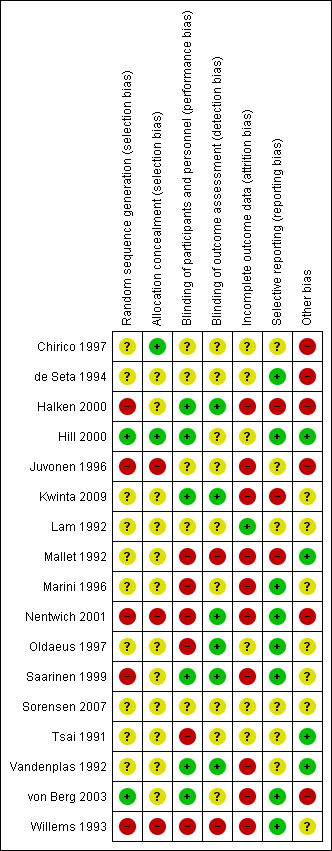
Risk of bias summary: review authors' judgements about each risk of bias item for each included study.
Allocation
Randomisation
Two studies reported an adequate method of randomisation (Hill 2000; von Berg 2003). Ten studies reported random allocation of infants but not the method of randomisation used (Chirico 1997; de Seta 1994; Lam 1992; Mallet 1992; Marini 1996; Oldaeus 1997; Tsai 1991; Vandenplas 1992), so we assessed their risk as 'unclear'. Five studies reported quasi‐random methods of participant allocation, including Halken 2000 (by date of birth), Juvonen 1996 (by day of month), Nentwich 2001 (odd and even numbers), Saarinen 1999 and Willems 1993 (month of birth), so we assessed them as having 'high risk'.
Allocation concealment
We assessed three studies as having 'low risk' of allocation concealment (Chirico 1997; Hill 2000; Tsai 1991) and 10 studies as having 'unclear' risk, including de Seta 1994 (did not report method of allocation), Halken 2000 (used quasi‐random allocation method but blinded intervention), Kwinta 2009 (used unclear allocation method), Lam 1992 (did not report method), Mallet 1992 (did not report method), Marini 1996 (did not report method), Oldaeus 1997 (did not report method), Saarinen 1999 (used quasi‐random allocation method but blinded intervention), von Berg 2003 (did not report method) and Vandenplas 1992 (used unclear allocation method). We assessed three studies as having 'high risk' for allocation concealment ‐ Juvonen 1996 (quasi‐random allocation, unblinded study), Nentwich 2001 (quasi‐random allocation, unblinded prescribing) and Willems 1993 (quasi‐random allocation, unblinded study).
Blinding
Six studies reported blinding of participants and personnel (Halken 2000; Hill 2000; Kwinta 2009; Saarinen 1999; Vandenplas 1992; von Berg 2003); we assessed four studies as having 'unclear' risk, as they did not report details (Chirico 1997; de Seta 1994; Juvonen 1996; Lam 1992) and six studies as unblinded (Mallet 1992; Marini 1996; Nentwich 2001; Oldaeus 1997; Tsai 1991; Willems 1993).
Six studies reported blinding of measurement (Halken 2000; Kwinta 2009; Nentwich 2001; Oldaeus 1997; Saarinen 1999; Vandenplas 1992). Eight studies did not report blinding of measurement of clinical allergy (Chirico 1997; de Seta 1994; Hill 2000; Juvonen 1996; Lam 1992; Marini 1996; Tsai 1991; von Berg 2003). Mallet 1992 and Willems 1993 performed unblinded measurements.
Incomplete outcome data
Studies reported losses to follow‐up. We included in this review only studies with < 20% loss to follow‐up. Studies reported the following losses to follow‐up: Chirico 1997 ‐ unclear; de Seta 1994 ‐ none reported; Halken 2000 ‐ 20% at 18 months; Hill 2000 ‐ 7.3% at two years and 20% at six to seven years; Juvonen 1996 ‐ 10% at three years; Kwinta 2009 ‐ 16% at five to seven years; Lam 1992 ‐ 8% at six months; Mallet 1992 ‐ 5% to 8% at four months but > 20% at one to four years; Marini 1996 ‐ 13% at two years and 19% at three years; Nentwich 2001 ‐ 19% at 12 months; Oldaeus 1997 ‐ 9% at 18 months; Saarinen 1999 ‐ unclear, although all infants were reported to be seen routinely in well baby clinics; Tsai 1991 ‐ 9% at 12 months; Vandenplas 1992 ‐ 11% at 12 months and > 20% at three and five years; von Berg 2003 ‐ for infants born in Wesel: 14.5% at one year and 19% at three years (all other analyses and time points > 20%); and Willems 1993 ‐ 13% at one year.
Studies with < 10% loss to follow‐up included de Seta 1994 ‐ none reported, Hill 2000 ‐ 7.3% at two years, Lam 1992 ‐ 8% at six months, Mallet 1992 ‐ 5% to 8% at four months, Oldaeus 1997 ‐ 9% at 18 months and Tsai 1991 ‐ 9% at 12 months.
Selective reporting
Eight studies were at 'low risk' of reporting bias with prespecified primary outcomes reported (de Seta 1994; Hill 2000; Marini 1996; Nentwich 2001; Oldaeus 1997; Saarinen 1999; von Berg 2003; Willems 1993). We assessed five studies as having 'unclear' risk of reporting bias (Chirico 1997; Juvonen 1996; Lam 1992; Tsai 1991; Vandenplas 1992) and three as having 'high risk' (Halken 2000; Kwinta 2009; Mallet 1992).
Other potential sources of bias
Six studies had imbalances between groups after randomisation, so we considered them to be at 'high risk' of bias (Chirico 1997; de Seta 1994; Halken 2000; Juvonen 1996; Nentwich 2001; von Berg 2003). Six studies did not report sufficient details of baseline characteristics or described differences of 'unclear' importance (Kwinta 2009; Lam 1992; Marini 1996; Oldaeus 1997; Saarinen 1999; Willems 1993). We considered four studies to have well‐balanced groups after randomisation with no other identified source of bias (Hill 2000; Mallet 1992; Tsai 1991; Vandenplas 1992).
We assessed no studies as having 'low risk' of bias overall ('low risk' of selection bias, performance and measurement bias and attrition bias with < 10% loss to follow‐up).
Effects of interventions
See: Summary of findings for the main comparison Early short‐term feeding: hydrolysed formula versus human milk feeding ‐ low‐risk infants for prevention of allergic disease and food allergy; Summary of findings 2 Early short‐term feeding: hydrolysed formula versus cow's milk formula ‐ low‐risk infants for prevention of allergic disease and food allergy; Summary of findings 3 Prolonged feeding: hydrolysed formula versus cow's milk formula for prevention of allergic disease and food allergy
Analyses
Comparison 1. Early short‐term feeding: hydrolysed formula versus human milk feeding ‐ low‐risk infants
We included two studies (Juvonen 1996; Saarinen 1999) that compared a short duration (three to four days whilst in hospital) of early supplemental or sole hydrolysed formula versus donor human milk feeds in infants who were subsequently encouraged to breast feed.
Juvonen 1996 (90 infants) reported no difference in childhood incidence of allergy (risk ratio (RR) 1.43, 95% confidence interval (CI) 0.38 to 5.37) and asthma (RR 0.48, 95% CI 0.05 to 4.41) and no difference in eczema (RR 0.48, 95% CI 0.05 to 4.41), no difference in food allergy (RR 1.43, 95% CI 0.38 to 5.37) and no difference in CMA (RR 7.11, 95% CI 0.35 to 143.84) at three years. Saarinen 1999 reported no difference in childhood incidence of CMA (3559 infants; RR 0.87, 95% CI 0.52 to 1.46) up to a mean age of 27 months.
We considered the following subgroup analyses, but as no significant benefits were reported, we did not wish to duplicate the results.
-
Both studies enrolled infants irrespective of family history of allergy or food allergy in first‐degree relatives.
-
Extent of protein hydrolysis: Juvonen 1996 and Saarinen 1999 compared an EHF versus pasteurised donor human milk.
-
Indication for use: Both studies used formula for early short‐term infant formula feeding.
-
Method of ascertainment of allergy: Saarinen 1999 reported outcomes of an unblinded elimination/challenge for CMA. Juvonen 1996 did not report criteria for diagnosis of allergy.
-
Type of protein hydrolysate used: Juvonen 1996 compared an extensively hydrolysed casein formula versus pasteurised donor human milk. Saarinen 1999 compared an extensively hydrolysed whey formula versus pasteurised donor human milk.
Sensitivity analysis
We considered neither study to be at 'low risk' of bias.
Comparison 2. Early short‐term feeding: hydrolysed formula versus cow's milk formula ‐ low‐risk infants
Two studies (Juvonen 1996; Saarinen 1999) compared a short duration (three to four days whilst in hospital) of early supplemental or sole feeding with a hydrolysed formula versus CMF. Both trials subsequently encouraged all mothers to breast feed.
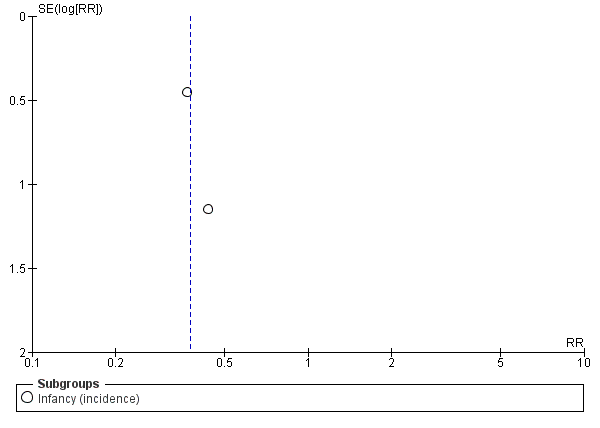
Juvonen 1996 (77 infants) reported no difference in childhood allergy incidence (RR 1.37, 95% CI 0.33 to 5.71), no difference in childhood asthma incidence (RR 3.08, 95% CI 0.13 to 73.26), no difference in childhood eczema incidence (RR 0.34, 95% CI 0.04 to 3.15), no difference in childhood food allergy (RR 1.37, 95% CI 0.33 to 5.71) and no difference in childhood CMA (RR 5.13, 95% CI 0.25 to 103.43). Saarinen 1999 reported a reduction in infant CMA incidence of borderline significance (3478 infants; RR 0.62, 95% CI 0.38 to 1.00; risk difference (RD) ‐0.01, 95% CI ‐0.02 to 0.00; P = 0.05).
We considered the following subgroup analyses, but as no significant benefits were reported, we did not wish to duplicate the results.
-
Both studies enrolled infants irrespective of family history allergy or food allergy in first‐degree relatives.
-
Extent of protein hydrolysis: Juvonen 1996 and Saarinen 1999 compared an EHF versus CMF.
-
Indication for use: Both studies used formula for early short‐term infant formula feeding.
-
Method of ascertainment of allergy: Saarinen 1999 reported outcomes of an unblinded elimination/challenge for CMA. Juvonen 1996 did not report criteria for diagnosis of allergy.
-
Type of protein hydrolysate used: Juvonen 1996 compared an extensively hydrolysed casein formula versus CMF. Saarinen 1999 compared an extensively hydrolysed whey formula versus CMF.
Sensitivity analysis
We considered neither study to use adequate methods.
Comparison 3. Prolonged feeding: hydrolysed formula versus human milk feeding
We found no study that compared prolonged feeding with hydrolysed formula versus human milk feeding.
Comparison 4. Prolonged feeding: hydrolysed formula versus cow's milk formula
Twelve studies (Chirico 1997; de Seta 1994; Hill 2000; Kwinta 2009; Lam 1992; Mallet 1992; Marini 1996; Oldaeus 1997; Tsai 1991; Vandenplas 1992; von Berg 2003; Willems 1993) reported outcomes upon comparing prolonged hydrolysed formula versus CMF feeding.
Meta‐analysis showed a reduction in infant allergy (eight studies, 2852 infants; fixed‐effect (FE) RR 0.82, 95% CI 0.72 to 0.95; RD ‐0.04, 95% CI ‐0.08 to ‐0.01; number needed to treat for an additional beneficial outcome (NNTB) 25, 95% CI 12.5 to 100; I² = 18%). Meta‐analysis revealed no difference in childhood allergy incidence (two studies, 950 infants; RR 0.85, 95% CI 0.69 to 1.05; heterogeneity P = 0.05; I² = 73%). One study (Kwinta 2009) reported no difference in childhood allergy prevalence (62 infants; RR 1.76, 95% CI 0.76 to 4.09). (See Figure 4 for funnel plot.)

Funnel plot of comparison: 4 Prolonged feeding: hydrolysed formula versus cow's milk formula, outcome: 4.1 Any allergy.
Meta‐analysis showed no difference in infant asthma (four studies, 318 infants; FE RR 0.57, 95% CI 0.31 to 1.04; I² = 0%). Marini 1996 reported no difference in childhood asthma incidence (78 infants; RR 0.38, 95% CI 0.08 to 1.84). Meta‐analysis revealed no difference in childhood asthma prevalence (three studies, 1229 infants; FE RR 1.15, 95% CI 0.89 to 1.50; I² = 0%).
Meta‐analysis showed no difference in infant eczema (nine studies, 2896 infants; FE RR 0.86, 95% CI 0.73 to 1.01; heterogeneity P = 0.05; I² = 0%). Meta‐analysis showed no difference in childhood eczema incidence (two studies, 950 infants; FE RR 0.83, 95% CI 0.63 to 1.10; heterogeneity P = 0.20; I² = 40%). Meta‐analysis revealed no difference in childhood eczema prevalence (three studies, 1228 infants; FE RR 0.78, 95% CI 0.60 to 1.02; I² = 8%). (See Figure 5 for funnel plot.)

Funnel plot of comparison: 4 Prolonged feeding: hydrolysed formula versus cow's milk formula, outcome: 4.3 Eczema.
Meta‐analysis showed no difference in infant rhinitis (three studies, 256 infants; FE RR 0.52, 95% CI 0.14 to 1.85; I² = 0%). Marini 1996 reported no difference in childhood rhinitis incidence (78 infants; RR 0.48, 95% CI 0.04 to 5.03). Meta‐analysis revealed no difference in childhood rhinitis prevalence (two studies, 357 infants; FE RR 1.14, 95% CI 0.78 to 1.67; I² = 0%).
Meta‐analysis showed no difference in infant food allergy (two studies, 479 infants; FE RR 1.95, 95% CI 0.58 to 1.54; heterogeneity P = 0.15; I² = 52%). Meta‐analysis revealed a reduction in infant CMA (two studies, 405 infants; FE RR 0.38, 95% CI 0.16 to 0.86; I² = 0%). (See Figure 6 for funnel plot.)
Funnel plot of comparison: 4 Prolonged feeding: hydrolysed formula versus cow's milk formula, outcome: 4.6 Cow's milk allergy.
Subgroup analyses (Comparisons 5 to 10)
Comparison 5. Prolonged feeding: hydrolysed formula versus cow's milk formula ‐ low‐risk infants
Kwinta 2009 compared prolonged feeding with a hydrolysed formula versus CMF in low‐risk infants. Kwinta 2009 reported no difference in childhood prevalence of allergy (62 infants; RR 1.76, 95% CI 0.76 to 4.09), asthma (62 infants; RR 2.20, 95% CI 0.77 to 6.26), eczema (62 infants; RR 0.29, 95% CI 0.03 to 2.66) and rhinitis (62 infants; RR 1.32, 95% CI 0.53 to 3.26).
Comparison 6. Prolonged feeding: hydrolysed formula versus cow's milk formula ‐ high‐risk infants
Eight studies (de Seta 1994; Hill 2000; Lam 1992; Marini 1996; Oldaeus 1997; Vandenplas 1992; von Berg 2003; Willems 1993) compared prolonged hydrolysed formula feeding versus CMF feeding in high‐risk infants.
Meta‐analysis showed a reduction in infant allergy incidence (eight studies, 2852 infants; FE RR 0.82, 95% CI 0.72 to 0.95; I² = 18%). Meta‐analysis revealed no difference in childhood allergy incidence (two studies, 950 infants; FE RR 0.85, 95% CI 0.69 to 1.05; heterogeneity P = 0.05; I² = 73%).
Meta‐analysis showed no difference in infant asthma incidence (four studies, 318 infants; FE RR 0.57, 95% CI 0.31 to 1.04; I² = 0%). Marini 1996 reported no difference in childhood asthma incidence (78 infants; RR 0.38, 95% CI 0.08 to 1.84). Meta‐analysis revealed no difference in childhood asthma prevalence (two studies, 1167 infants; RR 1.09, 95% CI 0.83 to 1.44; I² = 0%).
Meta‐analysis showed no difference in infant eczema incidence (nine studies, 2896 infants; FE RR 0.86, 95% CI 0.73 to 1.01; I² = 0%), no difference in childhood eczema incidence (two studies, 950 infants; FE RR 0.83, 95% CI 0.63 to 1.10) and no difference in childhood eczema prevalence (two studies, 1166 infants; FE RR 0.80, 95% CI 0.61 to 1.04; I² = 26%).
Meta‐analysis showed no significant difference in infant rhinitis incidence (three studies, 256 infants; FE RR 0.52, 95% CI 0.14 to 1.85; I² = 0%). Marini 1996 reported no difference in childhood rhinitis incidence (78 infants; RR 0.47, 95% CI 0.04 to 5.03). Hill 2000 found no difference in childhood rhinitis prevalence (295 infants; RR 1.11, 95% CI 0.73 to 1.68).
Meta‐analysis showed no difference in infant food allergy incidence (two studies, 479 infants; FE RR 0.95, 95% CI 0.58 to 1.54; heterogeneity P = 0.15; I² = 54%).
Meta‐analysis showed no difference in infant cow's milk allergy incidence (two studies, 405 infants; FE RR 0.38, 95% CI 0.16 to 0.86; I² = 0%).
Comparison 7. Prolonged feeding: partially hydrolysed formula versus cow's milk formula
Eleven studies (Chirico 1997; de Seta 1994; Kwinta 2009; Hill 2000; Lam 1992; Marini 1996; Oldaeus 1997; Tsai 1991; Vandenplas 1992; von Berg 2003; Willems 1993) reported outcomes that compared prolonged feeding with a PHF versus a CMF.
Meta‐analysis showed a reduction in infant allergy incidence (eight studies, 1820 infants; FE RR 0.83, 95% CI 0.72 to 0.96; RD ‐0.05, 95% CI ‐0.09 to ‐0.01; NNTB 20, 95% CI 11, 100; heterogeneity P = 0.16; I² = 33%) and no difference in childhood allergy incidence (two studies, 510 infants; FE RR 0.86, 95% CI 0.67 to 1.10; heterogeneity P = 0.04; I² = 75%). Marini 1996 reported a reduction in childhood allergy incidence (78 infants; RR 0.42, 95% CI 0.19 to 0.90), whereas von Berg 2003 found no difference (432 infants; RR 0.95, 95% CI 0.73 to 1.25).
Meta‐analysis showed no difference in infant asthma (four studies, 268 infants; FE RR 0.54, 95% CI 0.28 to 1.04; I² = 0%). Marini 1996 reported no difference in childhood asthma incidence (78 infants; RR 0.38, 95% CI 0.08 to 1.84). Meta‐analysis revealed no difference in childhood asthma prevalence (three studies, 789 infants; FE RR 1.20, 95% CI 0.91 to 1.58).
Meta‐analysis showed no difference in infant eczema (eight studies, 1699 infants; FE RR 0.89, 95% CI 0.75 to 1.06; I² = 0%), no difference in childhood eczema incidence (two studies, 510 infants; FE RR 0.85, 95% CI 0.61 to 1.19; heterogeneity P = 0.17; I² = 46%) and no difference in childhood eczema prevalence (three studies, 788 infants; FE RR 0.82, 95% CI 0.61 to 1.09; I² = 0%).
Meta‐analysis showed no difference in infant rhinitis (three studies, 206 infants; FE RR 0.40, 95% CI 0.09 to 1.70). Marini 1996 reported no difference in childhood rhinitis incidence (78 infants; RR 0.48, 95% CI 0.04 to 5.03). Meta‐analysis revealed no difference in childhood rhinitis prevalence (two studies, 257 infants; FE RR 1.14, 95% CI 0.78 to 1.67; I² = 0%).
Meta‐analysis showed no difference in infant food allergy (two studies, 429 infants; FE RR 1.00, 95% CI 0.62 to 1.63; heterogeneity P = 0.05; I² = 74%). Neither study reported a difference.
Meta‐analysis showed a reduction in infant CMA incidence (two studies, 405 infants; FE RR 0.38, 95% CI 0.16 to 0.86; I² = 0%).
Comparison 8. Prolonged feeding: extensively hydrolysed formula versus cow's milk formula
Five studies (Kwinta 2009; Mallet 1992; Oldaeus 1997; Sorensen 2007; von Berg 2003) compared prolonged feeding with an EHF versus CMF.
Meta‐analysis showed no difference in infant allergy (two studies, 1561 infants; FE RR 0.87, 95% CI 0.68 to 1.13; I² = 0%). von Berg 2003 reported no difference in childhood allergy incidence (651 infants; RR 0.89, 95% CI 0.71 to 1.13). Kwinta 2009 found no difference in childhood allergy prevalence (62 infants; RR 1.76, 95% CI 0.76 to 4.09).
Oldaeus 1997 reported no difference in infant asthma (96 infants; RR 0.61, 95% CI 0.18 to 2.04). Meta‐analysis revealed no difference in childhood asthma prevalence (two studies, 713 infants; FE RR 1.15, 95% CI 0.76 to 1.72; heterogeneity P = 0.18, I² = 43%).
Meta‐analysis showed no difference in infant eczema (three studies, 1726 infants; FE RR 0.83, 95% CI 0.63 to 1.08). von Berg 2003 reported no difference in childhood eczema incidence (651 infants; RR 0.86, 95% CI 0.63 to 1.17). Meta‐analysis revealed a reduction in childhood eczema prevalence (two studies, 713 infants; FE RR 0.61, 95% CI 0.39 to 0.97; I² = 0%).
Oldaeus 1997 reported no difference in infant rhinitis incidence (96 infants; RR 2.76, 95% CI 0.12 to 66.22). Kwinta 2009 found no difference in childhood rhinitis prevalence (62 infants; RR 1.32, 95% CI 0.53 to 3.26).
Oldaeus 1997 reported no difference in food allergy (96 infants; RR 1.15, 95% CI 0.33 to 4.02).
Comparison 9. Prolonged feeding: extensively hydrolysed formula versus partially hydrolysed formula
Five studies (Halken 2000; Nentwich 2001; Oldaeus 1997; Sorensen 2007; von Berg 2003) compared prolonged feeding with an EHF versus a PHF.
Meta‐analysis showed no difference in infant allergy (three studies, 1806 infants; FE RR 0.93, 95% CI 0.75 to 1.16; I² = 0%). von Berg 2003 reported no difference in childhood allergy incidence (661 infants; RR 0.89, 95% CI 0.58 to 1.35).
Meta‐analysis showed no difference in infant asthma incidence (two studies, 341 infants; FE RR 1.72, 95% CI 0.74 to 3.96; I² = 0%). von Berg 2003 reported no difference in childhood asthma prevalence (661 infants; RR 0.89, 95% CI 0.58 to 1.35).
Meta‐analysis showed no difference in infant eczema (four studies, 1865 infants; FE RR 0.89, 95% CI 0.73 to 1.10; I² = 0%). von Berg 2003 reported no difference in childhood eczema incidence (661 infants; RR 0.92, 95% CI 0.69 to 1.26) and no difference in childhood eczema prevalence (661 infants; RR 0.90, 95% CI 0.54 to 1.52).
Meta‐analysis revealed no difference in infant rhinitis (two studies, 341 infants; FE RR 1.25, 95% CI 0.36 to 4.29; I² = 0%).
Meta‐analysis showed a reduction in infant food allergy (two studies, 341 infants; FE RR 0.43, 95% CI 0.19, 0.99; I² = 0%).
Halken 2000 reported no difference in infant CMA (246 infants; RR 0.13, 95% CI 0.01 to 1.16) and no difference in infant urticaria (246 infants; RR 1.32, 95% CI 0.26 to 6.66).
Comparison 10. Prolonged exclusive feeding: hydrolysed formula versus cow's milk formula
Seven studies reported prolonged exclusive hydrolysed formula versus CMF (Chirico 1997; de Seta 1994; Kwinta 2009; Lam 1992; Marini 1996; Vandenplas 1992; Willems 1993).
Meta‐analysis showed no difference in infant allergy (five studies, 425 infants; FE RR 0.61, 95% CI 0.46 to 0.80; I² = 0%). Marini 1996 reported a reduction in childhood allergy incidence (78 infants; RR 0.42, 95% CI 0.19 to 0.90). Kwinta 2009 found no difference in childhood allergy prevalence (62 infants; RR 1.76, 95% CI 0.76 to 4.09).
Meta‐analysis revealed no difference in infant asthma (two studies, 144 infants; FE RR 0.57, 95% CI 0.25 to 1.31; I² = 0%). Marini 1996 reported no difference in childhood asthma incidence (78 infants; RR 0.38, 95% CI 0.08 to 1.84). Kwinta 2009 found no difference in childhood asthma prevalence (62 infants; RR 2.20, 95% CI 0.77 to 6.26).
Meta‐analysis showed no difference in infant eczema (four studies, 271 infants; FE RR 0.74, 95% CI 0.45 to 1.21; I² = 0%). Marini 1996 reported no difference in childhood eczema incidence (78 infants; RR 0.42, 95% CI 0.14 to 1,26). Kwinta 2009 found no difference in childhood eczema prevalence (62 infants; RR 0.29, 95% CI 0.03 to 2.66).
Marini 1996 reported that no infants had rhinitis and found no difference in childhood rhinitis incidence (82 infants; RR 0.48, 95% CI 0.04 to 5.03). Kwinta 2009 reported no difference in childhood rhinitis prevalence (62 infants; RR 1.32, 95% CI 0.53 to 3.26).
Vandenplas 1992 reported a reduction in infant CMA (67 infants; RR 0.36, 95% CI 0.15 to 0.89).
Sensitivity analyses (Comparisons 11 and 12)
Comparison 11. Prolonged feeding: hydrolysed formula versus cow's milk formula ‐ studies with blinded measurement
Four studies reported assessment for allergy without knowledge of participant allocation (Kwinta 2009; Oldaeus 1997; Vandenplas 1992; von Berg 2003).
Meta‐analysis showed no difference in infant allergy (three studies, 2156 infants; FE RR 0.87, 95% CI 0.69 to 1.08; heterogeneity P = 0.13; I² = 52%). von Berg 2003 reported no difference in childhood allergy incidence (872 infants; RR 0.91, 95% CI 0.73 to 1.14). Kwinta 2009 found no difference in childhood allergy prevalence (62 infants; RR 0.91, 95% CI 0.73 to 1.14) .
Oldaeus 1997 reported no difference in infant asthma (141 infants; RR 0.48, 95% CI 0.17 to 1.42). Meta‐analysis revealed no difference in childhood asthma prevalence (two studies; 934 infants; FE RR 1.17, 95% CI 0.80 to 1.73; heterogeneity P = 0.21; I² = 38%).
Meta‐analysis showed no difference in infant eczema (two studies, 2089 infants; FE RR 0.90, 95% CI 0.70 to 1.16; I² = 0%). von Berg 2003 reported no difference in childhood eczema incidence (872 infants; RR 0.88, 95% CI 0.66 to 1.18). Meta‐analysis revealed a reduction in childhood eczema prevalence (two studies, 934 infants; FE RR 0.64, 95% CI 0.42 to 0.97; I² = 0%).
Oldaeus 1997 reported no difference in infant rhinitis (141 infants; RR 1.47, 95% CI 0.06 to 35.37). Kwinta 2009 (62 infants) found no difference in childhood rhinitis prevalence (62 infants; RR 1.32, 95% CI 0.53 to 3.26).
Oldaeus 1997 reported no difference in infant food allergy (141 infants; RR 1.82, 95% CI 0.64 to 5.16). Vandenplas 1992 found a reduction in infant CMA (67 infants; RR 0.36, 95% CI 0.15 to 0.89).
Comparison 12. Prolonged feeding: hydrolysed formula versus cow's milk formula ‐ studies at low risk of bias
We assessed no studies as eligible for inclusion in the sensitivity analysis of studies of adequate methods (adequate randomisation, allocation concealment and < 10% loss to follow‐up).
Additional analyses (Comparisons 13 to 17)
Comparison 13. Prolonged feeding: partially hydrolysed whey formula versus cow's milk formula
Nine studies compared a partially hydrolysed whey formula versus CMF (Chirico 1997; de Seta 1994; Hill 2000; Lam 1992; Marini 1996; Tsai 1991; Vandenplas 1992; von Berg 2003; Willems 1993).
Meta‐analysis showed a reduction in infant allergy (seven studies, 1729 infants; FE RR 0.78, 95% CI 0.66 to 0.94; I² = 15%) and no difference in childhood allergy incidence (two studies, 510 infants; FE RR 0.68, 95% CI 0.31 to 1.52) but showed significant (P = 0.04) and substantial (I² = 75%) heterogeneity.
Meta‐analysis showed no difference in infant asthma (three studies, 177 infants; FE RR 0.61, 95% CI 0.29 to 1.28; I² = 0%). Marini 1996 reported no difference in childhood asthma incidence (78 infants; RR 0.38, 95% CI 0.08 to 1.84). Meta‐analysis revealed no difference in childhood asthma prevalence (two studies, 727 infants; FE RR 1.13, 95% CI 0.85 to 1.51; I² = 0%).
Meta‐analysis showed no difference in infant eczema (seven studies, 1608 infants; FE RR 0.86, 95% CI 0.72 to 1.03; I² = 0%), no difference in childhood eczema incidence (two studies, 510 infants; FE RR 0.85, 95% CI 0.61 to 1.19; heterogeneity P = 0.17; I² = 46%) and no difference in childhood eczema prevalence (two studies, 726 infants; FE RR 0.84, 95% CI 0.63 to 1.12; I² = 0%).
Meta‐analysis showed no difference in infant rhinitis (two studies, 115 infants; FE RR 0.4, 95% CI 0.09 to 1.70). Marini 1996 reported no difference in childhood rhinitis incidence (78 infants; RR 0.47, 95% CI 0.04 to 5.03). Hill 2000 found no difference in childhood rhinitis prevalence (295 infants; RR 1.11, 95% CI 0.73 to 1.68).
Hill 2000 reported no difference in infant food allergy (338 infants; RR 0.76, 95% CI 0.44 to 1.33).
Meta‐analysis revealed a reduction in infant CMA (two studies, 405 infants; RR 0.38, 95% CI 0.16 to 0.86; I² = 0%).
Comparison 14. Prolonged feeding: partially hydrolysed casein‐containing formula versus cow's milk formula
Two studies compared a PHF containing casein versus CMF (Kwinta 2009; Oldaeus 1997).
Oldaeus 1997 reported no difference in infant allergy incidence (91 infants; RR 1.36, 95% CI 0.80 to 2.31). Kwinta 2009 found no difference in childhood allergy prevalence (62 infants; RR 1.76, 95% CI 0.76 to 4.09).
Oldaeus 1997 reported no difference in infant asthma (91 infants; RR 0.34, 95% CI 0.07 to 1.60). Kwinta 2009 found no difference in childhood asthma prevalence (62 infants; RR 2.20, 95% CI 0.77 to 6.26).
Oldaeus 1997 reported no difference in infant eczema (91 infants; RR 1.30, 95% CI 0.66 to 2.55). Kwinta 2009 found no difference in childhood eczema prevalence (62 infants; RR 0.29, 95% CI 0.03 to 2.66).
Oldaeus 1997 reported that no infant had rhinitis. Kwinta 2009 reported no difference in childhood rhinitis prevalence (62 infants; RR 1.32, 95% CI 0.53 to 3.26).
Oldaeus 1997 reported no difference in infant food allergy (91 infants; RR 2.56, 95% CI 0.86 to 7.56).
Comparison 15. Prolonged feeding: extensively hydrolysed whey formula versus cow's milk formula
von Berg 2003 compared an extensively hydrolysed whey formula versus CMF.
von Berg 2003 reported no difference in infant allergy (972 infants; RR 0.97, 95% CI 0.71 to 1.34) and no difference in childhood allergy incidence (431 infants; RR 1.07, 95% CI 0.82 to 1.38).
von Berg 2003 reported no difference in childhood asthma prevalence (431 infants; RR 1.19, 95% CI 0.73 to 1.94).
von Berg 2003 reported no difference in infant eczema (972 infants; RR 1.00, 95% CI 0.72 to 1.40), no difference in childhood eczema incidence (431 infants; RR 1.06, 95% CI 0.75 to 1.49) and no difference in childhood eczema prevalence (431 infants; RR 0.78, 95% CI 0.46 to 1.33).
Comparison 16. Prolonged feeding: extensively hydrolysed casein formula versus cow's milk formula
von Berg 2003 compared an extensively hydrolysed casein formula versus CMF.
von Berg 2003 reported no difference in infant allergy (976 infants; RR 0.76, 95% CI 0.54 to 1.07) and a reduction in childhood allergy incidence (431 infants; RR 0.72, 95% CI 0.53 to 0.97).
von Berg 2003 reported no difference in childhood asthma prevalence (431 infants; RR 0.84, 95% CI 0.49 to 1.45).
von Berg 2003 reported no difference in infant eczema (976 infants; RR 0.69, 95% CI 0.47 to 1.00), a reduction in childhood eczema incidence (431 infants; RR 0.66, 95% CI 0.44 to 0.98) and a reduction in childhood eczema prevalence (431 infants; RR 0.50, 95% CI 0.27 to 0.92).
Comparison 17. Prolonged feeding: extensively hydrolysed casein formula versus extensively hydrolysed whey formula
Two studies compared an extensively hydrolysed casein formula versus an extensively hydrolysed whey formula (Halken 2000; von Berg 2003).
Meta‐analysis showed no difference in infant allergy (two studies, 1143 infants; FE RR 0.96, 95% CI 0.73 to 1.26). Results revealed significant (P = 0.02) and substantial (I² = 82%) heterogeneity between studies, although neither study reported a difference. von Berg 2003 reported a reduction in childhood allergy incidence (440 infants; RR 0.68, 95% CI 0.50 to 0.90).
Halken 2000 reported no difference in infant asthma (161 infants; RR 2.28, 95% CI 0.83 to 6.28). von Berg 2003 reported no difference in childhood asthma prevalence (440 infants; RR 0.71, 95% CI 0.42 to 1.19).
Meta‐analysis showed no difference in infant eczema (two studies, 1143 infants; FE RR 0.81, 95% CI 0.59 to 1.10; heterogeneity P = 0.07; I² = 70%). von Berg 2003 found a reduction in childhood eczema incidence (440 infants; RR 0.62, 95% CI 0.42 to 0.92) and no difference in childhood eczema prevalence (440 infants; RR 0.64, 95% CI 0.33 to 1.21).
Halken 2000 reported no difference in infant rhinitis (161 infants; RR 2.08, 95% CI 0.39 to 11.02), no difference in infant food allergy (161 infants; RR 1.45, 95% CI 0.48 to 4.39), no difference in infant CMA (161 infants; RR 5.19, 95% CI 0.25 to 106.38) and no difference in urticaria (161 infants; RR 4.15, 95% CI 0.47 to 36.34).
Discussion
Summary of main results
Early short‐term infant feeding
Two studies (Juvonen 1996; Saarinen 1999) assessed the effect of three to four days' supplementation with a hydrolysed formula versus cow's milk formula (CMF) versus pasteurised human milk feeds whilst in hospital after birth.
Juvonen 1996 reported no difference in rates of allergy, asthma, eczema, food allergy and cow's milk allergy (CMA) up to three years of age upon comparing feeding a hydrolysed formula versus pasteurised human milk (GRADE quality of evidence very low ‐ see Figure 4). Saarinen 1999 found no difference in the rate of CMA at a mean age of 27 months when comparing feeding a hydrolysed formula versus pasteurised human milk (GRADE quality of evidence very low ‐ see Figure 4).
Juvonen 1996 reported no difference in rates of allergy, asthma, eczema, food allergy and CMA up to three years of age upon comparing feeding a hydrolysed formula versus CMF (GRADE quality of evidence very low ‐ see Figure 5). Saarinen 1999 found a reduction in CMA at a mean age of 27 months when comparing feeding a hydrolysed formula versus CMF (GRADE quality of evidence very low ‐ see Figure 5). Substantial methodological concerns regarding these studies and imprecision in estimates of effect suggest the potential for confounding to influence the statistical significance of effects.
Prolonged infant feeding
Prolonged infant feeding with a hydrolysed formula compared with CMF was associated with a reduction in infant allergy (eight studies, 2852 infants; fixed‐effect risk ratio (FE RR) 0.82, 95% confidence interval (CI) 0.72 to 0.95; risk difference (RD) ‐0.04, 95% CI ‐0.08 to ‐0.01; number needed to treat for an additional beneficial outcome (NNTB) 25, 95% CI 12.5 to 100) (GRADE quality of evidence very low ‐ see Figure 6). However, methodological concerns regarding these studies (see Figure 2; Figure 3) and concerns regarding the potential for publication bias were substantial ‐ substantial numbers of studies including those examining high‐risk infants have not comprehensively reported allergy outcomes. We considered no studies to be at 'low risk' of bias.
Prolonged infant feeding with a hydrolysed formula compared with CMF was associated with a reduction in infant CMA (two studies, 405 infants; FE RR 0.38, 95% CI 0.16 to 0.86) (GRADE quality of evidence very low ‐ see Figure 6). However, methodological concerns regarding studies were substantial (see Figure 2; Figure 3). Concerns regarding publication bias include that substantial numbers of studies including those in high‐risk infants have not comprehensively reported allergy outcomes; other concerns involve imprecision, with only two studies reporting outcomes for 405 infants included in the meta‐analysis.
Prolonged infant feeding with a hydrolysed formula compared with CMF was not associated with a difference in childhood allergy incidence or prevalence. Investigators found no difference in specific allergy including infant and childhood asthma, infant and childhood eczema, infant and childhood rhinitis and infant food allergy. Many of the analyses assessing specific allergy are underpowered and do not preclude the possibility of benefit from prolonged use of a hydrolysed formula compared with CMF, especially given the finding of reduced infant allergy and reduced infant CMA.
Subgroup analyses
These analyses identified groups that may benefit from use of hydrolysed formulas and potential benefits associated with specific types of hydrolysed formulas.
Infant allergy was reduced in analyses of studies that enrolled infants at high risk of allergy and compared a hydrolysed formula with CMF; compared a partially hydrolysed formula (PHF) with CMF; compared prolonged and exclusive feeding (i.e. no breast feeding) of a hydrolysed formula with CMF; and compared a partially hydrolysed whey formula with CMF.
A single study (von Berg 2003) that compared an extensively hydrolysed casein formula versus CMF; and that compared an extensively hydrolysed casein formula versus an extensively hydrolysed whey formula reported a reduction in childhood allergy incidence.
A single study (von Berg 2003) that compared an extensively hydrolysed casein formula with an extensively hydrolysed whey formula reported a reduction in childhood eczema incidence. Studies that compared an extensively hydrolysed formula (EHF) with CMF; and that compared an extensively hydrolysed casein formula versus CMF found a reduction in childhood eczema prevalence.
Studies that compared an EHF with a PHF found a reduction in infant food allergy.
Studies that enrolled infants at high risk of allergy and compared a PHF with CMF; compared prolonged and exclusive feeding (i.e. no breast feeding) of a hydrolysed formula with CMF; and compared a partially hydrolysed whey formula with CMF found a reduction in infant CMA.
Summary
Prolonged infant feeding with a hydrolysed formula compared with CMF was associated with a reduction in infant allergy and infant CMA, but the GRADE quality of evidence was very low owing to methodological concerns regarding studies and the potential for publication bias.
Subgroup analyses identified potential reductions in infant allergy associated with using a PHF, feeding a hydrolysed formula to infants at high risk of allergy (first‐degree relative with allergy) and providing exclusive formula feeding (i.e. when infants are unable to be breast fed). A single study (von Berg 2003) also reported a reduction in infant and childhood incidence of eczema and in childhood prevalence of eczema resulting from use of an extensively hydrolysed casein formula compared with CMF. This study also reported a reduction in infant and childhood incidence of eczema from use of an extensively hydrolysed casein formula compared with an extensively hydrolysed whey formula. Additional high‐quality studies are needed to reproduce these findings.
Summary of subgroup analyses
Analyses showed a reduction in infant allergy in studies that:
-
enrolled infants at high risk of allergy and compared a hydrolysed formula versus CMF (eight studies, 2852 infants; FE RR 0.82, 95% CI 0.72 to 0.95; I² = 18%);
-
compared a PHF with CMF (eight studies, 1820 infants; FE RR 0.83, 95% CI 0.72 to 0.96; RD ‐0.05, 95% CI ‐0.09 to ‐0.01; NNTB 20, 95% CI 11 to 100; heterogeneity P = 0.16; I² = 33%);
-
compared prolonged and exclusive feeding (i.e. no breast feeding) of a hydrolysed formula versus CMF (five studies, 425 infants; FE RR 0.61, 95% CI 0.46 to 0.80; I² = 0%); and
-
compared a partially hydrolysed whey formula with CMF (seven studies, 1729 infants; FE RR 0.78, 95% CI 0.66 to 0.94; I² = 15%).
Analyses showed a reduction in childhood allergy incidence in a single study (von Berg 2003) that compared:
-
an extensively hydrolysed casein formula versus CMF (431 infants; RR 0.72, 95% CI 0.53 to 0.97); and
-
an extensively hydrolysed casein formula versus an extensively hydrolysed whey formula (440 infants; RR 0.68, 95% CI 0.50 to 0.90).
Analyses showed a reduction in childhood eczema prevalence in studies that:
-
compared an EHF with CMF (two studies, 713 infants; FE RR 0.61, 95% CI 0.39 to 0.97; I² = 0%); and
-
compared an extensively hydrolysed casein formula versus CMF (431 infants; RR 0.50, 95% CI 0.27 to 0.92).
Analyses showed a reduction in infant food allergy in studies that:
-
compared an EHF versus a PHF (two studies, 341 infants; FE RR 0.43, 95% CI 0.19 to 0.99; I² = 0%).
Analyses revealed a reduction in infant CMA in studies that:
-
enrolled infants at high risk of allergy (two studies, 405 infants; FE RR 0.38, 95% CI 0.16 to 0.86; I² = 0%);
-
compared a PHF versus CMF (two studies, 405 infants; FE RR 0.38, 95% CI 0.16 to 0.86; I² = 0%);
-
used prolonged and exclusive feeding (i.e. no breast feeding) of a hydrolysed formula versus CMF (one study, 67 infants; RR 0.36, 95% CI 0.15 to 0.89); or
-
compared a partially hydrolysed whey formula versus CMF (two studies, 405 infants; RR 0.38, 95% CI 0.16, 0.86; I² = 0%).
Overall completeness and applicability of evidence
For short‐term feeding (e.g. for three to four days whilst in hospital), a single small study (Juvonen 1996) is underpowered to determine an effect of hydrolysed formula compared with human milk or CMF on childhood allergy, asthma, eczema or rhinitis. A much larger study enrolling 5713 infants reported no difference in CMA upon comparing infants receiving short‐term feeding with an extensively hydrolysed whey formula versus human milk, and a reduction in CMA of borderline statistical significance when comparing infants fed an extensively hydrolysed whey formula versus CMF. Additional studies are needed to determine if infants benefit from short‐term feeding with a hydrolysed formula in hospital when human milk is unavailable for prevention of allergy and CMA. No studies have reported allergy outcomes resulting from short‐term use of a PHF for infants in hospital. Additional studies are needed to determine if infants derive benefit from using a PHF for short‐term feeding in hospital when human milk is unavailable for prevention of allergy and CMA.
For women unable to exclusively breast feed, no studies have compared prolonged use of a hydrolysed formula versus human milk (e.g. from a donor milk bank) for prevention of allergy. This review has not compared the effect of human milk versus CMF feeding so cannot provide a conclusion about potential benefit derived from use of a human milk bank for prevention of allergy.
Evidence suggests that prolonged use of a hydrolysed formula reduces allergy overall and CMA in infants unable to be exclusively breast fed. Evidence of benefit is limited to infants at high risk of allergy (first‐degree relative with allergy). Evidence is insufficient to show whether use of a hydrolysed formula or any specific hydrolysed formula reduces the prevalence of childhood allergy or any specific allergy. Few studies have reported the prevalence of allergy in childhood. Benefits in preventing childhood allergy and eczema following use of an extensively hydrolysed casein formula are largely restricted to a single study (von Berg 2003).
Quality of the evidence
-
Early short‐term infant feeding: Two studies reported the effect of short‐term infant feeding of a hydrolysed formula versus human milk and cow's milk. Both studies (Juvonen 1996; Saarinen 1999) had substantial methodological concerns (Figure 3). Analyses of the larger study (Saarinen 1999), which enrolled 5713 infants, were restricted to reporting of CMA. The other study (Juvonen 1996) was underpowered to detect important differences in other allergy outcomes. We assessed evidence for an effect on allergy and CMA as being at high risk of bias and underpowered ‐ we graded the quality of evidence as 'very low'.
-
Prolonged infant feeding with a hydrolysed formula compared with CMF: We assessed the GRADE quality of evidence as 'very low' (see Figure 6) for all outcomes. We had substantial methodological concerns regarding these studies (see Figure 2; Figure 3) and considered none of them to be at 'low risk' of bias. We had substantial concerns regarding the potential for publication bias in that substantial numbers of studies, including those in high‐risk infants, have not comprehensively reported allergy outcomes (see the description of excluded studies section). We also had concerns regarding imprecision of several analyses, including childhood allergy incidence and prevalence, as well as analyses of infant and childhood asthma, eczema, rhinitis, food allergy and CMA. We found substantial heterogeneity in analyses of childhood incidence of allergy (P = 0.05; I² = 73%) and infant food allergy (P = 0.15; I² =52%).
This review includes studies that used random and quasi‐random methods of participant allocation. Several studies reported methods of sequence generation that were at high risk of bias (Halken 2000; Juvonen 1996; Nentwich 2001; Saarinen 1999; Willems 1993). Several other studies failed to report the method of sequence generation used (Chirico 1997; de Seta 1994; Kwinta 2009; Lam 1992; Mallet 1992; Marini 1996; Oldaeus 1997; Sorensen 2007; Tsai 1991; Vandenplas 1992), leaving only two studies (Hill 2000; von Berg 2003) assessed as being at low risk of selection bias. In addition, for von Berg 2003, we had concerns regarding selection bias (in the extensively hydrolysed casein formula group, disproportionately more children had to be excluded as a result of non‐compliance with the study formula) and losses to follow‐up. As a result of methodological concerns regarding included studies, we downgraded the GRADE quality of evidence for all outcomes.
Potential biases in the review process
This review had strict prespecified inclusion criteria that included reporting data only when outcomes for ≥ 80% of infants were noted. A substantial number of studies had excess losses to follow‐up, so a substantial quantity of data is not included in this review. Losses to follow‐up do not necessarily bias a study. However, when losses do bias a study, it is not possible to predict the direction of effect. The review authors have consistently applied this inclusion criterion through all updates of this review.
This review includes unpublished data to reduce concern regarding publication bias. Not all studies have been reported in peer‐reviewed journals. Some studies were provided as university theses or by formula companies. Only one company to date has provided additional studies (Nestle). We excluded several studies after allegations of fraud were made and the authors of these published articles did not respond to requests for data (Chandra 1989a; Chandra 1989b). Despite this, a substantial number of studies have failed to report or comprehensively report outcomes. We consider the analyses reported in this review to be at risk of publication bias.
This review includes studies that use random and quasi‐random methods of participant allocation. See Quality of the evidence.
We obtained data from study authors for several analyses to overcome reporting problems with publications and losses. One study (Hill 2000) reported data for infants who were not contemporaneously randomised, and study authors kindly provided data for contemporaneously randomised infants, which the review authors believe overcame our concern regarding selection bias. For a second study (von Berg 2003) that published outcomes to 10 years, to overcome problems related to excess losses, study authors kindly provided additional data from one centre (Wessel) that reported an intention‐to‐treat analysis up to three years; we have included these data in this review. Losses to follow‐up after three years were excessive (> 20%), so we have excluded from this review follow‐up data from this study beyond three years.
Agreements and disagreements with other studies or reviews
A Cochrane protocol 'Hypoallergenic formula milk versus cow's milk for prevention of wheeze and asthma in children with a family history of atopy' is awaiting completion.
The European Academy of Allergy and Clinical Immunology (EAACI) has published systematic reviews and guidelines for primary prevention of food allergy and anaphylaxis (de Seta 2014; EAACI 2014; Muraro 2014). For prevention of food allergy, two systematic reviews and four randomised trials found benefit from extensively hydrolysed whey or casein formula, although one study found no benefit. Two systematic reviews, two randomised trials and two non‐randomised comparisons noted benefit when partially hydrolysed formula was compared with CMF. One randomised trial and one non‐randomised study found no effect (de Seta 2014).
Recommendations that have been provided for primary prevention of food allergy include the following.
"Recommendations for all infants:
-
no special diet during pregnancy or for the lactating mother;
-
exclusive breastfeeding for four to six months.
Further recommendations for high‐risk infants:
-
if supplement is needed during the first four months, a documented hypoallergenic formula is recommended.
Introduction of complementary foods after the age of four months according to normal standard weaning practices and nutrition recommendations, for all children irrespective of atopic heredity" (Muraro 2014).
Three published systematic reviews have examined hydrolysed formula for prevention of allergy (Alexander 2010; Boyle 2016a; de Silva 2014; Iskedjian 2010; Szajewska 2010); all had potential conflicts of interest. A systematic review (Alexander 2010) studied 100% whey protein partially hydrolysed formula (PHF‐W) compared with intact protein CMF in healthy infants. A meta‐analysis revealed a reduction in atopic dermatitis (11 studies; RR 0.56, 95% CI 0.40 to 0.76). A published funnel plot appears asymmetrical, suggesting lack of small negative studies. Meta‐analysis limited to 'top‐tier studies' showed a similar reduction in atopic dermatitis (four studies; RR 0.45, 95% CI 0.30 to 0.70). Review authors concluded, .."exclusive breast‐feeding should be encouraged as the standard for infant nutrition in the first months of life. For infants who are not exclusively breast‐fed, feeding with PHF‐W instead of CMF reduces the risk of AD in infants, particularly in infants with a family history of allergy." This work was partially funded by Nestle.
A recent systematic review (Boyle 2016a) found 37 eligible trials of hydrolysed formula including more than 19,000 participants. Review authors found evidence of conflict of interest and high or unclear risk of bias in most studies of allergic outcomes and evidence of publication bias in studies of eczema and wheeze. Overall, no consistent evidence indicated that PHFs or EHFs reduce the risk of allergic or autoimmune outcomes among infants at high pre‐existing risk for these outcomes. Odds ratios for eczema from birth to four years of age were 0.84 (95% CI 0.67 to 1.07) for PHF; 0.55 (95% CI 0.28 to 1.09) for extensively hydrolysed casein‐based formula; and 1.12 (95% CI 0.88 to 1.42) for extensively hydrolysed whey‐based formula compared with CMF. Review authors concluded that findings do not support current guidelines recommending the use of hydrolysed formula to prevent allergic disease in high‐risk infants. Methodologically, the Boyle 2016a review differs from this review in that it included studies with > 20% loss to follow‐up and reported infant allergy assessed up to four years of age. This review found very low‐quality evidence that prolonged supplementation of infants at high risk of allergy with hydrolysed formula compared with CMF reduces risk of infant allergy and infant CMA; very low‐quality evidence that prolonged use of a partially hydrolysed formula compared with CMF for partial or exclusive feeding was associated with a reduction in infant allergy incidence and infant CMA incidence; and very low‐quality evidence that prolonged use of an EHF versus a PHF reduces infant food allergy. Studies reported infant allergy outcomes at two years of age. This review found no evidence of benefit at later time points, which is consistent with the findings of Boyle 2016a.
Another systematic review (de Silva 2014) reported mixed findings regarding the preventive benefits of breast feeding for infants at high or normal risk, but evidence suggested that recommendations should include avoiding cow's milk and substituting extensively or partially hydrolysed whey or casein formulas for infants at high risk for the first four months.
Another systematic review (Szajewska 2010) assessed the effect of using a partially hydrolysed 100% whey formula (pHF) in reducing risk of allergy among healthy infants at high risk for allergy. The summary of findings reports that "meta‐analysis showed that pHF compared to SF (standard formula) reduced the risk of all allergic diseases, particularly atopic dermatitis/eczema, at some time points among children at high risk for allergy. Limited data suggest that the use of pHF compared with SF reduced the risk of gastrointestinal symptoms and food allergy. The pooled results did not provide evidence of a difference in the effect of pHF versus SF on the incidence of either wheezing/asthma or rhinitis. Few significant differences in outcomes were found between children who received pHF versus an extensively hydrolyzed whey formula. No significant differences in outcomes were found between children who received pHF versus an extensively hydrolyzed casein formula. These results should be interpreted with caution due to a lack of methodological rigor in many trials." A grant from Nestle Nutrition Institute supported this review.
Another review (Iskedjian 2010) compared a partially hydrolysed 100% whey‐based infant formula (PHF‐W) versus extensively hydrolysed whey‐ (EHF‐Whey) or casein‐based (EHF‐Casein) infant formula for prevention of atopic dermatitis (AD) among infants who cannot be breast fed exclusively. Meta‐analysis revealed no difference in AD when PHF‐W was compared with EHF‐Whey (RR 0.75, 95% CI 0.54 to 1.05 at 0 to 12 months; and RR 0.80, 95% CI 0.63 to 1.02 at 0 to 36 months); and no difference when PHF‐W was compared with EHF‐Casein (RR 1.06, 95% CI 0.74 to 1.53 at 0 to 12 months; and RR 1.13, 95% CI 0.87 to 1.47 at 0 to 36 months). Review authors concluded that the efficacy of PHF‐W falls within the range of efficacy of both EHF formulas (whey and casein). The Nestle Nutrition Institute supported this review.
In a report (Chung 2012) on the FDA Health Claim Review on whey‐protein partially hydrolysed infant formula and atopic dermatitis, "the FDA evaluated human intervention studies that evaluated the role of W‐PHF in reducing the risk of AD. The FDA concluded there is little to very little evidence, respectively, to support a qualified health claim concerning the relationship between intake of W‐PHF and a reduced risk of AD in partially breast fed and exclusively formula‐fed infants throughout the first year after birth and up to 3 years of age. In addition, the FDA required a warning statement be displayed along with the health claim to indicate to consumers that partially hydrolyzed infant formulas are not hypoallergenic and should not be fed to infants who are allergic to milk or to infants with existing milk allergy symptoms."
Evidence from this review for PHF versus CMF
This systematic review found evidence that use of a partially hydrolysed formula compared with CMF for partial or exclusive feeding was associated with a reduction in infant allergy incidence (eight studies, 1820 infants; FE RR 0.83, 95% CI 0.72 to 0.96; RD ‐0.05, 95% CI ‐0.09 to ‐0.01; NNTB 20, 95% CI 11 to 100; heterogeneity P = 0.16; I² = 33%); no difference in childhood allergy incidence (two studies, 510 infants; FE RR 0.86, 95% CI 0.67 to 1.10; heterogeneity P = 0.04; I² = 75%); no difference in infant asthma; no difference in childhood asthma incidence or prevalence; no difference in infant eczema (eight studies, 1699 infants; FE RR 0.89, 95% CI 0.75 to 1.06; I² = 0%); no difference in childhood eczema incidence or prevalence; no difference in infant rhinitis; no difference in infant food allergy; and a reduction in infant CMA incidence (two studies, 405 infants; FE RR 0.38, 95% CI 0.16 to 0.86; I² = 0%). We advise caution regarding these findings in view of the methodological concerns of included studies and the potential for publication bias. We also have concerns regarding imprecision of the estimate in most analyses, suggesting the potential for confounders to influence the statistical significance of findings in relation to infant allergy and CMA.
Evidence from this review for EHF versus PHF
This systematic review found no difference in infant allergy (three studies, 1806 infants; FE RR 0.93, 95% CI 0.75 to 1.16; I² = 0%); no difference in childhood allergy incidence (one study, 661 infants; RR 0.89, 95% CI 0.58 to 1.35); no difference in infant asthma incidence; no difference in childhood asthma prevalence; no difference in infant eczema (four studies, 1865 infants; FE RR 0.89, 95% CI 0.73 to 1.10; I² = 0%); no difference in childhood eczema incidence or prevalence; no difference in infant rhinitis; a reduction in infant food allergy (two studies, 341 infants; FE RR 0.43, 95% CI 0.19 to 0.99; I² = 0%); no difference in infant CMA (one study, 246 infants; RR 0.13, 95% CI 0.01 to 1.16); and no difference in infant urticaria. We advise caution regarding these findings in view of the methodological concerns of included studies and the potential for publication bias. We also have concerns regarding imprecision of the estimate in most analyses, suggesting the potential for confounders to influence the statistical significance of findings.
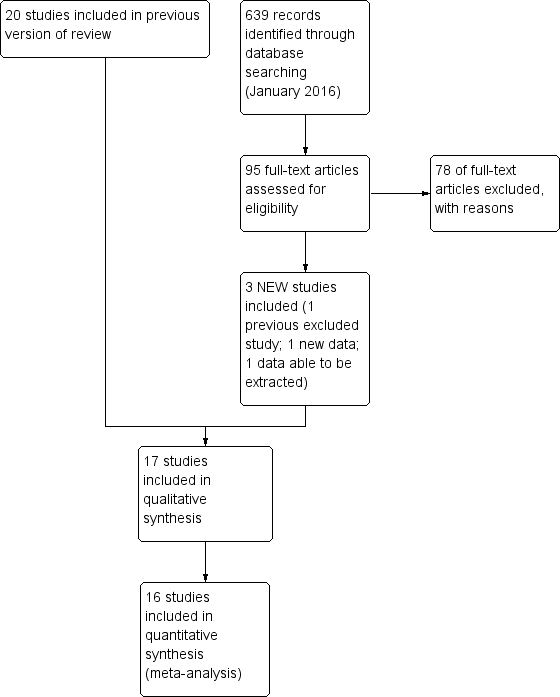
Study flow diagram: review update.
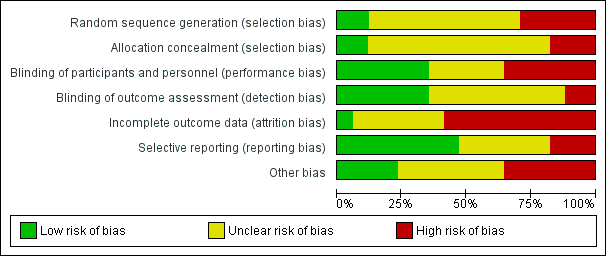
Risk of bias graph: review authors' judgements about each risk of bias item presented as percentages across all included studies.

Risk of bias summary: review authors' judgements about each risk of bias item for each included study.

Funnel plot of comparison: 4 Prolonged feeding: hydrolysed formula versus cow's milk formula, outcome: 4.1 Any allergy.

Funnel plot of comparison: 4 Prolonged feeding: hydrolysed formula versus cow's milk formula, outcome: 4.3 Eczema.

Funnel plot of comparison: 4 Prolonged feeding: hydrolysed formula versus cow's milk formula, outcome: 4.6 Cow's milk allergy.

Comparison 1 Early short‐term feeding: hydrolysed formula versus human milk feeding ‐ low‐risk infants, Outcome 1 Any allergy.

Comparison 1 Early short‐term feeding: hydrolysed formula versus human milk feeding ‐ low‐risk infants, Outcome 2 Asthma.
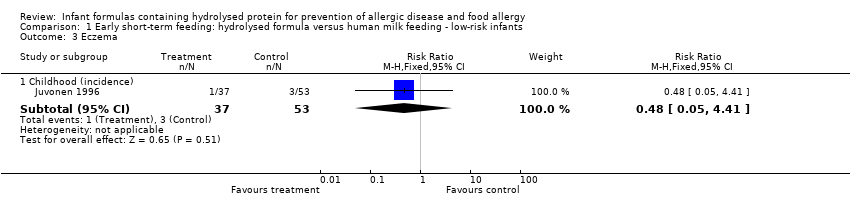
Comparison 1 Early short‐term feeding: hydrolysed formula versus human milk feeding ‐ low‐risk infants, Outcome 3 Eczema.

Comparison 1 Early short‐term feeding: hydrolysed formula versus human milk feeding ‐ low‐risk infants, Outcome 4 Food allergy.

Comparison 1 Early short‐term feeding: hydrolysed formula versus human milk feeding ‐ low‐risk infants, Outcome 5 Cow's milk allergy.

Comparison 2 Early short‐term feeding: hydrolysed formula versus cow's milk formula ‐ low‐risk infants, Outcome 1 Any allergy.
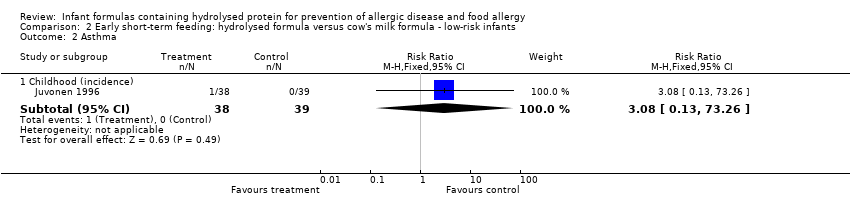
Comparison 2 Early short‐term feeding: hydrolysed formula versus cow's milk formula ‐ low‐risk infants, Outcome 2 Asthma.

Comparison 2 Early short‐term feeding: hydrolysed formula versus cow's milk formula ‐ low‐risk infants, Outcome 3 Eczema.

Comparison 2 Early short‐term feeding: hydrolysed formula versus cow's milk formula ‐ low‐risk infants, Outcome 4 Food allergy.

Comparison 2 Early short‐term feeding: hydrolysed formula versus cow's milk formula ‐ low‐risk infants, Outcome 5 Cow's milk allergy.
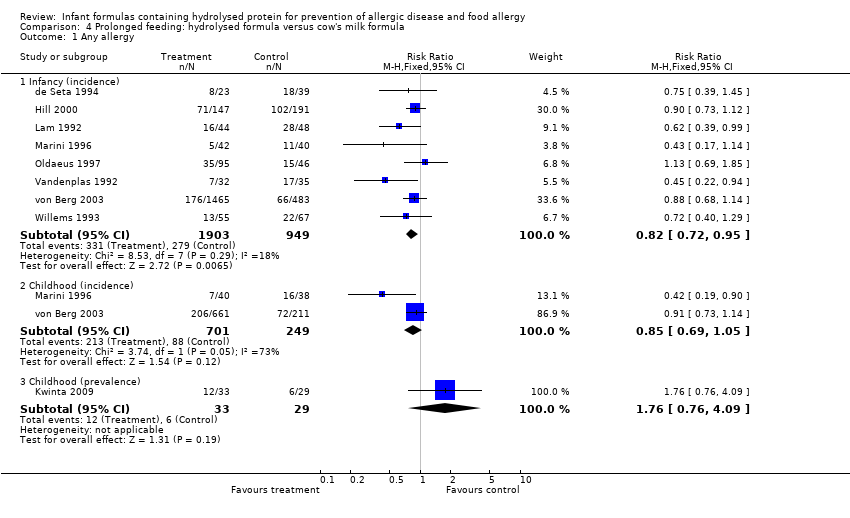
Comparison 4 Prolonged feeding: hydrolysed formula versus cow's milk formula, Outcome 1 Any allergy.
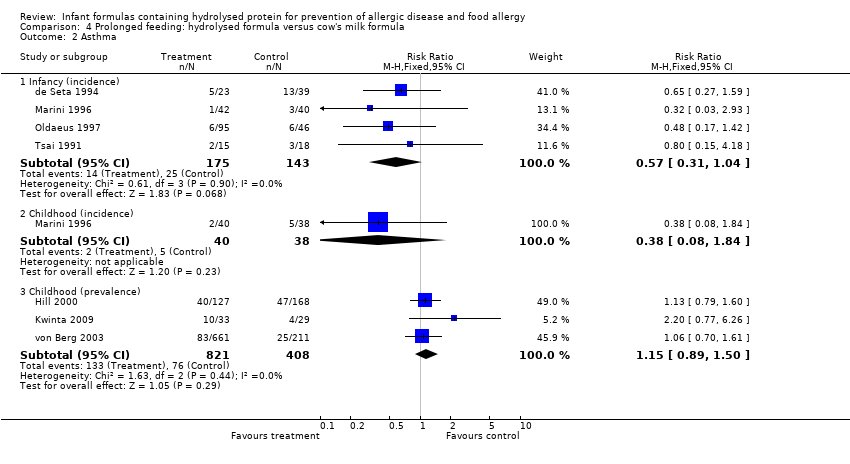
Comparison 4 Prolonged feeding: hydrolysed formula versus cow's milk formula, Outcome 2 Asthma.
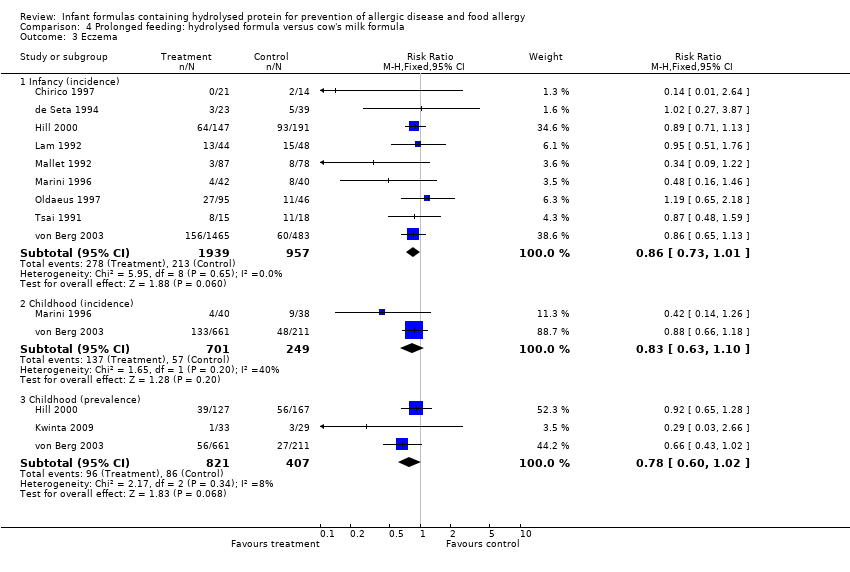
Comparison 4 Prolonged feeding: hydrolysed formula versus cow's milk formula, Outcome 3 Eczema.

Comparison 4 Prolonged feeding: hydrolysed formula versus cow's milk formula, Outcome 4 Rhinitis.
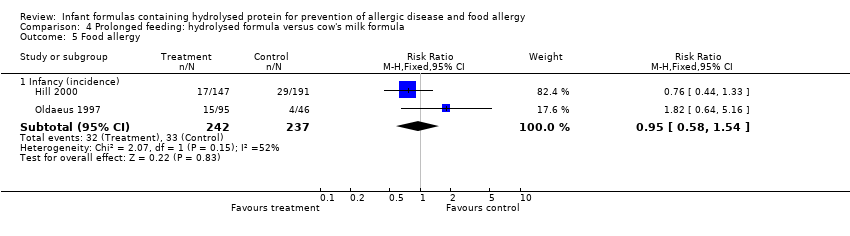
Comparison 4 Prolonged feeding: hydrolysed formula versus cow's milk formula, Outcome 5 Food allergy.

Comparison 4 Prolonged feeding: hydrolysed formula versus cow's milk formula, Outcome 6 Cow's milk allergy.
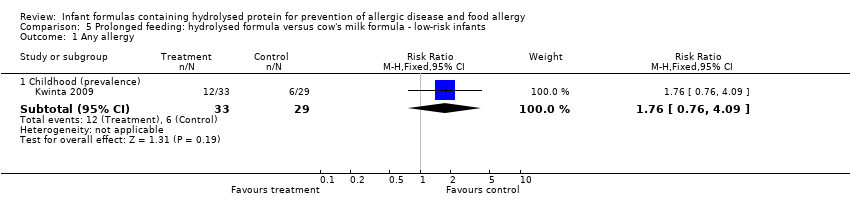
Comparison 5 Prolonged feeding: hydrolysed formula versus cow's milk formula ‐ low‐risk infants, Outcome 1 Any allergy.

Comparison 5 Prolonged feeding: hydrolysed formula versus cow's milk formula ‐ low‐risk infants, Outcome 2 Asthma.

Comparison 5 Prolonged feeding: hydrolysed formula versus cow's milk formula ‐ low‐risk infants, Outcome 3 Eczema.

Comparison 5 Prolonged feeding: hydrolysed formula versus cow's milk formula ‐ low‐risk infants, Outcome 4 Rhinitis.

Comparison 6 Prolonged feeding: hydrolysed formula versus cow's milk formula ‐ high‐risk infants, Outcome 1 Any allergy.

Comparison 6 Prolonged feeding: hydrolysed formula versus cow's milk formula ‐ high‐risk infants, Outcome 2 Asthma.

Comparison 6 Prolonged feeding: hydrolysed formula versus cow's milk formula ‐ high‐risk infants, Outcome 3 Eczema.
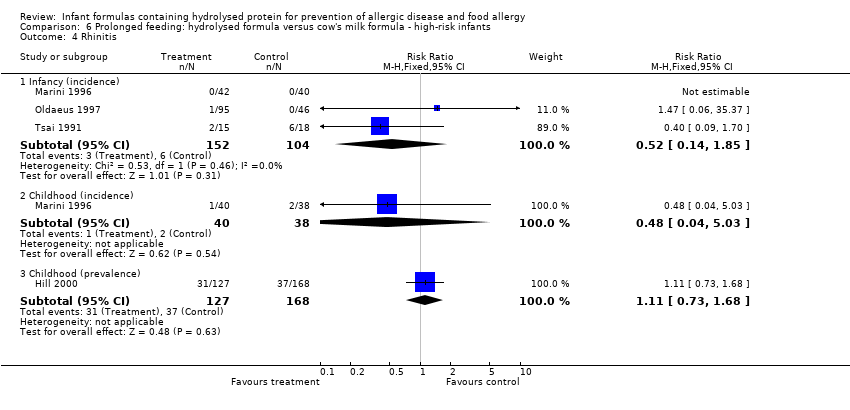
Comparison 6 Prolonged feeding: hydrolysed formula versus cow's milk formula ‐ high‐risk infants, Outcome 4 Rhinitis.
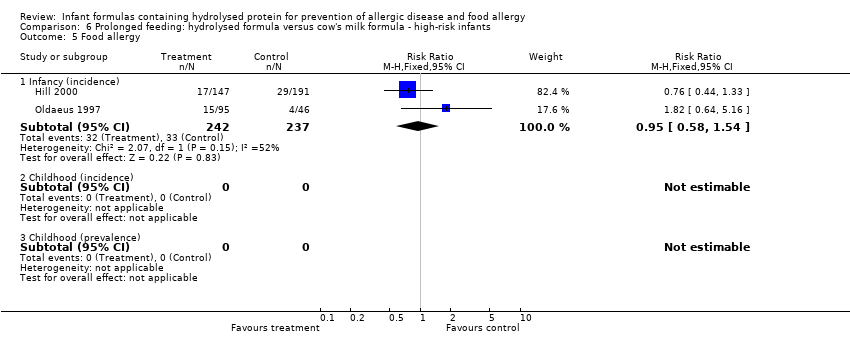
Comparison 6 Prolonged feeding: hydrolysed formula versus cow's milk formula ‐ high‐risk infants, Outcome 5 Food allergy.
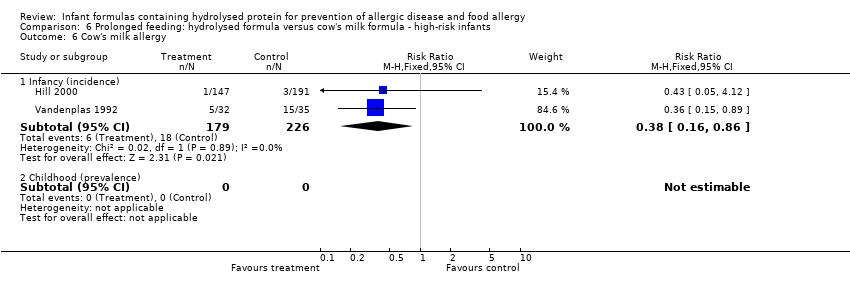
Comparison 6 Prolonged feeding: hydrolysed formula versus cow's milk formula ‐ high‐risk infants, Outcome 6 Cow's milk allergy.
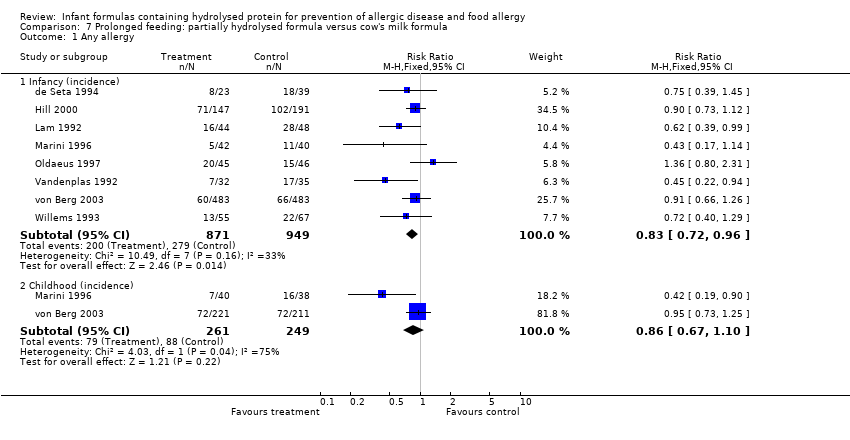
Comparison 7 Prolonged feeding: partially hydrolysed formula versus cow's milk formula, Outcome 1 Any allergy.

Comparison 7 Prolonged feeding: partially hydrolysed formula versus cow's milk formula, Outcome 2 Asthma.
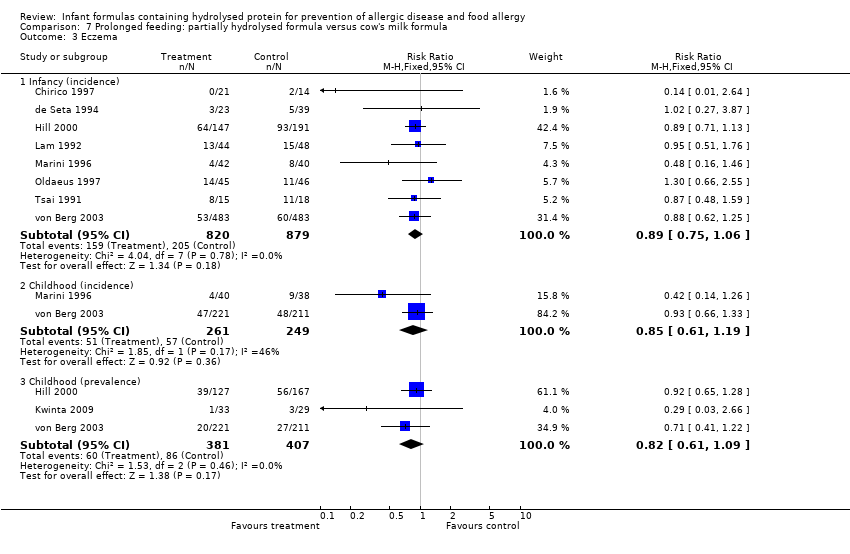
Comparison 7 Prolonged feeding: partially hydrolysed formula versus cow's milk formula, Outcome 3 Eczema.

Comparison 7 Prolonged feeding: partially hydrolysed formula versus cow's milk formula, Outcome 4 Rhinitis.

Comparison 7 Prolonged feeding: partially hydrolysed formula versus cow's milk formula, Outcome 5 Food allergy.
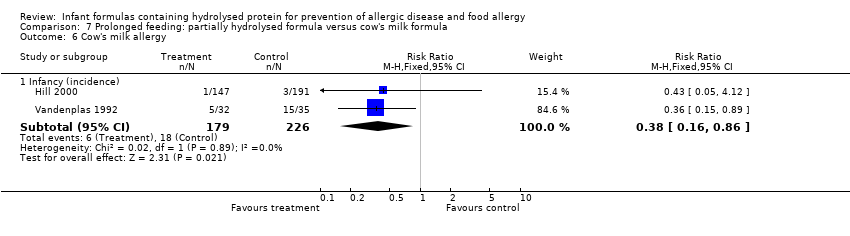
Comparison 7 Prolonged feeding: partially hydrolysed formula versus cow's milk formula, Outcome 6 Cow's milk allergy.
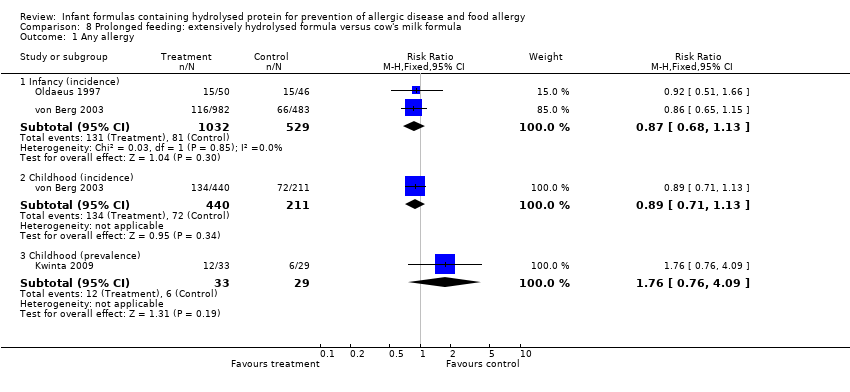
Comparison 8 Prolonged feeding: extensively hydrolysed formula versus cow's milk formula, Outcome 1 Any allergy.

Comparison 8 Prolonged feeding: extensively hydrolysed formula versus cow's milk formula, Outcome 2 Asthma.
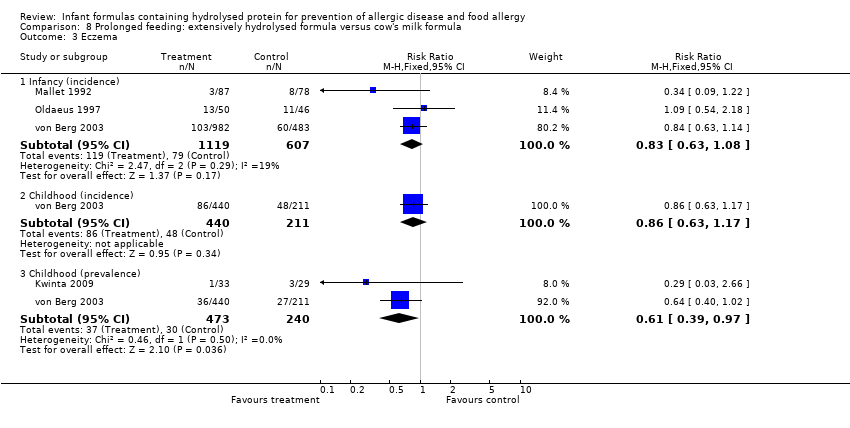
Comparison 8 Prolonged feeding: extensively hydrolysed formula versus cow's milk formula, Outcome 3 Eczema.

Comparison 8 Prolonged feeding: extensively hydrolysed formula versus cow's milk formula, Outcome 4 Rhinitis.

Comparison 8 Prolonged feeding: extensively hydrolysed formula versus cow's milk formula, Outcome 5 Food allergy.

Comparison 9 Prolonged feeding: extensively hydrolysed formula versus partially hydrolysed formula, Outcome 1 Any allergy.

Comparison 9 Prolonged feeding: extensively hydrolysed formula versus partially hydrolysed formula, Outcome 2 Asthma.

Comparison 9 Prolonged feeding: extensively hydrolysed formula versus partially hydrolysed formula, Outcome 3 Eczema.
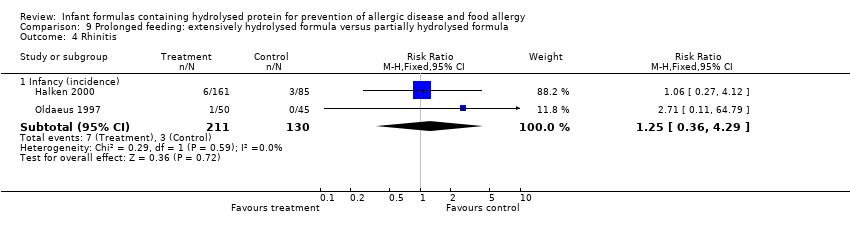
Comparison 9 Prolonged feeding: extensively hydrolysed formula versus partially hydrolysed formula, Outcome 4 Rhinitis.

Comparison 9 Prolonged feeding: extensively hydrolysed formula versus partially hydrolysed formula, Outcome 5 Food allergy.
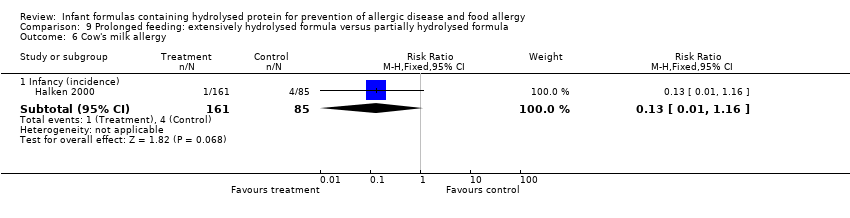
Comparison 9 Prolonged feeding: extensively hydrolysed formula versus partially hydrolysed formula, Outcome 6 Cow's milk allergy.

Comparison 9 Prolonged feeding: extensively hydrolysed formula versus partially hydrolysed formula, Outcome 7 Urticaria.

Comparison 10 Prolonged exclusive feeding: hydrolysed formula versus cow's milk formula, Outcome 1 Any allergy.
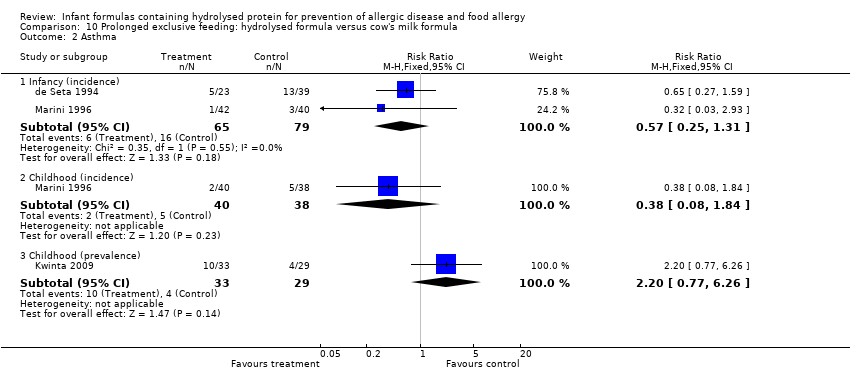
Comparison 10 Prolonged exclusive feeding: hydrolysed formula versus cow's milk formula, Outcome 2 Asthma.
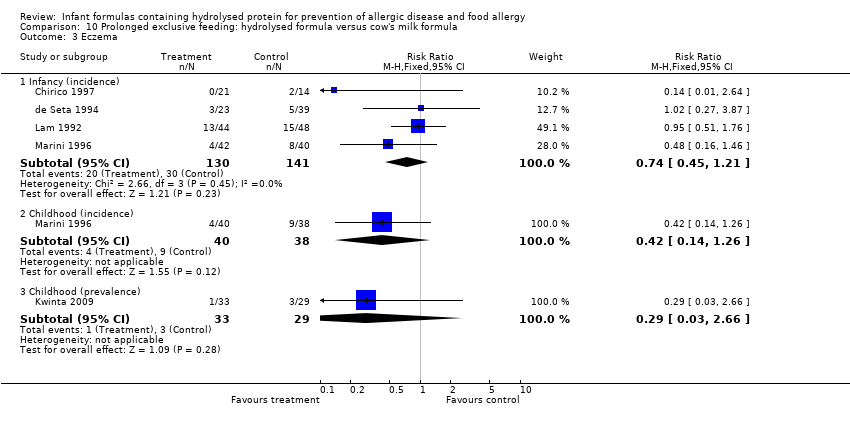
Comparison 10 Prolonged exclusive feeding: hydrolysed formula versus cow's milk formula, Outcome 3 Eczema.

Comparison 10 Prolonged exclusive feeding: hydrolysed formula versus cow's milk formula, Outcome 4 Rhinitis.
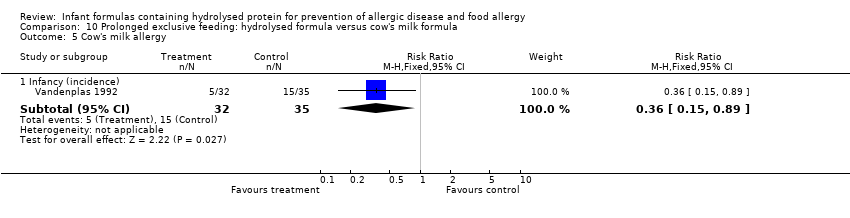
Comparison 10 Prolonged exclusive feeding: hydrolysed formula versus cow's milk formula, Outcome 5 Cow's milk allergy.

Comparison 11 Prolonged feeding: hydrolysed formula versus cow's milk formula ‐ studies with blinded measurement, Outcome 1 Any allergy.

Comparison 11 Prolonged feeding: hydrolysed formula versus cow's milk formula ‐ studies with blinded measurement, Outcome 2 Asthma.
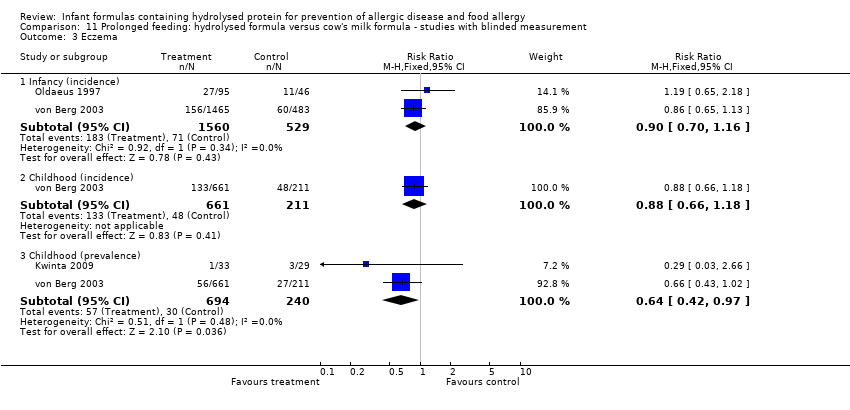
Comparison 11 Prolonged feeding: hydrolysed formula versus cow's milk formula ‐ studies with blinded measurement, Outcome 3 Eczema.
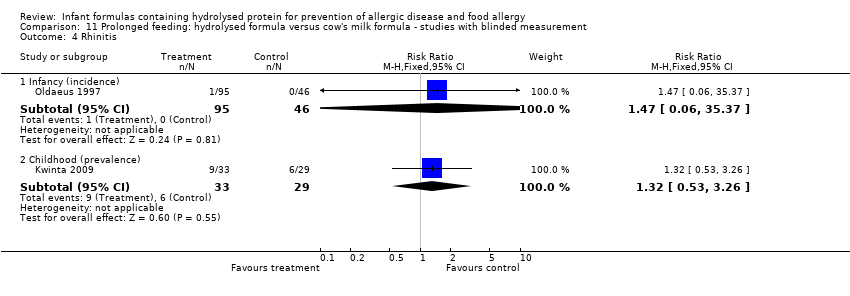
Comparison 11 Prolonged feeding: hydrolysed formula versus cow's milk formula ‐ studies with blinded measurement, Outcome 4 Rhinitis.

Comparison 11 Prolonged feeding: hydrolysed formula versus cow's milk formula ‐ studies with blinded measurement, Outcome 5 Food allergy.

Comparison 11 Prolonged feeding: hydrolysed formula versus cow's milk formula ‐ studies with blinded measurement, Outcome 6 Cow's milk allergy.

Comparison 13 Prolonged feeding: partially hydrolysed whey formula versus cow's milk formula, Outcome 1 Any allergy.

Comparison 13 Prolonged feeding: partially hydrolysed whey formula versus cow's milk formula, Outcome 2 Asthma.

Comparison 13 Prolonged feeding: partially hydrolysed whey formula versus cow's milk formula, Outcome 3 Eczema.
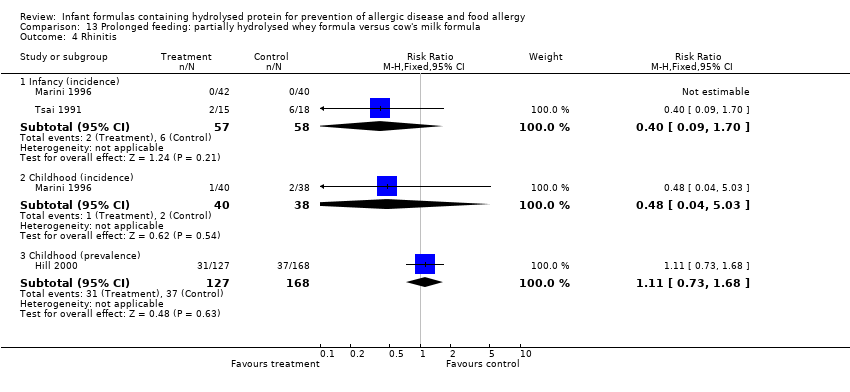
Comparison 13 Prolonged feeding: partially hydrolysed whey formula versus cow's milk formula, Outcome 4 Rhinitis.

Comparison 13 Prolonged feeding: partially hydrolysed whey formula versus cow's milk formula, Outcome 5 Food allergy.

Comparison 13 Prolonged feeding: partially hydrolysed whey formula versus cow's milk formula, Outcome 6 Cow's milk allergy.

Comparison 14 Prolonged feeding: partially hydrolysed casein‐containing formula versus cow's milk formula, Outcome 1 Any allergy.

Comparison 14 Prolonged feeding: partially hydrolysed casein‐containing formula versus cow's milk formula, Outcome 2 Asthma.
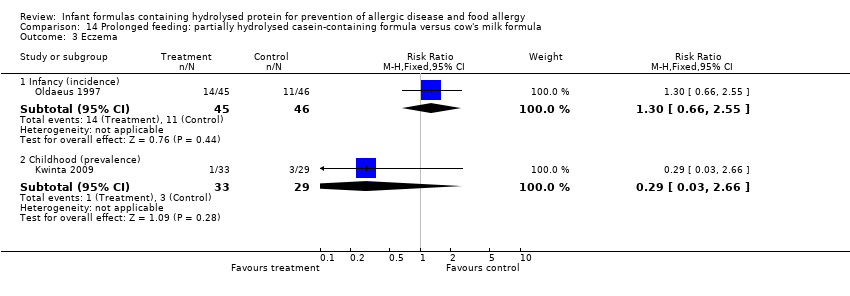
Comparison 14 Prolonged feeding: partially hydrolysed casein‐containing formula versus cow's milk formula, Outcome 3 Eczema.
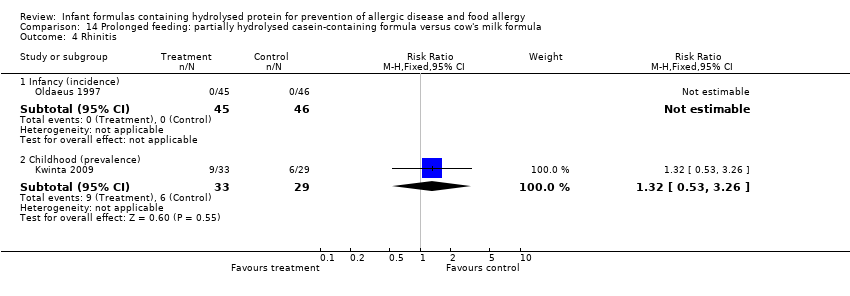
Comparison 14 Prolonged feeding: partially hydrolysed casein‐containing formula versus cow's milk formula, Outcome 4 Rhinitis.

Comparison 14 Prolonged feeding: partially hydrolysed casein‐containing formula versus cow's milk formula, Outcome 5 Food allergy.

Comparison 15 Prolonged feeding: extensively hydrolysed whey formula versus cow's milk formula, Outcome 1 Any allergy.

Comparison 15 Prolonged feeding: extensively hydrolysed whey formula versus cow's milk formula, Outcome 2 Asthma.
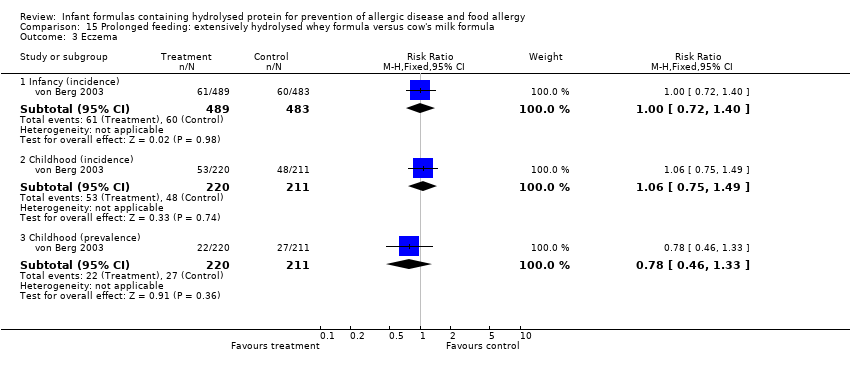
Comparison 15 Prolonged feeding: extensively hydrolysed whey formula versus cow's milk formula, Outcome 3 Eczema.
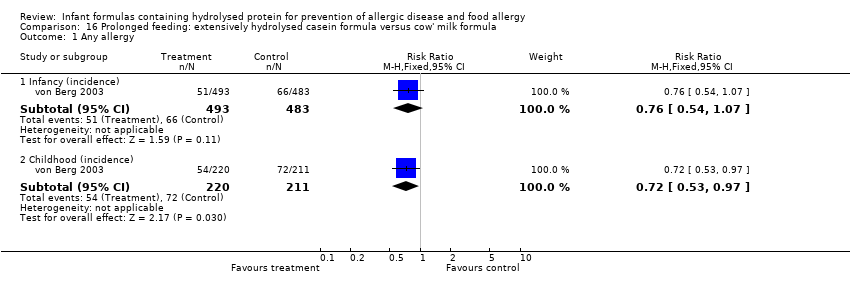
Comparison 16 Prolonged feeding: extensively hydrolysed casein formula versus cow' milk formula, Outcome 1 Any allergy.

Comparison 16 Prolonged feeding: extensively hydrolysed casein formula versus cow' milk formula, Outcome 2 Asthma.

Comparison 16 Prolonged feeding: extensively hydrolysed casein formula versus cow' milk formula, Outcome 3 Eczema.
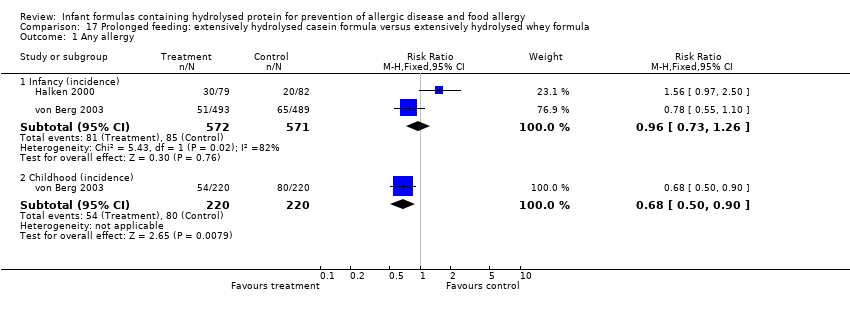
Comparison 17 Prolonged feeding: extensively hydrolysed casein formula versus extensively hydrolysed whey formula, Outcome 1 Any allergy.
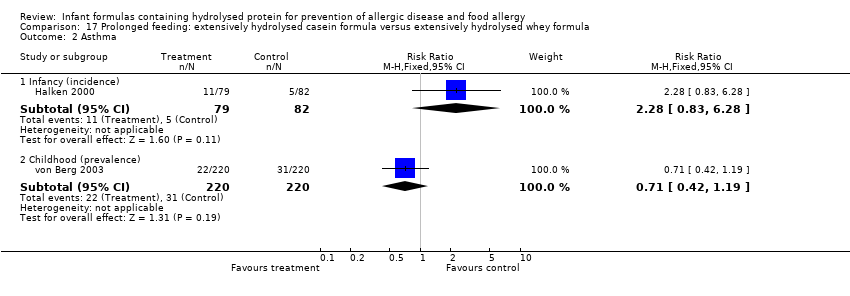
Comparison 17 Prolonged feeding: extensively hydrolysed casein formula versus extensively hydrolysed whey formula, Outcome 2 Asthma.

Comparison 17 Prolonged feeding: extensively hydrolysed casein formula versus extensively hydrolysed whey formula, Outcome 3 Eczema.
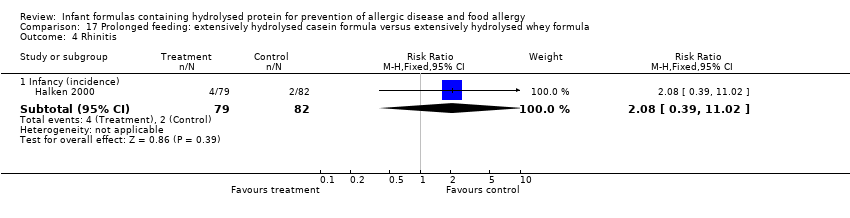
Comparison 17 Prolonged feeding: extensively hydrolysed casein formula versus extensively hydrolysed whey formula, Outcome 4 Rhinitis.

Comparison 17 Prolonged feeding: extensively hydrolysed casein formula versus extensively hydrolysed whey formula, Outcome 5 Food allergy.
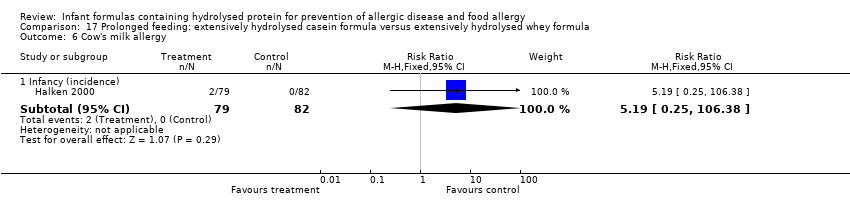
Comparison 17 Prolonged feeding: extensively hydrolysed casein formula versus extensively hydrolysed whey formula, Outcome 6 Cow's milk allergy.

Comparison 17 Prolonged feeding: extensively hydrolysed casein formula versus extensively hydrolysed whey formula, Outcome 7 Urticaria.
| Early short‐term feeding of hydrolysed formula versus human milk for prevention of allergic disease and food allergy | ||||||
| Patient or population: infants not selected for allergy risk | ||||||
| Outcomes | Illustrative comparative risks* (95% CI) | Relative effect | Number of participants | Quality of the evidence | Comments | |
| Assumed risk | Corresponding risk | |||||
| Control | Early short‐term feeding: hydrolysed formula vs human milk ‐ low‐risk infants | |||||
| Any allergy ‐ childhood (incidence) | Study population | RR 1.43 | 90 | ⊕⊝⊝⊝ | ||
| 75 per 1000 | 108 per 1000 | |||||
| Moderate | ||||||
| 76 per 1000 | 109 per 1000 | |||||
| Asthma ‐ childhood (incidence) | Study population | RR 0.48 | 90 | ⊕⊝⊝⊝ | ||
| 57 per 1000 | 27 per 1000 | |||||
| Moderate | ||||||
| 57 per 1000 | 27 per 1000 | |||||
| Eczema ‐ childhood (incidence) | Study population | RR 0.48 | 90 | ⊕⊝⊝⊝ | ||
| 57 per 1000 | 27 per 1000 | |||||
| Moderate | ||||||
| 57 per 1000 | 27 per 1000 | |||||
| Food allergy ‐ childhood (incidence) | Study population | RR 1.43 | 90 | ⊕⊝⊝⊝ | ||
| 75 per 1000 | 108 per 1000 | |||||
| Moderate | ||||||
| 76 per 1000 | 109 per 1000 | |||||
| Cow's milk allergy ‐ infancy (incidence) | Study population | RR 0.87 | 3559 | ⊕⊝⊝⊝ | ||
| 17 per 1000 | 15 per 1000 | |||||
| Moderate | ||||||
| 17 per 1000 | 15 per 1000 | |||||
| Cow's milk allergy ‐ childhood (incidence) | Study population | RR 7.11 | 90 | ⊕⊝⊝⊝ | ||
| 0 per 1000 | 0 per 1000 | |||||
| Moderate | ||||||
| 0 per 1000 | 0 per 1000 | |||||
| *The basis for the assumed risk (e.g. median control group risk across studies) is provided in footnotes. The corresponding risk (and its 95% confidence interval) is based on the assumed risk in the comparison group and the relative effect of the intervention (and its 95% CI) | ||||||
| GRADE Working Group grades of evidence | ||||||
| aMethodological concerns including quasi‐random sequence allocation, incomplete outcome data and imbalances at baseline | ||||||
| Early short‐term feeding of hydrolysed formula versus cow's milk formula for prevention of allergic disease and food allergy | ||||||
| Patient or population: infants not selected for allergy risk | ||||||
| Outcomes | Illustrative comparative risks* (95% CI) | Relative effect | Number of participants | Quality of the evidence | Comments | |
| Assumed risk | Corresponding risk | |||||
| Control | Early short‐term feeding: hydrolysed formula vs cow's milk formula ‐ low‐risk infants | |||||
| Any allergy ‐ childhood (incidence) | Study population | RR 1.37 | 77 | ⊕⊝⊝⊝ | ||
| 77 per 1000 | 105 per 1000 | |||||
| Moderate | ||||||
| 77 per 1000 | 105 per 1000 | |||||
| Asthma ‐ childhood (incidence) | Study population | RR 3.08 | 77 | ⊕⊝⊝⊝ | ||
| 0 per 1000 | 0 per 1000 | |||||
| Moderate | ||||||
| 0 per 1000 | 0 per 1000 | |||||
| Eczema ‐ childhood (incidence) | Study population | RR 0.34 | 77 | ⊕⊝⊝⊝ | ||
| 77 per 1000 | 26 per 1000 | |||||
| Moderate | ||||||
| 77 per 1000 | 26 per 1000 | |||||
| Food allergy ‐ childhood (incidence) | Study population | RR 1.37 | 77 | ⊕⊝⊝⊝ | ||
| 77 per 1000 | 105 per 1000 | |||||
| Moderate | ||||||
| 77 per 1000 | 105 per 1000 | |||||
| Cow's milk allergy ‐ infancy (incidence) | Study population | RR 0.62 | 3473 | ⊕⊝⊝⊝ | ||
| 24 per 1000 | 15 per 1000 | |||||
| Moderate | ||||||
| 25 per 1000 | 15 per 1000 | |||||
| Cow's milk allergy ‐ childhood (incidence) | Study population | RR 5.13 | 77 | ⊕⊝⊝⊝ | ||
| 0 per 1000 | 0 per 1000 | |||||
| Moderate | ||||||
| 0 per 1000 | 0 per 1000 | |||||
| *The basis for the assumed risk (e.g. median control group risk across studies) is provided in footnotes. The corresponding risk (and its 95% confidence interval) is based on the assumed risk in the comparison group and the relative effect of the intervention (and its 95% CI) | ||||||
| GRADE Working Group grades of evidence | ||||||
| aMethodological concerns including quasi‐random sequence allocation, incomplete outcome data and imbalances at baseline | ||||||
| Prolonged feeding of hydrolysed formula versus cow's milk formula for prevention of allergic disease and food allergy | ||||||
| Patient or population: infants | ||||||
| Outcomes | Illustrative comparative risks* (95% CI) | Relative effect | Number of participants | Quality of the evidence | Comments | |
| Assumed risk | Corresponding risk | |||||
| Control | Prolonged feeding: hydrolysed formula vs cow's milk formula | |||||
| Any allergy ‐ infancy (incidence) | Study population | RR 0.82 | 2852 | ⊕⊝⊝⊝ | ||
| 294 per 1000 | 241 per 1000 | |||||
| Moderate | ||||||
| 395 per 1000 | 324 per 1000 | |||||
| Any allergy ‐ childhood (incidence) | Study population | RR 0.85 | 950 | ⊕⊝⊝⊝ | ||
| 353 per 1000 | 300 per 1000 | |||||
| Moderate | ||||||
| 381 per 1000 | 324 per 1000 | |||||
| Asthma ‐ infancy (incidence) | Study population | RR 0.57 | 318 | ⊕⊝⊝⊝ | ||
| 175 per 1000 | 100 per 1000 | |||||
| Moderate | ||||||
| 149 per 1000 | 85 per 1000 | |||||
| Eczema ‐ infancy (incidence) | Study population | RR 0.86 | 2896 | ⊕⊝⊝⊝ | ||
| 223 per 1000 | 191 per 1000 | |||||
| Moderate | ||||||
| 200 per 1000 | 172 per 1000 | |||||
| Rhinitis ‐ infancy (incidence) | Study population | RR 0.52 | 256 | ⊕⊝⊝⊝ | ||
| 58 per 1000 | 30 per 1000 | |||||
| Moderate | ||||||
| 0 per 1000 | 0 per 1000 | |||||
| Food allergy ‐ infancy (incidence) | Study population | RR 0.95 | 479 | ⊕⊝⊝⊝ | ||
| 139 per 1000 | 132 per 1000 | |||||
| Moderate | ||||||
| 119 per 1000 | 113 per 1000 | |||||
| Cow's milk allergy ‐ infancy (incidence) | Study population | RR 0.38 | 405 | ⊕⊝⊝⊝ | ||
| 80 per 1000 | 30 per 1000 | |||||
| Moderate | ||||||
| 222 per 1000 | 84 per 1000 | |||||
| *The basis for the assumed risk (e.g. median control group risk across studies) is provided in footnotes. The corresponding risk (and its 95% confidence interval) is based on the assumed risk in the comparison group and the relative effect of the intervention (and its 95% CI) | ||||||
| GRADE Working Group grades of evidence | ||||||
| aSubstantial methodological concerns. Sensitivity analysis found no study considered at low risk of bias | ||||||
| Outcome or subgroup title | No. of studies | No. of participants | Statistical method | Effect size |
| 1 Any allergy Show forest plot | 1 | Risk Ratio (M‐H, Fixed, 95% CI) | Subtotals only | |
| 1.1 Childhood (incidence) | 1 | 90 | Risk Ratio (M‐H, Fixed, 95% CI) | 1.43 [0.38, 5.37] |
| 2 Asthma Show forest plot | 1 | Risk Ratio (M‐H, Fixed, 95% CI) | Subtotals only | |
| 2.1 Childhood (incidence) | 1 | 90 | Risk Ratio (M‐H, Fixed, 95% CI) | 0.48 [0.05, 4.41] |
| 3 Eczema Show forest plot | 1 | Risk Ratio (M‐H, Fixed, 95% CI) | Subtotals only | |
| 3.1 Childhood (incidence) | 1 | 90 | Risk Ratio (M‐H, Fixed, 95% CI) | 0.48 [0.05, 4.41] |
| 4 Food allergy Show forest plot | 1 | Risk Ratio (M‐H, Fixed, 95% CI) | Subtotals only | |
| 4.1 Childhood (incidence) | 1 | 90 | Risk Ratio (M‐H, Fixed, 95% CI) | 1.43 [0.38, 5.37] |
| 5 Cow's milk allergy Show forest plot | 2 | Risk Ratio (M‐H, Fixed, 95% CI) | Subtotals only | |
| 5.1 Infancy (incidence) | 1 | 3559 | Risk Ratio (M‐H, Fixed, 95% CI) | 0.87 [0.52, 1.46] |
| 5.2 Childhood (incidence) | 1 | 90 | Risk Ratio (M‐H, Fixed, 95% CI) | 7.11 [0.35, 143.84] |
| Outcome or subgroup title | No. of studies | No. of participants | Statistical method | Effect size |
| 1 Any allergy Show forest plot | 1 | Risk Ratio (M‐H, Fixed, 95% CI) | Subtotals only | |
| 1.1 Childhood (incidence) | 1 | 77 | Risk Ratio (M‐H, Fixed, 95% CI) | 1.37 [0.33, 5.71] |
| 2 Asthma Show forest plot | 1 | Risk Ratio (M‐H, Fixed, 95% CI) | Subtotals only | |
| 2.1 Childhood (incidence) | 1 | 77 | Risk Ratio (M‐H, Fixed, 95% CI) | 3.08 [0.13, 73.26] |
| 3 Eczema Show forest plot | 1 | Risk Ratio (M‐H, Fixed, 95% CI) | Subtotals only | |
| 3.1 Childhood (incidence) | 1 | 77 | Risk Ratio (M‐H, Fixed, 95% CI) | 0.34 [0.04, 3.15] |
| 4 Food allergy Show forest plot | 1 | Risk Ratio (M‐H, Fixed, 95% CI) | Subtotals only | |
| 4.1 Childhood (incidence) | 1 | 77 | Risk Ratio (M‐H, Fixed, 95% CI) | 1.37 [0.33, 5.71] |
| 5 Cow's milk allergy Show forest plot | 2 | Risk Ratio (M‐H, Fixed, 95% CI) | Subtotals only | |
| 5.1 Infancy (incidence) | 1 | 3473 | Risk Ratio (M‐H, Fixed, 95% CI) | 0.62 [0.38, 1.00] |
| 5.2 Childhood (incidence) | 1 | 77 | Risk Ratio (M‐H, Fixed, 95% CI) | 5.13 [0.25, 103.43] |
| Outcome or subgroup title | No. of studies | No. of participants | Statistical method | Effect size |
| 1 Any allergy Show forest plot | 9 | Risk Ratio (M‐H, Fixed, 95% CI) | Subtotals only | |
| 1.1 Infancy (incidence) | 8 | 2852 | Risk Ratio (M‐H, Fixed, 95% CI) | 0.82 [0.72, 0.95] |
| 1.2 Childhood (incidence) | 2 | 950 | Risk Ratio (M‐H, Fixed, 95% CI) | 0.85 [0.69, 1.05] |
| 1.3 Childhood (prevalence) | 1 | 62 | Risk Ratio (M‐H, Fixed, 95% CI) | 1.76 [0.76, 4.09] |
| 2 Asthma Show forest plot | 7 | Risk Ratio (M‐H, Fixed, 95% CI) | Subtotals only | |
| 2.1 Infancy (incidence) | 4 | 318 | Risk Ratio (M‐H, Fixed, 95% CI) | 0.57 [0.31, 1.04] |
| 2.2 Childhood (incidence) | 1 | 78 | Risk Ratio (M‐H, Fixed, 95% CI) | 0.38 [0.08, 1.84] |
| 2.3 Childhood (prevalence) | 3 | 1229 | Risk Ratio (M‐H, Fixed, 95% CI) | 1.15 [0.89, 1.50] |
| 3 Eczema Show forest plot | 10 | Risk Ratio (M‐H, Fixed, 95% CI) | Subtotals only | |
| 3.1 Infancy (incidence) | 9 | 2896 | Risk Ratio (M‐H, Fixed, 95% CI) | 0.86 [0.73, 1.01] |
| 3.2 Childhood (incidence) | 2 | 950 | Risk Ratio (M‐H, Fixed, 95% CI) | 0.83 [0.63, 1.10] |
| 3.3 Childhood (prevalence) | 3 | 1228 | Risk Ratio (M‐H, Fixed, 95% CI) | 0.78 [0.60, 1.02] |
| 4 Rhinitis Show forest plot | 5 | Risk Ratio (M‐H, Fixed, 95% CI) | Subtotals only | |
| 4.1 Infancy (incidence) | 3 | 256 | Risk Ratio (M‐H, Fixed, 95% CI) | 0.52 [0.14, 1.85] |
| 4.2 Childhood (incidence) | 1 | 78 | Risk Ratio (M‐H, Fixed, 95% CI) | 0.48 [0.04, 5.03] |
| 4.3 Childhood (prevalence) | 2 | 357 | Risk Ratio (M‐H, Fixed, 95% CI) | 1.14 [0.78, 1.67] |
| 5 Food allergy Show forest plot | 2 | Risk Ratio (M‐H, Fixed, 95% CI) | Subtotals only | |
| 5.1 Infancy (incidence) | 2 | 479 | Risk Ratio (M‐H, Fixed, 95% CI) | 0.95 [0.58, 1.54] |
| 6 Cow's milk allergy Show forest plot | 2 | Risk Ratio (M‐H, Fixed, 95% CI) | Subtotals only | |
| 6.1 Infancy (incidence) | 2 | 405 | Risk Ratio (M‐H, Fixed, 95% CI) | 0.38 [0.16, 0.86] |
| Outcome or subgroup title | No. of studies | No. of participants | Statistical method | Effect size |
| 1 Any allergy Show forest plot | 1 | Risk Ratio (M‐H, Fixed, 95% CI) | Subtotals only | |
| 1.1 Childhood (prevalence) | 1 | 62 | Risk Ratio (M‐H, Fixed, 95% CI) | 1.76 [0.76, 4.09] |
| 2 Asthma Show forest plot | 1 | Risk Ratio (M‐H, Fixed, 95% CI) | Subtotals only | |
| 2.1 Childhood (prevalence) | 1 | 62 | Risk Ratio (M‐H, Fixed, 95% CI) | 2.20 [0.77, 6.26] |
| 3 Eczema Show forest plot | 1 | Risk Ratio (M‐H, Fixed, 95% CI) | Subtotals only | |
| 3.1 Childhood (prevalence) | 1 | 62 | Risk Ratio (M‐H, Fixed, 95% CI) | 0.29 [0.03, 2.66] |
| 4 Rhinitis Show forest plot | 1 | Risk Ratio (M‐H, Fixed, 95% CI) | Subtotals only | |
| 4.1 Childhood (prevalence) | 1 | 62 | Risk Ratio (M‐H, Fixed, 95% CI) | 1.32 [0.53, 3.26] |
| Outcome or subgroup title | No. of studies | No. of participants | Statistical method | Effect size |
| 1 Any allergy Show forest plot | 8 | Risk Ratio (M‐H, Fixed, 95% CI) | Subtotals only | |
| 1.1 Infancy (incidence) | 8 | 2852 | Risk Ratio (M‐H, Fixed, 95% CI) | 0.82 [0.72, 0.95] |
| 1.2 Childhood (incidence) | 2 | 950 | Risk Ratio (M‐H, Fixed, 95% CI) | 0.85 [0.69, 1.05] |
| 2 Asthma Show forest plot | 6 | Risk Ratio (M‐H, Fixed, 95% CI) | Subtotals only | |
| 2.1 Infancy (incidence) | 4 | 318 | Risk Ratio (M‐H, Fixed, 95% CI) | 0.57 [0.31, 1.04] |
| 2.2 Childhood (incidence) | 1 | 78 | Risk Ratio (M‐H, Fixed, 95% CI) | 0.38 [0.08, 1.84] |
| 2.3 Childhood (prevalence) | 2 | 1167 | Risk Ratio (M‐H, Fixed, 95% CI) | 1.09 [0.83, 1.44] |
| 3 Eczema Show forest plot | 9 | Risk Ratio (M‐H, Fixed, 95% CI) | Subtotals only | |
| 3.1 Infancy (incidence) | 9 | 2896 | Risk Ratio (M‐H, Fixed, 95% CI) | 0.86 [0.73, 1.01] |
| 3.2 Childhood (incidence) | 2 | 950 | Risk Ratio (M‐H, Fixed, 95% CI) | 0.83 [0.63, 1.10] |
| 3.3 Childhood (prevalence) | 2 | 1166 | Risk Ratio (M‐H, Fixed, 95% CI) | 0.80 [0.61, 1.04] |
| 4 Rhinitis Show forest plot | 4 | Risk Ratio (M‐H, Fixed, 95% CI) | Subtotals only | |
| 4.1 Infancy (incidence) | 3 | 256 | Risk Ratio (M‐H, Fixed, 95% CI) | 0.52 [0.14, 1.85] |
| 4.2 Childhood (incidence) | 1 | 78 | Risk Ratio (M‐H, Fixed, 95% CI) | 0.48 [0.04, 5.03] |
| 4.3 Childhood (prevalence) | 1 | 295 | Risk Ratio (M‐H, Fixed, 95% CI) | 1.11 [0.73, 1.68] |
| 5 Food allergy Show forest plot | 2 | Risk Ratio (M‐H, Fixed, 95% CI) | Subtotals only | |
| 5.1 Infancy (incidence) | 2 | 479 | Risk Ratio (M‐H, Fixed, 95% CI) | 0.95 [0.58, 1.54] |
| 5.2 Childhood (incidence) | 0 | 0 | Risk Ratio (M‐H, Fixed, 95% CI) | 0.0 [0.0, 0.0] |
| 5.3 Childhood (prevalence) | 0 | 0 | Risk Ratio (M‐H, Fixed, 95% CI) | 0.0 [0.0, 0.0] |
| 6 Cow's milk allergy Show forest plot | 2 | Risk Ratio (M‐H, Fixed, 95% CI) | Subtotals only | |
| 6.1 Infancy (incidence) | 2 | 405 | Risk Ratio (M‐H, Fixed, 95% CI) | 0.38 [0.16, 0.86] |
| 6.2 Childhood (prevalence) | 0 | 0 | Risk Ratio (M‐H, Fixed, 95% CI) | 0.0 [0.0, 0.0] |
| Outcome or subgroup title | No. of studies | No. of participants | Statistical method | Effect size |
| 1 Any allergy Show forest plot | 8 | Risk Ratio (M‐H, Fixed, 95% CI) | Subtotals only | |
| 1.1 Infancy (incidence) | 8 | 1820 | Risk Ratio (M‐H, Fixed, 95% CI) | 0.83 [0.72, 0.96] |
| 1.2 Childhood (incidence) | 2 | 510 | Risk Ratio (M‐H, Fixed, 95% CI) | 0.86 [0.67, 1.10] |
| 2 Asthma Show forest plot | 7 | Risk Ratio (M‐H, Fixed, 95% CI) | Subtotals only | |
| 2.1 Infancy (incidence) | 4 | 268 | Risk Ratio (M‐H, Fixed, 95% CI) | 0.54 [0.28, 1.04] |
| 2.2 Childhood (incidence) | 1 | 78 | Risk Ratio (M‐H, Fixed, 95% CI) | 0.38 [0.08, 1.84] |
| 2.3 Childhood (prevalence) | 3 | 789 | Risk Ratio (M‐H, Fixed, 95% CI) | 1.20 [0.91, 1.58] |
| 3 Eczema Show forest plot | 9 | Risk Ratio (M‐H, Fixed, 95% CI) | Subtotals only | |
| 3.1 Infancy (incidence) | 8 | 1699 | Risk Ratio (M‐H, Fixed, 95% CI) | 0.89 [0.75, 1.06] |
| 3.2 Childhood (incidence) | 2 | 510 | Risk Ratio (M‐H, Fixed, 95% CI) | 0.85 [0.61, 1.19] |
| 3.3 Childhood (prevalence) | 3 | 788 | Risk Ratio (M‐H, Fixed, 95% CI) | 0.82 [0.61, 1.09] |
| 4 Rhinitis Show forest plot | 5 | Risk Ratio (M‐H, Fixed, 95% CI) | Subtotals only | |
| 4.1 Infancy (incidence) | 3 | 206 | Risk Ratio (M‐H, Fixed, 95% CI) | 0.4 [0.09, 1.70] |
| 4.2 Childhood (incidence) | 1 | 78 | Risk Ratio (M‐H, Fixed, 95% CI) | 0.48 [0.04, 5.03] |
| 4.3 Childhood (prevalence) | 2 | 357 | Risk Ratio (M‐H, Fixed, 95% CI) | 1.14 [0.78, 1.67] |
| 5 Food allergy Show forest plot | 2 | Risk Ratio (M‐H, Fixed, 95% CI) | Subtotals only | |
| 5.1 Infancy (incidence) | 2 | 429 | Risk Ratio (M‐H, Fixed, 95% CI) | 1.00 [0.62, 1.63] |
| 6 Cow's milk allergy Show forest plot | 2 | Risk Ratio (M‐H, Fixed, 95% CI) | Subtotals only | |
| 6.1 Infancy (incidence) | 2 | 405 | Risk Ratio (M‐H, Fixed, 95% CI) | 0.38 [0.16, 0.86] |
| Outcome or subgroup title | No. of studies | No. of participants | Statistical method | Effect size |
| 1 Any allergy Show forest plot | 3 | Risk Ratio (M‐H, Fixed, 95% CI) | Subtotals only | |
| 1.1 Infancy (incidence) | 2 | 1561 | Risk Ratio (M‐H, Fixed, 95% CI) | 0.87 [0.68, 1.13] |
| 1.2 Childhood (incidence) | 1 | 651 | Risk Ratio (M‐H, Fixed, 95% CI) | 0.89 [0.71, 1.13] |
| 1.3 Childhood (prevalence) | 1 | 62 | Risk Ratio (M‐H, Fixed, 95% CI) | 1.76 [0.76, 4.09] |
| 2 Asthma Show forest plot | 3 | Risk Ratio (M‐H, Fixed, 95% CI) | Subtotals only | |
| 2.1 Infancy (incidence) | 1 | 96 | Risk Ratio (M‐H, Fixed, 95% CI) | 0.61 [0.18, 2.04] |
| 2.2 Childhood (prevalence) | 2 | 713 | Risk Ratio (M‐H, Fixed, 95% CI) | 1.15 [0.76, 1.72] |
| 3 Eczema Show forest plot | 4 | Risk Ratio (M‐H, Fixed, 95% CI) | Subtotals only | |
| 3.1 Infancy (incidence) | 3 | 1726 | Risk Ratio (M‐H, Fixed, 95% CI) | 0.83 [0.63, 1.08] |
| 3.2 Childhood (incidence) | 1 | 651 | Risk Ratio (M‐H, Fixed, 95% CI) | 0.86 [0.63, 1.17] |
| 3.3 Childhood (prevalence) | 2 | 713 | Risk Ratio (M‐H, Fixed, 95% CI) | 0.61 [0.39, 0.97] |
| 4 Rhinitis Show forest plot | 2 | Risk Ratio (M‐H, Fixed, 95% CI) | Subtotals only | |
| 4.1 Infancy (incidence) | 1 | 96 | Risk Ratio (M‐H, Fixed, 95% CI) | 2.76 [0.12, 66.22] |
| 4.2 Childhood (prevalence) | 1 | 62 | Risk Ratio (M‐H, Fixed, 95% CI) | 1.32 [0.53, 3.26] |
| 5 Food allergy Show forest plot | 1 | Risk Ratio (M‐H, Fixed, 95% CI) | Subtotals only | |
| 5.1 Infancy (incidence) | 1 | 96 | Risk Ratio (M‐H, Fixed, 95% CI) | 1.15 [0.33, 4.02] |
| Outcome or subgroup title | No. of studies | No. of participants | Statistical method | Effect size |
| 1 Any allergy Show forest plot | 3 | Risk Ratio (M‐H, Fixed, 95% CI) | Subtotals only | |
| 1.1 Infancy (incidence) | 3 | 1806 | Risk Ratio (M‐H, Fixed, 95% CI) | 0.93 [0.75, 1.16] |
| 1.2 Childhood (incidence) | 1 | 661 | Risk Ratio (M‐H, Fixed, 95% CI) | 0.93 [0.74, 1.18] |
| 2 Asthma Show forest plot | 3 | Risk Ratio (M‐H, Fixed, 95% CI) | Subtotals only | |
| 2.1 Infancy (incidence) | 2 | 341 | Risk Ratio (M‐H, Fixed, 95% CI) | 1.72 [0.74, 3.96] |
| 2.2 Childhood (prevalence) | 1 | 661 | Risk Ratio (M‐H, Fixed, 95% CI) | 0.89 [0.58, 1.35] |
| 3 Eczema Show forest plot | 4 | Risk Ratio (M‐H, Fixed, 95% CI) | Subtotals only | |
| 3.1 Infancy (incidence) | 4 | 1865 | Risk Ratio (M‐H, Fixed, 95% CI) | 0.89 [0.73, 1.10] |
| 3.2 Childhood (incidence) | 1 | 661 | Risk Ratio (M‐H, Fixed, 95% CI) | 0.92 [0.67, 1.26] |
| 3.3 Childhood (prevalence) | 1 | 661 | Risk Ratio (M‐H, Fixed, 95% CI) | 0.90 [0.54, 1.52] |
| 4 Rhinitis Show forest plot | 2 | Risk Ratio (M‐H, Fixed, 95% CI) | Subtotals only | |
| 4.1 Infancy (incidence) | 2 | 341 | Risk Ratio (M‐H, Fixed, 95% CI) | 1.25 [0.36, 4.29] |
| 5 Food allergy Show forest plot | 2 | Risk Ratio (M‐H, Fixed, 95% CI) | Subtotals only | |
| 5.1 Infancy (incidence) | 2 | 341 | Risk Ratio (M‐H, Fixed, 95% CI) | 0.43 [0.19, 0.99] |
| 6 Cow's milk allergy Show forest plot | 1 | Risk Ratio (M‐H, Fixed, 95% CI) | Subtotals only | |
| 6.1 Infancy (incidence) | 1 | 246 | Risk Ratio (M‐H, Fixed, 95% CI) | 0.13 [0.01, 1.16] |
| 7 Urticaria Show forest plot | 1 | Risk Ratio (M‐H, Fixed, 95% CI) | Subtotals only | |
| 7.1 Infancy (incidence) | 1 | 246 | Risk Ratio (M‐H, Fixed, 95% CI) | 1.32 [0.26, 6.66] |
| Outcome or subgroup title | No. of studies | No. of participants | Statistical method | Effect size |
| 1 Any allergy Show forest plot | 6 | Risk Ratio (M‐H, Fixed, 95% CI) | Subtotals only | |
| 1.1 Infancy (incidence) | 5 | 425 | Risk Ratio (M‐H, Fixed, 95% CI) | 0.61 [0.46, 0.80] |
| 1.2 Childhood (incidence) | 1 | 78 | Risk Ratio (M‐H, Fixed, 95% CI) | 0.42 [0.19, 0.90] |
| 1.3 Childhood (prevalence) | 1 | 62 | Risk Ratio (M‐H, Fixed, 95% CI) | 1.76 [0.76, 4.09] |
| 2 Asthma Show forest plot | 3 | Risk Ratio (M‐H, Fixed, 95% CI) | Subtotals only | |
| 2.1 Infancy (incidence) | 2 | 144 | Risk Ratio (M‐H, Fixed, 95% CI) | 0.57 [0.25, 1.31] |
| 2.2 Childhood (incidence) | 1 | 78 | Risk Ratio (M‐H, Fixed, 95% CI) | 0.38 [0.08, 1.84] |
| 2.3 Childhood (prevalence) | 1 | 62 | Risk Ratio (M‐H, Fixed, 95% CI) | 2.20 [0.77, 6.26] |
| 3 Eczema Show forest plot | 5 | Risk Ratio (M‐H, Fixed, 95% CI) | Subtotals only | |
| 3.1 Infancy (incidence) | 4 | 271 | Risk Ratio (M‐H, Fixed, 95% CI) | 0.74 [0.45, 1.21] |
| 3.2 Childhood (incidence) | 1 | 78 | Risk Ratio (M‐H, Fixed, 95% CI) | 0.42 [0.14, 1.26] |
| 3.3 Childhood (prevalence) | 1 | 62 | Risk Ratio (M‐H, Fixed, 95% CI) | 0.29 [0.03, 2.66] |
| 4 Rhinitis Show forest plot | 2 | Risk Ratio (M‐H, Fixed, 95% CI) | Subtotals only | |
| 4.1 Infancy (incidence) | 1 | 82 | Risk Ratio (M‐H, Fixed, 95% CI) | 0.0 [0.0, 0.0] |
| 4.2 Childhood (incidence) | 1 | 78 | Risk Ratio (M‐H, Fixed, 95% CI) | 0.48 [0.04, 5.03] |
| 4.3 Childhood (prevalence) | 1 | 62 | Risk Ratio (M‐H, Fixed, 95% CI) | 1.32 [0.53, 3.26] |
| 5 Cow's milk allergy Show forest plot | 1 | Risk Ratio (M‐H, Fixed, 95% CI) | Subtotals only | |
| 5.1 Infancy (incidence) | 1 | 67 | Risk Ratio (M‐H, Fixed, 95% CI) | 0.36 [0.15, 0.89] |
| Outcome or subgroup title | No. of studies | No. of participants | Statistical method | Effect size |
| 1 Any allergy Show forest plot | 4 | Risk Ratio (M‐H, Fixed, 95% CI) | Subtotals only | |
| 1.1 Infancy (incidence) | 3 | 2156 | Risk Ratio (M‐H, Fixed, 95% CI) | 0.87 [0.69, 1.08] |
| 1.2 Childhood (incidence) | 1 | 872 | Risk Ratio (M‐H, Fixed, 95% CI) | 0.91 [0.73, 1.14] |
| 1.3 Childhood (prevalence) | 1 | 62 | Risk Ratio (M‐H, Fixed, 95% CI) | 1.76 [0.76, 4.09] |
| 2 Asthma Show forest plot | 3 | Risk Ratio (M‐H, Fixed, 95% CI) | Subtotals only | |
| 2.1 Infancy (incidence) | 1 | 141 | Risk Ratio (M‐H, Fixed, 95% CI) | 0.48 [0.17, 1.42] |
| 2.2 Childhood (prevalence) | 2 | 934 | Risk Ratio (M‐H, Fixed, 95% CI) | 1.17 [0.80, 1.73] |
| 3 Eczema Show forest plot | 3 | Risk Ratio (M‐H, Fixed, 95% CI) | Subtotals only | |
| 3.1 Infancy (incidence) | 2 | 2089 | Risk Ratio (M‐H, Fixed, 95% CI) | 0.90 [0.70, 1.16] |
| 3.2 Childhood (incidence) | 1 | 872 | Risk Ratio (M‐H, Fixed, 95% CI) | 0.88 [0.66, 1.18] |
| 3.3 Childhood (prevalence) | 2 | 934 | Risk Ratio (M‐H, Fixed, 95% CI) | 0.64 [0.42, 0.97] |
| 4 Rhinitis Show forest plot | 2 | Risk Ratio (M‐H, Fixed, 95% CI) | Subtotals only | |
| 4.1 Infancy (incidence) | 1 | 141 | Risk Ratio (M‐H, Fixed, 95% CI) | 1.47 [0.06, 35.37] |
| 4.2 Childhood (prevalence) | 1 | 62 | Risk Ratio (M‐H, Fixed, 95% CI) | 1.32 [0.53, 3.26] |
| 5 Food allergy Show forest plot | 1 | Risk Ratio (M‐H, Fixed, 95% CI) | Subtotals only | |
| 5.1 Infancy (incidence) | 1 | 141 | Risk Ratio (M‐H, Fixed, 95% CI) | 1.82 [0.64, 5.16] |
| 6 Cow's milk allergy Show forest plot | 1 | Risk Ratio (M‐H, Fixed, 95% CI) | Subtotals only | |
| 6.1 Infancy (incidence) | 1 | 67 | Risk Ratio (M‐H, Fixed, 95% CI) | 0.36 [0.15, 0.89] |
| Outcome or subgroup title | No. of studies | No. of participants | Statistical method | Effect size |
| 1 Any allergy Show forest plot | 7 | Risk Ratio (M‐H, Random, 95% CI) | Subtotals only | |
| 1.1 Infancy (incidence) | 7 | 1729 | Risk Ratio (M‐H, Random, 95% CI) | 0.78 [0.66, 0.94] |
| 1.2 Childhood (incidence) | 2 | 510 | Risk Ratio (M‐H, Random, 95% CI) | 0.68 [0.31, 1.52] |
| 2 Asthma Show forest plot | 5 | Risk Ratio (M‐H, Fixed, 95% CI) | Subtotals only | |
| 2.1 Infancy (incidence) | 3 | 177 | Risk Ratio (M‐H, Fixed, 95% CI) | 0.61 [0.29, 1.28] |
| 2.2 Childhood (incidence) | 1 | 78 | Risk Ratio (M‐H, Fixed, 95% CI) | 0.38 [0.08, 1.84] |
| 2.3 Childhood (prevalence) | 2 | 727 | Risk Ratio (M‐H, Fixed, 95% CI) | 1.13 [0.85, 1.51] |
| 3 Eczema Show forest plot | 7 | Risk Ratio (M‐H, Fixed, 95% CI) | Subtotals only | |
| 3.1 Infancy (incidence) | 7 | 1608 | Risk Ratio (M‐H, Fixed, 95% CI) | 0.86 [0.72, 1.03] |
| 3.2 Childhood (incidence) | 2 | 510 | Risk Ratio (M‐H, Fixed, 95% CI) | 0.85 [0.61, 1.19] |
| 3.3 Childhood (prevalence) | 2 | 726 | Risk Ratio (M‐H, Fixed, 95% CI) | 0.84 [0.63, 1.12] |
| 4 Rhinitis Show forest plot | 3 | Risk Ratio (M‐H, Fixed, 95% CI) | Subtotals only | |
| 4.1 Infancy (incidence) | 2 | 115 | Risk Ratio (M‐H, Fixed, 95% CI) | 0.4 [0.09, 1.70] |
| 4.2 Childhood (incidence) | 1 | 78 | Risk Ratio (M‐H, Fixed, 95% CI) | 0.48 [0.04, 5.03] |
| 4.3 Childhood (prevalence) | 1 | 295 | Risk Ratio (M‐H, Fixed, 95% CI) | 1.11 [0.73, 1.68] |
| 5 Food allergy Show forest plot | 1 | Risk Ratio (M‐H, Fixed, 95% CI) | Subtotals only | |
| 5.1 Infancy (incidence) | 1 | 338 | Risk Ratio (M‐H, Fixed, 95% CI) | 0.76 [0.44, 1.33] |
| 6 Cow's milk allergy Show forest plot | 2 | Risk Ratio (M‐H, Fixed, 95% CI) | Subtotals only | |
| 6.1 Infancy (incidence) | 2 | 405 | Risk Ratio (M‐H, Fixed, 95% CI) | 0.38 [0.16, 0.86] |
| Outcome or subgroup title | No. of studies | No. of participants | Statistical method | Effect size |
| 1 Any allergy Show forest plot | 2 | Risk Ratio (M‐H, Fixed, 95% CI) | Subtotals only | |
| 1.1 Infancy (incidence) | 1 | 91 | Risk Ratio (M‐H, Fixed, 95% CI) | 1.36 [0.80, 2.31] |
| 1.2 Childhood (prevalence) | 1 | 62 | Risk Ratio (M‐H, Fixed, 95% CI) | 1.76 [0.76, 4.09] |
| 2 Asthma Show forest plot | 2 | Risk Ratio (M‐H, Fixed, 95% CI) | Subtotals only | |
| 2.1 Infancy (incidence) | 1 | 91 | Risk Ratio (M‐H, Fixed, 95% CI) | 0.34 [0.07, 1.60] |
| 2.2 Childhood (prevalence) | 1 | 62 | Risk Ratio (M‐H, Fixed, 95% CI) | 2.20 [0.77, 6.26] |
| 3 Eczema Show forest plot | 2 | Risk Ratio (M‐H, Fixed, 95% CI) | Subtotals only | |
| 3.1 Infancy (incidence) | 1 | 91 | Risk Ratio (M‐H, Fixed, 95% CI) | 1.30 [0.66, 2.55] |
| 3.2 Childhood (prevalence) | 1 | 62 | Risk Ratio (M‐H, Fixed, 95% CI) | 0.29 [0.03, 2.66] |
| 4 Rhinitis Show forest plot | 2 | Risk Ratio (M‐H, Fixed, 95% CI) | Subtotals only | |
| 4.1 Infancy (incidence) | 1 | 91 | Risk Ratio (M‐H, Fixed, 95% CI) | 0.0 [0.0, 0.0] |
| 4.2 Childhood (prevalence) | 1 | 62 | Risk Ratio (M‐H, Fixed, 95% CI) | 1.32 [0.53, 3.26] |
| 5 Food allergy Show forest plot | 1 | Risk Ratio (M‐H, Fixed, 95% CI) | Subtotals only | |
| 5.1 Infancy (incidence) | 1 | 91 | Risk Ratio (M‐H, Fixed, 95% CI) | 2.56 [0.86, 7.56] |
| Outcome or subgroup title | No. of studies | No. of participants | Statistical method | Effect size |
| 1 Any allergy Show forest plot | 1 | Risk Ratio (M‐H, Fixed, 95% CI) | Subtotals only | |
| 1.1 Infancy (incidence) | 1 | 972 | Risk Ratio (M‐H, Fixed, 95% CI) | 0.97 [0.71, 1.34] |
| 1.2 Childhood (incidence) | 1 | 431 | Risk Ratio (M‐H, Fixed, 95% CI) | 1.07 [0.82, 1.38] |
| 2 Asthma Show forest plot | 1 | Risk Ratio (M‐H, Fixed, 95% CI) | Subtotals only | |
| 2.1 Childhood (prevalence) | 1 | 431 | Risk Ratio (M‐H, Fixed, 95% CI) | 1.19 [0.73, 1.94] |
| 3 Eczema Show forest plot | 1 | Risk Ratio (M‐H, Fixed, 95% CI) | Subtotals only | |
| 3.1 Infancy (incidence) | 1 | 972 | Risk Ratio (M‐H, Fixed, 95% CI) | 1.00 [0.72, 1.40] |
| 3.2 Childhood (incidence) | 1 | 431 | Risk Ratio (M‐H, Fixed, 95% CI) | 1.06 [0.75, 1.49] |
| 3.3 Childhood (prevalence) | 1 | 431 | Risk Ratio (M‐H, Fixed, 95% CI) | 0.78 [0.46, 1.33] |
| Outcome or subgroup title | No. of studies | No. of participants | Statistical method | Effect size |
| 1 Any allergy Show forest plot | 1 | Risk Ratio (M‐H, Fixed, 95% CI) | Subtotals only | |
| 1.1 Infancy (incidence) | 1 | 976 | Risk Ratio (M‐H, Fixed, 95% CI) | 0.76 [0.54, 1.07] |
| 1.2 Childhood (incidence) | 1 | 431 | Risk Ratio (M‐H, Fixed, 95% CI) | 0.72 [0.53, 0.97] |
| 2 Asthma Show forest plot | 1 | Risk Ratio (M‐H, Fixed, 95% CI) | Subtotals only | |
| 2.1 Childhood (prevalence) | 1 | 431 | Risk Ratio (M‐H, Fixed, 95% CI) | 0.84 [0.49, 1.45] |
| 3 Eczema Show forest plot | 1 | Risk Ratio (M‐H, Fixed, 95% CI) | Subtotals only | |
| 3.1 Infancy (incidence) | 1 | 976 | Risk Ratio (M‐H, Fixed, 95% CI) | 0.69 [0.47, 1.00] |
| 3.2 Childhood (incidence) | 1 | 431 | Risk Ratio (M‐H, Fixed, 95% CI) | 0.66 [0.44, 0.98] |
| 3.3 Childhood (prevalence) | 1 | 431 | Risk Ratio (M‐H, Fixed, 95% CI) | 0.50 [0.27, 0.92] |
| Outcome or subgroup title | No. of studies | No. of participants | Statistical method | Effect size |
| 1 Any allergy Show forest plot | 2 | Risk Ratio (M‐H, Fixed, 95% CI) | Subtotals only | |
| 1.1 Infancy (incidence) | 2 | 1143 | Risk Ratio (M‐H, Fixed, 95% CI) | 0.96 [0.73, 1.26] |
| 1.2 Childhood (incidence) | 1 | 440 | Risk Ratio (M‐H, Fixed, 95% CI) | 0.68 [0.50, 0.90] |
| 2 Asthma Show forest plot | 2 | Risk Ratio (M‐H, Fixed, 95% CI) | Subtotals only | |
| 2.1 Infancy (incidence) | 1 | 161 | Risk Ratio (M‐H, Fixed, 95% CI) | 2.28 [0.83, 6.28] |
| 2.2 Childhood (prevalence) | 1 | 440 | Risk Ratio (M‐H, Fixed, 95% CI) | 0.71 [0.42, 1.19] |
| 3 Eczema Show forest plot | 2 | Risk Ratio (M‐H, Fixed, 95% CI) | Subtotals only | |
| 3.1 Infancy (incidence) | 2 | 1143 | Risk Ratio (M‐H, Fixed, 95% CI) | 0.81 [0.59, 1.10] |
| 3.2 Childhood (incidence) | 1 | 440 | Risk Ratio (M‐H, Fixed, 95% CI) | 0.62 [0.42, 0.92] |
| 3.3 Childhood (prevalence) | 1 | 440 | Risk Ratio (M‐H, Fixed, 95% CI) | 0.64 [0.33, 1.21] |
| 4 Rhinitis Show forest plot | 1 | Risk Ratio (M‐H, Fixed, 95% CI) | Subtotals only | |
| 4.1 Infancy (incidence) | 1 | 161 | Risk Ratio (M‐H, Fixed, 95% CI) | 2.08 [0.39, 11.02] |
| 5 Food allergy Show forest plot | 1 | Risk Ratio (M‐H, Fixed, 95% CI) | Subtotals only | |
| 5.1 Infancy (incidence) | 1 | 161 | Risk Ratio (M‐H, Fixed, 95% CI) | 1.45 [0.48, 4.39] |
| 6 Cow's milk allergy Show forest plot | 1 | Risk Ratio (M‐H, Fixed, 95% CI) | Subtotals only | |
| 6.1 Infancy (incidence) | 1 | 161 | Risk Ratio (M‐H, Fixed, 95% CI) | 5.19 [0.25, 106.38] |
| 7 Urticaria Show forest plot | 1 | Risk Ratio (M‐H, Fixed, 95% CI) | Subtotals only | |
| 7.1 Infancy (incidence) | 1 | 161 | Risk Ratio (M‐H, Fixed, 95% CI) | 4.15 [0.47, 36.34] |