Antibiotics for secondary prevention of coronary heart disease
Abstract
Background
Coronary heart disease is the leading cause of mortality worldwide with approximately 7.4 million deaths each year. People with established coronary heart disease have a high risk of subsequent cardiovascular events including myocardial infarction, stroke, and cardiovascular death. Antibiotics might prevent such outcomes due to their antibacterial, antiinflammatory, and antioxidative effects. However, a randomised clinical trial and several observational studies have suggested that antibiotics may increase the risk of cardiovascular events and mortality. Furthermore, several non‐Cochrane Reviews, that are now outdated, have assessed the effects of antibiotics for coronary heart disease and have shown conflicting results. No previous systematic review using Cochrane methodology has assessed the effects of antibiotics for coronary heart disease.
Objectives
We assessed the benefits and harms of antibiotics compared with placebo or no intervention for the secondary prevention of coronary heart disease.
Search methods
We searched CENTRAL, MEDLINE, Embase, LILACS, SCI‐EXPANDED, and BIOSIS in December 2019 in order to identify relevant trials. Additionally, we searched TRIP, Google Scholar, and nine trial registries in December 2019. We also contacted 11 pharmaceutical companies and searched the reference lists of included trials, previous systematic reviews, and other types of reviews.
Selection criteria
Randomised clinical trials assessing the effects of antibiotics versus placebo or no intervention for secondary prevention of coronary heart disease in adult participants (≥18 years). Trials were included irrespective of setting, blinding, publication status, publication year, language, and reporting of our outcomes.
Data collection and analysis
Three review authors independently extracted data. Our primary outcomes were all‐cause mortality, serious adverse event according to the International Conference on Harmonization ‐ Good Clinical Practice (ICH‐GCP), and quality of life. Our secondary outcomes were cardiovascular mortality, myocardial infarction, stroke, and sudden cardiac death. Our primary time point of interest was at maximum follow‐up. Additionally, we extracted outcome data at 24±6 months follow‐up. We assessed the risks of systematic errors using Cochrane 'Rosk of bias' tool. We calculated risk ratios (RRs) with 95% confidence intervals (CIs) for dichotomous outcomes. We calculated absolute risk reduction (ARR) or increase (ARI) and number needed to treat for an additional beneficial outcome (NNTB) or for an additional harmful outcome (NNTH) if the outcome result showed a beneficial or harmful effect, respectively. The certainty of the body of evidence was assessed by GRADE.
Main results
We included 38 trials randomising a total of 26,638 participants (mean age 61.6 years), with 23/38 trials reporting data on 26,078 participants that could be meta‐analysed. Three trials were at low risk of bias and the 35 remaining trials were at high risk of bias. Trials assessing the effects of macrolides (28 trials; 22,059 participants) and quinolones (two trials; 4162 participants) contributed with the vast majority of the data.
Meta‐analyses at maximum follow‐up showed that antibiotics versus placebo or no intervention seemed to increase the risk of all‐cause mortality (RR 1.06; 95% CI 0.99 to 1.13; P = 0.07; I2 = 0%; ARI 0.48%; NNTH 208; 25,774 participants; 20 trials; high certainty of evidence), stroke (RR 1.14; 95% CI 1.00 to 1.29; P = 0.04; I2 = 0%; ARI 0.73%; NNTH 138; 14,774 participants; 9 trials; high certainty of evidence), and probably also cardiovascular mortality (RR 1.11; 95% CI 0.98 to 1.25; P = 0.11; I2= 0%; 4674 participants; 2 trials; moderate certainty of evidence). Little to no difference was observed when assessing the risk of myocardial infarction (RR 0.95; 95% CI 0.88 to 1.03; P = 0.23; I2 = 0%; 25,523 participants; 17 trials; high certainty of evidence). No evidence of a difference was observed when assessing sudden cardiac death (RR 1.08; 95% CI 0.90 to 1.31; P = 0.41; I2 = 0%; 4520 participants; 2 trials; moderate certainty of evidence).
Meta‐analyses at 24±6 months follow‐up showed that antibiotics versus placebo or no intervention increased the risk of all‐cause mortality (RR 1.25; 95% CI 1.06 to 1.48; P = 0.007; I2 = 0%; ARI 1.26%; NNTH 79 (95% CI 335 to 42); 9517 participants; 6 trials; high certainty of evidence), cardiovascular mortality (RR 1.50; 95% CI 1.17 to 1.91; P = 0.001; I2 = 0%; ARI 1.12%; NNTH 89 (95% CI 261 to 49); 9044 participants; 5 trials; high certainty of evidence), and probably also sudden cardiac death (RR 1.77; 95% CI 1.28 to 2.44; P = 0.0005; I2 = 0%; ARI 1.9%; NNTH 53 (95% CI 145 to 28); 4520 participants; 2 trials; moderate certainty of evidence). No evidence of a difference was observed when assessing the risk of myocardial infarction (RR 0.95; 95% CI 0.82 to 1.11; P = 0.53; I2 = 43%; 9457 participants; 5 trials; moderate certainty of evidence) and stroke (RR 1.17; 95% CI 0.90 to 1.52; P = 0.24; I2 = 0%; 9457 participants; 5 trials; high certainty of evidence).
Meta‐analyses of trials at low risk of bias differed from the overall analyses when assessing cardiovascular mortality at maximum follow‐up. For all other outcomes, meta‐analyses of trials at low risk of bias did not differ from the overall analyses.
None of the trials specifically assessed serious adverse event according to ICH‐GCP.
No data were found on quality of life.
Authors' conclusions
Our present review indicates that antibiotics (macrolides or quinolones) for secondary prevention of coronary heart disease seem harmful when assessing the risk of all‐cause mortality, cardiovascular mortality, and stroke at maximum follow‐up and all‐cause mortality, cardiovascular mortality, and sudden cardiac death at 24±6 months follow‐up. Current evidence does, therefore, not support the clinical use of macrolides and quinolones for the secondary prevention of coronary heart disease.
Future trials on the safety of macrolides or quinolones for the secondary prevention in patients with coronary heart disease do not seem ethical. In general, randomised clinical trials assessing the effects of antibiotics, especially macrolides and quinolones, need longer follow‐up so that late‐occurring adverse events can also be assessed.
PICO
Plain language summary
Benefits and harms of antibiotics for secondary prevention of coronary heart disease
Background
Coronary heart disease, also known as cardiovascular disease, is the leading cause of death worldwide with approximately 7.4 million deaths each year. Coronary heart disease is caused by decreased blood supply to the heart. The severity of the disease ranges from chest pain during exercise to heart attack. Antibiotics might help patients with coronary heart disease and reduce their risk of heart attacks, strokes, chest pain, revascularisation procedures, and death. However, a randomised clinical trial and several observational studies suggested that antibiotics increased the risk of cardiovascular events and death.
Review question
The aim of this Cochrane systematic review was to assess the benefits and harms of antibiotics in adult patients with coronary heart disease.
We primarily assessed the benefits and harms at maximum follow‐up and secondly at 24±6 months follow‐up.
Study characteristics
We searched various scientific databases from their inception to December 2019 and found 38 trials where people with coronary heart disease were randomly allocated to antibiotics versus placebo or no intervention. The 38 trials included 26,638 adults with a mean age of 61.6 years. 23 out of the 38 trials reported data on 26,078 participants that could be analysed. The vast majority of the data was contributed by trials assessing the effects of macrolide antibiotics (28 trials; 22,059 participants) and quinolone antibiotics (two trials; 4162 participants), while insufficient data were contributed by trials assessing the effects of tetracycline antibiotics (eight trials; 417 participants). Three trials were at low risk of bias and the remaining trials were at high risk of bias.
Key results and conclusion
Patients receiving antibiotics (macrolide antibiotics or quinolone antibiotics) compared with patients receiving placebo or no intervention seemed at a slightly higher risk of death from all causes, death from a cardiac cause, and having a stroke at maximum follow‐up. Moreover, a slightly higher risk was also observed when assessing death from all causes, death from a cardiac cause, and sudden death from a cardiac cause at 24±6 months follow‐up. None of the trials sufficiently reported the number of participants with serious adverse events. No data were provided on quality of life.
Future trials on the safety of macrolide antibiotics or quinolone antibiotics for the secondary prevention in adult patients with coronary heart disease do not seem ethical.
Authors' conclusions
Summary of findings
| Antibiotics compared with placebo or no intervention for coronary heart disease at maximum follow‐up | ||||||
| Patient or population: patients with coronary heart disease Settings: any setting Intervention: any antibiotic Comparison: placebo or no intervention | ||||||
| Outcomes | Anticipated absolute effects* (95% CI) | Relative effect | No of Participants | Certainty of the evidence | Comments | |
|---|---|---|---|---|---|---|
| Risk with placebo or no intervention | Risk with antibiotics | |||||
| All‐cause mortality at maximum follow‐up. Follow‐up: mean 21.4 months (range 3 to 120 months). | 100 per 1000 | 106 per 1000 | RR 1.06 (0.99 to 1.13) | 25,774 (20 trials) | ⊕⊕⊕⊕ | Overall low risk of bias due to the four trials carrying most of the weight were either at overall low risk of bias or were low risk of bias in the majority of domains. Low risk of imprecision due to inclusion of more participants than the estimated optimal information size1 |
| Serious adverse event at maximum follow‐up. | ‐ | ‐ | ‐ | ‐ | ‐ | No data were reported in the included trials. |
| Quality of life at maximum follow‐up. | ‐ | ‐ | ‐ | ‐ | ‐ | No data were reported in the included trials. |
| Cardiovascular mortality at maximum follow‐up. Follow‐up: mean 72.0 months (range 24 to 120 months). | 167 per 1000 | 185 per 1000 | RR 1.11 (0.98 to 1.25) | 4674 (2 trials) | ⊕⊕⊕⊝ | The sensitivity analysis only including low risk of bias trials differed from the overall analysis. Hence, for this outcome, we based our primary analysis and primary conclusion on trials at low risk of bias. Overall low risk of bias due to the three trials carrying most of the weight were either at overall low risk of bias or were low risk of bias in the majority of domains. Low risk of imprecision due to the sample size being very large (> 4000 participants)3. |
| Myocardial infarction at maximum follow‐up. Follow‐up: mean 20.7 months (range 3 to 120 months). | 80 per 1000 | 76 per 1000 | RR 0.95 (0.88 to 1.03) | 25,523 (17 trials) | ⊕⊕⊕⊕ | Overall low risk of bias due to the four trials carrying most of the weight were either at overall low risk of bias or were low risk of bias in the majority of domains. Low risk of imprecision due to inclusion of more participants than the estimated optimal information size4. |
| Stroke at maximum follow‐up. Follow‐up: mean 31.9 months (range 6 to 120 months). | 55 per 1000 | 62 per 1000 | RR 1.14 (1.00 to 1.29) | 14,774 (9 trials) | ⊕⊕⊕⊕ | Overall low risk of bias due to the three trials carrying most of the weight were either at overall low risk of bias or were low risk of bias in the majority of domains. Low risk of imprecision due to the sample size being very large (> 4000 participants)5. The risk of publication bias could not be assessed due to too few included trials. |
| Sudden cardiac death at maximum follow‐up. Follow‐up: mean 69.3 months (range 18.5 to 120 months). | 84 per 1000 | 90 per 1000 (75 to 109) | RR 1.08 (0.90 to 1.31) | 4520 (2 trials) | ⊕⊕⊕⊝ | Overall low risk of bias due to both trials included in the meta‐analyses being at overall low risk of bias or low risk of bias in the majority of domains, respectively. Low risk of imprecision due to the sample size being very large (> 4000 participants)6. The risk of publication bias could not be assessed due to too few included trials. |
| *The risk in the intervention group (and its 95% confidence interval) is based on the assumed risk in the comparison group and the relative effect of the intervention (and its 95% CI). CI: Confidence interval; RR: Risk ratio. | ||||||
| GRADE Working Group grades of evidence | ||||||
| 1No downgrading for imprecision: the optimal information size according to the GRADE Handbook using a RRR of 15%, an incidence in the control group of 10.0%, an alpha of 2.5%, and a beta of 10% was estimated to be 18,576 participants and we included 25,774 participants. 2Downgrading one level due to serious indirectness: risk of difference between the population of interest and the included participants, and between the intervention of interest and the included interventions. 3No downgrading for imprecision: the optimal information size according to the GRADE Handbook using a RRR of 15%, an incidence of 16.7%, an alpha of 2.0%, and a beta of 10% was estimated to be 10,883 participants and we only included 4674 participants. Nevertheless, the sample size was very large (>4000 participants). 4No downgrading for imprecision: the optimal information size according to the GRADE Handbook using a RRR of 15%, an incidence of 8.09%, an alpha of 2.0%, and a beta of 10% was estimated to be 24,627 participants and we included 25,523 participants. 5No downgrading for imprecision: the optimal information size according to the GRADE Handbook using a RRR of 15%, an incidence of 5.49%, an alpha of 2.0%, and a beta of 10% was estimated to be 37,339 participants and we only included 14,774 participants. Nevertheless, the sample size was very large (>4000 participants). 6No downgrading for imprecision. the optimal information size according to the GRADE Handbook using a RRR of 15%, an incidence of 8.36%, an alpha of 2.0%, and a beta of 10% was estimated to be 23,782 participants and we only included 4520 participants. Nevertheless, the sample size was very large (>4000 participants). | ||||||
| Antibiotics compared with placebo or no intervention for coronary heart disease at 24±6 months follow‐up | ||||||
| Patient or population: patients with coronary heart disease Settings: any setting Intervention: any antibiotic Comparison: placebo or no intervention | ||||||
| Outcomes | Anticipated absolute effects* (95% CI) | Relative effect | No of Participants | Certainty of the evidence | Comments | |
|---|---|---|---|---|---|---|
| Risk with placebo or no intervention | Risk with antibiotics | |||||
| All‐cause mortality at 24±6 months follow‐up. Follow‐up: mean 23.3 months (range 18 to 30 months). | 50 per 1000 | 62 per 1000 | RR 1.25 (1.06 to 1.48) | 9517 (6 trials) | ⊕⊕⊕⊕ | Overall low risk of bias due to the three trials carrying most of the weight were either at overall low risk of bias or were low risk of bias in the majority of domains. Low risk of imprecision due to the sample size being very large (> 4000 participants)1. The risk of publication bias could not be assessed due to too few included trials. |
| Serious adverse event at 24±6 months follow‐up. | ‐ | ‐ | ‐ | ‐ | ‐ | No data were reported in the included trials. |
| Quality of life at 24±6 months follow‐up. | ‐ | ‐ | ‐ | ‐ | ‐ | No data were reported in the included trials. |
| Cardiovascular mortality at 24±6 months follow‐up. Follow‐up: mean 23.1 months (range 18 to 30 months). | 23 per 1000 | 34 per 1000 | RR 1.50 (1.17 to 1.91) | 9044 (5 trials) | ⊕⊕⊕⊕ | Overall low risk of bias due to the three trials carrying most of the weight were either at overall low risk of bias or were low risk of bias in the majority of domains. Low risk of imprecision due to the sample size being very large (> 4000 participants)2. The risk of publication bias could not be assessed due to too few included trials. |
| Myocardial infarction at 24±6 months follow‐up. Follow‐up: mean 24.3 months (range 18.5 to 30.0 months). | 68 per 1000 | 65 per 1000 | RR 0.95 (0.82 to 1.11) | 9457 (5 trials) | ⊕⊕⊕⊝ | Overall low risk of bias due to the two trials carrying most of the weight were either at overall low risk of bias or were low risk of bias in the majority of domains. Low risk of imprecision due to the sample size being very large (> 4000 participants)4. The risk of publication bias could not be assessed due to too few included trials. |
| Stroke at 24±6 months follow‐up. Follow‐up: mean 24.3 months (range 18.5 to 30 months). | 21 per 1000 | 25 per 1000 | RR 1.17 (0.90 to 1.52) | 9457 (5 trials) | ⊕⊕⊕⊕ | Overall low risk of bias due to the three trials carrying most of the weight were either at overall low risk of bias or were low risk of bias in the majority of domains. Low risk of imprecision due to the sample size being very large (> 4000 participants)5. The risk of publication bias could not be assessed due to too few included trials. |
| Sudden cardiac death at 24±6 months follow‐up. Follow‐up: mean 24.3 months (range 18.5 to 30 months). | 26 per 1000 | 44 per 1000 (33 to 63) | RR 1.77 (1.28 to 2.44) | 4520 (2 trials) | ⊕⊕⊕⊝ | Overall low risk of bias due to both trials included in the meta‐analyses being at overall low risk of bias or low risk of bias in the majority of domains, respectively. Low risk of imprecision due to the sample size being very large (> 4000 participants)7. The risk of publication bias could not be assessed due to too few included trials. |
| *The risk in the intervention group (and its 95% confidence interval) is based on the assumed risk in the comparison group and the relative effect of the intervention (and its 95% CI). CI: Confidence interval; RR: Risk ratio. | ||||||
| GRADE Working Group grades of evidence | ||||||
| 1No downgrade for imprecision: the optimal information size according to the GRADE Handbook using a RRR of 15%, an incidence of 4.98%, an alpha of 2.5%, and a beta of 10% was estimated to be 38,771 participants and we only included 9509 participants. Nevertheless, the sample size was very large (>4000 participants). 2No downgrade for imprecision: the optimal information size according to the GRADE Handbook using a RRR of 15%, an incidence of 2.25%, an alpha of 2.0%, and a beta of 10% was estimated to be 91,738 participants and we only included 9036 participants. Nevertheless, the sample size was very large (>4000 participants). 3Downgrading one level due to serious inconsistency: the statistical heterogeneity was I2 = 43%; P = 0.14. Moreover, the forest plot showed trials with results in opposite direction. 4No downgrade for imprecision: the optimal information size according to the GRADE Handbook using a RRR of 15%, an incidence of 6.85%, an alpha of 2.0%, and a beta of 10% was estimated to be 96,669 participants and we only included 9457 participants. Nevertheless, the sample size was very large (>4000 participants). 5No downgrade for imprecision: The optimal information size according to the GRADE Handbook using a RRR of 15%, an incidence of 2.11%, an alpha of 2.0%, and a beta of 10% was estimated to be 97,219 participants and we only included 9449 participants. Nevertheless, the sample size was very large (>4000 participants). 6Downgrading one level due to serious indirectness: Risk of difference between the population of interest and the included participants, and between the intervention of interest and the included interventions. 7No downgrade for imprecision: the optimal information size according to the GRADE Handbook using a RRR of 15%, an incidence of 2.59%, an alpha of 2.0%, and a beta of 10% was estimated to be 80,024 participants and we only included 4520 participants. Nevertheless, the sample size was very large (>4000 participants). | ||||||
Background
Description of the condition
Coronary heart disease is the collective term for a group of diseases consisting of stable angina, unstable angina, myocardial infarction, and sudden cardiac death (Wong 2014). Coronary heart disease is estimated to be the leading cause of death worldwide (WHO 2011; WHO 2016), and 15.5 million people in the USA alone suffer from coronary heart disease (Mozaffarian 2016). The World Health Organization (WHO) has estimated that 7.4 million people die each year globally because of coronary heart disease with over three quarters of the deaths occurring in low‐ and middle‐income countries (WHO 2011; WHO 2016). Coronary heart disease also has a significant impact on healthcare costs and accounts for approximately EUR 196 billion in Europe and USD 207.3 billion in the USA (Ferreira‐Gonzalez 2014; Mozaffarian 2016).
The pathogenesis of coronary heart disease is related to the narrowing or blockage of the coronary arteries supplying the heart with blood. This process is usually caused by build‐up of fatty material and plaque in the walls of the coronary arteries leading to atherosclerosis (Ross 1999; Libby 2010; Libby 2011; Ambrose 2015). Atherosclerosis is a chronic immune‐mediated inflammatory disease that usually develops over years, ultimately limiting perfusion to the heart, which may cause shortages of oxygen and glucose, leading to symptoms such as chest pain (angina) and shortness of breath (Ross 1999; Ambrose 2015).
People with established coronary heart disease have a high risk of subsequent cardiovascular events including cardiovascular death, myocardial infarction, and stroke (Smith 2011; WHO 2011; Eckel 2014; Piepoli 2016; Winkel 2015). Therapeutic lifestyle changes (e.g. increased physical activity; weight reduction; dietary modification; smoking cessation; and alcohol intake reduction) and adjunctive drug therapies (e.g. antithrombotic treatment; managing hypertension, diabetes, dyslipidaemia, and chronic kidney disease) are necessary to improve quality of life, reduce recurrent events and the need for revascularisation procedures, and improve survival (Smith 2011; WHO 2011; Eckel 2014; Piepoli 2016). Nonetheless, even complete adherence to the aforementioned therapies is reported to not completely eliminate the person's risk of subsequent cardiovascular events (Bertrand 2016). This residual risk may result, in part, from the failure of current therapies to efficiently address inflammation (Bertrand 2016).
Studies have shown that inflammation seems to be a predictor for the development and progression of atherosclerosis (Libby 2002; Kaptoge 2010; Lawson 2016) and the inflammatory process may be induced by stimuli from infectious agents (Mendall 1996; Rosenfeld 2011; Lawson 2016). The infectious agents might induce the inflammatory process by infecting vascular cells within the atheromatous plaque and consequently activating an innate immune response (Rosenfeld 2011). The activated innate immune response then contributes to the inflammation within the plaque (Rosenfeld 2011). Moreover, infectious agents may induce inflammation at non‐vascular places, which might lead to increased secretion of cytokines and other acute‐phase proteins. The cytokines and other acute‐phase proteins then add to the inflammation within the plaque (Rosenfeld 2011). Hence, an association between coronary heart disease and various infectious agents has been suggested and a number of studies have investigated the validity of this possible association.
Chlamydia pneumoniae (C pneumoniae) bacteria have been identified in atheromatous plaques (Shor 1992; Kuo 1993; Muhlestein 1996; Assar 2015; Pigarevskii 2015). Moreover, seroepidemiological studies (Saikku 1988; Thom 1991; Linnanmaki 1993; Kazar 2005; Romano Carratelli 2006; Sakurai‐Komada 2014) and a meta‐analysis of seroepidemiological studies (Danesh 1997) have all shown increased levels of C pneumoniae antibodies in people with coronary heart disease. In vivo studies and a meta‐analysis of observational studies have shown that C pneumoniae may contribute to atherosclerosis (Burnett 2001; Ezzahiri 2002; Ezzahiri 2003; Filardo 2015). Contrary to these findings, prospective seroepidemiological studies (Ridker 1999; Danesh 2000a; Danesh 2000b; Danesh 2002), retrospective seroepidemiological studies (Prasad 2002; Al‐Younes 2016), and meta‐analyses of seroepidemiological studies (Danesh 2000a; Danesh 2000b; Danesh 2002; Bloemenkamp 2003) did not show any association between C pneumoniae antibodies and coronary heart disease.
Porphyromonas gingivalis (P gingivalis) bacteria have also been identified in atheromatous plaques (Pucar 2007; Zaremba 2007; Gaetti‐Jardim 2009; Mahendra 2009). Moreover, studies have shown increased levels of antibodies or higher amount of oral bacterial burden of P gingivalis in people with coronary heart disease (Pussinen 2004; Renvert 2006; Gotsman 2007; Mahendra 2015). In vivo studies have shown that P gingivalis may contribute to atherosclerosis (Brodala 2005; Maekawa 2011). Contrary to these findings, retrospective studies (Spahr 2006; Pesonen 2009; Andriankaja 2011) and a prospective study (De Boer 2014) did not show any association between P gingivalis and coronary heart disease.
Helicobacter pylori (H pylori) is another infectious agent that might induce an inflammatory process and lead to coronary heart disease. The association between coronary heart disease and H pylori has been assessed in seroepidemiological studies (Mendall 1994; Lenzi 2006; Vcev 2007; Shmuely 2014; Matusiak 2016), a meta‐analysis of seroepidemiological studies (Danesh 1997), and meta‐analyses of prospective studies (Sun 2016; Jiang 2017). These studies have shown that infection with H pylori increases the risk of coronary heart disease. Contrary to these findings, prospective studies (Whincup 1996; Folsom 1998; Roivainen 2000; Zhu 2001; Zhu 2002; Jin 2007) and a meta‐analysis of seroepidemiological studies (Danesh 1998) did not show any association between H pylori and coronary heart disease.
A possible association between Escherichia coli (E coli) and cardiovascular disease has been investigated. However, a cohort study found that infection with E coli did not increase the risk of cardiovascular disease in the decade following infection (Hizo‐Abes 2013). Further, a seroepidemiological study did not show any association between E coli and coronary heart disease (Mahdi 2002).
According to the studies referred to, there are some findings speaking in favour of an association between various bacteria and coronary heart disease, but there are also a number of observations pointing against such associations. If, however, one could find an intervention that could cure the bacterial activity and this had a beneficial effect on the course of coronary heart disease, such an intervention could have very important effects on morbidity and mortality of coronary heart disease. Antibiotics could be such an intervention.
Description of the intervention
Antibiotics are antimicrobial drugs of chemical origin that treat and prevent bacterial infections by either killing or inhibiting the growth of the bacteria (Waksman 1947). Antibiotics can be classified based on their mechanism of action (bactericidal or bacteriostatic), bacterial spectrum (broad or narrow), and chemical structure (e.g. penicillins, macrolides, quinolones, or tetracyclines) (Berdy 2005). The optimal dose and duration of antibiotic therapy depends on various factors (e.g. the patient's immune status, the infecting agent, and the focus of infection) (Polk 1999).
Macrolides (e.g. azithromycin, clarithromycin, and erythromycin), quinolones (e.g. gatifloxacin and ciprofloxacin), and tetracyclines (e.g. doxycycline) have been the primary antibiotic classes used to investigate the effects of antibiotics as secondary prevention in people with coronary heart disease, presumably because C pneumoniae and H pylori are known to be sensitive to macrolides, quinolones, and tetracyclines (Chirgwin 1989; Malfertheiner 2007). Macrolides' mechanism of action is to inhibit the protein synthesis through binding to the 50S subunit of the ribosome (Gaynor 2003); quinolones' mechanism of action is to prevent bacterial DNA from unwinding and duplicating through targeting the bacterial type II topoisomerases, gyrase, and topoisomerase IV (Aldred 2014); and tetracyclines' mechanism of action is to inhibit protein synthesis by preventing the attachment of aminoacyl‐tRNA to the ribosomal acceptor site (Chopra 2001).
How the intervention might work
Antibiotics might prevent the development of coronary heart disease through antibacterial activity. In addition, animal studies and in‐vitro studies suggest that several classes of antibiotics (e.g. macrolides, tetracyclines, or quinolones) seem to exert anti‐inflammatory and anti‐oxidative effects, which might slow down the atherogenesis independently of any antibacterial effect (Anderson 1996; Rajagopalan 1996; Dalhoff 2003; Sapadin 2006; Steel 2012). However, the use of macrolides has been reported in both observational studies and in a randomised clinical trial to increase the risk of cardiovascular morbidity and mortality (see Why it is important to do this review). The increased risk of cardiovascular morbidity and mortality might be associated with macrolides' pro‐arrhythmic effects (i.e. QT prolongation) leading to torsades de pointes (polymorphic ventricular tachycardia in patients with a long QT interval) (Bril 2010). Further, in contrast to the findings in animal studies and in‐vitro studies, the use of macrolides might lead to an inflammatory cascade resulting in more vulnerable plaques that over time increase the risk of plaque rupture and, hence, leads to increased risk of cardiovascular events and mortality (Winkel 2011). The use of quinolones have also been associated with an increased risk of ventricular arrhythmias and cardiovascular death (Lapi 2012; Liu 2017), but these findings were not found in another study (Inghammar 2016). The risk of cardiovascular morbidity and mortality has not been adequately assessed for tetracyclines.
Why it is important to do this review
Coronary heart disease is the leading cause of death worldwide with about 7.4 million deaths each year (WHO 2011; WHO 2016). People with established coronary heart disease have a high risk of subsequent cardiovascular events including cardiovascular death, myocardial infarction, and stroke (Smith 2011; WHO 2011; Eckel 2014; Piepoli 2016). Prevention and management of the common risk factors for coronary heart disease are necessary to improve quality of life, reduce recurrent events and the need for revascularisation procedures, and improve survival (Smith 2011; WHO 2011; Eckel 2014; Piepoli 2016). Nonetheless, even complete adherence to the before‐mentioned therapies may not completely eliminate the person's risk of subsequent cardiovascular events (Bertrand 2016).
The use of antibiotics for secondary prevention of coronary heart disease is not mentioned in any guidelines, indicating that it is not conventional therapy (Fihn 2012; Montalescot 2013). However, a very large number of people with coronary heart disease receive antibiotics each year to treat proven or suspected bacterial infections. In the first instance, the antibiotics may help them. In the second instance, any adverse event may be as likely as any benefits. In both instances, we need to know the impact of antibiotic intervention on long‐term health.
The first trials that investigated the use of antibiotics for secondary prevention of coronary heart disease were published in the late 1990s. The trials compared macrolide versus placebo in people with coronary heart disease. The trials showed conflicting results (Gupta 1997; Anderson 1999; Torgano 1999; Gurfinkel 1999) and made clear the need for larger trials.
Several meta‐analyses of randomised clinical trials have assessed the effects of antibiotics for secondary prevention of coronary heart disease (Etminan 2004; Andraws 2005; Baker 2007; Gluud 2008). Etminan 2004 included nine trials with 12,032 participants; Andraws 2005 included 11 trials with 19,217 participants; and Baker 2007 included six trials with 13,778 participants. All of these reviews compared antibiotics versus placebo. None of the reviews showed any benefits or harms of antibiotic therapy for secondary prevention of coronary heart disease. Gluud 2008 included 17 trials with 25,271 participants comparing antibiotics versus placebo, and found a significantly increased relative risk of all‐cause mortality of 10% in the antibiotic group. Moreover, Gluud 2008 did a meta‐analysis of the three trials that reported more than two years' follow‐up (i.e. PROVE‐IT (Cannon 2005), ACES (Grayston 2005), and CLARICOR (Gluud 2008)) and showed a significantly increased relative risk of all‐cause mortality of 17% in the antibiotic group.
Cheng 2015 included 33 studies of various designs with 20,779,963 participants in a review comparing macrolides with or to placebo or no intervention. The review included any type of participant and did not focus on a specific infectious agent or disease. The authors of the review found no significant effect of macrolides on all‐cause mortality. However, the participants treated with macrolide had a significantly higher relative risk of sudden cardiac death of 152% and a higher relative risk of dying from cardiovascular problems of 31%.
Currently, no guidelines report whether antibiotics should be used or avoided as secondary prevention of coronary heart disease (Fihn 2012; Montalescot 2013). This might be because the use of antibiotic therapy for secondary prevention of coronary heart disease lost momentum a decade ago, possibly as a consequence of the majority of previous evidence showing no effects ‐ either beneficial or harmful. Nevertheless, the public‐health aspect of administration of antibiotics to people with coronary heart disease is not to be neglected. Furthermore, our preliminary literature search has identified several new trials that were not included in the former attempts to review the literature, and more trials may be identified during the literature search. Accordingly, the benefits and harms of antibiotics in people with coronary heart disease seem unclear based on current evidence. Furthermore, antibiotics, including macrolide, are commonly used interventions in people with coronary heart disease and any beneficial or harmful effects of administering antibiotics in this group of people is of urgent importance. The CLARICOR trial, as mentioned previously, showed that clarithromycin versus placebo for secondary prevention of coronary heart disease significantly increased the risk of death (Jespersen 2006; Gluud 2008; Winkel 2015). We, therefore, find it very important to investigate whether antibiotics have a beneficial, neutral, or harmful effect for secondary prevention of coronary heart disease.
No former relevant review has used Cochrane methodology and the GRADE approach to take into account both risks of random errors and risk of systematic errors (Higgins 2011a; Guyatt 2008). Therefore, it is still unclear whether antibiotics have a beneficial, neutral, or harmful effect for secondary prevention of coronary heart disease.
Objectives
We assessed the beneficial and harmful effects of antibiotics versus placebo or no intervention for the secondary prevention of coronary heart disease.
As a secondary objective, we assessed the effects of individual types of antibiotics versus placebo or no intervention for the secondary prevention of coronary heart disease.
Methods
Criteria for considering studies for this review
Types of studies
We included all randomised clinical trials assessing the beneficial and harmful effects of antibiotics for the secondary prevention of coronary heart disease irrespective of setting, blinding, publication status, publication year, language, and reporting of our outcomes.
Types of participants
We included adult participants (≥ 18 years) with any diagnosis of coronary heart disease, that is, acute myocardial infarction, previous myocardial infarction, unstable angina, or stable angina. We accepted the definitions used by the individual trialists. We included participants irrespective of sex and antibody status (e.g. for Cpneumoniae,H pylori, P gingivalis, or E coli).
We excluded trials including participants with any other cause of chronic inflammatory disease (e.g. lupus erythematosus, rheumatoid arthritis, ankylosing spondylitis, psoriatic arthritis, polymyositis/dermatomyositis, and inflammatory bowel disease). We only included trials that included a subset of eligible participants if separate data for the eligible participants were available or if the majority of participants (i.e. more than 80%) were eligible.
Types of interventions
We included all trials comparing antibiotics with either placebo or no intervention. We did not include trials comparing antibiotics with any active drug.
We accepted any type of antibiotic (e.g. azithromycin, clarithromycin, erythromycin, spiramycin, doxycycline, gatifloxacin, penicillin, amoxicillin, or metronidazole) as the experimental intervention, irrespective of dose, route of administration, or duration. We assessed the effects of the individual types of antibiotics in subgroup analyses.
We accepted any type of co‐intervention when such co‐intervention was intended to be delivered similarly to the antibiotics and the control group. We assumed that the effects of the co‐interventions would 'even out' in both groups so that the possible effects of the antibiotic would be reflected in the results. We did a check of co‐interventions after randomisation in both intervention groups and considered any major differences in our conclusions. As optimal medical therapy plays an important role for the secondary prevention of coronary heart disease, we performed a sensitivity analysis excluding trials with sub‐optimal medical therapy. Optimal medical therapy indicated at least one drug for angina/ischaemic relief (e.g. short‐acting nitrates, beta blockers, and calcium channel blockers) plus drugs for event prevention (e.g. aspirin, clopidogrel, statins, ACE inhibitors, and angiotensin receptor blockers) (Montalescot 2013).
Types of outcome measures
We extracted outcome data at two time points:
-
maximum follow‐up (the time point of primary interest);
-
24±6 months follow‐up.
We chose 24±6 months follow‐up based on the Kaplan‐Meier curve made by Winkel 2015. We believed that 24±6 months follow‐up was long enough to show any possible secondary prevention effects of antibiotics. Furthermore, 24±6 months follow‐up was not so long that other factors, unrelated to the given trial but affecting the outcomes, might have decreased the statistical power, that is, that the results were 'diluted' by events unrelated to the trial.
Primary outcomes
-
All‐cause mortality.
-
Serious adverse event. We defined a serious adverse event as any untoward medical occurrence that resulted in death; was life‐threatening; required hospitalisation or prolongation of existing hospitalisation; resulted in persistent or significant disability; or jeopardised the patient (ICH‐GCP 1997). None of the trials specifically assessed serious adverse events according to this definition by ICH‐GCP. Instead, the trials either reported composites of several specific serious adverse events or one specific serious adverse event.
-
Quality of life measured on any valid continuous scale. None of the trials assessed quality of life.
Secondary outcomes
Definitions for secondary outcomes was according to the individual trialists.
-
Cardiovascular mortality.
-
Myocardial infarction.
-
Stroke.
-
Sudden cardiac death.
Additional post hoc outcomes
Definitions for the additional post hoc outcomes was according to the individual trialists.
-
Hospitalisation for any cause.
-
Revascularisation.
-
Unstable angina pectoris.
Search methods for identification of studies
Electronic searches
The following electronic databases were searched to identify reports of relevant randomised clinical trials on 9 December 2019.
-
Cochrane Central Register of Controlled Trials (CENTRAL) in the Cochrane Library (2019, Issue 12 of 12)
-
Epub Ahead of Print, In‐Process & Other Non‐Indexed Citations, MEDLINE Daily and MEDLINE (Ovid, 1946 to 6 December 2019)
-
Embase (Ovid, 1980 to 2019 week 49)
-
SCI‐Expanded (Web of Science) (Clarivate Analytics, 1900 to 9 December 2019)
-
BIOSIS (Web of Science) (Clarivate Analytics, 1926 to 9 December 2019)
-
LILACS (Bireme, 1982 to 9 December 2019)
We adapted the preliminary search strategy for MEDLINE (Ovid) for use in the other databases. We applied the Cochrane sensitivity‐maximising RCT filter (Lefebvre 2011) to MEDLINE (Ovid) and adaptations of it to all the other databases, except CENTRAL. The search strategy can be found in Appendix 1.
We searched all databases from their inception to the present and we imposed no restriction on language of publication or publication status. We assessed non‐English language papers by asking individuals that fluently speak the language for help. We did not perform a separate search for adverse effects of antibiotics used for the treatment of coronary heart disease. We only considered the adverse effects described in the included trials.
Searching other resources
We searched the reference lists of included randomised clinical trials, previous systematic reviews, and other types of reviews for any unidentified randomised clinical trials. We contacted the authors of included randomised clinical trials for further information and we contacted the following major pharmaceutical companies by email asking them for any unpublished randomised clinical trials:
Furthermore, we searched the following databases for ongoing and unidentified randomised clinical trials on 25 December 2019:
We also examined relevant retraction statements and errata for included trials.
Data collection and analysis
We performed this review following the recommendations of Cochrane (Higgins 2011a). The analyses were performed using Review Manager 5.4.1 (RevMan 2020).
Selection of studies
Two review authors (NJS and SS) independently screened titles and abstracts for inclusion of all the potentially eligible trials. We coded all these studies as 'retrieve' (eligible or potentially eligible/unclear) or 'do not retrieve'. If there were any disagreements, a third review author were asked to arbitrate (JCJ). We retrieved the full‐text trial reports/publications and three review authors (NJS, SS, and SKK) independently screened the full‐text and identified trials for inclusion. Reasons for exclusion of the ineligible studies were reported (Excluded studies). We resolved any disagreement through discussion or, if required, we consulted a fourth person (JCJ). We identified and excluded duplicated and collated multiple reports of the same trial so that each trial rather than each report was the unit of interest in the review. We recorded the selection process in sufficient detail to complete a PRISMA flow diagram (Moher 2009) and 'Characteristics of excluded studies' table.
Data extraction and management
Three authors (NJS, SS, and SKK) extracted and validated data independently from included trials. Any disagreements concerning the extracted data were discussed between the three authors. If no agreement could be reached, a fourth author (JCJ) resolved the issue. In case of relevant data not being available, we contacted the trial authors.
We extracted the following data mentioned below.
Trial characteristics
Bias risk components (as defined below); trial design (parallel, factorial, or cross‐over); number of intervention arms; length of follow‐up; estimation of sample size; and inclusion and exclusion criteria.
Participant characteristics and diagnosis
Number of randomised participants; number of analysed participants; number of participants lost to follow‐up; age range (mean and median) and sex ratio; presence of cardiovascular risk factors (i.e. diabetes mellitus, hypertension, hyperlipidaemia, or smoking); and antibody status (i.e. for C pneumoniae, H pylori, P gingivalis, or E coli).
Intervention characteristics
Type of antibiotic; dose of antibiotic; duration of antibiotic therapy; and mode of administration.
Control characteristics
Placebo or no intervention.
Co‐intervention characteristics
Type of co‐intervention; dose of co‐intervention; duration of co‐intervention; and mode of administration.
Outcomes
We extracted all outcomes listed above from each randomised clinical trial, and we identified whether outcomes were incomplete or selectively reported according to the criteria described in Table 1.
| Domain | Description |
|---|---|
| Random sequence generation |
|
| Allocation concealment |
|
| Blinding of participants and personnel |
|
| Blinding of outcome assessment |
|
| Incomplete outcome data |
|
| Selective outcome reporting |
|
| Other risks of bias |
|
| Overall risk of bias |
|
Notes
We extracted details on funding of the trial and notable conflicts of interest of trial authors, if available.
We noted in the 'Characteristics of included studies' table if outcome data were not reported in a usable way.
Assessment of risk of bias in included studies
We used the instructions given in TheCochrane Handbook for Systematic Reviews of Interventions in our evaluation of the methodology and hence the risk of bias of the included trials (Higgins 2017). Three review authors (NJS, SS, SKK) assessed the included trials independently. We evaluated the risk of bias in the following risk of bias domains:
-
random sequence generation;
-
allocation concealment;
-
blinding of participants and personnel;
-
blinding of outcome assessment;
-
incomplete outcome data;
-
selective outcome reporting; and
-
other risks of bias.
This was done because these domains enable classification of randomised trials at low risk of bias and at high risk of bias. The latter trials tend to overestimate positive intervention effects (benefits) and underestimate negative effects (harms) (Schulz 1995; Moher 1998; Kjaergard 2001; Gluud 2006; Wood 2008; Savovic 2012).
We graded each potential source of bias as high, low, or unclear and provided evidence from the study report together with a justification for our judgement in the 'Risk of bias' table. We have summarised the 'Risk of bias' judgements across different trials for each of the domains listed.
We classified a trial as at overall low risk of bias only if all of the bias domains mentioned above were classified as at low risk of bias. We classified a trial as at overall high risk of bias if any of the bias risk domains mentioned above were classified as at unclear or high risk of bias. For additional details on how risk of bias were assessed, please see Table 1.
We conducted a sensitivity analysis only including trials at overall low risk of bias for all our outcomes (see below in 'Sensitivity analysis'). When considering the risk of blinding, we assessed each outcome individually (Savovic 2018).
Measures of treatment effect
Dichotomous outcomes
We calculated risk ratios (RR) with 95% confidence interval (CI) for dichotomous outcomes. We calculated absolute risk reduction (ARR) or increase (ARI) and number needed to treat for an additional beneficial outcome (NNTB) or for an additional harmful outcome (NNTH) if the outcome result showed a beneficial or harmful effect, respectively. We only calculated the 95% CI of NNTB or NNTH when the results were either all positive or all negative (Altman 1998).
Continuous outcomes
We planned to calculate the mean differences (MD) and the standardised mean difference (SMD) with 95% CI for continuous outcomes. However, none of the included trials reported quality of life (our only continuous outcome).
Unit of analysis issues
We only included randomised clinical trials. For trials using cross‐over design, we planned to only include data from the first period (Elbourne 2002; Deeks 2017). However, none of the included trials used a cross‐over design. For trials where multiple trial intervention groups were reported, we included only the relevant groups. If two comparisons were combined in the same meta‐analysis, we halved the control group to avoid double‐counting (Deeks 2017).
Dealing with missing data
We contacted all trial authors to obtain missing data (i.e. for data extraction and for assessment of risk of bias, as specified above) (Characteristics of included studies). However, not all trial authors responded (Characteristics of included studies).
Dichotomous outcomes
We did not use intention‐to‐treat data if the original report did not contain them. We did not impute missing values for any outcomes in our primary analysis. In four of our sensitivity analyses ('best‐worst', 'worst‐best', modified 'best‐worst', and modified 'worst‐best' case analyses), we imputed data; see 'Sensitivity analysis'.
Continuous outcomes
None of the included trials reported quality of life (our only continuous outcome). If continuous data were available, we would have dealt with missing data as following.
If standard deviations (SDs) were not reported, we planned to calculate them using data from the trial if possible. We planned to not use intention‐to‐treat data if the original report did not contain such data. We planned to not impute missing values for any outcomes in our primary analyses. We planned to impute data in four of our sensitivity analyses ('best‐worst', 'worst‐best', modified 'best‐worst', and modified 'worst‐best' case analyses).
Assessment of heterogeneity
We primarily investigated forest plots to visually assess any sign of heterogeneity. Secondly, we assessed the presence of statistical heterogeneity by the Chi2 test (threshold P < 0.10) and measured the quantities of heterogeneity by the I2 statistic (Higgins 2002; Higgins 2003).
We followed the recommendations for thresholds in the Cochrane Handbook for Systematic Reviews of Interventions (Deeks 2017):
-
0% to 40%: might not be important;
-
30% to 60%: may represent moderate heterogeneity;
-
50% to 90% may represent substantial heterogeneity;
-
75% to 100%: may represent considerable heterogeneity.
We investigated possible heterogeneity through subgroup analyses. Ultimately, we might have decided that a meta‐analysis should be avoided (Deeks 2017). However, none of the planned meta‐analyses were avoided.
Assessment of reporting biases
We used funnel plots to assess reporting bias in the meta‐analyses including 10 or more trials. We visually inspected the funnel plots to assess the risk of bias. We were aware of the limitations of a funnel plot (i.e. a funnel plot assesses bias due to small sample size). From this information, we assessed possible reporting bias. For dichotomous outcomes, we tested asymmetry with the Harbord test (Harbord 2006). For continuous outcomes, we planned to use the regression asymmetry test (Egger 1997) and the adjusted rank correlation (Begg 1994). However, no data on our continuous outcome (i.e. quality of life) were included.
Data synthesis
Assessment of statistical and clinical significance
We undertook this systematic review according to the recommendations stated in TheCochrane Handbook for Systematic Reviews of Interventions (Deeks 2017) for better validation of meta‐analytic results in systematic reviews. We used the Cochrane statistical software RevMan 5.4.1 (RevMan 2020) to meta‐analyse data.
We assessed our intervention effects with both random‐effects meta‐analyses (DerSimonian‐Laird model) (DerSimonian 1986) and fixed‐effect meta‐analyses (DeMets 1987) with the Mantel‐Haenszel method and chose the more conservative result as our primary result (Jakobsen 2014). The more conservative result was the result with the highest P value and the widest 95% CI. If there was substantial discrepancy between the results of the two methods, we reported and discussed both results (Jakobsen 2014).
Subgroup analysis and investigation of heterogeneity
We performed the following subgroup analyses when assessing each outcome (all‐cause mortality, cardiovascular mortality, myocardial infarction, and stroke) both at maximum follow‐up and 24±6 months' follow‐up. We were not able to perform subgroup analyses on 'serious adverse events' and 'quality of life' due to no available data.
A: Comparison of the effects between trials with different types of antibiotic:
-
azithromycin;
-
roxithromycin;
-
clarithromycin;
-
doxycycline;
-
gatifloxacin; or
-
spiramycin.
B: Comparison of the effects between trials with different antibody status:
-
trials including participants with identified C pneumoniae,H pylori, P gingivalis, or E coli antibodies;
-
trials including participants without any identified C pneumoniae,H pylori, P gingivalis, or E coli antibodies; and
-
trials including both participants with and without identification of C pneumoniae,H pylori, P gingivalis, or E coli antibodies.
C: Comparison of the effects between trials including participants on statins at entry compared to trials including participants not on statins at entry (Jensen 2010):
-
trials including participants using statins at entry;
-
trials including participants not using statins at entry; and
-
trials including both participants who are using and not using statins at entry.
D: Comparison of the effects between trials with different mean age of the participants:
-
18 to 59 years;
-
60 years and over.
E: Comparison of the effects between trials with different clinical trial registration status:
-
pre‐registration;
-
post‐registration; or
-
no registration.
Additionally, we performed the following subgroup analysis when assessing each outcome (all‐cause mortality, cardiovascular mortality, myocardial infarction, and stroke) at maximum follow‐up.
F: Comparison of trials with less than 12 months' follow‐up to trials with equal to or longer than 12 months' follow‐up:
-
trials with less than 12 months' follow‐up; or
-
trials with equal to or longer than 12 months' follow‐up.
Post‐hoc subgroup analysis
After the publication of the protocol, we added three extra subgroups. We performed these three subgroups when assessing each outcome (all‐cause mortality, cardiovascular mortality, myocardial infarction, and stroke) both at maximum follow‐up and 24±6 months' follow‐up.
To assess the potential difference in effect based on the different classes of antibiotics, we added the following subgroup:
G: Comparison of the effects between trials with different classes of antibiotic:
-
macrolides;
-
tetracyclines; or
-
quinolones.
To assess the potential difference in effect based on the funding of the trial, we added the following subgroup:
H: Comparison of the effects between industry funded trials or trials with unknown funding compared to non‐industry funded trials (Lundh 2017):
-
industry funded trials or unknown funding; or
-
non‐industry funded trials.
To assess the potential difference in effect based on the control intervention, we added the following subgroup:
I: Comparison of the effects between trials using either placebo or 'no intervention' as control intervention:
-
placebo‐controlled trials; or
-
no control intervention.
We used the formal test for subgroup differences in RevMan 5.4.1 (RevMan 2020).
Sensitivity analysis
To assess the potential impact of bias, we performed a sensitivity analysis in which we only included trials at overall low risk of bias.
To assess the potential impact of sub‐optimal medical therapy, we performed a sensitivity analysis in which we excluded trials with sub‐optimal medical therapy.
To assess the potential impact of the missing data for dichotomous outcomes, we performed the following four sensitivity analyses when assessing each dichotomous outcome (all‐cause mortality, cardiovascular mortality, myocardial infarction, stroke, and sudden cardiac death).
-
'Best‐worst‐case' scenario: we assumed that all participants lost to follow‐up in the experimental group survived, had no cardiovascular death, had no myocardial infarction, had no stroke, and had no sudden cardiac death; and all those participants lost to follow‐up in the control group did not survive, had a cardiovascular death, had a myocardial infarction, had a stroke, and had a sudden cardiac death.
-
'Worst‐best‐case' scenario: we assumed that all participants lost to follow‐up in the experimental group did not survive, had a cardiovascular death, had a myocardial infarction, had a stroke, and had a sudden cardiac death; and that all those participants lost to follow‐up in the control group survived, had no cardiovascular death, had no myocardial infarction, had no stroke, and had no sudden cardiac death.
-
A modified 'best‐worst‐case' scenario: we assumed that all participants lost to follow‐up in the experimental group survived, had no cardiovascular death, had no myocardial infarction, had no stroke, and had no sudden cardiac death; and that half of the participants lost to follow‐up in the control group did not survive, had a cardiovascular death, had a myocardial infarction, had a stroke, and had a sudden cardiac death.
-
A modified 'worst‐best‐case' scenario: we assumed that half of the participants lost to follow‐up in the experimental group did not survive, had a cardiovascular death, had a myocardial infarction, had a stroke, and had a sudden cardiac death; and that all those participants lost to follow‐up in the control group survived, had no serious adverse event, had no cardiovascular death, had no myocardial infarction, had no stroke, and had no sudden cardiac death.
Results from all four scenarios are presented in our review. We were not able to perform the above‐mentioned sensitivity analyses on 'serious adverse events' due to lack of data.
We planned that when analysing quality of life, a ‘beneficial outcome’ would have been the group mean plus two standard deviations (SDs) (we would then have used one SD in another sensitivity analysis) of the group mean, and a ‘harmful outcome’ would have been the group mean minus two SDs (we would then have used one SD in another sensitivity analysis) of the group mean (Jakobsen 2014). However, no data on quality of life were available in the included trials.
To assess the potential impact of missing SDs for continuous outcomes, we planned to perform the following sensitivity analysis.
-
Where SDs were missing and not possible to calculate, we planned to impute SDs from trials with similar populations and low risk of bias. If no such trials were found, we planned to impute SDs from trials with a similar population. As the final option, we planned to impute SDs from all trials.
We planned to present results of this scenario in our review. However, no data on quality of life were available in the included trials.
Summary of findings and assessment of the certainty of the evidence
We used the GRADE system (Guyatt 2008) to assess the certainty of the body of evidence associated with each of the primary (all‐cause mortality, serious adverse event, and quality of life) and secondary outcomes (cardiovascular mortality, myocardial infarction, stroke, and sudden cardiac death) at both maximum follow‐up and 24±6 months follow‐up constructing 'Summary of Findings' tables using the GRADEpro software (GRADEpro GDT 2015; Schunemann 2013). The GRADE approach appraises the certainty of the body of evidence based on the extent to which one can be confident that an estimate of effect or association reflects the item being assessed (Schunemann 2003; Guyatt 2008; Guyatt 2011). We assessed the GRADE levels of evidence as high, moderate, low, and very low and downgraded the evidence by one or two levels depending on the following certainty measures: within‐study risk of bias, the directness of the evidence, heterogeneity of the data, precision of effect estimates, and risk of publication bias (Schunemann 2003; Guyatt 2008; Guyatt 2011). We used the methods and recommendations described in Chapter 8 (Section 8.5) (Higgins 2011b) and Chapter 12 (Schünemann 2017) of the Cochrane Handbook for Systematic Reviews of Interventions (Higgins 2011a). We justified all decisions to downgrade the certainty of studies using footnotes and we made comments to aid the reader's understanding of the review where necessary.
We included all trials in our analyses and conducted a sensitivity analysis only including low risk of bias trials. If the results were similar, we based our 'Summary of findings' tables and conclusions on the overall analysis. If they differed, we based our 'Summary of findings' tables and conclusions on trials at low risk of bias.
We found three low risk of bias trials and reported their findings (ACADEMIC 1999; AZACS 2003; CLARICOR 2006). For cardiovascular mortality at maximum follow‐up, the sensitivity analyses differed from the overall analyses. Hence, we based our primary analyses and primary conclusions on trials at low risk of bias for this outcome. For all other outcomes, we based our primary analyses and primary conclusions on the overall analyses (summary of findings Table 1 (maximum follow‐up) and summary of findings Table 2 (24±6 months follow‐up)).
Results
Description of studies
We assessed all trials according to the Cochrane Handbookfor Systematic Reviews of Interventions(Higgins 2011a), and the protocol for this review (Sethi 2017). Characteristics of each trial can be found in 'Characteristics of included studies', 'Characteristics of excluded studies', and 'Characteristics of ongoing studies'. We identified four eligible ongoing studies (ACAC‐CHD 2018; DOXY‐STEMI 2018; Fredy 2019; SALVAGE MI 2018).
Results of the search
We identified a total of 8093 potentially relevant references through searching the CENTRAL (The Cochrane Library) (n = 1368), MEDLINE (n = 3658), Embase (n = 2418), Science Citation Index Expanded (n = 425), BIOSIS (n = 219), and LILACS (n = 5) databases. The search strategy is presented in Appendix 1. We found six potentially relevant references when searching Google Scholar, clinical trial registers, and reference lists of included trials, previous systematic reviews, and other types of reviews. After removing duplicates, 4772 records were screened, and 4688 references were excluded based on titles and abstracts. Eighty‐four full text articles were assessed for eligibility and we excluded 16 references reporting on 14 trials according to our inclusion criteria and exclusion criteria. Reasons for exclusion are listed in the table 'Characteristics of excluded studies'. Of the remaining 68 references, we found five references reporting on four ongoing trials and two references reporting on two studies awaiting classification. Further information can be found in the table 'Characteristics of ongoing studies' and 'Characteristics of studies awaiting classification'. We therefore included 61 publications reporting results of 38 trials. Accordingly, 38 trials could be included in our analyses. The study flow chart can be seen in Figure 1.
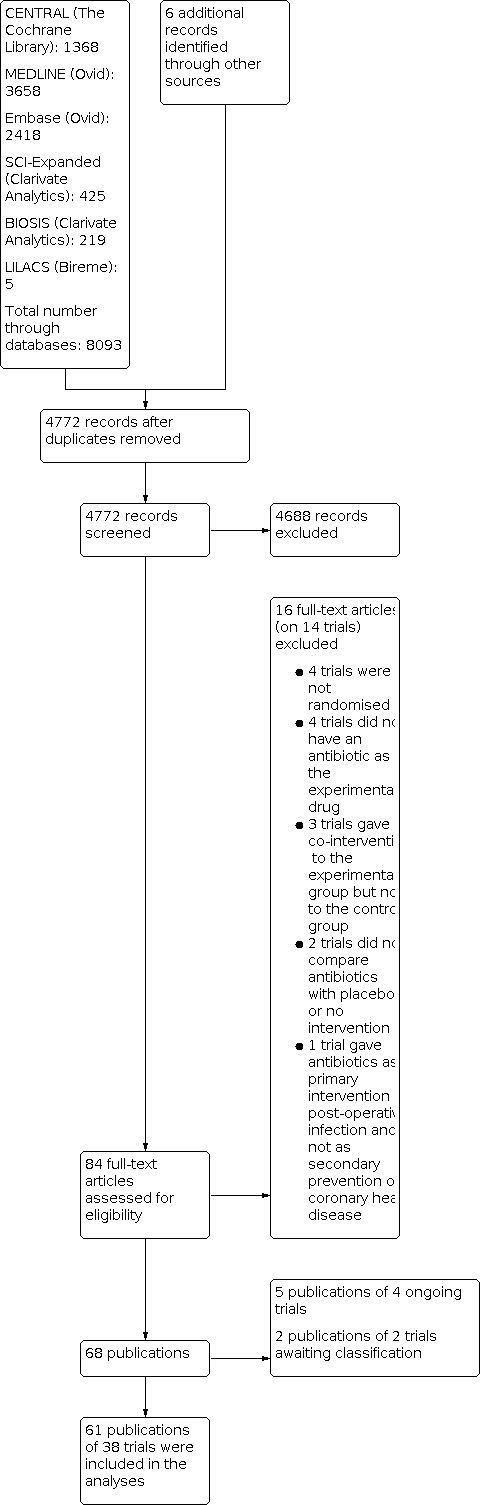
Study flow chart.
Included studies
We included 61 publications reporting on 38 trials comparing antibiotics versus placebo or no intervention in patients with coronary heart disease (Figure 1). The trials were conducted between 1997 and 2019. The trials took place at sites in 27 different countries: nine were from the USA; 6 from Germany; five from the UK; three each from Canada, Italy, and Finland; two each from France, Argentina, Spain, Turkey, India, South Korea, and Austria; and one each from Greece, Serbia, Romania, Australia, Thailand, the Netherlands, Denmark, Sweden, Poland, Japan, Brazil, Georgia, Slovenia, and Israel. The trials had a mean maximum follow‐up of 13.9 months (range 0.17 to 120.0 months). The vast majority of the data was contributed by trials assessing the effects of macrolides (28 trials randomising 22,059 participants) and quinolones (two trials randomising 4162 participants), while insufficient data were contributed by trials assessing the effects of tetracyclines (eight trials randomising 417 participants). A total of 23/38 trials with 26,078 participants reported data that could be meta‐analysed. For further details on included studies and baseline characteristics of included participants, see 'Characteristics of included studies' and Table 2.
| Trial | Year | Number of participants currently smoking | Number of participants with diabetes | Number of participants with hypertension | Number of participants with hyperlipidaemia |
| ACADEMIC | 1999 | 112 out of 302 | 34 out of 302 | 127 out of 302 | ‐ |
| ACES | 2005 | 542 out of 4012 | 883 out of 4012 | 2688 out of 4012 | 3309 of 4012 |
| Aleksiadi 2007 | 2007 | ‐ | ‐ | ‐ | ‐ |
| ANTIBIO | 2003 | 428 out of 851 | 139 out of 861 | 439 out of 851 | ‐ |
| AZACS | 2003 | 348 out of 1439 | 398 out of 1439 | 832 out of 1439 | 864 out of 1439 |
| Berg 2005 | 2005 | 92 out of 473 | 74 out of 473 | 195 out of 473 | 278 out of 473 |
| CLARICOR | 2006 | 1572 out of 4372 | 678 out of 4372 | 1761 out of 4372 | ‐ |
| CLARIFY | 2002 | 40 out of 148 | 28 out of 148 | 62 out of 148 | 113 out of 148 |
| Gabriel 2003l | 2003 | 4 out of 38 | 9 out of 38 | 14 out of 38 | 8 out of 38 |
| Gupta 2007 | 1997 | 19 out of 60 | 20 out of 60 | 11 out of 60 | 25 out of 60 |
| Hillis 2004 | 2004 | 25 out of 141 | 19 out of 141 | 57 out of 141 | ‐ |
| Hyodo 2004 | 2004 | 6 out of 31 | 8 out of 31 | 17 out of 31 | 17 out of 31 |
| Ikeoka 2009 | 2009 | 41 out of 82 | 0 out of 82 | 46 out of 82 | ‐ |
| ISAR‐3 | 2001 | 224 out of 1010 | 202 out of 1010 | 771 out of 1010 | ‐ |
| Jackson 1999 | 1999 | ‐ | ‐ | ‐ | ‐ |
| Kaehler 2005 | 2005 | 67 out of 327 | 18 out of 327 | 259 out of 327 | ‐ |
| Kim 2004 | 2004 | 55 out of 129 | 38 out of 129 | 69 out of 129 | 35 out of 129 |
| Kim 2012 | 2012 | 26 out of 50 | 4 out of 50 | 27 out of 50 | 8 out of 50 |
| Kormi 2014 | 2014 | ‐ | ‐ | ‐ | ‐ |
| Kuvin 2003 | 2003 | 32 out of 58 | 12 out of 58 | 34 out of 58 | 45 out of 58 |
| Leowattana 2001 | 2001 | 44 out of 84 | 37 out of 84 | 44 out of 84 | 53 out of 84 |
| MIDAS | 2003 | 21 out of 50 | 20 out of 50 | 39 out of 50 | 41 out of 50 |
| Parchure 2002 | 2002 | 5 out of 40 | 8 out of 40 | 12 out of 40 | 27 out of 40 |
| Pieniazek 2001 | 2001 | ‐ | ‐ | ‐ | ‐ |
| PROVE‐IT | 2005 | 1529 out of 4162 | 734 out of 4162 | 2091 out of 4162 | ‐ |
| Radoi 2003l | 2003 | 39 out of 109 | 27 out of 109 | 67 out of 109 | 78 out of 109 |
| ROXIS | 1997 | 53 out of 202 | 26 out of 202 | 112 out of 202 | 129 out of 202 |
| Sanati2019 | 2019 | ‐ | 26 out of 68 | 27 out of 68 | 26 out of 68 |
| Schulze 2013 | 2013 | 20 out of 42 | 15 out of 42 | 37 out of 42 | 37 out of 42 |
| Semaan 2000 | 2000 | ‐ | ‐ | ‐ | ‐ |
| Sinisalo 1998 | 1998 | ‐ | ‐ | 11 out of 33 | ‐ |
| Stojanovic 2011 | 2011 | ‐ | 18 out of 165 | 37 out of 165 | 29 out of 165 |
| Thomaidou 2017 | 2017 | 16 out of 40 | 15 out of 40 | 21 out of 40 | ‐ |
| TIPTOP | 2014 | 61 out of 80 | 23 out of 80 | 55 out of 80 | 54 out of 80 |
| Torgano 1999 | 1999 | ‐ | 23 out of 110 | 26 out of 110 | 15 out of 110 |
| Tüter 2007 | 2007 | ‐ | ‐ | 26 out of 36 | ‐ |
| WIZARD | 2003 | 1266 out of 7722 | 1637 out of 7722 | 3482 out of 7722 | 4786 out of 7722 |
| Ütük 2004 | 2004 | 52 out of 113 | 20 out of 113 | 34 out of 113 | 20 out of 113 |
Participants
A total of 26,638 participants with coronary heart disease were randomised in the 38 included trials. The number of participants in each trial ranged from 13 to 7747. The mean age was 61.6 years (range 53.8 years to 69.0 years). The mean proportion of women was 22.9%. The percentage of participants currently smoking was 25.6%, the percentage of participants with diabetes was 19.6%, the percentage of participants with hypertension was 51.0%, and the percentage of participants with hyperlipidaemia was 66.2%.
Experimental intervention
The included trials used numerous types of antibiotics as their experimental intervention: 15 trials used azithromycin; eight trials used doxycycline; five trials used clarithromycin; five trials used roxithromycin; two trials used spiramycin; one trial used erythromycin; one trial used ciprofloxacin; and one trial used gatifloxacin. Accordingly, 29 trials used macrolides, eight trials used tetracyclines, and two trials used quinolones. The duration of therapy in each trial ranged from three days to 12 months.
Control intervention
We included 31 trials where the control group received placebo. In the remaining seven trials, the control group received no intervention (apart from any co‐interventions also administered to the antibiotic group).
Co‐interventions
We included 29 trials where the participants received a type of co‐intervention. In 18 trials, the co‐interventions consisted of anti‐anginal therapy, anti‐ischaemic therapy, anti‐thrombotic therapy, and anti‐lipidaemic therapy; in six trials, the co‐interventions consisted of anti‐anginal therapy, anti‐ischaemic therapy, and anti‐thrombotic therapy; in five trials, the co‐intervention consisted of anti‐thrombotic therapy. In seven trials, the participants also received either percutaneous coronary intervention (four trials) or coronary artery bypass surgery (three trials). In the remaining nine trials, there was no mention of any use of co‐interventions. For further details, see 'Characteristics of included studies'.
Excluded studies
We excluded 14 trials after full‐text assessment based on our inclusion and exclusion criteria: four trials were not randomised; four trials did not use an antibiotic as the experimental intervention; three trials gave additional co‐intervention (omeprazole) to the experimental group but not to the control group; two trials did not compare antibiotics versus placebo or no intervention; and one trial assessed the effects of antibiotics for primary prevention of postoperative infection and not for secondary prevention of coronary heart disease. For further details, see 'Characteristics of excluded studies'.
Risk of bias in included studies
Based on the information that we collected from the published reports and information from authors, three trials were considered at low risk of bias (ACADEMIC 1999; AZACS 2003; CLARICOR 2006). The remaining 35 trials were considered at high risk of bias mainly because of domains being at unclear risk of bias. Many trials were judged to be at unclear risk of bias in several domains, and additional information could not be obtained from the authors when contacted. Additional information can be found in the 'Risk of bias' summary (Figure 2), the 'Risk of bias' graph (Figure 3), and 'Characteristics of included studies'.

'Risk of bias' summary: review authors' judgements about each risk of bias item for each included study. Multiple eligible treatments were used in two trials generating two further comparisons (= 38 trials reporting on 40 experimental groups).

'Risk of bias' graph: review authors' judgements about each risk of bias item presented as percentages across all included studies.
Allocation
The generation of the random sequence was at low risk of bias in 12 trials. The remaining 26 trials were described as being randomised, but the method used for sequence generation was not described and were judged at unclear risk of bias.
The method used to conceal allocation was adequate in 13 trials. In one trial, the concealment of allocation was not adequate and was judged at high risk of bias (TIPTOP 2014). The remaining 24 trials were described as being randomised, but the method used for allocation concealment was either not described or insufficiently described and were judged to be of unclear risk of bias.
Blinding
The blinding of participants and personnel was performed and adequately described in 22 trials and were judged at low risk of bias. Three trials described that they did not blind the participants and personnel and were judged at high risk of bias. The method for blinding of participants and personnel for the remaining 13 trials were either not described or insufficiently described and were judged at unclear risk of bias.
The blinding of outcome assessors was performed and adequately described in 13 trials and were judged at low risk of bias. The methods for blinding of outcome assessors for the remaining 25 trials were either not described or insufficiently described and were judged at unclear risk of bias.
Incomplete outcome data
Incomplete outcome data were addressed adequately in 19 trials and were judged at low risk of bias. Six trials did not properly deal with incomplete outcome data and were judged to be of high risk of bias. In the remaining 13 trials, incomplete outcome data were either not described or insufficiently described how they dealt with missing data and were judged at unclear risk of bias.
Selective reporting
Eight trials reported the results of the outcomes stated in their respective protocols, or reported all‐cause mortality and various types of serious adverse events, resulting in low risk of bias according to our predefined bias risk assessment. One trial did not report the same outcomes, as stated in the protocol and was judged at high risk of bias (WIZARD 2003). In the remaining 29 trials, no protocol could be obtained and the trial did not report our primary outcomes sufficiently and were judged at unclear risk of bias.
Other potential sources of bias
Thirty‐six trials had no other biases resulting in at low risk of bias. Two trials reported insufficient information to assess whether an important risk of bias exists.
Effects of interventions
See: Summary of findings 1 Antibiotics versus placebo or no intervention for secondary prevention of patients with coronary heart disease at maximum follow‐up; Summary of findings 2 Antibiotics versus placebo or no intervention for secondary prevention of patients with coronary heart disease at 24±6 months follow‐up
Primary outcomes
All‐cause mortality
Maximum follow‐up
For this outcome, 20/38 trials with a total of 25,774 participants and a mean follow‐up of 21.4 months (range 3.0 to 120.0 months) reported all‐cause mortality at maximum follow‐up. The specific assessment time points in each trial are presented in Table 3. A total of 1354/12,895 (10.5%) antibiotic participants died versus 1291/12,879 (10.0%) control participants. Random‐effects meta‐analysis showed that antibiotics versus placebo or no intervention seemed to increase the risk of all‐cause mortality (risk ratio (RR) 1.06; 95% confidence interval (CI) 0.99 to 1.13; P = 0.07; I2 = 0%; 25,774 participants; 20 trials; high certainty of evidence; Analysis 1.1). The corresponding absolute risk increase (ARI) was 0.48% and the number needed to treat for an additional harmful outcome (NNTH) was 208.
| Trial | Year | All‐cause mortality (months) | Cardiovascular mortality (months) | Myocardial infarction (months) | Stroke (months) | Sudden cardiac death (months) | Hospitalisation for any cause (months) | Revascularisation (months) | Unstable angina pectoris (months) |
| ACADEMIC | 1999 | 24 | 24 | 24 | 24 | NR | 24 | 24 | 24 |
| ACES | 2005 | 47 | 47 | 47 | 47 | NR | 47 | 47 | 47 |
| Aleksiadi 2007 | 2007 | NR | NR | NR | NR | NR | NR | NR | NR |
| ANTIBIO | 2003 | 12 | NR | 12 | 12 | NR | 12 | 12 | 12 |
| AZACS | 2003 | 6 | NR | 6 | NR | NR | 6 | 6 | NR |
| Berg 2005 | 2005 | 24 | NR | 24 | 24 | NR | NR | 24 | 24 |
| CLARICOR | 2006 | 120 | 120 | 120 | 120 | 120 | NR | NR | 120 |
| CLARIFY | 2002 | 18.5 | 18.5 | 18.5 | 18.5 | 18.5 | NR | NR | 18.5 |
| Gabriel 2003 | 2003 | NR | NR | NR | NR | NR | NR | NR | NR |
| Gupta 1997 | 1997 | 18 | 18 | NR | NR | NR | NR | NR | NR |
| Hillis 2004 | 2004 | NR | NR | NR | NR | NR | NR | NR | NR |
| Hyodo2004 | 2004 | NR | NR | NR | NR | NR | NR | NR | NR |
| Ikeoka 2009 | 2009 | 6 | NR | NR | NR | NR | NR | NR | NR |
| ISAR‐3 | 2001 | 12 | NR | 12 | NR | NR | NR | NR | NR |
| Jackson 1999 | 1999 | NR | NR | NR | NR | NR | NR | NR | NR |
| Kaehler2005 | 2005 | 12 | 12 | 12 | 12 | NR | NR | 12 | NR |
| Kim 2004 | 2004 | 12 | 12 | 12 | NR | NR | NR | 12 | NR |
| Kim 2012 | 2012 | NR | NR | NR | NR | NR | NR | NR | NR |
| Kormi 2014 | 2014 | NR | NR | NR | NR | NR | NR | NR | NR |
| Kuvin 2003 | 2003 | NR | NR | NR | NR | NR | NR | NR | NR |
| Leowattana2001 | 2001 | 3 | 3 | 3 | NR | NR | NR | 3 | NR |
| MIDAS | 2003 | 6 | 6 | 6 | NR | NR | NR | NR | NR |
| Parchure 2002 | 2002 | NR | NR | NR | NR | NR | NR | NR | NR |
| Pieniazek 2001 | 2001 | NR | NR | NR | NR | NR | NR | NR | NR |
| PROVE‐IT | 2005 | 24 | 24 | 24 | 24 | NR | 24 | 24 | 24 |
| Radoi et al | 2003 | 52 | 52 | NR | NR | NR | NR | NR | NR |
| ROXIS | 1997 | 6 | 6 | 6 | NR | NR | NR | NR | NR |
| Sanati 2019 | 2019 | NR | NR | NR | NR | NR | NR | NR | NR |
| Schulze 2013 | 2013 | NR | NR | NR | NR | NR | NR | NR | NR |
| Semaan 2000 | 2000 | NR | NR | NR | NR | NR | NR | NR | NR |
| Sinisalo 1998 | 1998 | NR | NR | NR | NR | NR | NR | NR | NR |
| Stojanovic 2011 | 2011 | NR | NR | NR | NR | NR | NR | NR | NR |
| Thomaidou 2017 | 2017 | NR | NR | NR | NR | NR | NR | NR | NR |
| TIPTOP | 2014 | 6 | 6 | 6 | 6 | NR | 6 | NR | NR |
| Torgano 1999 | 1999 | NR | NR | NR | NR | NR | NR | NR | NR |
| Tüter 2007 | 2007 | NR | NR | NR | NR | NR | NR | NR | NR |
| WIZARD | 2003 | 14 | NR | 14 | NR | NR | 14 | 14 | 14 |
| Ütük 2004 | 2004 | 6 | 6 | 6 | NR | NR | NR | 6 | 6 |
NR: Not reported.
Heterogeneity
Neither visual inspection of the forest plot nor tests for statistical heterogeneity (I2 = 0%; P = 0.88) indicated any heterogeneity.
Risk of bias and sensitivity analyses
Three trials were assessed at low risk of bias (ACADEMIC 1999; AZACS 2003; CLARICOR 2006). All other trials were assessed at high risk of bias. However, the overall outcome result was dominated by CLARICOR 2006 (73.1% of weight), which was at low risk of bias in all domains. The next three highest‐weighted trials (ACES 2005; PROVE‐IT 2005; WIZARD 2003) were all at low risk of bias in the majority of domains. We therefore decided to assess the risk of bias of the outcome result at low risk of bias.
The sensitivity analysis of trials at low risk of bias showed that antibiotics versus placebo or no intervention seemed to increase the risk of all‐cause mortality (RR 1.07; 95% CI 0.99 to 1.15; P = 0.07; I2 = 0%; 6113 participants; 3 trials; moderate certainty of evidence; Analysis 1.2). The corresponding ARI was 1.85% and the NNTH was 54.
The sensitivity analyses on incomplete outcome data showed that incomplete outcome data bias alone had the potential to influence the results (best‐worst fixed‐effect meta‐analysis: RR 0.98; 95% CI 0.92 to 1.04; P = 0.46; 25,815 participants; 20 trials; Analysis 1.3); (worst‐best fixed‐effect meta‐analysis: RR 1.13; 95% CI 1.06 to 1.21; P = 0.0001; 25,815 participants; 20 trials; Analysis 1.4); (modified best‐worst fixed‐effect meta‐analysis: RR 1.01; 95% CI 0.95 to 1.08; P = 0.69; 25,815 participants; 20 trials; Analysis 1.5); (modified worst‐best random‐effects meta‐analysis: RR 1.09; 95% CI 1.02 to 1.16; P = 0.007; 25,815 participants; 20 trials; Analysis 1.6). Data were imputed for 9 trials.
The sensitivity analysis on trials with optimal medical therapy showed that antibiotics versus placebo or no intervention seemed to increase the risk of all‐cause mortality (RR 1.06; 95% CI 0.99 to 1.13; P = 0.07; I2 = 0%; 23,294 participants; 13 trials; high certainty of evidence; Analysis 1.7). The corresponding ARI was 0.56% and the NNTH was 179.
Visual inspection of the funnel plot showed no signs of asymmetry (Figure 4). Based on the visual inspection of the funnel plot, we assessed the risk of publication bias as low.

Funnel plot of comparison: 1 Antibiotics versus placebo for secondary prevention of coronary heart disease at maximum follow‐up, outcome: 1.1 ALL‐CAUSE MORTALITY.
Subgroup analyses
We found no evidence of a difference in subgroups analyses according to antibiotic type (Analysis 1.8); antibody status (Analysis 1.9); use of statins (Analysis 1.10); age above or under 60 years (Analysis 1.11); clinical trial registration status (Analysis 1.12); length of follow‐up above or under 12 months follow‐up (Analysis 1.13); antibiotic class (Analysis 1.14); funding (Analysis 1.15); and control intervention (Analysis 1.16).
24±6 months follow‐up
At 24±6 months follow‐up, 6/38 trials with a total of 9517 participants and a mean follow‐up of 23.3 months (range 18.0 to 30.0 months) reported all‐cause mortality. The specific assessment time points in each trial are presented in Table 4. A total of 296/4750 (6.23%) antibiotic participants died versus 237/4767 (4.97%) control participants. Random‐effects meta‐analysis showed that antibiotics versus placebo or no intervention increased the risk of all‐cause mortality (RR 1.25; 95% CI 1.06 to 1.48; I2 = 0%; P = 0.007; 9517 participants; 6 trials; high certainty of evidence; Analysis 2.1). The corresponding ARI was 1.26% and the NNTH was 79 (95% CI 335 to 42).
| Trial | Year | All‐cause mortality (months) | Cardiovascular mortality (months) | Myocardial infarction (months) | Stroke (months) | Sudden cardiac death (months) | Hospitalisation for any cause (months) | Revascularisation (months) | Unstable angina pectoris (months) |
| ACADEMIC | 1999 | 24 | 24 | 24 | 24 | NR | 24 | 24 | 24 |
| ACES | 2005 | NR | NR | NR | NR | NR | NR | NR | NR |
| Aleksiadi 2007 | 2007 | NR | NR | NR | NR | NR | NR | NR | NR |
| ANTIBIO | 2003 | NR | NR | NR | NR | NR | NR | NR | NR |
| AZACS | 2003 | NR | NR | NR | NR | NR | NR | NR | NR |
| Berg 2005 | 2005 | 24 | NR | 24 | 24 | NR | NR | 24 | 24 |
| CLARICOR | 2006 | 30 | 30 | 30 | 30 | 30 | NR | NR | NR |
| CLARIFY | 2002 | 18.5 | 18.5 | 18.5 | 18.5 | 18.5 | NR | NR | 18.5 |
| Gabriel 2003 | 2003 | NR | NR | NR | NR | NR | NR | NR | NR |
| Gupta 1997 | 1997 | 18 | NR | NR | NR | NR | NR | NR | NR |
| Hillis 2004 | 2004 | NR | NR | NR | NR | NR | NR | NR | NR |
| Hyodo 2004 | 2004 | NR | NR | NR | NR | NR | NR | NR | NR |
| Ikeoka 2009 | 2009 | NR | NR | NR | NR | NR | NR | NR | NR |
| ISAR‐3 | 2001 | NR | NR | NR | NR | NR | NR | NR | NR |
| Jackson 1999 | 1999 | NR | NR | NR | NR | NR | NR | NR | NR |
| Kaehler 2005 | 2005 | NR | NR | NR | NR | NR | NR | NR | NR |
| Kim 2004 | 2004 | NR | NR | NR | NR | NR | NR | NR | NR |
| Kim 2012 | 2012 | NR | NR | NR | NR | NR | NR | NR | NR |
| Kormi 2014 | 2014 | NR | NR | NR | NR | NR | NR | NR | NR |
| Kuvin 2003 | 2003 | NR | NR | NR | NR | NR | NR | NR | NR |
| Leowattana 2001 | 2001 | NR | NR | NR | NR | NR | NR | NR | NR |
| MIDAS | 2003 | NR | NR | NR | NR | NR | NR | NR | NR |
| Parchure2002 | 2002 | NR | NR | NR | NR | NR | NR | NR | NR |
| Pieniazek 2001 | 2001 | NR | NR | NR | NR | NR | NR | NR | NR |
| PROVE‐IT | 2005 | 24 | 24 | 24 | 24 | NR | 24 | 24 | 24 |
| Radoi 2003 | 2003 | NR | NR | NR | NR | NR | NR | NR | NR |
| ROXIS | 1997 | NR | NR | NR | NR | NR | NR | NR | NR |
| Sanati 2019 | 2019 | NR | NR | NR | NR | NR | NR | NR | NR |
| Schulze 2013 | 2013 | NR | NR | NR | NR | NR | NR | NR | NR |
| Semaan2000 | 2000 | NR | NR | NR | NR | NR | NR | NR | NR |
| Sinisalo 1998 | 1998 | NR | NR | NR | NR | NR | NR | NR | NR |
| Stojanovic 2011 | 2011 | NR | NR | NR | NR | NR | NR | NR | NR |
| Thomaidou 2017 | 2017 | NR | NR | NR | NR | NR | NR | NR | NR |
| TIPTOP | 2014 | NR | NR | NR | NR | NR | NR | NR | NR |
| Torgano 1999 | 1999 | NR | NR | NR | NR | NR | NR | NR | NR |
| Tüter 2007 | 2007 | NR | NR | NR | NR | NR | NR | NR | NR |
| WIZARD | 2003 | NR | NR | NR | NR | NR | NR | NR | NR |
| Ütük 2004 | 2004 | NR | NR | NR | NR | NR | NR | NR | NR |
NR: Not reported.
Heterogeneity
Neither visual inspection of the forest plot nor tests for statistical heterogeneity (I2 = 0%; P = 0.90) indicated any heterogeneity.
Risk of bias and sensitivity analyses
Two trials were assessed at low risk of bias (ACADEMIC 1999; CLARICOR 2006). All other trials were assessed at high risk of bias. However, the overall outcome result was dominated by CLARICOR 2006 (73.5% of weight), which was at low risk of bias in all domains. The next two highest‐weighted trials (Berg 2005; PROVE‐IT 2005) were both at low risk of bias in the majority of domains. We therefore decided to assess the risk of bias of the outcome result at low risk of bias.
The sensitivity analysis of trials at low risk of bias showed that antibiotics versus placebo or no intervention probably increased the risk of all‐cause mortality (RR 1.25; 95% CI 1.03 to 1.51; P = 0.02; I2 = 0%; 4674 participants; 2 trials; moderate certainty of evidence; Analysis 2.2). The corresponding ARI was 1.86% and the NNTH was 54 (95% CI 446 to 26).
The sensitivity analyses on incomplete outcome data showed that incomplete outcome data bias alone did not have the potential to influence the results (best‐worst fixed‐effect meta‐analysis: RR 1.22; 95% CI 1.03 to 1.43; P = 0.02; 9518 participants; 6 trials; Analysis 2.3); (worst‐best fixed‐effect meta‐analysis: RR 1.31; 95% CI 1.11 to 1.54; P = 0.001; 9518 participants; 6 trials; Analysis 2.4); (modified best‐worst fixed‐effect meta‐analysis: RR 1.24; 95% CI 1.05 to 1.46; P = 0.01; 9518 participants; 6 trials; Analysis 2.5); (modified worst‐best fixed‐effect meta‐analysis: RR 1.28; 95% CI 1.09 to 1.51; P = 0.003; 9518 participants; 6 trials; Analysis 2.6). Data were imputed for 2 trials.
The sensitivity analysis on trials with optimal medical therapy showed that antibiotics versus placebo or no intervention probably increased the risk of all‐cause mortality (RR 1.27; 95% CI 1.07 to 1.50; I2 = 0%; P = 0.006; 8682 participants; 3 trials; moderate certainty of evidence; Analysis 2.7). The corresponding ARI was 1.36% and the NNTH was 73 (95% CI 279 to 39).
Subgroup analyses
We found no evidence of a difference in subgroups analyses according to antibiotic type (Analysis 2.8); antibody status (Analysis 2.9); use of statins (Analysis 2.10); age above or under 60 years (Analysis 2.11); clinical trial registration status (Analysis 2.12); antibiotic class (Analysis 2.13); and funding (Analysis 2.14). Subgroup analysis according to control intervention could not be conducted due to all trials being placebo‐controlled (Analysis 2.15).
Serious adverse events
Maximum follow‐up
None of the trials specifically assessed serious adverse event according toInternational Conference on Harmonization ‐ Good Clinical Practice (ICH‐GCP). Instead, the trials either reported composites of several specific serious adverse events or one specific serious adverse event.
We narratively reported the individual types of serious adverse events in each trial at maximum follow‐up in Table 5.
| Trial | Year | Type and number of serious adverse event (antibiotics group) | Type and number of serious adverse event (control group) |
| ACADEMIC | 1999 |
|
|
| ACES | 2005 |
|
|
| ANTIBIO | 2003 |
|
|
| AZACS | 2003 |
|
|
| Berg 2005 | 2005 |
|
|
| CLARICOR | 2006 |
|
|
| CLARIFY | 2002 |
|
|
| Gupta 1997 | 1997 |
|
|
| Hillis 2004 | 2004 |
|
|
| Ikeoka 2009 | 2009 |
|
|
| ISAR‐3 | 2001 |
|
|
| Jackson1999 | 1999 |
|
|
| Kaehler 2005 | 2005 |
|
|
| Kim 2004 | 2004 |
|
|
| Leowattana 2001 | 2001 |
|
|
| MIDAS | 2003 |
|
|
| PROVE‐IT | 2005 |
|
|
| Radoi 2003 | 2003 |
|
|
| ROXIS | 1997 |
|
|
| Sinisalo 1998 | 1998 |
|
|
| TIPTOP | 2014 |
|
|
| WIZARD | 2003 |
|
|
| Ütük 2004 | 2004 |
|
|
24±6 months follow‐up
None of the trials specifically assessed serious adverse event according to ICH‐GCP. Instead, the trials either reported composites of several specific serious adverse events or one specific serious adverse event.
We narratively reported the individual types of serious adverse events in each trial at 24±6 months follow‐up in Table 6.
| Trial | Year | Type and number of serious adverse event (antibiotics group) | Type and number of serious adverse event (control group) |
| ACADEMIC | 1999 |
|
|
| ACES | 2005 |
|
|
| Berg 2005 | 2005 |
|
|
| CLARICOR | 2006 |
|
|
| CLARIFY | 2002 |
|
|
| Gupta 1997 | 1997 |
|
|
| PROVE‐IT | 2005 |
|
|
Quality of life
None of the included trials reported any data on quality of life either at maximum follow‐up or at 24±6 months follow‐up.
Secondary outcomes
Cardiovascular mortality
Maximum follow‐up
At maximum follow‐up, 14/38 trials with a total of 14,180 participants and a mean follow‐up of 25.3 months (range 3.0 to 120.0 months) reported cardiovascular mortality. The specific assessment time points in each trial are presented in Table 3. A total of 547/7096 (7.71%) antibiotic participants died from a cardiac cause versus 511/7084 (7.21%) control participants. Random‐effects meta‐analysis showed that antibiotics versus placebo or no intervention resulted in little to no difference between the treatment groups on the risk of cardiovascular mortality (RR 1.08; 95% CI 0.96 to 1.20; P = 0.20; I2 = 0%; 14,180 participants; 14 trials; high certainty of evidence; Analysis 1.17).
Heterogeneity
Neither visual inspection of the forest plot nor tests for statistical heterogeneity (I2 = 0%; P = 0.55) indicated any heterogeneity.
Risk of bias and sensitivity analyses
Two trials were assessed at low risk of bias (ACADEMIC 1999; CLARICOR 2006). All other trials were assessed at high risk of bias. However, the overall outcome result was dominated by CLARICOR 2006 (80.4% of weight), which was at low risk of bias in all domains. The next two highest‐weighted trials (ACES 2005; PROVE‐IT 2005) were both at low risk of bias in the majority of domains. We therefore decided to assess the risk of bias of the outcome result at low risk of bias.
The sensitivity analysis of trials at low risk of bias showed that antibiotics versus placebo or no intervention seemed to probably increase the risk of cardiovascular mortality (RR 1.11; 95% CI 0.98 to 1.25; P = 0.11; I2= 0%; 4674 participants; 2 trials; moderate certainty of evidence; Analysis 1.18). The corresponding ARI was 1.78% and the NNTH was 57.
The sensitivity analyses on incomplete outcome data showed that incomplete outcome data bias alone had the potential to influence the results (best‐worst fixed‐effect meta‐analysis: RR 0.94; 95% CI 0.84 to 1.04; P = 0.22; 14,192 participants; 14 trials; Analysis 1.19); (worst‐best fixed‐effect meta‐analysis: RR 1.22; 95% CI 1.09 to 1.36; P = 0.0004; 14,192 participants; 14 trials; Analysis 1.20); (modified best‐worst fixed‐effect meta‐analysis: RR 1.00; 95% CI 0.89 to 1.11; P = 0.97; 14,192 participants; 14 trials; Analysis 1.21); (modified worst‐best fixed‐effects meta‐analysis: RR 1.15; 95% CI 1.03 to 1.28; P = 0.01; 14,192 participants; 14 trials; Analysis 1.22). Data were imputed for 5 trials.
The sensitivity analysis on trials with optimal medical therapy showed that antibiotics versus placebo or no intervention resulted in no evidence of a difference on the risk of cardiovascular mortality (RR 1.07; 95% CI 0.96 to 1.20; P = 0.21; I2= 20%; 13,407 participants; 10 trials; high certainty of evidence; Analysis 1.23).
Visual inspection of the funnel plot showed no signs of asymmetry (Figure 5). Based on the visual inspection of the funnel plot, we assessed the risk of publication bias as low.

Funnel plot of comparison: 1 Antibiotics versus placebo for secondary prevention of coronary heart disease at maximum follow‐up, outcome: 1.17 CARDIOVASCULAR MORTALITY.
Subgroup analyses
We found no evidence of a difference in subgroups analyses according to antibiotic type (Analysis 1.24); antibody status (Analysis 1.25); use of statins (Analysis 1.26); age above or under 60 years (Analysis 1.27); clinical trial registration status (Analysis 1.28); length of follow‐up above or under 12 months follow‐up (Analysis 1.29); antibiotic class (Analysis 1.30); funding (Analysis 1.31); and control intervention (Analysis 1.32).
24±6 months follow‐up
At 24±6 months follow‐up, 5/38 trials with a total of 9044 participants and a mean follow‐up of 23.1 months (range 18.0 to 30.0 months) reported cardiovascular mortality. The specific assessment time points in each trial are presented in Table 4. A total of 152/4512 (3.37%) antibiotic participants died from a cardiac cause versus 102/4532 (2.25%) control participants. Fixed‐effect meta‐analysis showed that antibiotics versus placebo or no intervention increased the risk of cardiovascular mortality (RR 1.50; 95% CI 1.17 to 1.91; P = 0.001; I2 = 0%; 9044 participants; 5 trials; high certainty of evidence; Analysis 2.16). The corresponding ARI was 1.12% and the NNTH was 89 (95% CI 261 to 49).
Heterogeneity
Neither visual inspection of the forest plot nor tests for statistical heterogeneity (I2 = 0%; P = 0.68) indicated any heterogeneity.
Risk of bias and sensitivity analyses
Two trials were assessed at low risk of bias (ACADEMIC 1999; CLARICOR 2006). All other trials were assessed at high risk of bias. However, the overall outcome result was dominated by CLARICOR 2006 (75.8% of weight), which was at low risk of bias in all domains. The next two highest‐weighted trials (ACADEMIC 1999; PROVE‐IT 2005) were either at low risk of bias in all domains or at low risk of bias in the majority of domains, respectively. We therefore decided to assess the risk of bias of the outcome result at low risk of bias.
The sensitivity analysis of trials at low risk of bias showed that antibiotics versus placebo or no intervention probably increased the risk of cardiovascular mortality (RR 1.43; 95% CI 1.09 to 1.89; P = 0.01; I2 = 0%; 4674 participants; 2 trials; moderate certainty of evidence; Analysis 2.17). The corresponding ARI was 1.51% and the NNTH was 66 (95% CI 319 to 32).
The sensitivity analyses on incomplete outcome data showed that incomplete outcome data bias alone did not have the potential to influence the results (best‐worst fixed‐effect meta‐analysis: RR 1.39; 95% CI 1.09 to 1.77; P = 0.007; 9045 participants; 5 trials; Analysis 2.18); (worst‐best fixed‐effect meta‐analysis: RR 1.60; 95% CI 1.26 to 2.04; P = 0.0001; 9045 participants; 5 trials; Analysis 2.19); (modified best‐worst fixed‐effect meta‐analysis: RR 1.44; 95% CI 1.13 to 1.84; P = 0.003; 9045 participants; 5 trials; Analysis 2.20); (modified worst‐best fixed‐effect meta‐analysis: RR 1.56; 95% CI 1.22 to 1.98; P = 0.0004; 9045 participants; 5 trials; Analysis 2.21). Data were imputed for 2 trials.
The sensitivity analysis on trials with optimal medical therapy showed that antibiotics versus placebo or no intervention probably increased the risk of cardiovascular mortality (RR 1.52; 95% CI 1.18 to 1.95; I2 = 0%; 8682 participants; 3 trials; moderate certainty of evidence; Analysis 2.22). The corresponding ARI was 1.15% and the NNTH was 87 (95% CI 250 to 47).
Subgroup analyses
We found no evidence of a difference in subgroups analyses according to antibiotic type (Analysis 2.23); antibody status (Analysis 2.24); use of statins (Analysis 2.25); age above or under 60 years (Analysis 2.26); clinical trial registration status (Analysis 2.27); antibiotic class (Analysis 2.28); and funding (Analysis 2.29). Subgroup analysis according to control intervention could not be conducted due to all trials being placebo‐controlled (Analysis 2.30).
Myocardial infarction
Maximum follow‐up
At maximum follow‐up, 17/38 trials with a total of 25,523 participants and a mean follow‐up of 20.7 months (range 3.0 to 120.0 months) reported myocardial infarction. The specific assessment time points in each trial are presented in Table 3. A total of 968/12,745 (7.60%) antibiotic participants had a myocardial infarction versus 1028/12,778 (8.05%) control participants. Random‐effects meta‐analysis showed that antibiotics versus placebo or no intervention resulted in little to no difference between the treatment groups on the risk of myocardial infarction (RR 0.95; 95% CI 0.88 to 1.03; P = 0.23; I2 = 0%; 25,523 participants; 17 trials; high certainty of evidence; Analysis 1.33).
Heterogeneity
Neither visual inspection of the forest plot nor tests for statistical heterogeneity (I2 = 0%; P = 0.72) indicated any heterogeneity.
Risk of bias and sensitivity analyses
Three trials were assessed at low risk of bias (ACADEMIC 1999; AZACS 2003; CLARICOR 2006). All other trials were assessed at high risk of bias. However, the overall outcome result was dominated by CLARICOR 2006 (52.9% of weight), which was at low risk of bias in all domains. The next three highest‐weighted trials (ACES 2005; PROVE‐IT 2005; WIZARD 2003) were all at low risk of bias in the majority of domains. We therefore decided to assess the risk of bias of the outcome result at low risk of bias.
The sensitivity analysis of trials at low risk of bias showed that antibiotics versus placebo or no intervention probably resulted in no evidence of a difference on the risk of myocardial infarction (RR 0.96; 95% CI 0.86 to 1.07; P = 0.46; I2 = 0%; 6113 participants; 3 trials; moderate certainty of evidence; Analysis 1.34).
The sensitivity analyses on incomplete outcome data showed that incomplete outcome data bias alone had the potential to influence the results (best‐worst random‐effects meta‐analysis: RR 0.82; 95% CI 0.72 to 0.94; 25,564 participants; P = 0.004; 17 trials; Analysis 1.35); (worst‐best random‐effects meta‐analysis: RR 1.05; 95% CI 0.90 to 1.24; P = 0.53; 25,564 participants; 17 trials; Analysis 1.36); (modified best‐worst random‐effects meta‐analysis: RR 0.91; 95% CI 0.84 to 0.99; P = 0.02; 25,564 participants; 17 trials; Analysis 1.37); (modified worst‐best random‐effects meta‐analysis: RR 1.00; 95% CI 0.90 to 1.10; P = 0.98; 25,564 participants; 17 trials; Analysis 1.38). Data were imputed for 8 trials.
The sensitivity analysis on trials with optimal medical therapy showed that antibiotics versus placebo or no intervention resulted in no evidence of a difference on the risk of myocardial infarction (RR 0.95; 95% CI 0.88 to 1.03; P = 0.24; I2= 0%; 23,327 participants; 12 trials; high certainty of evidence; Analysis 1.39).
Visual inspection of the funnel plot showed no signs of asymmetry (Figure 6). Based on the visual inspection of the funnel plot, we assessed the risk of publication bias as low.

Funnel plot of comparison: 1 Antibiotics versus placebo for secondary prevention of coronary heart disease at maximum follow‐up, outcome: 1.33 MYOCARDIAL INFARCTION.
Subgroup analyses
We found no evidence of a difference in subgroups analyses according to antibiotic type (Analysis 1.40); antibody status (Analysis 1.41); use of statins (Analysis 1.42); age above or under 60 years (Analysis 1.43); clinical trial registration status (Analysis 1.44); length of follow‐up above or under 12 months follow‐up (Analysis 1.45); antibiotic class (Analysis 1.46); funding (Analysis 1.47); and control intervention (Analysis 1.48).
24±6 months follow‐up
At 24±6 months follow‐up, 5/38 trials with a total of 9457 participants and a mean follow‐up of 24.3 months (range 18.5 to 30.0 months) reported myocardial infarction. The specific assessment time points in each trial are presented in Table 4. A total of 307/4710 (6.52%) antibiotic participants had a myocardial infarction versus 325/4747 (6.85%) control participants. Fixed‐effect meta‐analysis showed that antibiotics versus placebo or no intervention probably resulted in no evidence of a difference on the risk of myocardial infarction (RR 0.95; 95% CI 0.82 to 1.11; P = 0.53; I2 = 43%; 9457 participants; 5 trials; moderate certainty of evidence; Analysis 2.31).
Heterogeneity
Both visual inspection of the forest plot and tests for statistical heterogeneity (I2 = 43%; P = 0.14) indicated moderate heterogeneity.
Risk of bias and sensitivity analyses
Two trials were assessed at low risk of bias (ACADEMIC 1999; CLARICOR 2006). All other trials were assessed at high risk of bias. However, the overall outcome result was dominated by CLARICOR 2006 (45.4% of weight) and PROVE‐IT 2005 (47.5% of weight), which were at low risk of bias in all domains and in the majority of domains, respectively. We therefore decided to assess the risk of bias of the outcome result at low risk of bias.
The sensitivity analysis of trials at low risk of bias showed that antibiotics versus placebo or no intervention probably resulted in no evidence of a difference on the risk of myocardial infarction (RR 1.08; 95% CI 0.87 to 1.33; P = 0.48; I2 = 0%; 4674 participants; 2 trials; moderate certainty of evidence; Analysis 2.32).
The sensitivity analyses on incomplete outcome data showed that incomplete outcome data bias alone did not have the potential to influence the results (best‐worst fixed‐effect meta‐analysis: RR 0.93; 95% CI 0.80 to 1.08; P = 0.34; 9458 participants; 5 trials; Analysis 2.33); (worst‐best fixed‐effect meta‐analysis: RR 0.99; 95% CI 0.85 to 1.15; P = 0.86; 9458 participants; 5 trials; Analysis 2.34); (modified best‐worst fixed‐effect meta‐analysis: RR 0.94; 95% CI 0.81 to 1.09; P = 0.42; 9458 participants; 5 trials; Analysis 2.35); (modified worst‐best fixed‐effect meta‐analysis: RR 0.97; 95% CI 0.84 to 1.13; P = 0.71; 9458 participants; 5 trials; Analysis 2.36). Data were imputed for 2 trials.
The sensitivity analysis on trials with optimal medical therapy suggested that antibiotics versus placebo or no intervention resulted in no evidence of a difference on the risk of myocardial infarction (RR 0.96; 95% CI 0.83 to 1.12; P = 0.64; I2 = 66%; 8682 participants; 3 trials; low certainty of evidence; Analysis 2.37).
Subgroup analyses
We found evidence of a difference in subgroup analysis according to clinical trial registration status (I2= 77.8%; P = 0.03; Analysis 2.42). The unregistered trials suggested that antibiotics versus placebo or no intervention reduced the risk of myocardial infarction (RR 0.44; 95% CI 0.21 to 0.91; P = 0.03; I2 = 0%; 923 participants; 3 trials; low certainty of evidence; Analysis 2.42), while the registered trials showed that antibiotics versus placebo or no intervention probably resulted in no evidence of a difference on the risk of myocardial infarction (RR 0.99; 95% CI 0.81 to 1.21; P = 0.93; I2= 39%; 8534 participants; 2 trials; moderate certainty of evidence; Analysis 2.42).
All remaining tests for subgroup differences showed no evidence of a difference in subgroups analyses according to antibiotic type (Analysis 2.38); antibody status (Analysis 2.39); use of statins (Analysis 2.40); age above or under 60 years (Analysis 2.41); antibiotic class (Analysis 2.43); and funding (Analysis 2.44). Subgroup analysis according to control intervention could not be conducted due to all trials being placebo‐controlled (Analysis 2.45).
Stroke
Maximum follow‐up
At maximum follow‐up, 9/38 trials with a total of 14,774 participants and a mean follow‐up of 31.9 months (range 6.0 to 120.0 months) reported stroke. The specific assessment time points in each trial are presented in Table 3. A total of 455/7365 (6.18%) antibiotic participants had a stroke versus 404/7409 (5.45%) control participants. Fixed‐effect meta‐analysis showed that antibiotics versus placebo or no intervention seemed to increase the risk of stroke (RR 1.14; 95% CI 1.00 to 1.29; P = 0.04; I2 = 0%; 14,774 participants; 9 trials; high certainty of evidence; Analysis 1.49). The corresponding ARI was 0.73% and the NNTH was 138.
Heterogeneity
Neither visual inspection of the forest plot nor tests for statistical heterogeneity (I2 = 0%; P = 0.83) indicated any heterogeneity.
Risk of bias and sensitivity analyses
Two trials were assessed at low risk of bias (ACADEMIC 1999; CLARICOR 2006). All other trials were assessed at high risk of bias. However, the overall outcome result was dominated by CLARICOR 2006 (79.3% of weight), which was at low risk of bias in all domains. The next two highest‐weighted trials (ACES 2005; PROVE‐IT 2005) were both at low risk of bias in the majority of domains. We therefore decided to assess the risk of bias of the outcome result at low risk of bias.
The sensitivity analysis of trials at low risk of bias showed that antibiotics versus placebo or no intervention seemed to increase the risk of stroke (RR 1.14; 95% CI 0.99 to 1.31; P = 0.06; I2 = 12%; 4674 participants; 2 trials; moderate certainty of evidence; Analysis 1.50). The corresponding ARI was 1.94% and the NNTH was 52.
The sensitivity analyses on incomplete outcome data showed that incomplete outcome data bias alone had the potential to influence the results (best‐worst fixed‐effect meta‐analysis: RR 0.98; 95% CI 0.87 to 1.11; 14,779 participants; P = 0.75; 9 trials; Analysis 1.51); (worst‐best fixed‐effect meta‐analysis: RR 1.29; 95% CI 1.14 to 1.45; P < 0.0001; 14,779 participants; 9 trials; Analysis 1.52); (modified best‐worst fixed‐effect meta‐analysis: RR 1.05; 95% CI 0.93 to 1.19; P = 0.41; 14,779 participants; 9 trials; Analysis 1.53); (modified worst‐best fixed‐effect meta‐analysis: RR 1.21; 95% CI 1.07 to 1.37; P = 0.002; 14,779 participants; 9 trials; Analysis 1.54). Data were imputed for 4 trials.
The sensitivity analysis on trials with optimal medical therapy showed that antibiotics versus placebo or no intervention seemed to increase the risk of stroke (RR 1.13; 95% CI 0.99 to 1.28; P = 0.06; I2= 0%; 13,672 participants; 6 trials; high certainty of evidence; Analysis 1.55). The corresponding ARI was 0.72% and the NNTH was 140.
Subgroup analyses
We found no evidence of a difference in subgroups analyses according to antibiotic type (Analysis 1.56); antibody status (Analysis 1.57); use of statins (Analysis 1.58); age above or under 60 years (Analysis 1.59); clinical trial registration status (Analysis 1.60); length of follow‐up above or under 12 months follow‐up (Analysis 1.61); antibiotic class (Analysis 1.62); funding (Analysis 1.63); and control intervention (Analysis 1.64).
24±6 months follow‐up
At 24±6 months follow‐up, 5/38 trials with a total of 9457 participants and a mean follow‐up of 24.3 months (range 18.5 to 30.0 months) reported stroke. The specific assessment time points in each trial are presented in Table 4. A total of 116/4710 (2.46%) antibiotic participants had a stroke versus 100/4747 (2.11%) control participants. Fixed‐effect meta‐analysis showed that antibiotics versus placebo or no intervention resulted in no evidence of a difference on the risk of stroke (RR 1.17; 95% CI 0.90 to 1.52; P = 0.24; I2 = 0%; 9457 participants; 5 trials; high certainty of evidence; Analysis 2.46).
Heterogeneity
Neither visual inspection of the forest plot nor tests for statistical heterogeneity (I2 = 0%; P = 0.75) indicated any heterogeneity.
Risk of bias and sensitivity analyses
Two trials were assessed at low risk of bias (ACADEMIC 1999; CLARICOR 2006). All other trials were assessed at high risk of bias. However, the overall outcome result was dominated by CLARICOR 2006 (67.9% of weight), which was at low risk of bias in all domains. The next two highest‐weighted trials (Berg 2005; PROVE‐IT 2005) were both at low risk of bias in the majority of domains. We therefore decided to assess the risk of bias of the outcome result at low risk of bias.
The sensitivity analysis of trials at low risk of bias showed that antibiotics versus placebo or no intervention probably resulted in no evidence of a difference on the risk of stroke (RR 1.17; 95% CI 0.86 to 1.60; P = 0.33; I2 = 17%; 4674 participants; 2 trials; moderate certainty of evidence; Analysis 2.47).
The sensitivity analyses on incomplete outcome data showed that incomplete outcome data bias alone had the potential to influence the results (best‐worst fixed‐effect meta‐analysis: RR 1.08; 95% CI 0.84 to 1.40; 9458 participants; P = 0.54; 5 trials; Analysis 2.48); (worst‐best fixed‐effect meta‐analysis: RR 1.28; 95% CI 0.99 to 1.66; P = 0.06; 9458 participants; 5 trials; Analysis 2.49); (modified best‐worst fixed‐effect meta‐analysis: RR 1.13; 95% CI 0.87 to 1.46; P = 0.37; 9458 participants; 5 trials; Analysis 2.50); (modified worst‐best fixed‐effect meta‐analysis: RR 1.23; 95% CI 0.95 to 1.60; P = 0.12; 9458 participants; 5 trials; Analysis 2.51). Data were imputed for 2 trials.
The sensitivity analysis on trials with optimal medical therapy showed that antibiotics versus placebo or no intervention probably resulted in no evidence of a difference on the risk of stroke (RR 1.16; 95% CI 0.88 to 1.53; I2 = 0%; 8682 participants; P = 0.28; 3 trials; moderate certainty of evidence; Analysis 2.52).
Subgroup analyses
We found no evidence of a difference in subgroups analyses according to antibiotic type (Analysis 2.53); antibody status (Analysis 2.54); use of statins (Analysis 2.55); age above or under 60 years (Analysis 2.56); clinical trial registration status (Analysis 2.57); antibiotic class (Analysis 2.58); and funding (Analysis 2.59). Subgroup analysis according to control intervention could not be conducted due to all trials being placebo‐controlled (Analysis 2.60).
Sudden cardiac death
Maximum follow‐up
At maximum follow‐up, 2/38 trials with a total of 4520 participants and a mean follow‐up of 69.3 months (range 18.5 to 120.0 months) reported sudden cardiac death. The specific assessment time points in each trial are presented in Table 3. A total of 203/2246 (9.04%) antibiotic participants died suddenly versus 190/2274 (8.36%) control participants. Fixed‐effect meta‐analysis showed that antibiotics versus placebo or no intervention probably resulted in no evidence of a difference on the risk of sudden cardiac death (RR 1.08; 95% CI 0.90 to 1.31; P = 0.41; I2 = 0%; 4520 participants; 2 trials; moderate certainty of evidence; Analysis 1.65).
Heterogeneity
Neither visual inspection of the forest plot nor tests for statistical heterogeneity (I2 = 0%; P = 0.53) indicated any heterogeneity.
Risk of bias and sensitivity analyses
One trial was assessed at low risk of bias (CLARICOR 2006). The other trial (CLARIFY 2002) only had one bias risk domain of minor concern (selective outcome reporting) at unclear risk of bias. Hence, the risk of bias of the outcome result was assessed at low risk of bias.
The sensitivity analysis of trials at low risk of bias showed that antibiotics versus placebo or no intervention probably resulted in no evidence of a difference on the risk of sudden cardiac death (RR 1.08; 95% CI 0.89 to 1.30; P = 0.44; 4372 participants; 1 trial; moderate certainty of evidence; Analysis 1.66).
The sensitivity analyses on incomplete outcome data showed that incomplete outcome data bias alone did not have the potential to influence the results (best‐worst fixed‐effect meta‐analysis: RR 1.00; 95% CI 0.83 to 1.20; 4521 participants; P = 0.99; 2 trials; Analysis 1.67); (worst‐best fixed‐effect meta‐analysis: RR 1.14; 95% CI 0.95 to 1.37; P = 0.16; 4521 participants; 2 trials; Analysis 1.68); (modified best‐worst fixed‐effect meta‐analysis: RR 1.04; 95% CI 0.86 to 1.25; P = 0.69; 4521 participants; 2 trials; Analysis 1.69); (modified worst‐best fixed‐effect meta‐analysis: RR 1.11; 95% CI 0.92 to 1.34; P = 0.28; 4521 participants; 2 trials; Analysis 1.70). Data were imputed for 1 trial.
Sensitivity analysis on optimal medical therapy was not conducted due to both trials including optimal medical therapy.
Subgroup analyses
We found no evidence of a difference in subgroups analyses according to clinical trial registration status (Analysis 1.71) and funding (Analysis 1.72). Subgroup analyses according to antibiotic type (Analysis 1.73); antibody status (Analysis 1.74); use of statins (Analysis 1.75); age above or under 60 years (Analysis 1.76); length of follow‐up above or under 12 months follow‐up (Analysis 1.77); antibiotic class (Analysis 1.78); and control intervention (Analysis 1.79) could not be conducted due to both trials being included in the same subgroup.
24±6 months follow‐up
At 24±6 months follow‐up, 2/38 trials with a total of 4520 participants and a mean follow‐up of 24.3 months (range 18.5 to 30.0 months) reported sudden cardiac death. The specific assessment time points in each trial are presented in Table 4. A total of 98/2246 (4.36%) antibiotic participants died suddenly versus 56/2274 (2.46%) control participants. Fixed‐effect meta‐analysis showed that antibiotics versus placebo or no intervention probably increased the risk of sudden cardiac death (RR 1.77; 95% CI 1.28 to 2.44; P = 0.0005; I2 = 0%; 4520 participants; 2 trials; moderate certainty of evidence; Analysis 2.61). The corresponding ARI was 1.9% and the NNTH was 53 (95% CI 145 to 28).
Heterogeneity
Neither visual inspection of the forest plot nor tests for statistical heterogeneity (I2 = 0%; P = 0.74) indicated any heterogeneity.
Risk of bias and sensitivity analyses
One trial was assessed at low risk of bias (CLARICOR 2006). The other trial (CLARIFY 2002) only had one bias risk domain of minor concern (selective outcome reporting) at unclear risk of bias. Hence, the risk of bias of the outcome result was assessed at low risk of bias.
The sensitivity analysis of trials at low risk of bias showed that antibiotics versus placebo or no intervention probably increased the risk of sudden cardiac death (RR 1.75; 95% CI 1.27 to 2.42; P = 0.0007; 4372 participants; 1 trial; moderate certainty of evidence; Analysis 2.62). The corresponding ARI was 1.92% and the NNTH was 52 (95% CI 147 to 28).
The sensitivity analyses on incomplete outcome data showed that incomplete outcome data bias alone did not have the potential to influence the results (best‐worst fixed‐effect meta‐analysis: RR 1.68; 95% CI 1.22 to 2.30; 4521 participants; P = 0.001; 2 trials; Analysis 2.63); (worst‐best fixed‐effect meta‐analysis: RR 1.91; 95% CI 1.39 to 2.62; P < 0.0001; 4521 participants; 2 trials; Analysis 2.64); (modified best‐worst fixed‐effect meta‐analysis: RR 1.74; 95% CI 1.26 to 2.39; P = 0.0007; 4521 participants; 2 trials; Analysis 2.65); (modified worst‐best fixed‐effect meta‐analysis: RR 1.84; 95% CI 1.34 to 2.53; P = 0.0002; 4521 participants; 2 trials; Analysis 2.66). Data were imputed for 1 trial.
Sensitivity analysis on optimal medical therapy was not conducted due to both trials including optimal medical therapy.
Subgroup analyses
We found no evidence of a difference in subgroups analyses according to clinical trial registration status (Analysis 2.67) and funding (Analysis 2.68). Subgroup analyses according to antibiotic type (Analysis 2.69); antibody status (Analysis 2.70); use of statins (Analysis 2.71); age above or under 60 years (Analysis 2.72); antibiotic class (Analysis 2.73); and control intervention (Analysis 2.74) could not be conducted due to both trials being included in the same subgroup.
Additional post hoc outcomes
Hospitalisation for any cause
Maximum follow‐up
At maximum follow‐up, 7/38 trials with a total of 18,615 participants and a mean follow‐up of 17.9 months reported hospitalisation for any cause. The specific assessment time points in each trial are presented in Table 3. A total of 395/9298 (4.25%) antibiotics participants were hospitalised for any cause versus 381/9317 (4.09%) control participants. Fixed‐effect meta‐analysis showed that antibiotics versus placebo or no intervention resulted in no evidence of a difference on the risk of hospitalisation for any cause (RR 1.04; 95% CI 0.91 to 1.19; P = 0.56; I2= 0%; 18,615 participants; 7 trials; high certainty of evidence, Analysis 1.80).
24±6 months follow‐up
At 24±6 months follow‐up, 2/38 trials with a total of 4464 participants and a mean follow‐up of 24 months reported hospitalisation for any cause. The specific assessment time points in each trial are presented in Table 4. A total of 101/2226 (4.54%) antibiotics participants were hospitalised for any cause versus 99/2238 (4.42%) control participants. Fixed‐effect meta‐analysis showed that antibiotics versus placebo or no intervention probably resulted in no evidence of a difference on the risk of hospitalisation for any cause (RR 1.02; 95% CI 0.78 to 1.34; P = 0.85; I2= 0%; 4464 participants; 2 trials; moderate certainty of evidence; Analysis 2.75).
Revascularisation
Maximum follow‐up
At maximum follow‐up, 11/38 trials with a total of 19,631 participants and a mean follow‐up of 16.7 months reported revascularisation. The specific assessment time points in each trial are presented in Table 3. A total of 1259/9810 (12.8%) antibiotics participants were revascularised versus 1292/9821 (13.2%) control participants. Fixed‐effect meta‐analysis showed that antibiotics versus placebo or no intervention resulted in no evidence of a difference on the risk of revascularisation (RR 0.98; 95% CI 0.91 to 1.05; P = 0.53; I2= 0%; 19,631 participants; 11 trials; high certainty of evidence; Analysis 1.81).
24±6 months follow‐up
At 24±6 months follow‐up, 3/38 trials with a total of 4937 participants and a mean follow‐up of 24 months reported revascularisation. The specific assessment time points in each trial are presented in Table 4. A total of 370/2464 (15.0%) antibiotics participants were revascularised versus 396/2473 (16.0%) control participants. Fixed‐effect meta‐analysis showed that antibiotics versus placebo or no intervention probably resulted in no evidence of a difference on the risk of revascularisation (RR 0.94; 95% CI 0.83 to 1.07; P = 0.34; I2= 38%; 4937 participants; 3 trials; moderate certainty of evidence; Analysis 2.76).
Unstable angina pectoris
Maximum follow‐up
At maximum follow‐up, 9/38 trials with a total of 22,172 participants and a mean follow‐up of 32.2 months reported unstable angina pectoris. The specific assessment time points in each trial are presented in Table 3. A total of 743/11,068 (6.71%) antibiotics participants had unstable angina pectoris versus 738/11,104 (6.65%) control participants. Fixed‐effect meta‐analysis showed that antibiotics versus placebo or no intervention resulted in no evidence of a difference on the risk of unstable angina pectoris (RR 1.02; 95% CI 0.92 to 1.12; P = 0.76; I2= 0%; 22,172 participants; 9 trials; high certainty of evidence; Analysis 1.82).
24±6 months follow‐up
At 24±6 months follow‐up, 4/38 trials with a total of 5085 participants and a mean follow‐up of 22.6 months reported unstable angina pectoris. The specific assessment time points in each trial are presented in Table 4. A total of 116/2538 (4.57%) antibiotics participants had unstable angina pectoris versus 122/2547 (4.79%) control participants. Random‐effects meta‐analysis showed that antibiotics probably resulted in no evidence of a difference on the risk of unstable angina pectoris (RR 0.96; 95% CI 0.75 to 1.23; P = 0.72; I2= 0%; 5085 participants; 4 trials; moderate certainty of evidence; Analysis 2.77).
'Summary of findings' tables
Our main results (i.e. primary and secondary outcomes) are summarised in the summary of findings Table 1 (maximum follow‐up) and the summary of findings Table 2 (24±6 months follow‐up).
Discussion
Summary of main results
We were able to include 38 trials reported in 61 publications randomising a total of 26,638 participants with coronary heart disease. A total of 23/38 trials including 26,078 participants reported data that could be meta‐analysed. Three trials (ACADEMIC 1999; AZACS 2003; CLARICOR 2006) and all outcome results were assessed at low risk of bias. The remaining trials were at high risk of bias mainly due to domains being at unclear risk of bias. Trials assessing the effects of macrolides (28 trials randomising 22,059 participants) and quinolones (two trials randomising 4162 participants) contributed with the vast majority of the data, while tetracyclines (eight trials randomising 417 participants) contributed with insufficient data to evaluate its effect for secondary prevention of coronary heart disease.
At maximum follow‐up, meta‐analyses showed that antibiotics seemed to increase the risk of all‐cause mortality, stroke, and probably also cardiovascular mortality. Regarding the risk of myocardial infarction, meta‐analysis showed little to no difference between the treatment groups. For sudden cardiac death, meta‐analysis showed no evidence of a difference.
At 24±6 months follow‐up, meta‐analyses showed that antibiotics increased the risk of all‐cause mortality, cardiovascular mortality, and probably also sudden cardiac death. Regarding the risk of myocardial infarction and stroke, meta‐analyses showed no evidence of a difference.
None of the trials specifically assessed serious adverse event according to International Conference on Harmonization ‐ Good Clinical Practice (ICH‐GCP). Instead, the trials either reported composites of several specific serious adverse events or one specific serious adverse event. Hence, no meta‐analysis could be conducted.
No data were provided on quality of life.
Overall completeness and applicability of evidence
This review provides the most comprehensive and contemporary appraisal of the evidence on antibiotics for secondary prevention of patients with coronary heart disease to date. We searched for published and unpublished trials irrespective of setting, blinding, publication status, publication year, language, and reporting of our outcomes. None of our funnel plots indicated any significant signs of publication bias. However, all but three trials were at high risk of bias which suggests that our results might overestimate benefits and underestimate harms (Schulz 1995; Moher 1998; Kjaergard 2001; Gluud 2006; Wood 2008; Savovic 2012; Lundh 2017; Savovic 2018).
We included all adult (≥ 18 years) participants with coronary heart disease irrespective of sex, antibody status, severity of the disease, type of antibiotic used, and type of control group intervention (placebo or no intervention). Nevertheless, we found limited signs of statistical heterogeneity (except for myocardial infarction at 24±6 months follow‐up (see Potential biases in the review process)) which indicates that the pooling of these diverse participants and interventions was appropriate.
A limitation of the study design is that the presented results depends on the available extractable trial data. Hence, even though our inclusion criteria are broad, we might not have included all conceivable subgroups, and the majority of our results might include data from some specific subgroups. An example is that we have included more men than women. It is known that coronary heart disease affects men and women differently in regard to baseline risk and control event rate. However, we were not able to obtain individual participant data from the included trials. Therefore, it was not possible to conduct a subgroup analysis. Another example is that one trial weighted most in our analyses (CLARICOR 2006). This might result in our results and conclusions being limited to the participants included in CLARICOR 2006. On the contrary, all meta‐analyses except for myocardial infarction at 24+6 months follow‐up had, as mentioned above limited signs of statistical heterogeneity concluding that the other trials had results pointing in the same direction as CLARICOR 2006. This shows that even though CLARICOR 2006 weighted most, there is a small risk of the other trials showing different results.
There were no data on the effects of antibiotics versus placebo or no intervention on serious adverse event as defined by ICH‐GCP or quality of life. Hence, the effects of antibiotics on these outcomes are unclear. Another limitation of the completeness of evidence is that the vast majority of the data was only contributed by trials assessing the effects of either macrolides (28 trials randomising 22,059 participants) or quinolones (two trials randomising 4162 participants), while only a very small amount of the data was contributed by trials assessing the effects of tetracyclines (eight trials randomising 417 participants). We found no trials assessing the effects of other antibiotic classes. Hence, we do not know the benefits and harms of tetracyclines or other antibiotic classes for secondary prevention of coronary heart disease.
In our review, most of the findings showed harm. When assessing harms, it is important to remember the recommendations from the European Medical Agency (EMA). According to the EMA, in the case of adverse events, P values are of limited value as substantial differences (expressed as relative risk of risk differences) require careful assessment and will, in addition, raise concern, depending on seriousness, severity, or outcome, irrespective of the P value observed (EMA 2017). A non‐significant difference between treatments will not allow for a conclusion on the absence of a difference in safety. In other words, in line with general principles, a non‐significant test result should not be confused with the demonstration of equivalence (EMA 2017). Hence, even though several of our meta‐analyses did not show significant harmful results, we should not conclude that no harmful effect exists. Instead, we should look at the results which indicate that there seem to be a very high possibility of serious harm while there is a small possibility of a neutral result or benefit.
A limitation of the applicability of our results is that we chose maximum follow‐up as our time point of primary interest. Winkel and colleagues stated when discussing the findings from the 10‐years follow‐up of the CLARICOR trial that after three years follow‐up, the observed harmful effect of clarithromycin vanished (Winkel 2015). They found that the placebo‐treated participants seemed to catch up with the clarithromycin‐treated participants. They interpreted this as frailty attrition, i.e. the harmful events occurred 'prematurely' in a subset of participants vulnerable to the antibiotic, so after some time the survivors in the antibiotic group were on the whole more resistant. At the same time, the frail participants in the placebo group began experiencing harmful events because of natural causes unrelated to the trial, which did not happen to the survivors in the antibiotic group as the frail participants might already have died. This lead to the results being 'diluted' by events unrelated to the trial. Our other time point of interest was at 24±6 months follow‐up. It might be that the findings at 24±6 months follow‐up are showing a more true picture, as they may have not been affected by frailty attrition. Nevertheless, our findings at 24±6 months follow‐up are limited by possible imprecision, as only few trials reported their findings at 24±6 months follow‐up. Overall, even though this review provides the most comprehensive and contemporary appraisal of the evidence on antibiotics for secondary prevention of patients with coronary heart disease to date, our results might not show the actual true results. The actual true results might even be more harmful.
Quality of the evidence
Risk of systematic error ('bias')
Our 'risk of bias' assessment showed that only three trials were at low risk of bias (ACADEMIC 1999; AZACS 2003; CLARICOR 2006), while all other trials were at high risk of bias (see 'Risk of bias in included studies' for details). However, most information was either from trials at low risk of bias, or trials at low risk of bias in the majority of domains. We, therefore, interpreted that the potential limitations of the trials were unlikely to lower the confidence in the outcome results. Hence, we did not downgrade any outcome for risk of bias.
Risk of random error ‐ imprecision ('play of chance')
For all outcome results at both our time points, we either reached the optimal information size or the sample sizes were large (> 4000 participants). Accordingly, no outcome result was downgraded for risk of imprecision.
Indirectness
We assessed the differences between the population of interest and the included participants as low for all outcome results beside the sensitivity analysis of cardiovascular mortality only including low risk of bias trials at maximum follow‐up and the overall analyses of sudden cardiac death at both our time points. For these analyses, only very few trials were included. Hence, there is a risk of genetic differences and correspondingly the effect of antibiotics between the included participants in these analyses and patients in other parts of the world might differ. For all other analyses, several or more trials were included with significantly more participants which indicate a lower risk of difference. However, it might be discussed whether the low inclusion of women (22.9%) might affect the primary results. We acknowledge that the baseline risk of coronary heart disease and control event rate of mortality and cardiovascular events might be different in men and women. However, we do not think that there is a significant sex‐based difference in antibiotic activity (Soldin 2011; Whitley 2009).
We assessed the differences between the intervention of interest and the included interventions as low for all outcome results beside the sensitivity analysis of cardiovascular mortality only including low risk of bias trials at maximum follow‐up and the overall analyses of sudden cardiac death at both our time points. For these analyses, only two and one type of antibiotic was included, respectively. Hence, the results from these analyses might have been difference if several different types of antibiotics had been included.
We assessed the differences between the planned outcomes and the included outcomes as low. This was due to the trials reporting the outcomes in a similar way. Moreover, all outcomes were patient‐important.
Based on the above, we downgraded the sensitivity analysis of cardiovascular mortality only including low risk of bias trials at maximum follow‐up and the overall meta‐analyses of sudden cardiac death at both our time points by one level for serious risk of indirectness.
Heterogeneity ‐ inconsistency
We assessed the statistical heterogeneity in the planned analyses of our primary and secondary outcomes as low to moderate. Only the meta‐analysis of all trials on myocardial infarction at 24±6 months follow‐up had significant heterogeneity (I2 = 43%; P = 0.14). For all other meta‐analyses, the heterogeneity was low (I2 < 30%). The limited signs of statistical heterogeneity increases the validity of our results on all outcomes beside myocardial infarction at 24±6 months follow‐up. Accordingly, we downgraded the meta‐analysis of all trials on myocardial infarction at 24±6 months follow‐up by one level for serious risk of inconsistency.
Publication bias
We only assessed the risk of publication bias in meta‐analyses including at least 10 trials. Hence, meta‐analysis of stroke and sudden cardiac death at maximum follow‐up and all meta‐analyses at 24±6 follow‐up could not be assessed. For the remaining meta‐analyses, our funnel plots and corresponding tests did not show any clear sign of asymmetry. Accordingly, we did not downgrade any meta‐analysis for risk of publication bias.
GRADE
We have assessed the certainty of the evidence of each outcome results using GRADE (summary of findings Table 1 (maximum follow‐up) and summary of findings Table 2 (24±6 months follow‐up)). The GRADE assessment showed that the certainty of the evidence was high to moderate both at maximum follow‐up and at 24±6 months follow‐up. Reasons for the GRADE assessment are given in the footnotes of the table (summary of findings Table 1 (maximum follow‐up) and summary of findings Table 2 (24±6 months follow‐up)).
Potential biases in the review process
Strengths
Our review has several strengths. We are the first to conduct a systematic review using Cochrane methodology comparing antibiotics versus placebo or no intervention for secondary prevention in patients with coronary heart disease. We followed our peer‐reviewed protocol which was published before the literature search began (Sethi 2017), and we conducted the review using the methods recommended by Cochrane (Higgins 2011a). We included trials regardless of language of publication and whether they reported data on the outcomes we had planned to assess. We contacted all relevant authors if additional information was needed. We included more trials and more participants than any previous systematic review or meta‐analysis which gives us increased power and precision to detect any evidence of a difference between the intervention and control group. Data were double‐extracted by independent review authors minimising the risk of inaccurate data extraction, and we assessed the risk of bias in all trials according to TheCochrane Handbook for Systematic Reviews of Interventions (Higgins 2017). We used GRADE to assess the certainty of the body of evidence, subgroup analysis to assess possible heterogeneity, and sensitivity analyses to test the potential impact of overall bias risk, incomplete outcome data bias, and sub‐optimal medical therapy. Hence, this systematic review considered both risks of random errors and risks of systematic errors which adds further robustness to our results and conclusions.
Our meta‐analyses, except for the meta‐analysis of all trials on myocardial infarction at 24±6 months follow‐up, had little statistical heterogeneity strengthening the validity of our results.
Limitations
Our systematic review also has several limitations. Our findings, interpretations, and conclusions are affected by the quality, quantity, and outcome reporting of the included trials. Some limitations have already been discussed in the above section 'Overall completeness and applicability of evidence'.
Bias risk assessment
We only found three trials at low risk of bias (ACADEMIC 1999; AZACS 2003; CLARICOR 2006). We conducted sensitivity analyses only including low risk of bias trials to assess if the results differed compared to the overall analyses. We planned to base our primary analyses and primary conclusions on trials at low risk of bias, since meta‐epidemiological studies have shown that trials at high risk of bias overestimate benefit and underestimate harm (Schulz 1995; Moher 1998; Kjaergard 2001; Gluud 2006; Wood 2008; Savovic 2012; Savovic 2018). The outcome result for cardiovascular mortality at maximum follow‐up differed between the overall analysis and the sensitivity analysis only including low risk of bias trials. For all other outcome results, the results did not differ. Hence, for cardiovascular mortality at maximum follow‐up, we based our primary analysis and primary conclusion on the sensitivity analysis only including low risk of bias trials. For all other outcomes, we based our primary analyses and primary conclusions on the overall analyses.
Our assessment of publication bias was uncertain for all outcomes at 24±6 months follow‐up, as a relatively low number of trials was included.
Incomplete outcome data
In total, 19/38 trials were assessed at unclear or high risk of bias on the incomplete outcome data bias domain. Our 'best‐worst', 'worst‐best', modified 'best‐worst', and modified 'worst‐best' case analyses confirmed that there was a high risk of incomplete outcome data bias, especially for the analyses at maximum follow‐up. In 13/38 trials, it was not reported in sufficient detail if any participant was lost to follow‐up. It was often only reported that a certain number of participants died or experienced a type of serious adverse event without reporting if any of the participants were lost to follow‐up, etc. If insufficient data were reported by the trialists, we tried to contact the authors, but often the authors did not reply. Hence, the extent of the incomplete outcome data was often unclear. Our 'best‐worst', 'worst‐best', modified 'best‐worst', and modified 'worst‐best' case analyses might underestimate the potential impact of missing data because only the data on the reported population were used if no other information was available. Incomplete outcome data might potentially have an even greater bias impact than our 'best‐worst', 'worst‐best', modified 'best‐worst', and modified 'worst‐best' case analyses show, i.e. the 'true' differences between the actually observed cases and the intention‐to‐treat population might be larger than our data suggest.
Serious adverse event
The trials included in this review reported harms inadequately. None of the trials specifically assessed serious adverse event according to ICH‐GCP. Instead, the trials either reported composites of several specific serious adverse events or one specific serious adverse event. We could, therefore, not conduct a meta‐analysis as planned on all serious adverse events. Hence, it was not possible to assess the overall safety of antibiotics in patients with coronary heart disease. This is very problematic, as the reporting of harm is as important as the reporting of efficacy. Without adequate reporting of both harm and benefit, it is not possible to estimate if an intervention is useful or not (Ioannidis 2009; Storebø 2018).
Multiplicity
We used broad inclusion criteria to fully assess the effects of antibiotics for secondary prevention of patients with coronary heart disease. Therefore, we included a large number of outcomes, time points, subgroup analyses, and sensitivity analyses. We are aware that this increases the risk of type 1 error due to multiplicity. To minimise the potential risk, we used a more conservative alpha of 2.5% for our primary outcomes and 2.0% for our secondary outcomes (Jakobsen 2014; Jakobsen 2016). Nevertheless, as mentioned in the 'Differences between protocol and review', we did not use P values to determine whether a result was significant.
Agreements and disagreements with other studies or reviews
Systematic reviews and meta‐analyses of randomised clinical trials
We identified five systematic reviews and meta‐analyses of randomised clinical trials assessing the effects of antibiotics versus placebo or no intervention for secondary prevention in patients with coronary heart disease (Wells 2004; Etminan 2004; Andraws 2005; Baker 2007; Gluud 2008). None of the former reviews or meta‐analyses systematically assessed the risks of random error, used the GRADE approach to assess the certainty of the body of evidence, or assessed other time points than maximum follow‐up, and most of the reviews or meta‐analyses did not employ adequate assessments of risks of bias.
We also identified four systematic reviews of randomised clinical trials assessing the effects of antibiotics for secondary prevention in patients with any vascular disease (Illoh 2005), and any disease (Almalki 2014; Wong 2017; Hansen 2019), respectively.
Wells 2004 assessed the effects of antibiotics for the secondary prevention of patients with ischaemic heart disease and included nine trials enrolling 11,015 participants. They found no evidence of a difference on all‐cause mortality (risk ratio (RR) 0.94, 95% confidence interval (CI) 0.79 to 1.12) and any cardiac event (RR 0.94, 95% CI 0.86 to 1.03). Our results are not similar in regard to all‐cause mortality, as we found that antibiotics seem to have a harmful effect. We did not assess the effects of antibiotics on 'any cardiac event'.
Etminan 2004 assessed the effects of macrolides for the secondary prevention of patients with coronary artery disease and included nine trials enrolling 12,032 participants. They found no evidence of a difference on all‐cause mortality (RR 0.95, 95% CI 0.81 to 1.12), myocardial infarction or angina (RR 0.89, 95% CI 0.68 to 1.16), and any coronary event (RR 0.98, 95% CI 0.88 to 1.08). Our results are not similar in regard to all‐cause mortality, as we found that antibiotics seem to have a harmful effect. We did not assess the effects of antibiotics on 'myocardial or angina' or 'any coronary event'.
Illoh 2005 assessed the effects of antibiotics for the secondary prevention of patients with vascular disease and included 12 trials enrolling 12,236 participants. They found no evidence of a difference on any vascular event or death (odds ratio (OR) 0.84, 95% CI 0.67 to 1.05). We did not assess the effects of antibiotics on 'any vascular event or death'.
Andraws 2005 assessed the effects of antibiotics for secondary prevention of patients with coronary artery disease and included 11 trials enrolling 19,216 participants. They found no evidence of a difference on all‐cause mortality (OR 1.02, 95% CI 0.89 to 1.16), myocardial infarction (OR 0.92, 95% CI 0.81 to 1.04), and myocardial infarction or angina (OR 0.91, 95% CI 0.76 to 1.07). Their results on myocardial infarction are similar to ours, as we too did not find any evidence of a difference on the risk of myocardial infarction. With regards to all‐cause mortality, our results are not similar, as we found that antibiotics seem to have a harmful effect. We did not assess the effects of antibiotics on 'myocardial infarction or angina'.
Baker 2007 assessed the effects of azithromycin for the secondary prevention of patients with coronary artery disease and included six trials enrolling 13,778 participants. They found no evidence of a difference on all‐cause mortality (OR 0.91, 95% CI 0.77 to 1.09), myocardial infarction (OR 0.95, 95% CI 0.80 to 1.13), hospitalisation (OR 0.97, 95% CI 0.80 to 1.17), and any cardiac event (OR 0.93, 95% CI 0.84 to 1.03). Their results on myocardial infarction and hospitalisation are similar to ours, as we too did not find any evidence of a difference on the risk of myocardial infarction and hospitalisation. In regards to all‐cause mortality, our results are not similar, as we found that antibiotics seem to have a harmful effect. We did not assess the effects of antibiotics on 'any cardiac event'.
Gluud 2008 assessed the effects of antibiotics for the secondary prevention of patients with coronary heart disease and included 17 trials enrolling 25,271 participants. The meta‐analysis found evidence of a harmful effect of antibiotics on all‐cause mortality (RR 1.10, 95% CI 1.01 to 1.20), which is similar to our results, as we also found that antibiotics seem to have a harmful effect on the risk of all‐cause mortality.
Almalki 2014 assessed the effects of azithromycin for the secondary prevention of patients with any disease and included 12 trials enrolling 15,588 participants. They found no evidence of a difference on all‐cause mortality (RR 0.88, 95% CI 0.75 to 1.02), hospitalisation (RR 1.01, 95% CI 0.92 to 1.09), and any cardiac event (RR 1.00, 95% CI 0.90 to 1.13). Their results on hospitalisation are similar to ours, as we too did not find any evidence of a difference on the risk of hospitalisation. In regards to all‐cause mortality, our results are not similar, as we found that antibiotics seem to have a harmful effect on the risk of all‐cause mortality. We did not assess the effects of antibiotics on 'any cardiac event'.
Wong 2017 assessed the effects of macrolides for the secondary prevention of patients with any disease and included 16 trials. They found no evidence of a difference on any cardiac event (RR 1.03, 95% CI 0.96 to 1.10), myocardial infarction (RR 0.95, 95% CI 0.87 to 1.04), and stroke (RR 1.13, 95% CI 0.91 to 1.41). Their results on myocardial infarction are similar to ours, as we too did not find any evidence of a difference on the risk of myocardial infarction. In regards to stroke, our results are not similar, as we found that antibiotics seem to have a harmful effect on the risk of stroke. We did not assess the effects of antibiotics on 'any cardiac event'.
Hansen 2019 assessed the effects of macrolides for the secondary prevention of patients with any disease and included 183 trials enrolling 252,886 participants. They found no evidence of a difference on all‐cause mortality (OR 0.96, 95% CI 0.87 to 1.06) or cardiac disorders (i.e. arrhythmia, acute coronary syndrome, and not specified cardiac events) (OR 0.87, 95% CI 0.54 to 1.40). Their results on all‐cause mortality are not similar to ours, as we found that antibiotics seem to have a harmful effect on the risk of all‐cause mortality. We did not assess the effects of antibiotics on 'any cardiac disorder'.
Overall, especially when regarding all‐cause mortality, we disagree with the above‐mentioned reviews. A likely explanation might be that previous reviews did not have enough power to assess mortality both in regard to a much lower number of participants and event rate. A comparison with Andraws 2005 (which is the latest review with nearly the same inclusion criteria as us) in regard to all‐cause mortality shows that we included 10 more trials with a total of 6787 participants (ISAR‐3 2001; MIDAS 2003; Radoi 2003; Kim 2004; Ütük 2004; Berg 2005; Kaehler 2005; CLARICOR 2006; Ikeoka 2009; TIPTOP 2014). Moreover, most previous trials before CLARICOR 2006 had a short follow‐up which lead to a low event rate.
Systematic reviews of observational studies and recent large observational studies
We identified three systematic reviews of observational studies assessing the effects of macrolides compared to non‐use of macrolides in any patient regardless of disease (Cheng 2015; Wong 2017; Gorelik 2018). Moreover, we identified two recent observational studies, respectively, one conducted by the FDA (Mosholder 2018) and one supported by Pfizer (Zaroff 2020).
Cheng 2015 compared macrolides to non‐use of macrolides in any participant and included 33 studies enrolling 20,779,963 participants. They found evidence of a harmful effect of macrolides on 'sudden cardiac death or ventricular tachyarrhythmias' (RR 2.42, 95% CI 1.61 to 3.63), sudden cardiac death (RR 2.52, 95% CI 1.91 to 3.31), cardiovascular mortality (RR 1.31, 95% CI 1.06 to 1.62), and myocardial infarction (RR 1.08, 95% CI 1.01 to 1.15). They found no evidence of a difference on all‐cause mortality (RR 1.03, 95% CI 0.86 to 1.22), stroke (RR 1.10, 95% Ci 0.74 to 1.64), or any cardiac event (RR 1.05, 95% CI 0.94 to 1.17). Their results on cardiovascular mortality and myocardial infarction are not similar to ours, as we did not find any harmful effect of antibiotics on cardiovascular mortality and myocardial infarction. In regards to all‐cause mortality and stroke, our results are not similar, as we found that antibiotics seem to have a harmful effect on the risk of all‐cause mortality and stroke. We did not assess the effects of antibiotics on 'sudden cardiac death or ventricular tachyarrhythmias' and 'any cardiac event'.
Wong 2017 compared macrolides to non‐use of macrolides in any participant and included 17 studies. They found evidence of a harmful effect of macrolides on myocardial infarction (RR 1.10, 95% CI 1.04 to 1.17). They found no evidence of a difference on any cardiac event (RR 1.05, 95% CI 0.91 to 1.22), arrhythmia (RR 1.10, 95% CI 0.99 to 1.21), and stroke (RR 1.07, 95% CI 0.80 to 1.42). Their results on myocardial infarction are not similar to ours, as we did not find any harmful effect of antibiotics on the risk of myocardial infarction. In regards to stroke, our results are not similar, as we found that antibiotics seem to have a harmful effect on the risk of stroke. We did not assess the effects of antibiotics on 'any cardiac event' and 'arrhythmia'.
Gorelik 2018 compared macrolides to non‐use of macrolides in any participant and included 33 studies enrolling 22,601,032 participants. They found evidence of a harmful effect of macrolides on myocardial infarction (OR 1.15, 95% CI 1.01 to 1.30). They found no evidence of a difference on cardiovascular mortality (OR 1.22, 95% CI 0.94 to 1.59) or arrhythmia (OR 1.20, 95% CI 0.91 to 1.57). Their results on cardiovascular mortality and myocardial infarction are not similar to ours, as we did not find any harmful effect of antibiotics on the risk of cardiovascular mortality and myocardial infarction. We did not assess the effects of antibiotics on the risk of 'arrhythmia'.
Mosholder 2018 compared clarithromycin and erythromycin to doxycyline and enrolled 998,476 participants. They found evidence of a harmful effect of clarithromycin compared to doxycyline on all‐cause mortality and the harmful effect size increased based on the number of prescriptions of clarithromycin. After one prescription the hazard ratio (HR) was 1.25 (95% CI 1.21 to 1.29) and increased to 1.62 (95% CI 1.43 to 1.84) after five or more prescriptions. They also found evidence of a harmful effect of clarithromycin compared to doxycycline on myocardial infarction (HR 1.13, 95% CI 1.06 to 1.20) and stroke (HR 1.15, 95% CI 1.08 to 1.22), but the harmful effect size remained the same based on the number of prescriptions. Compareable results with smaller hazard ratios were shown when comparing erythromycin to doxycycline. This study showed that macrolides, especially clarithromycin, compared to doxycycline seem to increase the risk of all‐cause mortality, myocardial infarction, and stroke. Hence, it might be that macrolides have more harmful effects than other antibiotics.
Zaroff 2020 compared azithromycin to amoxicillin and enrolled 2,929,008 participants. They found evidence of a harmful effect of azithromycin compared to amoxicillin within five days of antibiotic exposure on all‐cause mortality (hazard ratio (HR) 2.00; 95% CI 1.51 to 2.63), cardiovascular mortality (HR 1.82, 95% CI 1.23 to 2.67), and non‐cardiovascular mortality (HR 2.17, 95% CI 1.44 to 3.26). No increased risk was found on any outcome when assessing events six to 10 days after antibiotic exposure. No increased risk was found on sudden cardiac death at both time points. This study showed that azithromycin compared to amoxicillin seem to increase the risk of mortality during the first five days after antibiotic exposure. The higher risk of mortality was both driven by cardiovascular and non‐cardiovascular events such as lung disease and cancer.

Study flow chart.

'Risk of bias' summary: review authors' judgements about each risk of bias item for each included study. Multiple eligible treatments were used in two trials generating two further comparisons (= 38 trials reporting on 40 experimental groups).

'Risk of bias' graph: review authors' judgements about each risk of bias item presented as percentages across all included studies.

Funnel plot of comparison: 1 Antibiotics versus placebo for secondary prevention of coronary heart disease at maximum follow‐up, outcome: 1.1 ALL‐CAUSE MORTALITY.

Funnel plot of comparison: 1 Antibiotics versus placebo for secondary prevention of coronary heart disease at maximum follow‐up, outcome: 1.17 CARDIOVASCULAR MORTALITY.

Funnel plot of comparison: 1 Antibiotics versus placebo for secondary prevention of coronary heart disease at maximum follow‐up, outcome: 1.33 MYOCARDIAL INFARCTION.

Comparison 1: Antibiotics versus placebo for secondary prevention of coronary heart disease at maximum follow‐up, Outcome 1: ALL‐CAUSE MORTALITY

Comparison 1: Antibiotics versus placebo for secondary prevention of coronary heart disease at maximum follow‐up, Outcome 2: All‐cause mortality ‐ trials at low risk of bias

Comparison 1: Antibiotics versus placebo for secondary prevention of coronary heart disease at maximum follow‐up, Outcome 3: All‐cause mortality ‐ 'best‐worst case' scenario

Comparison 1: Antibiotics versus placebo for secondary prevention of coronary heart disease at maximum follow‐up, Outcome 4: All‐cause mortality ‐ 'worst‐best case' scenario

Comparison 1: Antibiotics versus placebo for secondary prevention of coronary heart disease at maximum follow‐up, Outcome 5: All‐cause mortality ‐ modified 'best‐worst case' scenario

Comparison 1: Antibiotics versus placebo for secondary prevention of coronary heart disease at maximum follow‐up, Outcome 6: All‐cause mortality ‐ modified 'worst‐best case' scenario

Comparison 1: Antibiotics versus placebo for secondary prevention of coronary heart disease at maximum follow‐up, Outcome 7: All‐cause mortality ‐ trials with optimal medical therapy

Comparison 1: Antibiotics versus placebo for secondary prevention of coronary heart disease at maximum follow‐up, Outcome 8: All‐cause mortality according to type of antibiotic

Comparison 1: Antibiotics versus placebo for secondary prevention of coronary heart disease at maximum follow‐up, Outcome 9: All‐cause mortality according to antibody status

Comparison 1: Antibiotics versus placebo for secondary prevention of coronary heart disease at maximum follow‐up, Outcome 10: All‐cause mortality according to use of statins

Comparison 1: Antibiotics versus placebo for secondary prevention of coronary heart disease at maximum follow‐up, Outcome 11: All‐cause mortality according to the mean age

Comparison 1: Antibiotics versus placebo for secondary prevention of coronary heart disease at maximum follow‐up, Outcome 12: All‐cause mortality according to clinical trial registration status

Comparison 1: Antibiotics versus placebo for secondary prevention of coronary heart disease at maximum follow‐up, Outcome 13: All‐cause mortality according to length of follow‐up

Comparison 1: Antibiotics versus placebo for secondary prevention of coronary heart disease at maximum follow‐up, Outcome 14: All‐cause mortality according to class of antibiotic

Comparison 1: Antibiotics versus placebo for secondary prevention of coronary heart disease at maximum follow‐up, Outcome 15: All‐cause mortality according to funding

Comparison 1: Antibiotics versus placebo for secondary prevention of coronary heart disease at maximum follow‐up, Outcome 16: All‐cause mortality according to control intervention

Comparison 1: Antibiotics versus placebo for secondary prevention of coronary heart disease at maximum follow‐up, Outcome 17: CARDIOVASCULAR MORTALITY

Comparison 1: Antibiotics versus placebo for secondary prevention of coronary heart disease at maximum follow‐up, Outcome 18: Cardiovascular mortality ‐ trials at low risk of bias

Comparison 1: Antibiotics versus placebo for secondary prevention of coronary heart disease at maximum follow‐up, Outcome 19: Cardiovascular mortality ‐ 'best‐worst case' scenario

Comparison 1: Antibiotics versus placebo for secondary prevention of coronary heart disease at maximum follow‐up, Outcome 20: Cardiovascular mortality ‐ 'worst‐best case' scenario

Comparison 1: Antibiotics versus placebo for secondary prevention of coronary heart disease at maximum follow‐up, Outcome 21: Cardiovascular mortality ‐ modified 'best‐worst case' scenario

Comparison 1: Antibiotics versus placebo for secondary prevention of coronary heart disease at maximum follow‐up, Outcome 22: Cardiovascular mortality ‐ modified 'worst‐best case' scenario

Comparison 1: Antibiotics versus placebo for secondary prevention of coronary heart disease at maximum follow‐up, Outcome 23: Cardiovascular mortality ‐ trials with optimal medical therapy

Comparison 1: Antibiotics versus placebo for secondary prevention of coronary heart disease at maximum follow‐up, Outcome 24: Cardiovascular mortality according to type of antibiotic

Comparison 1: Antibiotics versus placebo for secondary prevention of coronary heart disease at maximum follow‐up, Outcome 25: Cardiovascular mortality according to antibody status

Comparison 1: Antibiotics versus placebo for secondary prevention of coronary heart disease at maximum follow‐up, Outcome 26: Cardiovascular mortality according to use of statins

Comparison 1: Antibiotics versus placebo for secondary prevention of coronary heart disease at maximum follow‐up, Outcome 27: Cardiovascular mortality according to the mean age

Comparison 1: Antibiotics versus placebo for secondary prevention of coronary heart disease at maximum follow‐up, Outcome 28: Cardiovascular mortality according to clinical trial registration status

Comparison 1: Antibiotics versus placebo for secondary prevention of coronary heart disease at maximum follow‐up, Outcome 29: Cardiovascular mortality according to length of follow‐up

Comparison 1: Antibiotics versus placebo for secondary prevention of coronary heart disease at maximum follow‐up, Outcome 30: Cardiovascular mortality according to class of antibiotic

Comparison 1: Antibiotics versus placebo for secondary prevention of coronary heart disease at maximum follow‐up, Outcome 31: Cardiovascular mortality according to funding

Comparison 1: Antibiotics versus placebo for secondary prevention of coronary heart disease at maximum follow‐up, Outcome 32: Cardiovascular mortality according to control intervention

Comparison 1: Antibiotics versus placebo for secondary prevention of coronary heart disease at maximum follow‐up, Outcome 33: MYOCARDIAL INFARCTION

Comparison 1: Antibiotics versus placebo for secondary prevention of coronary heart disease at maximum follow‐up, Outcome 34: Myocardial infarction ‐ trials at low risk of bias

Comparison 1: Antibiotics versus placebo for secondary prevention of coronary heart disease at maximum follow‐up, Outcome 35: Myocardial infarction ‐ 'best‐worst case' scenario

Comparison 1: Antibiotics versus placebo for secondary prevention of coronary heart disease at maximum follow‐up, Outcome 36: Myocardial infarction ‐ 'worst‐best case' scenario

Comparison 1: Antibiotics versus placebo for secondary prevention of coronary heart disease at maximum follow‐up, Outcome 37: Myocardial infarction ‐ modified 'best‐worst case' scenario

Comparison 1: Antibiotics versus placebo for secondary prevention of coronary heart disease at maximum follow‐up, Outcome 38: Myocardial infarction ‐ modified 'worst‐best case' scenario

Comparison 1: Antibiotics versus placebo for secondary prevention of coronary heart disease at maximum follow‐up, Outcome 39: Myocardial infarction ‐ trials with optimal medical therapy

Comparison 1: Antibiotics versus placebo for secondary prevention of coronary heart disease at maximum follow‐up, Outcome 40: Myocardial infarction according to type of antibiotic

Comparison 1: Antibiotics versus placebo for secondary prevention of coronary heart disease at maximum follow‐up, Outcome 41: Myocardial infarction according to antibody status

Comparison 1: Antibiotics versus placebo for secondary prevention of coronary heart disease at maximum follow‐up, Outcome 42: Myocardial infarction according to use of statins

Comparison 1: Antibiotics versus placebo for secondary prevention of coronary heart disease at maximum follow‐up, Outcome 43: Myocardial infarction according to the mean age

Comparison 1: Antibiotics versus placebo for secondary prevention of coronary heart disease at maximum follow‐up, Outcome 44: Myocardial infarction according to clinical trial registration status

Comparison 1: Antibiotics versus placebo for secondary prevention of coronary heart disease at maximum follow‐up, Outcome 45: Myocardial infarction according to length of follow‐up

Comparison 1: Antibiotics versus placebo for secondary prevention of coronary heart disease at maximum follow‐up, Outcome 46: Myocardial infarction according to class of antibiotic

Comparison 1: Antibiotics versus placebo for secondary prevention of coronary heart disease at maximum follow‐up, Outcome 47: Myocardial infarction according to funding

Comparison 1: Antibiotics versus placebo for secondary prevention of coronary heart disease at maximum follow‐up, Outcome 48: Myocardial infarction according to control intervention

Comparison 1: Antibiotics versus placebo for secondary prevention of coronary heart disease at maximum follow‐up, Outcome 49: STROKE

Comparison 1: Antibiotics versus placebo for secondary prevention of coronary heart disease at maximum follow‐up, Outcome 50: Stroke ‐ trials at low risk of bias

Comparison 1: Antibiotics versus placebo for secondary prevention of coronary heart disease at maximum follow‐up, Outcome 51: Stroke ‐ 'best‐worst case' scenario

Comparison 1: Antibiotics versus placebo for secondary prevention of coronary heart disease at maximum follow‐up, Outcome 52: Stroke ‐ 'worst‐best case' scenario

Comparison 1: Antibiotics versus placebo for secondary prevention of coronary heart disease at maximum follow‐up, Outcome 53: Stroke ‐ modified 'best‐worst case' scenario

Comparison 1: Antibiotics versus placebo for secondary prevention of coronary heart disease at maximum follow‐up, Outcome 54: Stroke ‐ modified 'worst‐best case' scenario

Comparison 1: Antibiotics versus placebo for secondary prevention of coronary heart disease at maximum follow‐up, Outcome 55: Stroke ‐ trials with optimal medical therapy

Comparison 1: Antibiotics versus placebo for secondary prevention of coronary heart disease at maximum follow‐up, Outcome 56: Stroke according to type of antibiotic

Comparison 1: Antibiotics versus placebo for secondary prevention of coronary heart disease at maximum follow‐up, Outcome 57: Stroke according to antibody status

Comparison 1: Antibiotics versus placebo for secondary prevention of coronary heart disease at maximum follow‐up, Outcome 58: Stroke according to use of statins

Comparison 1: Antibiotics versus placebo for secondary prevention of coronary heart disease at maximum follow‐up, Outcome 59: Stroke according to the mean age

Comparison 1: Antibiotics versus placebo for secondary prevention of coronary heart disease at maximum follow‐up, Outcome 60: Stroke according to clinical trial registration status

Comparison 1: Antibiotics versus placebo for secondary prevention of coronary heart disease at maximum follow‐up, Outcome 61: Stroke according to length of follow‐up

Comparison 1: Antibiotics versus placebo for secondary prevention of coronary heart disease at maximum follow‐up, Outcome 62: Stroke according to class of antibiotic

Comparison 1: Antibiotics versus placebo for secondary prevention of coronary heart disease at maximum follow‐up, Outcome 63: Stroke according to funding

Comparison 1: Antibiotics versus placebo for secondary prevention of coronary heart disease at maximum follow‐up, Outcome 64: Stroke according to control intervention

Comparison 1: Antibiotics versus placebo for secondary prevention of coronary heart disease at maximum follow‐up, Outcome 65: SUDDEN CARDIAC DEATH

Comparison 1: Antibiotics versus placebo for secondary prevention of coronary heart disease at maximum follow‐up, Outcome 66: Sudden cardiac death ‐ trials at low risk of bias

Comparison 1: Antibiotics versus placebo for secondary prevention of coronary heart disease at maximum follow‐up, Outcome 67: Sudden cardiac death ‐ 'best‐worst case' scenario

Comparison 1: Antibiotics versus placebo for secondary prevention of coronary heart disease at maximum follow‐up, Outcome 68: Sudden cardiac death ‐ 'worst‐best case' scenario

Comparison 1: Antibiotics versus placebo for secondary prevention of coronary heart disease at maximum follow‐up, Outcome 69: Sudden cardiac death ‐ modified 'best‐worst case' scenario

Comparison 1: Antibiotics versus placebo for secondary prevention of coronary heart disease at maximum follow‐up, Outcome 70: Sudden cardiac death ‐ modified 'worst‐best case' scenario

Comparison 1: Antibiotics versus placebo for secondary prevention of coronary heart disease at maximum follow‐up, Outcome 71: Sudden cardiac death according to clinical trial registration status

Comparison 1: Antibiotics versus placebo for secondary prevention of coronary heart disease at maximum follow‐up, Outcome 72: Sudden cardiac death according to funding

Comparison 1: Antibiotics versus placebo for secondary prevention of coronary heart disease at maximum follow‐up, Outcome 73: Sudden cardiac death according to type of antibiotic

Comparison 1: Antibiotics versus placebo for secondary prevention of coronary heart disease at maximum follow‐up, Outcome 74: Sudden cardiac death according to antibody status

Comparison 1: Antibiotics versus placebo for secondary prevention of coronary heart disease at maximum follow‐up, Outcome 75: Sudden cardiac death according to use of statins

Comparison 1: Antibiotics versus placebo for secondary prevention of coronary heart disease at maximum follow‐up, Outcome 76: Sudden cardiac death according to the mean age

Comparison 1: Antibiotics versus placebo for secondary prevention of coronary heart disease at maximum follow‐up, Outcome 77: Sudden cardiac death according to length of follow‐up

Comparison 1: Antibiotics versus placebo for secondary prevention of coronary heart disease at maximum follow‐up, Outcome 78: Sudden cardiac death according to class of antibiotic

Comparison 1: Antibiotics versus placebo for secondary prevention of coronary heart disease at maximum follow‐up, Outcome 79: Sudden cardiac death according to control intervention

Comparison 1: Antibiotics versus placebo for secondary prevention of coronary heart disease at maximum follow‐up, Outcome 80: HOSPITALISATION FOR ANY CAUSE

Comparison 1: Antibiotics versus placebo for secondary prevention of coronary heart disease at maximum follow‐up, Outcome 81: REVASCULARISATION

Comparison 1: Antibiotics versus placebo for secondary prevention of coronary heart disease at maximum follow‐up, Outcome 82: UNSTABLE ANGINA PECTORIS

Comparison 2: Antibiotics versus placebo for secondary prevention of coronary heart disease at 24±6 months follow‐up, Outcome 1: ALL‐CAUSE MORTALITY

Comparison 2: Antibiotics versus placebo for secondary prevention of coronary heart disease at 24±6 months follow‐up, Outcome 2: All‐cause mortality ‐ trials at low risk of bias

Comparison 2: Antibiotics versus placebo for secondary prevention of coronary heart disease at 24±6 months follow‐up, Outcome 3: All‐cause mortality ‐ 'best‐worst case' scenario

Comparison 2: Antibiotics versus placebo for secondary prevention of coronary heart disease at 24±6 months follow‐up, Outcome 4: All‐cause mortality ‐ 'worst‐best case' scenario

Comparison 2: Antibiotics versus placebo for secondary prevention of coronary heart disease at 24±6 months follow‐up, Outcome 5: All‐cause mortality ‐ modified 'best‐worst case' scenario

Comparison 2: Antibiotics versus placebo for secondary prevention of coronary heart disease at 24±6 months follow‐up, Outcome 6: All‐cause mortality ‐ modified 'worst‐best case' scenario

Comparison 2: Antibiotics versus placebo for secondary prevention of coronary heart disease at 24±6 months follow‐up, Outcome 7: All‐cause mortality ‐ trials with optimal medical therapy

Comparison 2: Antibiotics versus placebo for secondary prevention of coronary heart disease at 24±6 months follow‐up, Outcome 8: All‐cause mortality according to type of antibiotic

Comparison 2: Antibiotics versus placebo for secondary prevention of coronary heart disease at 24±6 months follow‐up, Outcome 9: All‐cause mortality according to antibody status

Comparison 2: Antibiotics versus placebo for secondary prevention of coronary heart disease at 24±6 months follow‐up, Outcome 10: All‐cause mortality according to use of statins

Comparison 2: Antibiotics versus placebo for secondary prevention of coronary heart disease at 24±6 months follow‐up, Outcome 11: All‐cause mortality according to the mean age

Comparison 2: Antibiotics versus placebo for secondary prevention of coronary heart disease at 24±6 months follow‐up, Outcome 12: All‐cause mortality according to clinical trial registration status

Comparison 2: Antibiotics versus placebo for secondary prevention of coronary heart disease at 24±6 months follow‐up, Outcome 13: All‐cause mortality according to class of antibiotic

Comparison 2: Antibiotics versus placebo for secondary prevention of coronary heart disease at 24±6 months follow‐up, Outcome 14: All‐cause mortality according to funding

Comparison 2: Antibiotics versus placebo for secondary prevention of coronary heart disease at 24±6 months follow‐up, Outcome 15: All‐cause mortality according to control intervention

Comparison 2: Antibiotics versus placebo for secondary prevention of coronary heart disease at 24±6 months follow‐up, Outcome 16: CARDIOVASCULAR MORTALITY

Comparison 2: Antibiotics versus placebo for secondary prevention of coronary heart disease at 24±6 months follow‐up, Outcome 17: Cardiovascular mortality ‐ trials at low risk of bias

Comparison 2: Antibiotics versus placebo for secondary prevention of coronary heart disease at 24±6 months follow‐up, Outcome 18: Cardiovascular mortality ‐ 'best‐worst case' scenario

Comparison 2: Antibiotics versus placebo for secondary prevention of coronary heart disease at 24±6 months follow‐up, Outcome 19: Cardiovascular mortality ‐ 'worst‐best case' scenario

Comparison 2: Antibiotics versus placebo for secondary prevention of coronary heart disease at 24±6 months follow‐up, Outcome 20: Cardiovascular mortality ‐ modified 'best‐worst case' scenario

Comparison 2: Antibiotics versus placebo for secondary prevention of coronary heart disease at 24±6 months follow‐up, Outcome 21: Cardiovascular mortality ‐ modified 'worst‐best case' scenario

Comparison 2: Antibiotics versus placebo for secondary prevention of coronary heart disease at 24±6 months follow‐up, Outcome 22: Cardiovascular mortality ‐ trials with optimal medical therapy

Comparison 2: Antibiotics versus placebo for secondary prevention of coronary heart disease at 24±6 months follow‐up, Outcome 23: Cardiovascular mortality according to type of antibiotic

Comparison 2: Antibiotics versus placebo for secondary prevention of coronary heart disease at 24±6 months follow‐up, Outcome 24: Cardiovascular mortality according to antibody status

Comparison 2: Antibiotics versus placebo for secondary prevention of coronary heart disease at 24±6 months follow‐up, Outcome 25: Cardiovascular mortality according to use of statins

Comparison 2: Antibiotics versus placebo for secondary prevention of coronary heart disease at 24±6 months follow‐up, Outcome 26: Cardiovascular mortality according to the mean age

Comparison 2: Antibiotics versus placebo for secondary prevention of coronary heart disease at 24±6 months follow‐up, Outcome 27: Cardiovascular mortality according to clinical trial registration status

Comparison 2: Antibiotics versus placebo for secondary prevention of coronary heart disease at 24±6 months follow‐up, Outcome 28: Cardiovascular mortality according to class of antibiotic

Comparison 2: Antibiotics versus placebo for secondary prevention of coronary heart disease at 24±6 months follow‐up, Outcome 29: Cardiovascular mortality according to funding

Comparison 2: Antibiotics versus placebo for secondary prevention of coronary heart disease at 24±6 months follow‐up, Outcome 30: Cardiovascular mortality according to control intervention

Comparison 2: Antibiotics versus placebo for secondary prevention of coronary heart disease at 24±6 months follow‐up, Outcome 31: MYOCARDIAL INFARCTION

Comparison 2: Antibiotics versus placebo for secondary prevention of coronary heart disease at 24±6 months follow‐up, Outcome 32: Myocardial infarction ‐ trials at low risk of bias

Comparison 2: Antibiotics versus placebo for secondary prevention of coronary heart disease at 24±6 months follow‐up, Outcome 33: Myocardial infarction ‐ 'best‐worst case' scenario

Comparison 2: Antibiotics versus placebo for secondary prevention of coronary heart disease at 24±6 months follow‐up, Outcome 34: Myocardial infarction ‐ 'worst‐best case' scenario

Comparison 2: Antibiotics versus placebo for secondary prevention of coronary heart disease at 24±6 months follow‐up, Outcome 35: Myocardial infarction ‐ modified 'best‐worst case' scenario

Comparison 2: Antibiotics versus placebo for secondary prevention of coronary heart disease at 24±6 months follow‐up, Outcome 36: Myocardial infarction ‐ modified 'worst‐best case' scenario

Comparison 2: Antibiotics versus placebo for secondary prevention of coronary heart disease at 24±6 months follow‐up, Outcome 37: Myocardial infarction ‐ trials with optimal medical therapy

Comparison 2: Antibiotics versus placebo for secondary prevention of coronary heart disease at 24±6 months follow‐up, Outcome 38: Myocardial infarction according to type of antibiotic

Comparison 2: Antibiotics versus placebo for secondary prevention of coronary heart disease at 24±6 months follow‐up, Outcome 39: Myocardial infarction according to antibody status

Comparison 2: Antibiotics versus placebo for secondary prevention of coronary heart disease at 24±6 months follow‐up, Outcome 40: Myocardial infarction according to use of statins

Comparison 2: Antibiotics versus placebo for secondary prevention of coronary heart disease at 24±6 months follow‐up, Outcome 41: Myocardial infarction according to the mean age

Comparison 2: Antibiotics versus placebo for secondary prevention of coronary heart disease at 24±6 months follow‐up, Outcome 42: Myocardial infarction according to clinical trial registration status

Comparison 2: Antibiotics versus placebo for secondary prevention of coronary heart disease at 24±6 months follow‐up, Outcome 43: Myocardial infarction according to class of antibiotic

Comparison 2: Antibiotics versus placebo for secondary prevention of coronary heart disease at 24±6 months follow‐up, Outcome 44: Myocardial infarction according to funding

Comparison 2: Antibiotics versus placebo for secondary prevention of coronary heart disease at 24±6 months follow‐up, Outcome 45: Myocardial infarction according to control intervention

Comparison 2: Antibiotics versus placebo for secondary prevention of coronary heart disease at 24±6 months follow‐up, Outcome 46: STROKE

Comparison 2: Antibiotics versus placebo for secondary prevention of coronary heart disease at 24±6 months follow‐up, Outcome 47: Stroke ‐ trials at low risk of bias

Comparison 2: Antibiotics versus placebo for secondary prevention of coronary heart disease at 24±6 months follow‐up, Outcome 48: Stroke ‐ 'best‐worst case' scenario

Comparison 2: Antibiotics versus placebo for secondary prevention of coronary heart disease at 24±6 months follow‐up, Outcome 49: Stroke ‐ 'worst‐best case' scenario

Comparison 2: Antibiotics versus placebo for secondary prevention of coronary heart disease at 24±6 months follow‐up, Outcome 50: Stroke ‐ modified 'best‐worst case' scenario

Comparison 2: Antibiotics versus placebo for secondary prevention of coronary heart disease at 24±6 months follow‐up, Outcome 51: Stroke ‐ modified 'worst‐best case' scenario

Comparison 2: Antibiotics versus placebo for secondary prevention of coronary heart disease at 24±6 months follow‐up, Outcome 52: Stroke ‐ trials with optimal medical therapy

Comparison 2: Antibiotics versus placebo for secondary prevention of coronary heart disease at 24±6 months follow‐up, Outcome 53: Stroke according to type of antibiotic

Comparison 2: Antibiotics versus placebo for secondary prevention of coronary heart disease at 24±6 months follow‐up, Outcome 54: Stroke according to antibody status

Comparison 2: Antibiotics versus placebo for secondary prevention of coronary heart disease at 24±6 months follow‐up, Outcome 55: Stroke according to use of statins

Comparison 2: Antibiotics versus placebo for secondary prevention of coronary heart disease at 24±6 months follow‐up, Outcome 56: Stroke according to the mean age

Comparison 2: Antibiotics versus placebo for secondary prevention of coronary heart disease at 24±6 months follow‐up, Outcome 57: Stroke according to clinical trial registration status

Comparison 2: Antibiotics versus placebo for secondary prevention of coronary heart disease at 24±6 months follow‐up, Outcome 58: Stroke according to class of antibiotic

Comparison 2: Antibiotics versus placebo for secondary prevention of coronary heart disease at 24±6 months follow‐up, Outcome 59: Stroke according to funding

Comparison 2: Antibiotics versus placebo for secondary prevention of coronary heart disease at 24±6 months follow‐up, Outcome 60: Stroke according to control intervention

Comparison 2: Antibiotics versus placebo for secondary prevention of coronary heart disease at 24±6 months follow‐up, Outcome 61: SUDDEN CARDIAC DEATH

Comparison 2: Antibiotics versus placebo for secondary prevention of coronary heart disease at 24±6 months follow‐up, Outcome 62: Sudden cardiac death ‐ trials at low risk of bias

Comparison 2: Antibiotics versus placebo for secondary prevention of coronary heart disease at 24±6 months follow‐up, Outcome 63: Sudden cardiac death ‐ 'best‐worst case' scenario

Comparison 2: Antibiotics versus placebo for secondary prevention of coronary heart disease at 24±6 months follow‐up, Outcome 64: Sudden cardiac death ‐ 'worst‐best case' scenario

Comparison 2: Antibiotics versus placebo for secondary prevention of coronary heart disease at 24±6 months follow‐up, Outcome 65: Sudden cardiac death ‐ modified 'best‐worst case' scenario

Comparison 2: Antibiotics versus placebo for secondary prevention of coronary heart disease at 24±6 months follow‐up, Outcome 66: Sudden cardiac death ‐ modified 'worst‐best case' scenario

Comparison 2: Antibiotics versus placebo for secondary prevention of coronary heart disease at 24±6 months follow‐up, Outcome 67: Sudden cardiac death according to clinical trial registration status

Comparison 2: Antibiotics versus placebo for secondary prevention of coronary heart disease at 24±6 months follow‐up, Outcome 68: Sudden cardiac death according to funding

Comparison 2: Antibiotics versus placebo for secondary prevention of coronary heart disease at 24±6 months follow‐up, Outcome 69: Sudden cardiac death according to type of antibiotic

Comparison 2: Antibiotics versus placebo for secondary prevention of coronary heart disease at 24±6 months follow‐up, Outcome 70: Sudden cardiac death according to antibody status

Comparison 2: Antibiotics versus placebo for secondary prevention of coronary heart disease at 24±6 months follow‐up, Outcome 71: Sudden cardiac death according to use of statins

Comparison 2: Antibiotics versus placebo for secondary prevention of coronary heart disease at 24±6 months follow‐up, Outcome 72: Sudden cardiac death according to the mean age

Comparison 2: Antibiotics versus placebo for secondary prevention of coronary heart disease at 24±6 months follow‐up, Outcome 73: Sudden cardiac death according to class of antibiotic

Comparison 2: Antibiotics versus placebo for secondary prevention of coronary heart disease at 24±6 months follow‐up, Outcome 74: Sudden cardiac death according to control intervention

Comparison 2: Antibiotics versus placebo for secondary prevention of coronary heart disease at 24±6 months follow‐up, Outcome 75: HOSPITALISATION FOR ANY CAUSE

Comparison 2: Antibiotics versus placebo for secondary prevention of coronary heart disease at 24±6 months follow‐up, Outcome 76: REVASCULARISATION

Comparison 2: Antibiotics versus placebo for secondary prevention of coronary heart disease at 24±6 months follow‐up, Outcome 77: UNSTABLE ANGINA PECTORIS
| Antibiotics compared with placebo or no intervention for coronary heart disease at maximum follow‐up | ||||||
| Patient or population: patients with coronary heart disease Settings: any setting Intervention: any antibiotic Comparison: placebo or no intervention | ||||||
| Outcomes | Anticipated absolute effects* (95% CI) | Relative effect | No of Participants | Certainty of the evidence | Comments | |
|---|---|---|---|---|---|---|
| Risk with placebo or no intervention | Risk with antibiotics | |||||
| All‐cause mortality at maximum follow‐up. Follow‐up: mean 21.4 months (range 3 to 120 months). | 100 per 1000 | 106 per 1000 | RR 1.06 (0.99 to 1.13) | 25,774 (20 trials) | ⊕⊕⊕⊕ | Overall low risk of bias due to the four trials carrying most of the weight were either at overall low risk of bias or were low risk of bias in the majority of domains. Low risk of imprecision due to inclusion of more participants than the estimated optimal information size1 |
| Serious adverse event at maximum follow‐up. | ‐ | ‐ | ‐ | ‐ | ‐ | No data were reported in the included trials. |
| Quality of life at maximum follow‐up. | ‐ | ‐ | ‐ | ‐ | ‐ | No data were reported in the included trials. |
| Cardiovascular mortality at maximum follow‐up. Follow‐up: mean 72.0 months (range 24 to 120 months). | 167 per 1000 | 185 per 1000 | RR 1.11 (0.98 to 1.25) | 4674 (2 trials) | ⊕⊕⊕⊝ | The sensitivity analysis only including low risk of bias trials differed from the overall analysis. Hence, for this outcome, we based our primary analysis and primary conclusion on trials at low risk of bias. Overall low risk of bias due to the three trials carrying most of the weight were either at overall low risk of bias or were low risk of bias in the majority of domains. Low risk of imprecision due to the sample size being very large (> 4000 participants)3. |
| Myocardial infarction at maximum follow‐up. Follow‐up: mean 20.7 months (range 3 to 120 months). | 80 per 1000 | 76 per 1000 | RR 0.95 (0.88 to 1.03) | 25,523 (17 trials) | ⊕⊕⊕⊕ | Overall low risk of bias due to the four trials carrying most of the weight were either at overall low risk of bias or were low risk of bias in the majority of domains. Low risk of imprecision due to inclusion of more participants than the estimated optimal information size4. |
| Stroke at maximum follow‐up. Follow‐up: mean 31.9 months (range 6 to 120 months). | 55 per 1000 | 62 per 1000 | RR 1.14 (1.00 to 1.29) | 14,774 (9 trials) | ⊕⊕⊕⊕ | Overall low risk of bias due to the three trials carrying most of the weight were either at overall low risk of bias or were low risk of bias in the majority of domains. Low risk of imprecision due to the sample size being very large (> 4000 participants)5. The risk of publication bias could not be assessed due to too few included trials. |
| Sudden cardiac death at maximum follow‐up. Follow‐up: mean 69.3 months (range 18.5 to 120 months). | 84 per 1000 | 90 per 1000 (75 to 109) | RR 1.08 (0.90 to 1.31) | 4520 (2 trials) | ⊕⊕⊕⊝ | Overall low risk of bias due to both trials included in the meta‐analyses being at overall low risk of bias or low risk of bias in the majority of domains, respectively. Low risk of imprecision due to the sample size being very large (> 4000 participants)6. The risk of publication bias could not be assessed due to too few included trials. |
| *The risk in the intervention group (and its 95% confidence interval) is based on the assumed risk in the comparison group and the relative effect of the intervention (and its 95% CI). CI: Confidence interval; RR: Risk ratio. | ||||||
| GRADE Working Group grades of evidence | ||||||
| 1No downgrading for imprecision: the optimal information size according to the GRADE Handbook using a RRR of 15%, an incidence in the control group of 10.0%, an alpha of 2.5%, and a beta of 10% was estimated to be 18,576 participants and we included 25,774 participants. 2Downgrading one level due to serious indirectness: risk of difference between the population of interest and the included participants, and between the intervention of interest and the included interventions. 3No downgrading for imprecision: the optimal information size according to the GRADE Handbook using a RRR of 15%, an incidence of 16.7%, an alpha of 2.0%, and a beta of 10% was estimated to be 10,883 participants and we only included 4674 participants. Nevertheless, the sample size was very large (>4000 participants). 4No downgrading for imprecision: the optimal information size according to the GRADE Handbook using a RRR of 15%, an incidence of 8.09%, an alpha of 2.0%, and a beta of 10% was estimated to be 24,627 participants and we included 25,523 participants. 5No downgrading for imprecision: the optimal information size according to the GRADE Handbook using a RRR of 15%, an incidence of 5.49%, an alpha of 2.0%, and a beta of 10% was estimated to be 37,339 participants and we only included 14,774 participants. Nevertheless, the sample size was very large (>4000 participants). 6No downgrading for imprecision. the optimal information size according to the GRADE Handbook using a RRR of 15%, an incidence of 8.36%, an alpha of 2.0%, and a beta of 10% was estimated to be 23,782 participants and we only included 4520 participants. Nevertheless, the sample size was very large (>4000 participants). | ||||||
| Antibiotics compared with placebo or no intervention for coronary heart disease at 24±6 months follow‐up | ||||||
| Patient or population: patients with coronary heart disease Settings: any setting Intervention: any antibiotic Comparison: placebo or no intervention | ||||||
| Outcomes | Anticipated absolute effects* (95% CI) | Relative effect | No of Participants | Certainty of the evidence | Comments | |
|---|---|---|---|---|---|---|
| Risk with placebo or no intervention | Risk with antibiotics | |||||
| All‐cause mortality at 24±6 months follow‐up. Follow‐up: mean 23.3 months (range 18 to 30 months). | 50 per 1000 | 62 per 1000 | RR 1.25 (1.06 to 1.48) | 9517 (6 trials) | ⊕⊕⊕⊕ | Overall low risk of bias due to the three trials carrying most of the weight were either at overall low risk of bias or were low risk of bias in the majority of domains. Low risk of imprecision due to the sample size being very large (> 4000 participants)1. The risk of publication bias could not be assessed due to too few included trials. |
| Serious adverse event at 24±6 months follow‐up. | ‐ | ‐ | ‐ | ‐ | ‐ | No data were reported in the included trials. |
| Quality of life at 24±6 months follow‐up. | ‐ | ‐ | ‐ | ‐ | ‐ | No data were reported in the included trials. |
| Cardiovascular mortality at 24±6 months follow‐up. Follow‐up: mean 23.1 months (range 18 to 30 months). | 23 per 1000 | 34 per 1000 | RR 1.50 (1.17 to 1.91) | 9044 (5 trials) | ⊕⊕⊕⊕ | Overall low risk of bias due to the three trials carrying most of the weight were either at overall low risk of bias or were low risk of bias in the majority of domains. Low risk of imprecision due to the sample size being very large (> 4000 participants)2. The risk of publication bias could not be assessed due to too few included trials. |
| Myocardial infarction at 24±6 months follow‐up. Follow‐up: mean 24.3 months (range 18.5 to 30.0 months). | 68 per 1000 | 65 per 1000 | RR 0.95 (0.82 to 1.11) | 9457 (5 trials) | ⊕⊕⊕⊝ | Overall low risk of bias due to the two trials carrying most of the weight were either at overall low risk of bias or were low risk of bias in the majority of domains. Low risk of imprecision due to the sample size being very large (> 4000 participants)4. The risk of publication bias could not be assessed due to too few included trials. |
| Stroke at 24±6 months follow‐up. Follow‐up: mean 24.3 months (range 18.5 to 30 months). | 21 per 1000 | 25 per 1000 | RR 1.17 (0.90 to 1.52) | 9457 (5 trials) | ⊕⊕⊕⊕ | Overall low risk of bias due to the three trials carrying most of the weight were either at overall low risk of bias or were low risk of bias in the majority of domains. Low risk of imprecision due to the sample size being very large (> 4000 participants)5. The risk of publication bias could not be assessed due to too few included trials. |
| Sudden cardiac death at 24±6 months follow‐up. Follow‐up: mean 24.3 months (range 18.5 to 30 months). | 26 per 1000 | 44 per 1000 (33 to 63) | RR 1.77 (1.28 to 2.44) | 4520 (2 trials) | ⊕⊕⊕⊝ | Overall low risk of bias due to both trials included in the meta‐analyses being at overall low risk of bias or low risk of bias in the majority of domains, respectively. Low risk of imprecision due to the sample size being very large (> 4000 participants)7. The risk of publication bias could not be assessed due to too few included trials. |
| *The risk in the intervention group (and its 95% confidence interval) is based on the assumed risk in the comparison group and the relative effect of the intervention (and its 95% CI). CI: Confidence interval; RR: Risk ratio. | ||||||
| GRADE Working Group grades of evidence | ||||||
| 1No downgrade for imprecision: the optimal information size according to the GRADE Handbook using a RRR of 15%, an incidence of 4.98%, an alpha of 2.5%, and a beta of 10% was estimated to be 38,771 participants and we only included 9509 participants. Nevertheless, the sample size was very large (>4000 participants). 2No downgrade for imprecision: the optimal information size according to the GRADE Handbook using a RRR of 15%, an incidence of 2.25%, an alpha of 2.0%, and a beta of 10% was estimated to be 91,738 participants and we only included 9036 participants. Nevertheless, the sample size was very large (>4000 participants). 3Downgrading one level due to serious inconsistency: the statistical heterogeneity was I2 = 43%; P = 0.14. Moreover, the forest plot showed trials with results in opposite direction. 4No downgrade for imprecision: the optimal information size according to the GRADE Handbook using a RRR of 15%, an incidence of 6.85%, an alpha of 2.0%, and a beta of 10% was estimated to be 96,669 participants and we only included 9457 participants. Nevertheless, the sample size was very large (>4000 participants). 5No downgrade for imprecision: The optimal information size according to the GRADE Handbook using a RRR of 15%, an incidence of 2.11%, an alpha of 2.0%, and a beta of 10% was estimated to be 97,219 participants and we only included 9449 participants. Nevertheless, the sample size was very large (>4000 participants). 6Downgrading one level due to serious indirectness: Risk of difference between the population of interest and the included participants, and between the intervention of interest and the included interventions. 7No downgrade for imprecision: the optimal information size according to the GRADE Handbook using a RRR of 15%, an incidence of 2.59%, an alpha of 2.0%, and a beta of 10% was estimated to be 80,024 participants and we only included 4520 participants. Nevertheless, the sample size was very large (>4000 participants). | ||||||
| Domain | Description |
|---|---|
| Random sequence generation |
|
| Allocation concealment |
|
| Blinding of participants and personnel |
|
| Blinding of outcome assessment |
|
| Incomplete outcome data |
|
| Selective outcome reporting |
|
| Other risks of bias |
|
| Overall risk of bias |
|
| Trial | Year | Number of participants currently smoking | Number of participants with diabetes | Number of participants with hypertension | Number of participants with hyperlipidaemia |
| ACADEMIC | 1999 | 112 out of 302 | 34 out of 302 | 127 out of 302 | ‐ |
| ACES | 2005 | 542 out of 4012 | 883 out of 4012 | 2688 out of 4012 | 3309 of 4012 |
| Aleksiadi 2007 | 2007 | ‐ | ‐ | ‐ | ‐ |
| ANTIBIO | 2003 | 428 out of 851 | 139 out of 861 | 439 out of 851 | ‐ |
| AZACS | 2003 | 348 out of 1439 | 398 out of 1439 | 832 out of 1439 | 864 out of 1439 |
| Berg 2005 | 2005 | 92 out of 473 | 74 out of 473 | 195 out of 473 | 278 out of 473 |
| CLARICOR | 2006 | 1572 out of 4372 | 678 out of 4372 | 1761 out of 4372 | ‐ |
| CLARIFY | 2002 | 40 out of 148 | 28 out of 148 | 62 out of 148 | 113 out of 148 |
| Gabriel 2003l | 2003 | 4 out of 38 | 9 out of 38 | 14 out of 38 | 8 out of 38 |
| Gupta 2007 | 1997 | 19 out of 60 | 20 out of 60 | 11 out of 60 | 25 out of 60 |
| Hillis 2004 | 2004 | 25 out of 141 | 19 out of 141 | 57 out of 141 | ‐ |
| Hyodo 2004 | 2004 | 6 out of 31 | 8 out of 31 | 17 out of 31 | 17 out of 31 |
| Ikeoka 2009 | 2009 | 41 out of 82 | 0 out of 82 | 46 out of 82 | ‐ |
| ISAR‐3 | 2001 | 224 out of 1010 | 202 out of 1010 | 771 out of 1010 | ‐ |
| Jackson 1999 | 1999 | ‐ | ‐ | ‐ | ‐ |
| Kaehler 2005 | 2005 | 67 out of 327 | 18 out of 327 | 259 out of 327 | ‐ |
| Kim 2004 | 2004 | 55 out of 129 | 38 out of 129 | 69 out of 129 | 35 out of 129 |
| Kim 2012 | 2012 | 26 out of 50 | 4 out of 50 | 27 out of 50 | 8 out of 50 |
| Kormi 2014 | 2014 | ‐ | ‐ | ‐ | ‐ |
| Kuvin 2003 | 2003 | 32 out of 58 | 12 out of 58 | 34 out of 58 | 45 out of 58 |
| Leowattana 2001 | 2001 | 44 out of 84 | 37 out of 84 | 44 out of 84 | 53 out of 84 |
| MIDAS | 2003 | 21 out of 50 | 20 out of 50 | 39 out of 50 | 41 out of 50 |
| Parchure 2002 | 2002 | 5 out of 40 | 8 out of 40 | 12 out of 40 | 27 out of 40 |
| Pieniazek 2001 | 2001 | ‐ | ‐ | ‐ | ‐ |
| PROVE‐IT | 2005 | 1529 out of 4162 | 734 out of 4162 | 2091 out of 4162 | ‐ |
| Radoi 2003l | 2003 | 39 out of 109 | 27 out of 109 | 67 out of 109 | 78 out of 109 |
| ROXIS | 1997 | 53 out of 202 | 26 out of 202 | 112 out of 202 | 129 out of 202 |
| Sanati2019 | 2019 | ‐ | 26 out of 68 | 27 out of 68 | 26 out of 68 |
| Schulze 2013 | 2013 | 20 out of 42 | 15 out of 42 | 37 out of 42 | 37 out of 42 |
| Semaan 2000 | 2000 | ‐ | ‐ | ‐ | ‐ |
| Sinisalo 1998 | 1998 | ‐ | ‐ | 11 out of 33 | ‐ |
| Stojanovic 2011 | 2011 | ‐ | 18 out of 165 | 37 out of 165 | 29 out of 165 |
| Thomaidou 2017 | 2017 | 16 out of 40 | 15 out of 40 | 21 out of 40 | ‐ |
| TIPTOP | 2014 | 61 out of 80 | 23 out of 80 | 55 out of 80 | 54 out of 80 |
| Torgano 1999 | 1999 | ‐ | 23 out of 110 | 26 out of 110 | 15 out of 110 |
| Tüter 2007 | 2007 | ‐ | ‐ | 26 out of 36 | ‐ |
| WIZARD | 2003 | 1266 out of 7722 | 1637 out of 7722 | 3482 out of 7722 | 4786 out of 7722 |
| Ütük 2004 | 2004 | 52 out of 113 | 20 out of 113 | 34 out of 113 | 20 out of 113 |
| Trial | Year | All‐cause mortality (months) | Cardiovascular mortality (months) | Myocardial infarction (months) | Stroke (months) | Sudden cardiac death (months) | Hospitalisation for any cause (months) | Revascularisation (months) | Unstable angina pectoris (months) |
| ACADEMIC | 1999 | 24 | 24 | 24 | 24 | NR | 24 | 24 | 24 |
| ACES | 2005 | 47 | 47 | 47 | 47 | NR | 47 | 47 | 47 |
| Aleksiadi 2007 | 2007 | NR | NR | NR | NR | NR | NR | NR | NR |
| ANTIBIO | 2003 | 12 | NR | 12 | 12 | NR | 12 | 12 | 12 |
| AZACS | 2003 | 6 | NR | 6 | NR | NR | 6 | 6 | NR |
| Berg 2005 | 2005 | 24 | NR | 24 | 24 | NR | NR | 24 | 24 |
| CLARICOR | 2006 | 120 | 120 | 120 | 120 | 120 | NR | NR | 120 |
| CLARIFY | 2002 | 18.5 | 18.5 | 18.5 | 18.5 | 18.5 | NR | NR | 18.5 |
| Gabriel 2003 | 2003 | NR | NR | NR | NR | NR | NR | NR | NR |
| Gupta 1997 | 1997 | 18 | 18 | NR | NR | NR | NR | NR | NR |
| Hillis 2004 | 2004 | NR | NR | NR | NR | NR | NR | NR | NR |
| Hyodo2004 | 2004 | NR | NR | NR | NR | NR | NR | NR | NR |
| Ikeoka 2009 | 2009 | 6 | NR | NR | NR | NR | NR | NR | NR |
| ISAR‐3 | 2001 | 12 | NR | 12 | NR | NR | NR | NR | NR |
| Jackson 1999 | 1999 | NR | NR | NR | NR | NR | NR | NR | NR |
| Kaehler2005 | 2005 | 12 | 12 | 12 | 12 | NR | NR | 12 | NR |
| Kim 2004 | 2004 | 12 | 12 | 12 | NR | NR | NR | 12 | NR |
| Kim 2012 | 2012 | NR | NR | NR | NR | NR | NR | NR | NR |
| Kormi 2014 | 2014 | NR | NR | NR | NR | NR | NR | NR | NR |
| Kuvin 2003 | 2003 | NR | NR | NR | NR | NR | NR | NR | NR |
| Leowattana2001 | 2001 | 3 | 3 | 3 | NR | NR | NR | 3 | NR |
| MIDAS | 2003 | 6 | 6 | 6 | NR | NR | NR | NR | NR |
| Parchure 2002 | 2002 | NR | NR | NR | NR | NR | NR | NR | NR |
| Pieniazek 2001 | 2001 | NR | NR | NR | NR | NR | NR | NR | NR |
| PROVE‐IT | 2005 | 24 | 24 | 24 | 24 | NR | 24 | 24 | 24 |
| Radoi et al | 2003 | 52 | 52 | NR | NR | NR | NR | NR | NR |
| ROXIS | 1997 | 6 | 6 | 6 | NR | NR | NR | NR | NR |
| Sanati 2019 | 2019 | NR | NR | NR | NR | NR | NR | NR | NR |
| Schulze 2013 | 2013 | NR | NR | NR | NR | NR | NR | NR | NR |
| Semaan 2000 | 2000 | NR | NR | NR | NR | NR | NR | NR | NR |
| Sinisalo 1998 | 1998 | NR | NR | NR | NR | NR | NR | NR | NR |
| Stojanovic 2011 | 2011 | NR | NR | NR | NR | NR | NR | NR | NR |
| Thomaidou 2017 | 2017 | NR | NR | NR | NR | NR | NR | NR | NR |
| TIPTOP | 2014 | 6 | 6 | 6 | 6 | NR | 6 | NR | NR |
| Torgano 1999 | 1999 | NR | NR | NR | NR | NR | NR | NR | NR |
| Tüter 2007 | 2007 | NR | NR | NR | NR | NR | NR | NR | NR |
| WIZARD | 2003 | 14 | NR | 14 | NR | NR | 14 | 14 | 14 |
| Ütük 2004 | 2004 | 6 | 6 | 6 | NR | NR | NR | 6 | 6 |
| NR: Not reported. | |||||||||
| Trial | Year | All‐cause mortality (months) | Cardiovascular mortality (months) | Myocardial infarction (months) | Stroke (months) | Sudden cardiac death (months) | Hospitalisation for any cause (months) | Revascularisation (months) | Unstable angina pectoris (months) |
| ACADEMIC | 1999 | 24 | 24 | 24 | 24 | NR | 24 | 24 | 24 |
| ACES | 2005 | NR | NR | NR | NR | NR | NR | NR | NR |
| Aleksiadi 2007 | 2007 | NR | NR | NR | NR | NR | NR | NR | NR |
| ANTIBIO | 2003 | NR | NR | NR | NR | NR | NR | NR | NR |
| AZACS | 2003 | NR | NR | NR | NR | NR | NR | NR | NR |
| Berg 2005 | 2005 | 24 | NR | 24 | 24 | NR | NR | 24 | 24 |
| CLARICOR | 2006 | 30 | 30 | 30 | 30 | 30 | NR | NR | NR |
| CLARIFY | 2002 | 18.5 | 18.5 | 18.5 | 18.5 | 18.5 | NR | NR | 18.5 |
| Gabriel 2003 | 2003 | NR | NR | NR | NR | NR | NR | NR | NR |
| Gupta 1997 | 1997 | 18 | NR | NR | NR | NR | NR | NR | NR |
| Hillis 2004 | 2004 | NR | NR | NR | NR | NR | NR | NR | NR |
| Hyodo 2004 | 2004 | NR | NR | NR | NR | NR | NR | NR | NR |
| Ikeoka 2009 | 2009 | NR | NR | NR | NR | NR | NR | NR | NR |
| ISAR‐3 | 2001 | NR | NR | NR | NR | NR | NR | NR | NR |
| Jackson 1999 | 1999 | NR | NR | NR | NR | NR | NR | NR | NR |
| Kaehler 2005 | 2005 | NR | NR | NR | NR | NR | NR | NR | NR |
| Kim 2004 | 2004 | NR | NR | NR | NR | NR | NR | NR | NR |
| Kim 2012 | 2012 | NR | NR | NR | NR | NR | NR | NR | NR |
| Kormi 2014 | 2014 | NR | NR | NR | NR | NR | NR | NR | NR |
| Kuvin 2003 | 2003 | NR | NR | NR | NR | NR | NR | NR | NR |
| Leowattana 2001 | 2001 | NR | NR | NR | NR | NR | NR | NR | NR |
| MIDAS | 2003 | NR | NR | NR | NR | NR | NR | NR | NR |
| Parchure2002 | 2002 | NR | NR | NR | NR | NR | NR | NR | NR |
| Pieniazek 2001 | 2001 | NR | NR | NR | NR | NR | NR | NR | NR |
| PROVE‐IT | 2005 | 24 | 24 | 24 | 24 | NR | 24 | 24 | 24 |
| Radoi 2003 | 2003 | NR | NR | NR | NR | NR | NR | NR | NR |
| ROXIS | 1997 | NR | NR | NR | NR | NR | NR | NR | NR |
| Sanati 2019 | 2019 | NR | NR | NR | NR | NR | NR | NR | NR |
| Schulze 2013 | 2013 | NR | NR | NR | NR | NR | NR | NR | NR |
| Semaan2000 | 2000 | NR | NR | NR | NR | NR | NR | NR | NR |
| Sinisalo 1998 | 1998 | NR | NR | NR | NR | NR | NR | NR | NR |
| Stojanovic 2011 | 2011 | NR | NR | NR | NR | NR | NR | NR | NR |
| Thomaidou 2017 | 2017 | NR | NR | NR | NR | NR | NR | NR | NR |
| TIPTOP | 2014 | NR | NR | NR | NR | NR | NR | NR | NR |
| Torgano 1999 | 1999 | NR | NR | NR | NR | NR | NR | NR | NR |
| Tüter 2007 | 2007 | NR | NR | NR | NR | NR | NR | NR | NR |
| WIZARD | 2003 | NR | NR | NR | NR | NR | NR | NR | NR |
| Ütük 2004 | 2004 | NR | NR | NR | NR | NR | NR | NR | NR |
| NR: Not reported. | |||||||||
| Trial | Year | Type and number of serious adverse event (antibiotics group) | Type and number of serious adverse event (control group) |
| ACADEMIC | 1999 |
|
|
| ACES | 2005 |
|
|
| ANTIBIO | 2003 |
|
|
| AZACS | 2003 |
|
|
| Berg 2005 | 2005 |
|
|
| CLARICOR | 2006 |
|
|
| CLARIFY | 2002 |
|
|
| Gupta 1997 | 1997 |
|
|
| Hillis 2004 | 2004 |
|
|
| Ikeoka 2009 | 2009 |
|
|
| ISAR‐3 | 2001 |
|
|
| Jackson1999 | 1999 |
|
|
| Kaehler 2005 | 2005 |
|
|
| Kim 2004 | 2004 |
|
|
| Leowattana 2001 | 2001 |
|
|
| MIDAS | 2003 |
|
|
| PROVE‐IT | 2005 |
|
|
| Radoi 2003 | 2003 |
|
|
| ROXIS | 1997 |
|
|
| Sinisalo 1998 | 1998 |
|
|
| TIPTOP | 2014 |
|
|
| WIZARD | 2003 |
|
|
| Ütük 2004 | 2004 |
|
|
| Trial | Year | Type and number of serious adverse event (antibiotics group) | Type and number of serious adverse event (control group) |
| ACADEMIC | 1999 |
|
|
| ACES | 2005 |
|
|
| Berg 2005 | 2005 |
|
|
| CLARICOR | 2006 |
|
|
| CLARIFY | 2002 |
|
|
| Gupta 1997 | 1997 |
|
|
| PROVE‐IT | 2005 |
|
|
| Outcome or subgroup title | No. of studies | No. of participants | Statistical method | Effect size |
| 1.1 ALL‐CAUSE MORTALITY Show forest plot | 20 | 25774 | Risk Ratio (M‐H, Random, 95% CI) | 1.06 [0.99, 1.13] |
| 1.2 All‐cause mortality ‐ trials at low risk of bias Show forest plot | 3 | 6113 | Risk Ratio (M‐H, Random, 95% CI) | 1.07 [0.99, 1.15] |
| 1.3 All‐cause mortality ‐ 'best‐worst case' scenario Show forest plot | 20 | 25815 | Risk Ratio (M‐H, Fixed, 95% CI) | 0.98 [0.92, 1.04] |
| 1.4 All‐cause mortality ‐ 'worst‐best case' scenario Show forest plot | 20 | 25815 | Risk Ratio (M‐H, Fixed, 95% CI) | 1.13 [1.06, 1.21] |
| 1.5 All‐cause mortality ‐ modified 'best‐worst case' scenario Show forest plot | 20 | 25815 | Risk Ratio (M‐H, Fixed, 95% CI) | 1.01 [0.95, 1.08] |
| 1.6 All‐cause mortality ‐ modified 'worst‐best case' scenario Show forest plot | 20 | 25815 | Risk Ratio (M‐H, Random, 95% CI) | 1.09 [1.02, 1.16] |
| 1.7 All‐cause mortality ‐ trials with optimal medical therapy Show forest plot | 13 | 23294 | Risk Ratio (M‐H, Random, 95% CI) | 1.06 [0.99, 1.13] |
| 1.8 All‐cause mortality according to type of antibiotic Show forest plot | 20 | 25774 | Risk Ratio (M‐H, Random, 95% CI) | 1.06 [0.99, 1.13] |
| 1.8.1 Azithromycin | 7 | 13746 | Risk Ratio (M‐H, Random, 95% CI) | 0.98 [0.85, 1.14] |
| 1.8.2 Roxithromycin | 5 | 2491 | Risk Ratio (M‐H, Random, 95% CI) | 1.06 [0.71, 1.57] |
| 1.8.3 Clarithromycin | 4 | 5106 | Risk Ratio (M‐H, Random, 95% CI) | 1.08 [1.00, 1.16] |
| 1.8.4 Doxycycline | 2 | 160 | Risk Ratio (M‐H, Random, 95% CI) | 0.63 [0.06, 6.20] |
| 1.8.5 Gatifloxacin | 1 | 4162 | Risk Ratio (M‐H, Random, 95% CI) | 1.29 [0.89, 1.85] |
| 1.8.6 Spiramycin | 1 | 109 | Risk Ratio (M‐H, Random, 95% CI) | 0.84 [0.29, 2.49] |
| 1.9 All‐cause mortality according to antibody status Show forest plot | 20 | 25774 | Risk Ratio (M‐H, Random, 95% CI) | 1.06 [0.99, 1.13] |
| 1.9.1 People with antibodies | 3 | 8084 | Risk Ratio (M‐H, Random, 95% CI) | 0.93 [0.76, 1.14] |
| 1.9.2 People without antibodies | 0 | 0 | Risk Ratio (M‐H, Random, 95% CI) | Not estimable |
| 1.9.3 Mixed | 17 | 17690 | Risk Ratio (M‐H, Random, 95% CI) | 1.08 [1.01, 1.15] |
| 1.10 All‐cause mortality according to use of statins Show forest plot | 13 | 23680 | Risk Ratio (M‐H, Random, 95% CI) | 1.06 [1.00, 1.13] |
| 1.10.1 People with use of statins | 4 | 4514 | Risk Ratio (M‐H, Random, 95% CI) | 0.89 [0.44, 1.81] |
| 1.10.2 People without use of statins | 0 | 0 | Risk Ratio (M‐H, Random, 95% CI) | Not estimable |
| 1.10.3 Mixed | 9 | 19166 | Risk Ratio (M‐H, Random, 95% CI) | 1.06 [0.99, 1.13] |
| 1.11 All‐cause mortality according to the mean age Show forest plot | 20 | 25774 | Risk Ratio (M‐H, Random, 95% CI) | 1.06 [0.99, 1.13] |
| 1.11.1 0 to 59 years | 5 | 4573 | Risk Ratio (M‐H, Random, 95% CI) | 1.15 [0.83, 1.60] |
| 1.11.2 60 and above | 15 | 21201 | Risk Ratio (M‐H, Random, 95% CI) | 1.06 [0.99, 1.13] |
| 1.12 All‐cause mortality according to clinical trial registration status Show forest plot | 20 | 25774 | Risk Ratio (M‐H, Random, 95% CI) | 1.06 [0.99, 1.13] |
| 1.12.1 Pre‐registration | 4 | 16366 | Risk Ratio (M‐H, Random, 95% CI) | 1.05 [0.91, 1.21] |
| 1.12.2 Post‐registration | 1 | 4012 | Risk Ratio (M‐H, Random, 95% CI) | 1.09 [0.86, 1.36] |
| 1.12.3 No registration | 15 | 5396 | Risk Ratio (M‐H, Random, 95% CI) | 0.99 [0.75, 1.29] |
| 1.13 All‐cause mortality according to length of follow‐up Show forest plot | 20 | 25774 | Risk Ratio (M‐H, Random, 95% CI) | 1.06 [0.99, 1.13] |
| 1.13.1 Trials with less than 12 months follow‐up | 7 | 2080 | Risk Ratio (M‐H, Random, 95% CI) | 0.73 [0.46, 1.15] |
| 1.13.2 Trials with equal to or longer than 12 months follow‐up | 13 | 23694 | Risk Ratio (M‐H, Random, 95% CI) | 1.07 [1.00, 1.14] |
| 1.14 All‐cause mortality according to class of antibiotic Show forest plot | 20 | 25760 | Risk Ratio (M‐H, Random, 95% CI) | 1.06 [0.99, 1.13] |
| 1.14.1 Macrolide | 17 | 21438 | Risk Ratio (M‐H, Random, 95% CI) | 1.05 [0.99, 1.13] |
| 1.14.2 Tetracycline | 2 | 160 | Risk Ratio (M‐H, Random, 95% CI) | 0.63 [0.06, 6.20] |
| 1.14.3 Quinolone | 1 | 4162 | Risk Ratio (M‐H, Random, 95% CI) | 1.29 [0.89, 1.85] |
| 1.15 All‐cause mortality according to funding Show forest plot | 20 | 25774 | Risk Ratio (M‐H, Random, 95% CI) | 1.06 [0.99, 1.13] |
| 1.15.1 Industry funded or unknown funded trials | 11 | 19073 | Risk Ratio (M‐H, Random, 95% CI) | 1.04 [0.91, 1.18] |
| 1.15.2 Non‐industry funded trials | 9 | 6701 | Risk Ratio (M‐H, Random, 95% CI) | 1.07 [0.99, 1.15] |
| 1.16 All‐cause mortality according to control intervention Show forest plot | 20 | 25774 | Risk Ratio (M‐H, Random, 95% CI) | 1.06 [0.99, 1.13] |
| 1.16.1 Placebo‐controlled trials | 17 | 25442 | Risk Ratio (M‐H, Random, 95% CI) | 1.06 [1.00, 1.13] |
| 1.16.2 No control intervention | 3 | 332 | Risk Ratio (M‐H, Random, 95% CI) | 0.58 [0.25, 1.32] |
| 1.17 CARDIOVASCULAR MORTALITY Show forest plot | 14 | 14180 | Risk Ratio (M‐H, Random, 95% CI) | 1.08 [0.96, 1.20] |
| 1.18 Cardiovascular mortality ‐ trials at low risk of bias Show forest plot | 2 | 4674 | Risk Ratio (M‐H, Fixed, 95% CI) | 1.11 [0.98, 1.25] |
| 1.19 Cardiovascular mortality ‐ 'best‐worst case' scenario Show forest plot | 14 | 14192 | Risk Ratio (M‐H, Fixed, 95% CI) | 0.94 [0.84, 1.04] |
| 1.20 Cardiovascular mortality ‐ 'worst‐best case' scenario Show forest plot | 14 | 14192 | Risk Ratio (M‐H, Fixed, 95% CI) | 1.22 [1.09, 1.36] |
| 1.21 Cardiovascular mortality ‐ modified 'best‐worst case' scenario Show forest plot | 14 | 14192 | Risk Ratio (M‐H, Fixed, 95% CI) | 1.00 [0.89, 1.11] |
| 1.22 Cardiovascular mortality ‐ modified 'worst‐best case' scenario Show forest plot | 14 | 14192 | Risk Ratio (M‐H, Fixed, 95% CI) | 1.15 [1.03, 1.28] |
| 1.23 Cardiovascular mortality ‐ trials with optimal medical therapy Show forest plot | 10 | 13407 | Risk Ratio (M‐H, Fixed, 95% CI) | 1.07 [0.96, 1.20] |
| 1.24 Cardiovascular mortality according to type of antibiotic Show forest plot | 14 | 14180 | Risk Ratio (M‐H, Random, 95% CI) | 1.08 [0.96, 1.20] |
| 1.24.1 Azithromycin | 4 | 4503 | Risk Ratio (M‐H, Random, 95% CI) | 0.88 [0.65, 1.21] |
| 1.24.2 Roxithromycin | 3 | 613 | Risk Ratio (M‐H, Random, 95% CI) | 0.57 [0.16, 1.97] |
| 1.24.3 Clarithromycin | 3 | 4633 | Risk Ratio (M‐H, Random, 95% CI) | 1.06 [0.38, 2.93] |
| 1.24.4 Doxycycline | 2 | 160 | Risk Ratio (M‐H, Random, 95% CI) | 0.63 [0.06, 6.20] |
| 1.24.5 Gatifloxacin | 1 | 4162 | Risk Ratio (M‐H, Random, 95% CI) | 1.64 [0.93, 2.89] |
| 1.24.6 Spiramycin | 1 | 109 | Risk Ratio (M‐H, Random, 95% CI) | 0.84 [0.29, 2.49] |
| 1.25 Cardiovascular mortality according to antibody status Show forest plot | 14 | 14180 | Risk Ratio (M‐H, Random, 95% CI) | 1.08 [0.96, 1.20] |
| 1.25.1 People with antibodies | 2 | 362 | Risk Ratio (M‐H, Random, 95% CI) | 1.07 [0.33, 3.43] |
| 1.25.2 People without antibodies | 0 | 0 | Risk Ratio (M‐H, Random, 95% CI) | Not estimable |
| 1.25.3 Mixed | 12 | 13818 | Risk Ratio (M‐H, Random, 95% CI) | 1.06 [0.92, 1.22] |
| 1.26 Cardiovascular mortality according to use of statins Show forest plot | 8 | 13096 | Risk Ratio (M‐H, Random, 95% CI) | 1.06 [0.83, 1.37] |
| 1.26.1 People with use of statins | 4 | 4514 | Risk Ratio (M‐H, Random, 95% CI) | 0.86 [0.35, 2.16] |
| 1.26.2 People without use of statins | 0 | 0 | Risk Ratio (M‐H, Random, 95% CI) | Not estimable |
| 1.26.3 Mixed | 4 | 8582 | Risk Ratio (M‐H, Random, 95% CI) | 1.04 [0.82, 1.33] |
| 1.27 Cardiovascular mortality according to the mean age Show forest plot | 14 | 14180 | Risk Ratio (M‐H, Random, 95% CI) | 1.08 [0.96, 1.20] |
| 1.27.1 18 to 59 years | 5 | 4573 | Risk Ratio (M‐H, Random, 95% CI) | 1.22 [0.77, 1.92] |
| 1.27.2 60 and above | 9 | 9607 | Risk Ratio (M‐H, Random, 95% CI) | 1.07 [0.95, 1.20] |
| 1.28 Cardiovascular mortality according to clinical trial registration status Show forest plot | 14 | 14180 | Risk Ratio (M‐H, Random, 95% CI) | 1.08 [0.96, 1.20] |
| 1.28.1 Pre‐registration | 3 | 8644 | Risk Ratio (M‐H, Random, 95% CI) | 1.18 [0.77, 1.80] |
| 1.28.2 Post‐registration | 1 | 4012 | Risk Ratio (M‐H, Random, 95% CI) | 0.87 [0.63, 1.20] |
| 1.28.3 No registration | 10 | 1524 | Risk Ratio (M‐H, Random, 95% CI) | 0.86 [0.49, 1.52] |
| 1.29 Cardiovascular mortality according to length of follow‐up Show forest plot | 14 | 14180 | Risk Ratio (M‐H, Random, 95% CI) | 1.08 [0.96, 1.20] |
| 1.29.1 Trials with less than 12 months follow‐up | 5 | 559 | Risk Ratio (M‐H, Random, 95% CI) | 0.47 [0.19, 1.16] |
| 1.29.2 Trials with equal to or longer than 12 months follow‐up | 9 | 13621 | Risk Ratio (M‐H, Random, 95% CI) | 1.09 [0.97, 1.22] |
| 1.30 Cardiovascular mortality according to class of antibiotic Show forest plot | 14 | 14180 | Risk Ratio (M‐H, Random, 95% CI) | 1.08 [0.96, 1.20] |
| 1.30.1 Macrolide | 11 | 9858 | Risk Ratio (M‐H, Random, 95% CI) | 1.06 [0.95, 1.19] |
| 1.30.2 Tetracycline | 2 | 160 | Risk Ratio (M‐H, Random, 95% CI) | 0.63 [0.06, 6.20] |
| 1.30.3 Quinolone | 1 | 4162 | Risk Ratio (M‐H, Random, 95% CI) | 1.64 [0.93, 2.89] |
| 1.31 Cardiovascular mortality according to funding Show forest plot | 14 | 14180 | Risk Ratio (M‐H, Random, 95% CI) | 1.08 [0.96, 1.20] |
| 1.31.1 Industry funded or unknown funded trials | 7 | 9000 | Risk Ratio (M‐H, Random, 95% CI) | 1.04 [0.72, 1.51] |
| 1.31.2 Non‐industry funded trials | 7 | 5180 | Risk Ratio (M‐H, Random, 95% CI) | 1.09 [0.97, 1.24] |
| 1.32 Cardiovascular mortality according to control intervention Show forest plot | 14 | 14180 | Risk Ratio (M‐H, Random, 95% CI) | 1.08 [0.96, 1.20] |
| 1.32.1 Placebo‐controlled trials | 11 | 13848 | Risk Ratio (M‐H, Random, 95% CI) | 1.09 [0.97, 1.22] |
| 1.32.2 No control intervention | 3 | 332 | Risk Ratio (M‐H, Random, 95% CI) | 0.58 [0.25, 1.32] |
| 1.33 MYOCARDIAL INFARCTION Show forest plot | 17 | 25523 | Risk Ratio (M‐H, Random, 95% CI) | 0.95 [0.88, 1.03] |
| 1.34 Myocardial infarction ‐ trials at low risk of bias Show forest plot | 3 | 6113 | Risk Ratio (M‐H, Fixed, 95% CI) | 0.96 [0.86, 1.07] |
| 1.35 Myocardial infarction ‐ 'best‐worst case' scenario Show forest plot | 17 | 25564 | Risk Ratio (M‐H, Random, 95% CI) | 0.82 [0.72, 0.94] |
| 1.36 Myocardial infarction ‐ 'worst‐best case' scenario Show forest plot | 17 | 25564 | Risk Ratio (M‐H, Random, 95% CI) | 1.05 [0.90, 1.24] |
| 1.37 Myocardial infarction ‐ modified 'best‐worst case' scenario Show forest plot | 17 | 25564 | Risk Ratio (M‐H, Random, 95% CI) | 0.91 [0.84, 0.99] |
| 1.38 Myocardial infarction ‐ modified 'worst‐best case' scenario Show forest plot | 17 | 25564 | Risk Ratio (M‐H, Random, 95% CI) | 1.00 [0.90, 1.10] |
| 1.39 Myocardial infarction ‐ trials with optimal medical therapy Show forest plot | 12 | 23327 | Risk Ratio (M‐H, Random, 95% CI) | 0.95 [0.88, 1.03] |
| 1.40 Myocardial infarction according to type of antibiotic Show forest plot | 17 | 25523 | Risk Ratio (M‐H, Random, 95% CI) | 0.95 [0.88, 1.03] |
| 1.40.1 Azithromycin | 5 | 13604 | Risk Ratio (M‐H, Random, 95% CI) | 0.98 [0.84, 1.14] |
| 1.40.2 Roxithromycin | 5 | 2491 | Risk Ratio (M‐H, Random, 95% CI) | 0.97 [0.66, 1.42] |
| 1.40.3 Clarithromycin | 4 | 5106 | Risk Ratio (M‐H, Random, 95% CI) | 0.60 [0.30, 1.22] |
| 1.40.4 Doxycycline | 2 | 160 | Risk Ratio (M‐H, Random, 95% CI) | 1.32 [0.10, 17.36] |
| 1.40.5 Gatifloxacin | 1 | 4162 | Risk Ratio (M‐H, Random, 95% CI) | 0.89 [0.72, 1.12] |
| 1.40.6 Spiramycin | 0 | 0 | Risk Ratio (M‐H, Random, 95% CI) | Not estimable |
| 1.41 Myocardial infarction according to antibody status Show forest plot | 17 | 25523 | Risk Ratio (M‐H, Random, 95% CI) | 0.95 [0.88, 1.03] |
| 1.41.1 People with antibodies | 2 | 8024 | Risk Ratio (M‐H, Random, 95% CI) | 0.94 [0.75, 1.16] |
| 1.41.2 People without antibodies | 0 | 0 | Risk Ratio (M‐H, Random, 95% CI) | Not estimable |
| 1.41.3 Mixed | 15 | 17499 | Risk Ratio (M‐H, Random, 95% CI) | 0.95 [0.87, 1.04] |
| 1.42 Myocardial infarction according to use of statins Show forest plot | 12 | 23598 | Risk Ratio (M‐H, Random, 95% CI) | 0.95 [0.88, 1.03] |
| 1.42.1 People with use of statins | 4 | 4514 | Risk Ratio (M‐H, Random, 95% CI) | 0.88 [0.71, 1.10] |
| 1.42.2 People without use of statins | 0 | 0 | Risk Ratio (M‐H, Random, 95% CI) | Not estimable |
| 1.42.3 Mixed | 8 | 19084 | Risk Ratio (M‐H, Random, 95% CI) | 0.96 [0.88, 1.05] |
| 1.43 Myocardial infarction according to the mean age Show forest plot | 17 | 25523 | Risk Ratio (M‐H, Random, 95% CI) | 0.95 [0.88, 1.03] |
| 1.43.1 18 to 59 years | 3 | 4404 | Risk Ratio (M‐H, Random, 95% CI) | 0.89 [0.71, 1.10] |
| 1.43.2 60 and above | 14 | 21119 | Risk Ratio (M‐H, Random, 95% CI) | 0.96 [0.88, 1.05] |
| 1.44 Myocardial infarction according to clinical trial registration status Show forest plot | 17 | 25523 | Risk Ratio (M‐H, Random, 95% CI) | 0.95 [0.88, 1.03] |
| 1.44.1 Pre‐registration | 4 | 16366 | Risk Ratio (M‐H, Random, 95% CI) | 0.95 [0.87, 1.04] |
| 1.44.2 Post‐registration | 1 | 4012 | Risk Ratio (M‐H, Random, 95% CI) | 1.05 [0.83, 1.32] |
| 1.44.3 No registration | 12 | 5145 | Risk Ratio (M‐H, Random, 95% CI) | 0.81 [0.61, 1.08] |
| 1.45 Myocardial infarction according to length of follow‐up Show forest plot | 17 | 25523 | Risk Ratio (M‐H, Random, 95% CI) | 0.95 [0.88, 1.03] |
| 1.45.1 Trials with less than 12 months follow‐up | 6 | 1998 | Risk Ratio (M‐H, Random, 95% CI) | 0.70 [0.42, 1.15] |
| 1.45.2 Trials with equal to or longer than 12 months follow‐up | 11 | 23525 | Risk Ratio (M‐H, Random, 95% CI) | 0.96 [0.88, 1.04] |
| 1.46 Myocardial infarction according to class of antibiotic Show forest plot | 17 | 25523 | Risk Ratio (M‐H, Random, 95% CI) | 0.95 [0.88, 1.03] |
| 1.46.1 Macrolide | 14 | 21201 | Risk Ratio (M‐H, Random, 95% CI) | 0.96 [0.88, 1.05] |
| 1.46.2 Tetracycline | 2 | 160 | Risk Ratio (M‐H, Random, 95% CI) | 1.32 [0.10, 17.36] |
| 1.46.3 Quinolone | 1 | 4162 | Risk Ratio (M‐H, Random, 95% CI) | 0.89 [0.72, 1.12] |
| 1.47 Myocardial infarction according to funding Show forest plot | 17 | 25523 | Risk Ratio (M‐H, Random, 95% CI) | 0.95 [0.88, 1.03] |
| 1.47.1 Industry funded or unknown funded trials | 10 | 18964 | Risk Ratio (M‐H, Random, 95% CI) | 0.94 [0.84, 1.07] |
| 1.47.2 Non‐industry funded trials | 7 | 6559 | Risk Ratio (M‐H, Random, 95% CI) | 0.96 [0.86, 1.07] |
| 1.48 Myocardial infarction according to control intervention Show forest plot | 17 | 25515 | Risk Ratio (M‐H, Random, 95% CI) | 0.95 [0.88, 1.03] |
| 1.48.1 Placebo‐controlled trials | 15 | 25292 | Risk Ratio (M‐H, Random, 95% CI) | 0.95 [0.88, 1.04] |
| 1.48.2 No control intervention | 2 | 223 | Risk Ratio (M‐H, Random, 95% CI) | 0.38 [0.09, 1.58] |
| 1.49 STROKE Show forest plot | 9 | 14774 | Risk Ratio (M‐H, Fixed, 95% CI) | 1.14 [1.00, 1.29] |
| 1.50 Stroke ‐ trials at low risk of bias Show forest plot | 2 | 4674 | Risk Ratio (M‐H, Fixed, 95% CI) | 1.14 [0.99, 1.31] |
| 1.51 Stroke ‐ 'best‐worst case' scenario Show forest plot | 9 | 14779 | Risk Ratio (M‐H, Fixed, 95% CI) | 0.98 [0.87, 1.11] |
| 1.52 Stroke ‐ 'worst‐best case' scenario Show forest plot | 9 | 14779 | Risk Ratio (M‐H, Fixed, 95% CI) | 1.29 [1.14, 1.45] |
| 1.53 Stroke ‐ modified 'best‐worst case' scenario Show forest plot | 9 | 14779 | Risk Ratio (M‐H, Fixed, 95% CI) | 1.05 [0.93, 1.19] |
| 1.54 Stroke ‐ modified 'worst‐best case' scenario Show forest plot | 9 | 14779 | Risk Ratio (M‐H, Fixed, 95% CI) | 1.21 [1.07, 1.37] |
| 1.55 Stroke ‐ trials with optimal medical therapy Show forest plot | 6 | 13672 | Risk Ratio (M‐H, Fixed, 95% CI) | 1.13 [0.99, 1.28] |
| 1.56 Stroke according to type of antibiotic Show forest plot | 9 | 14774 | Risk Ratio (M‐H, Random, 95% CI) | 1.14 [1.00, 1.29] |
| 1.56.1 Azithromycin | 2 | 4314 | Risk Ratio (M‐H, Random, 95% CI) | 1.05 [0.59, 1.85] |
| 1.56.2 Roxithromycin | 2 | 1195 | Risk Ratio (M‐H, Random, 95% CI) | 1.49 [0.21, 10.66] |
| 1.56.3 Clarithromycin | 3 | 4993 | Risk Ratio (M‐H, Random, 95% CI) | 1.16 [1.01, 1.32] |
| 1.56.4 Gatifloxacin | 1 | 4162 | Risk Ratio (M‐H, Random, 95% CI) | 1.05 [0.59, 1.88] |
| 1.56.5 Doxycycline | 1 | 110 | Risk Ratio (M‐H, Random, 95% CI) | 0.50 [0.05, 5.36] |
| 1.57 Stroke according to antibody status Show forest plot | 9 | 14774 | Risk Ratio (M‐H, Random, 95% CI) | 1.14 [1.00, 1.29] |
| 1.57.1 People with antibodies | 1 | 302 | Risk Ratio (M‐H, Random, 95% CI) | 0.34 [0.04, 3.21] |
| 1.57.2 People without antibodies | 0 | 0 | Risk Ratio (M‐H, Random, 95% CI) | Not estimable |
| 1.57.3 Mixed | 8 | 14472 | Risk Ratio (M‐H, Random, 95% CI) | 1.14 [1.01, 1.29] |
| 1.58 Stroke according to use of statins Show forest plot | 7 | 14145 | Risk Ratio (M‐H, Random, 95% CI) | 1.14 [1.00, 1.29] |
| 1.58.1 People with use of statins | 2 | 4272 | Risk Ratio (M‐H, Random, 95% CI) | 1.01 [0.57, 1.77] |
| 1.58.2 People without use of statins | 0 | 0 | Risk Ratio (M‐H, Random, 95% CI) | Not estimable |
| 1.58.3 Mixed | 5 | 9873 | Risk Ratio (M‐H, Random, 95% CI) | 1.15 [1.01, 1.30] |
| 1.59 Stroke according to the mean age Show forest plot | 9 | 14774 | Risk Ratio (M‐H, Random, 95% CI) | 1.14 [1.00, 1.29] |
| 1.59.1 18 to 59 years | 1 | 4162 | Risk Ratio (M‐H, Random, 95% CI) | 1.05 [0.59, 1.88] |
| 1.59.2 60 and above | 8 | 10612 | Risk Ratio (M‐H, Random, 95% CI) | 1.14 [1.00, 1.30] |
| 1.60 Stroke according to clinical trial registration status Show forest plot | 9 | 14774 | Risk Ratio (M‐H, Random, 95% CI) | 1.14 [1.00, 1.29] |
| 1.60.1 Pre‐registration | 3 | 8644 | Risk Ratio (M‐H, Random, 95% CI) | 1.14 [1.00, 1.30] |
| 1.60.2 Post‐registration | 1 | 4012 | Risk Ratio (M‐H, Random, 95% CI) | 1.13 [0.74, 1.72] |
| 1.60.3 No registration | 5 | 2118 | Risk Ratio (M‐H, Random, 95% CI) | 1.11 [0.59, 2.09] |
| 1.61 Stroke according to length of follow‐up Show forest plot | 9 | 14774 | Risk Ratio (M‐H, Random, 95% CI) | 1.14 [1.00, 1.29] |
| 1.61.1 Trials with less than 12 months follow‐up | 1 | 110 | Risk Ratio (M‐H, Random, 95% CI) | 0.50 [0.05, 5.36] |
| 1.61.2 Trials with equal to or longer than 12 months follow‐up | 8 | 14664 | Risk Ratio (M‐H, Random, 95% CI) | 1.14 [1.01, 1.29] |
| 1.62 Stroke according to class of antibiotic Show forest plot | 9 | 14774 | Risk Ratio (M‐H, Random, 95% CI) | 1.14 [1.00, 1.29] |
| 1.62.1 Macrolide | 7 | 10502 | Risk Ratio (M‐H, Random, 95% CI) | 1.14 [1.01, 1.30] |
| 1.62.2 Tetracycline | 1 | 110 | Risk Ratio (M‐H, Random, 95% CI) | 0.50 [0.05, 5.36] |
| 1.62.3 Quinolone | 1 | 4162 | Risk Ratio (M‐H, Random, 95% CI) | 1.05 [0.59, 1.88] |
| 1.63 Stroke according to funding Show forest plot | 9 | 14774 | Risk Ratio (M‐H, Random, 95% CI) | 1.14 [1.00, 1.29] |
| 1.63.1 Industry funded or unknown funded trials | 6 | 9990 | Risk Ratio (M‐H, Random, 95% CI) | 1.13 [0.83, 1.52] |
| 1.63.2 Non‐industry funded trials | 3 | 4784 | Risk Ratio (M‐H, Random, 95% CI) | 1.14 [0.99, 1.31] |
| 1.64 Stroke according to control intervention Show forest plot | 9 | 14774 | Risk Ratio (M‐H, Random, 95% CI) | 1.14 [1.00, 1.29] |
| 1.64.1 Placebo‐controlled trials | 8 | 14664 | Risk Ratio (M‐H, Random, 95% CI) | 1.14 [1.01, 1.29] |
| 1.64.2 No control intervention | 1 | 110 | Risk Ratio (M‐H, Random, 95% CI) | 0.50 [0.05, 5.36] |
| 1.65 SUDDEN CARDIAC DEATH Show forest plot | 2 | 4520 | Risk Ratio (M‐H, Fixed, 95% CI) | 1.08 [0.90, 1.31] |
| 1.66 Sudden cardiac death ‐ trials at low risk of bias Show forest plot | 1 | 4372 | Risk Ratio (M‐H, Fixed, 95% CI) | 1.08 [0.89, 1.30] |
| 1.67 Sudden cardiac death ‐ 'best‐worst case' scenario Show forest plot | 2 | 4521 | Risk Ratio (M‐H, Fixed, 95% CI) | 1.00 [0.83, 1.20] |
| 1.68 Sudden cardiac death ‐ 'worst‐best case' scenario Show forest plot | 2 | 4521 | Risk Ratio (M‐H, Fixed, 95% CI) | 1.14 [0.95, 1.37] |
| 1.69 Sudden cardiac death ‐ modified 'best‐worst case' scenario Show forest plot | 2 | 4521 | Risk Ratio (M‐H, Fixed, 95% CI) | 1.04 [0.86, 1.25] |
| 1.70 Sudden cardiac death ‐ modified 'worst‐best case' scenario Show forest plot | 2 | 4521 | Risk Ratio (M‐H, Fixed, 95% CI) | 1.11 [0.92, 1.34] |
| 1.71 Sudden cardiac death according to clinical trial registration status Show forest plot | 2 | 4520 | Risk Ratio (M‐H, Fixed, 95% CI) | 1.08 [0.90, 1.31] |
| 1.71.1 Pre‐registration | 1 | 4372 | Risk Ratio (M‐H, Fixed, 95% CI) | 1.08 [0.89, 1.30] |
| 1.71.2 Post‐registration | 0 | 0 | Risk Ratio (M‐H, Fixed, 95% CI) | Not estimable |
| 1.71.3 No registration | 1 | 148 | Risk Ratio (M‐H, Fixed, 95% CI) | 3.00 [0.12, 72.47] |
| 1.72 Sudden cardiac death according to funding Show forest plot | 2 | 4520 | Risk Ratio (M‐H, Fixed, 95% CI) | 1.08 [0.90, 1.31] |
| 1.72.1 Industry funded or unknown funded trials | 1 | 148 | Risk Ratio (M‐H, Fixed, 95% CI) | 3.00 [0.12, 72.47] |
| 1.72.2 Non‐industry funded trials | 1 | 4372 | Risk Ratio (M‐H, Fixed, 95% CI) | 1.08 [0.89, 1.30] |
| 1.73 Sudden cardiac death according to type of antibiotic Show forest plot | 2 | 4520 | Risk Ratio (M‐H, Fixed, 95% CI) | 1.08 [0.90, 1.31] |
| 1.73.1 Clarithromycin | 2 | 4520 | Risk Ratio (M‐H, Fixed, 95% CI) | 1.08 [0.90, 1.31] |
| 1.74 Sudden cardiac death according to antibody status Show forest plot | 2 | 4520 | Risk Ratio (M‐H, Fixed, 95% CI) | 1.08 [0.90, 1.31] |
| 1.74.1 People with antibodies | 0 | 0 | Risk Ratio (M‐H, Fixed, 95% CI) | Not estimable |
| 1.74.2 People without antibodies | 0 | 0 | Risk Ratio (M‐H, Fixed, 95% CI) | Not estimable |
| 1.74.3 Mixed | 2 | 4520 | Risk Ratio (M‐H, Fixed, 95% CI) | 1.08 [0.90, 1.31] |
| 1.75 Sudden cardiac death according to use of statins Show forest plot | 2 | 4520 | Risk Ratio (M‐H, Fixed, 95% CI) | 1.08 [0.90, 1.31] |
| 1.75.1 People with use of statins | 0 | 0 | Risk Ratio (M‐H, Fixed, 95% CI) | Not estimable |
| 1.75.2 People without use of statins | 0 | 0 | Risk Ratio (M‐H, Fixed, 95% CI) | Not estimable |
| 1.75.3 Mixed | 2 | 4520 | Risk Ratio (M‐H, Fixed, 95% CI) | 1.08 [0.90, 1.31] |
| 1.76 Sudden cardiac death according to the mean age Show forest plot | 2 | 4520 | Risk Ratio (M‐H, Fixed, 95% CI) | 1.08 [0.90, 1.31] |
| 1.76.1 18 to 59 years | 0 | 0 | Risk Ratio (M‐H, Fixed, 95% CI) | Not estimable |
| 1.76.2 60 and above | 2 | 4520 | Risk Ratio (M‐H, Fixed, 95% CI) | 1.08 [0.90, 1.31] |
| 1.77 Sudden cardiac death according to length of follow‐up Show forest plot | 2 | 4520 | Risk Ratio (M‐H, Fixed, 95% CI) | 1.08 [0.90, 1.31] |
| 1.77.1 Trials with less than 12 months follow‐up | 0 | 0 | Risk Ratio (M‐H, Fixed, 95% CI) | Not estimable |
| 1.77.2 Trials with equal to or longer than 12 months follow‐up | 2 | 4520 | Risk Ratio (M‐H, Fixed, 95% CI) | 1.08 [0.90, 1.31] |
| 1.78 Sudden cardiac death according to class of antibiotic Show forest plot | 2 | 4520 | Risk Ratio (M‐H, Fixed, 95% CI) | 1.08 [0.90, 1.31] |
| 1.78.1 Macrolide | 2 | 4520 | Risk Ratio (M‐H, Fixed, 95% CI) | 1.08 [0.90, 1.31] |
| 1.78.2 Tetracycline | 0 | 0 | Risk Ratio (M‐H, Fixed, 95% CI) | Not estimable |
| 1.78.3 Quinolone | 0 | 0 | Risk Ratio (M‐H, Fixed, 95% CI) | Not estimable |
| 1.79 Sudden cardiac death according to control intervention Show forest plot | 2 | 4520 | Risk Ratio (M‐H, Fixed, 95% CI) | 1.08 [0.90, 1.31] |
| 1.79.1 Placebo‐controlled trials | 2 | 4520 | Risk Ratio (M‐H, Fixed, 95% CI) | 1.08 [0.90, 1.31] |
| 1.79.2 No control intervention | 0 | 0 | Risk Ratio (M‐H, Fixed, 95% CI) | Not estimable |
| 1.80 HOSPITALISATION FOR ANY CAUSE Show forest plot | 7 | 18615 | Risk Ratio (M‐H, Fixed, 95% CI) | 1.04 [0.91, 1.19] |
| 1.81 REVASCULARISATION Show forest plot | 11 | 19631 | Risk Ratio (M‐H, Fixed, 95% CI) | 0.98 [0.91, 1.05] |
| 1.82 UNSTABLE ANGINA PECTORIS Show forest plot | 9 | 22172 | Risk Ratio (M‐H, Fixed, 95% CI) | 1.02 [0.92, 1.12] |
| Outcome or subgroup title | No. of studies | No. of participants | Statistical method | Effect size |
| 2.1 ALL‐CAUSE MORTALITY Show forest plot | 6 | 9517 | Risk Ratio (M‐H, Random, 95% CI) | 1.25 [1.06, 1.48] |
| 2.2 All‐cause mortality ‐ trials at low risk of bias Show forest plot | 2 | 4674 | Risk Ratio (M‐H, Fixed, 95% CI) | 1.25 [1.03, 1.51] |
| 2.3 All‐cause mortality ‐ 'best‐worst case' scenario Show forest plot | 6 | 9518 | Risk Ratio (M‐H, Fixed, 95% CI) | 1.22 [1.03, 1.43] |
| 2.4 All‐cause mortality ‐ 'worst‐best case' scenario Show forest plot | 6 | 9518 | Risk Ratio (M‐H, Fixed, 95% CI) | 1.31 [1.11, 1.54] |
| 2.5 All‐cause mortality ‐ modified 'best‐worst case' scenario Show forest plot | 6 | 9518 | Risk Ratio (M‐H, Fixed, 95% CI) | 1.24 [1.05, 1.46] |
| 2.6 All‐cause mortality ‐ modified 'worst‐best case' scenario Show forest plot | 6 | 9518 | Risk Ratio (M‐H, Fixed, 95% CI) | 1.28 [1.09, 1.51] |
| 2.7 All‐cause mortality ‐ trials with optimal medical therapy Show forest plot | 3 | 8682 | Risk Ratio (M‐H, Random, 95% CI) | 1.27 [1.07, 1.50] |
| 2.8 All‐cause mortality according to type of antibiotic Show forest plot | 6 | 9517 | Risk Ratio (M‐H, Random, 95% CI) | 1.25 [1.06, 1.48] |
| 2.8.1 Azithromycin | 2 | 362 | Risk Ratio (M‐H, Random, 95% CI) | 1.07 [0.33, 3.43] |
| 2.8.2 Clarithromycin | 3 | 4993 | Risk Ratio (M‐H, Random, 95% CI) | 1.25 [1.04, 1.51] |
| 2.8.3 Gatifloxacin | 1 | 4162 | Risk Ratio (M‐H, Random, 95% CI) | 1.29 [0.89, 1.85] |
| 2.9 All‐cause mortality according to antibody status Show forest plot | 6 | 9517 | Risk Ratio (M‐H, Random, 95% CI) | 1.25 [1.06, 1.48] |
| 2.9.1 People with antibodies | 2 | 362 | Risk Ratio (M‐H, Random, 95% CI) | 1.07 [0.33, 3.43] |
| 2.9.2 People without antibodies | 0 | 0 | Risk Ratio (M‐H, Random, 95% CI) | Not estimable |
| 2.9.3 Mixed | 4 | 9155 | Risk Ratio (M‐H, Random, 95% CI) | 1.26 [1.07, 1.49] |
| 2.10 All‐cause mortality according to use of statins Show forest plot | 4 | 9155 | Risk Ratio (M‐H, Random, 95% CI) | 1.26 [1.07, 1.49] |
| 2.10.1 People with use of statins | 1 | 4162 | Risk Ratio (M‐H, Random, 95% CI) | 1.29 [0.89, 1.85] |
| 2.10.2 People without use of statins | 0 | 0 | Risk Ratio (M‐H, Random, 95% CI) | Not estimable |
| 2.10.3 Mixed | 3 | 4993 | Risk Ratio (M‐H, Random, 95% CI) | 1.25 [1.04, 1.51] |
| 2.11 All‐cause mortality according to the mean age Show forest plot | 6 | 9517 | Risk Ratio (M‐H, Random, 95% CI) | 1.25 [1.06, 1.48] |
| 2.11.1 18 to 59 years | 2 | 4222 | Risk Ratio (M‐H, Random, 95% CI) | 1.26 [0.88, 1.82] |
| 2.11.2 60 and above | 4 | 5295 | Risk Ratio (M‐H, Random, 95% CI) | 1.25 [1.04, 1.51] |
| 2.12 All‐cause mortality according to clinical trial registration status Show forest plot | 6 | 9517 | Risk Ratio (M‐H, Random, 95% CI) | 1.25 [1.06, 1.48] |
| 2.12.1 Pre‐registration | 2 | 8534 | Risk Ratio (M‐H, Random, 95% CI) | 1.26 [1.06, 1.49] |
| 2.12.2 Post‐registration | 0 | 0 | Risk Ratio (M‐H, Random, 95% CI) | Not estimable |
| 2.12.3 No registration | 4 | 983 | Risk Ratio (M‐H, Random, 95% CI) | 1.23 [0.63, 2.40] |
| 2.13 All‐cause mortality according to class of antibiotic Show forest plot | 6 | 9517 | Risk Ratio (M‐H, Random, 95% CI) | 1.25 [1.06, 1.48] |
| 2.13.1 Macrolides | 5 | 5355 | Risk Ratio (M‐H, Random, 95% CI) | 1.25 [1.04, 1.50] |
| 2.13.2 Tetracycline | 0 | 0 | Risk Ratio (M‐H, Random, 95% CI) | Not estimable |
| 2.13.3 Quinolone | 1 | 4162 | Risk Ratio (M‐H, Random, 95% CI) | 1.29 [0.89, 1.85] |
| 2.14 All‐cause mortality according to funding Show forest plot | 6 | 9517 | Risk Ratio (M‐H, Random, 95% CI) | 1.25 [1.06, 1.48] |
| 2.14.1 Industry funded or unknown funded trials | 3 | 4783 | Risk Ratio (M‐H, Random, 95% CI) | 1.29 [0.93, 1.80] |
| 2.14.2 Non‐industry funded trials | 3 | 4734 | Risk Ratio (M‐H, Random, 95% CI) | 1.24 [1.03, 1.50] |
| 2.15 All‐cause mortality according to control intervention Show forest plot | 6 | 9517 | Risk Ratio (M‐H, Random, 95% CI) | 1.25 [1.06, 1.48] |
| 2.15.1 Placebo‐controlled trials | 6 | 9517 | Risk Ratio (M‐H, Random, 95% CI) | 1.25 [1.06, 1.48] |
| 2.15.2 No control intervention | 0 | 0 | Risk Ratio (M‐H, Random, 95% CI) | Not estimable |
| 2.16 CARDIOVASCULAR MORTALITY Show forest plot | 5 | 9044 | Risk Ratio (M‐H, Fixed, 95% CI) | 1.50 [1.17, 1.91] |
| 2.17 Cardiovascular mortality ‐ trials at low risk of bias Show forest plot | 2 | 4674 | Risk Ratio (M‐H, Fixed, 95% CI) | 1.43 [1.09, 1.89] |
| 2.18 Cardiovascular mortality ‐ 'best‐worst case' scenario Show forest plot | 5 | 9045 | Risk Ratio (M‐H, Fixed, 95% CI) | 1.39 [1.09, 1.77] |
| 2.19 Cardiovascular mortality ‐ 'worst‐best case' scenario Show forest plot | 5 | 9045 | Risk Ratio (M‐H, Fixed, 95% CI) | 1.60 [1.26, 2.04] |
| 2.20 Cardiovascular mortality ‐ modified 'best‐worst case' scenario Show forest plot | 5 | 9045 | Risk Ratio (M‐H, Fixed, 95% CI) | 1.44 [1.13, 1.84] |
| 2.21 Cardiovascular mortality ‐ modified 'worst‐best case' scenario Show forest plot | 5 | 9045 | Risk Ratio (M‐H, Fixed, 95% CI) | 1.56 [1.22, 1.98] |
| 2.22 Cardiovascular mortality ‐ trials with optimal medical therapy Show forest plot | 3 | 8682 | Risk Ratio (M‐H, Fixed, 95% CI) | 1.52 [1.18, 1.95] |
| 2.23 Cardiovascular mortality according to type of antibiotic Show forest plot | 5 | 9044 | Risk Ratio (M‐H, Random, 95% CI) | 1.48 [1.15, 1.89] |
| 2.23.1 Azithromycin | 2 | 362 | Risk Ratio (M‐H, Random, 95% CI) | 1.07 [0.33, 3.43] |
| 2.23.2 Clarithromycin | 2 | 4520 | Risk Ratio (M‐H, Random, 95% CI) | 2.00 [0.50, 7.94] |
| 2.23.3 Gatifloxacin | 1 | 4162 | Risk Ratio (M‐H, Random, 95% CI) | 1.64 [0.93, 2.89] |
| 2.24 Cardiovascular mortality according to antibody status Show forest plot | 5 | 9044 | Risk Ratio (M‐H, Random, 95% CI) | 1.48 [1.15, 1.89] |
| 2.24.1 People with antibodies | 2 | 362 | Risk Ratio (M‐H, Random, 95% CI) | 1.07 [0.33, 3.43] |
| 2.24.2 People without antibodies | 0 | 0 | Risk Ratio (M‐H, Random, 95% CI) | Not estimable |
| 2.24.3 Mixed | 3 | 8682 | Risk Ratio (M‐H, Random, 95% CI) | 1.50 [1.16, 1.93] |
| 2.25 Cardiovascular mortality according to use of statins Show forest plot | 3 | 8682 | Risk Ratio (M‐H, Random, 95% CI) | 1.50 [1.16, 1.93] |
| 2.25.1 People with use of statins | 1 | 4162 | Risk Ratio (M‐H, Random, 95% CI) | 1.64 [0.93, 2.89] |
| 2.25.2 People without use of statins | 0 | 0 | Risk Ratio (M‐H, Random, 95% CI) | Not estimable |
| 2.25.3 Mixed | 2 | 4520 | Risk Ratio (M‐H, Random, 95% CI) | 2.00 [0.50, 7.94] |
| 2.26 Cardiovascular mortality according to the mean age Show forest plot | 5 | 9044 | Risk Ratio (M‐H, Random, 95% CI) | 1.48 [1.15, 1.89] |
| 2.26.1 18 to 59 years | 2 | 4222 | Risk Ratio (M‐H, Random, 95% CI) | 1.56 [0.89, 2.72] |
| 2.26.2 60 and above | 3 | 4822 | Risk Ratio (M‐H, Random, 95% CI) | 1.46 [1.11, 1.92] |
| 2.27 Cardiovascular mortality according to clinical trial registration status Show forest plot | 5 | 9044 | Risk Ratio (M‐H, Random, 95% CI) | 1.48 [1.15, 1.89] |
| 2.27.1 Pre‐registration | 2 | 8534 | Risk Ratio (M‐H, Random, 95% CI) | 1.48 [1.15, 1.91] |
| 2.27.2 Post‐registration | 0 | 0 | Risk Ratio (M‐H, Random, 95% CI) | Not estimable |
| 2.27.3 No registration | 3 | 510 | Risk Ratio (M‐H, Random, 95% CI) | 1.48 [0.43, 5.10] |
| 2.28 Cardiovascular mortality according to class of antibiotic Show forest plot | 5 | 9044 | Risk Ratio (M‐H, Random, 95% CI) | 1.48 [1.15, 1.89] |
| 2.28.1 Macrolides | 4 | 4882 | Risk Ratio (M‐H, Random, 95% CI) | 1.44 [1.10, 1.90] |
| 2.28.2 Tetracycline | 0 | 0 | Risk Ratio (M‐H, Random, 95% CI) | Not estimable |
| 2.28.3 Quinolone | 1 | 4162 | Risk Ratio (M‐H, Random, 95% CI) | 1.64 [0.93, 2.89] |
| 2.29 Cardiovascular mortality according to funding Show forest plot | 5 | 9044 | Risk Ratio (M‐H, Random, 95% CI) | 1.48 [1.15, 1.89] |
| 2.29.1 Industry funded or unknown funded trials | 2 | 4310 | Risk Ratio (M‐H, Random, 95% CI) | 2.09 [0.64, 6.82] |
| 2.29.2 Non‐industry funded trials | 3 | 4734 | Risk Ratio (M‐H, Random, 95% CI) | 1.42 [1.08, 1.87] |
| 2.30 Cardiovascular mortality according to control intervention Show forest plot | 5 | 9044 | Risk Ratio (M‐H, Random, 95% CI) | 1.48 [1.15, 1.89] |
| 2.30.1 Placebo‐controlled trials | 5 | 9044 | Risk Ratio (M‐H, Random, 95% CI) | 1.48 [1.15, 1.89] |
| 2.30.2 No control intervention | 0 | 0 | Risk Ratio (M‐H, Random, 95% CI) | Not estimable |
| 2.31 MYOCARDIAL INFARCTION Show forest plot | 5 | 9457 | Risk Ratio (M‐H, Fixed, 95% CI) | 0.95 [0.82, 1.11] |
| 2.32 Myocardial infarction ‐ trials at low risk of bias Show forest plot | 2 | 4674 | Risk Ratio (M‐H, Fixed, 95% CI) | 1.08 [0.87, 1.33] |
| 2.33 Myocardial infarction ‐ 'best‐worst case' scenario Show forest plot | 5 | 9458 | Risk Ratio (M‐H, Fixed, 95% CI) | 0.93 [0.80, 1.08] |
| 2.34 Myocardial infarction ‐ 'worst‐best case' scenario Show forest plot | 5 | 9458 | Risk Ratio (M‐H, Fixed, 95% CI) | 0.99 [0.85, 1.15] |
| 2.35 Myocardial infarction ‐ modified 'best‐worst case' scenario Show forest plot | 5 | 9458 | Risk Ratio (M‐H, Fixed, 95% CI) | 0.94 [0.81, 1.09] |
| 2.36 Myocardial infarction ‐ modified 'worst‐best case' scenario Show forest plot | 5 | 9458 | Risk Ratio (M‐H, Fixed, 95% CI) | 0.97 [0.84, 1.13] |
| 2.37 Myocardial infarction ‐ trials with optimal medical therapy Show forest plot | 3 | 8682 | Risk Ratio (M‐H, Fixed, 95% CI) | 0.96 [0.83, 1.12] |
| 2.38 Myocardial infarction according to type of antibiotic Show forest plot | 5 | 9457 | Risk Ratio (M‐H, Random, 95% CI) | 0.89 [0.68, 1.17] |
| 2.38.1 Azithromycin | 1 | 302 | Risk Ratio (M‐H, Random, 95% CI) | 0.68 [0.19, 2.35] |
| 2.38.2 Clarithromycin | 3 | 4993 | Risk Ratio (M‐H, Random, 95% CI) | 0.64 [0.25, 1.63] |
| 2.38.3 Gatifloxacin | 1 | 4162 | Risk Ratio (M‐H, Random, 95% CI) | 0.89 [0.72, 1.12] |
| 2.39 Myocardial infarction according to antibody status Show forest plot | 5 | 9457 | Risk Ratio (M‐H, Random, 95% CI) | 0.89 [0.68, 1.17] |
| 2.39.1 People with antibodies | 1 | 302 | Risk Ratio (M‐H, Random, 95% CI) | 0.68 [0.19, 2.35] |
| 2.39.2 People without antibodies | 0 | 0 | Risk Ratio (M‐H, Random, 95% CI) | Not estimable |
| 2.39.3 Mixed | 4 | 9155 | Risk Ratio (M‐H, Random, 95% CI) | 0.89 [0.65, 1.21] |
| 2.40 Myocardial infarction according to use of statins Show forest plot | 5 | 9457 | Risk Ratio (M‐H, Random, 95% CI) | 0.89 [0.68, 1.17] |
| 2.40.1 People with use of statins | 1 | 4162 | Risk Ratio (M‐H, Random, 95% CI) | 0.89 [0.72, 1.12] |
| 2.40.2 People without use of statins | 0 | 0 | Risk Ratio (M‐H, Random, 95% CI) | Not estimable |
| 2.40.3 Mixed | 4 | 5295 | Risk Ratio (M‐H, Random, 95% CI) | 0.69 [0.35, 1.36] |
| 2.41 Myocardial infarction according to the mean age Show forest plot | 5 | 9457 | Risk Ratio (M‐H, Random, 95% CI) | 0.89 [0.68, 1.17] |
| 2.41.1 18 to 59 years | 1 | 4162 | Risk Ratio (M‐H, Random, 95% CI) | 0.89 [0.72, 1.12] |
| 2.41.2 60 and above | 4 | 5295 | Risk Ratio (M‐H, Random, 95% CI) | 0.69 [0.35, 1.36] |
| 2.42 Myocardial infarction according to clinical trial registration status Show forest plot | 5 | 9457 | Risk Ratio (M‐H, Random, 95% CI) | 0.89 [0.68, 1.17] |
| 2.42.1 Pre‐registration | 2 | 8534 | Risk Ratio (M‐H, Random, 95% CI) | 0.99 [0.81, 1.21] |
| 2.42.2 Post‐registration | 0 | 0 | Risk Ratio (M‐H, Random, 95% CI) | Not estimable |
| 2.42.3 No registration | 3 | 923 | Risk Ratio (M‐H, Random, 95% CI) | 0.44 [0.21, 0.91] |
| 2.43 Myocardial infarction according to class of antibiotic Show forest plot | 5 | 9457 | Risk Ratio (M‐H, Random, 95% CI) | 0.89 [0.68, 1.17] |
| 2.43.1 Macrolide | 4 | 5295 | Risk Ratio (M‐H, Random, 95% CI) | 0.69 [0.35, 1.36] |
| 2.43.2 Tetracycline | 0 | 0 | Risk Ratio (M‐H, Random, 95% CI) | Not estimable |
| 2.43.3 Quinolone | 1 | 4162 | Risk Ratio (M‐H, Random, 95% CI) | 0.89 [0.72, 1.12] |
| 2.44 Myocardial infarction according to funding Show forest plot | 5 | 9457 | Risk Ratio (M‐H, Random, 95% CI) | 0.89 [0.68, 1.17] |
| 2.44.1 Industry funded or unknown funded trials | 3 | 4783 | Risk Ratio (M‐H, Random, 95% CI) | 0.62 [0.30, 1.28] |
| 2.44.2 Non‐industry funded trials | 2 | 4674 | Risk Ratio (M‐H, Random, 95% CI) | 1.08 [0.87, 1.34] |
| 2.45 Myocardial infarction according to control intervention Show forest plot | 5 | 9457 | Risk Ratio (M‐H, Random, 95% CI) | 0.89 [0.68, 1.17] |
| 2.45.1 Placebo‐controlled trials | 5 | 9457 | Risk Ratio (M‐H, Random, 95% CI) | 0.89 [0.68, 1.17] |
| 2.45.2 No control intervention | 0 | 0 | Risk Ratio (M‐H, Random, 95% CI) | Not estimable |
| 2.46 STROKE Show forest plot | 5 | 9457 | Risk Ratio (M‐H, Fixed, 95% CI) | 1.17 [0.90, 1.52] |
| 2.47 Stroke ‐ trials at low risk of bias Show forest plot | 2 | 4674 | Risk Ratio (M‐H, Fixed, 95% CI) | 1.17 [0.86, 1.60] |
| 2.48 Stroke ‐ 'best‐worst case' scenario Show forest plot | 5 | 9458 | Risk Ratio (M‐H, Fixed, 95% CI) | 1.08 [0.84, 1.40] |
| 2.49 Stroke ‐ 'worst‐best case' scenario Show forest plot | 5 | 9458 | Risk Ratio (M‐H, Fixed, 95% CI) | 1.28 [0.99, 1.66] |
| 2.50 Stroke ‐ modified 'best‐worst case' scenario Show forest plot | 5 | 9458 | Risk Ratio (M‐H, Fixed, 95% CI) | 1.13 [0.87, 1.46] |
| 2.51 Stroke ‐ modified 'worst‐best case' scenario Show forest plot | 5 | 9458 | Risk Ratio (M‐H, Fixed, 95% CI) | 1.23 [0.95, 1.60] |
| 2.52 Stroke ‐ trials with optimal medical therapy Show forest plot | 3 | 8682 | Risk Ratio (M‐H, Fixed, 95% CI) | 1.16 [0.88, 1.53] |
| 2.53 Stroke according to type of antibiotic Show forest plot | 5 | 9457 | Risk Ratio (M‐H, Random, 95% CI) | 1.17 [0.90, 1.53] |
| 2.53.1 Azithromycin | 1 | 302 | Risk Ratio (M‐H, Random, 95% CI) | 0.34 [0.04, 3.21] |
| 2.53.2 Clarithromycin | 3 | 4993 | Risk Ratio (M‐H, Random, 95% CI) | 1.24 [0.92, 1.67] |
| 2.53.3 Gatifloxacin | 1 | 4162 | Risk Ratio (M‐H, Random, 95% CI) | 1.05 [0.59, 1.88] |
| 2.54 Stroke according to antibody status Show forest plot | 5 | 9457 | Risk Ratio (M‐H, Random, 95% CI) | 1.17 [0.90, 1.53] |
| 2.54.1 People with antibodies | 1 | 302 | Risk Ratio (M‐H, Random, 95% CI) | 0.34 [0.04, 3.21] |
| 2.54.2 People without antibodies | 0 | 0 | Risk Ratio (M‐H, Random, 95% CI) | Not estimable |
| 2.54.3 Mixed | 4 | 9155 | Risk Ratio (M‐H, Random, 95% CI) | 1.20 [0.92, 1.56] |
| 2.55 Stroke according to use of statins Show forest plot | 5 | 9457 | Risk Ratio (M‐H, Random, 95% CI) | 1.17 [0.90, 1.53] |
| 2.55.1 People with use of statins | 1 | 4162 | Risk Ratio (M‐H, Random, 95% CI) | 1.05 [0.59, 1.88] |
| 2.55.2 People without use of statins | 0 | 0 | Risk Ratio (M‐H, Random, 95% CI) | Not estimable |
| 2.55.3 Mixed | 4 | 5295 | Risk Ratio (M‐H, Random, 95% CI) | 1.21 [0.90, 1.63] |
| 2.56 Stroke according to the mean age Show forest plot | 5 | 9453 | Risk Ratio (M‐H, Random, 95% CI) | 1.17 [0.90, 1.53] |
| 2.56.1 18 to 59 years | 1 | 4162 | Risk Ratio (M‐H, Random, 95% CI) | 1.05 [0.59, 1.88] |
| 2.56.2 60 and above | 4 | 5291 | Risk Ratio (M‐H, Random, 95% CI) | 1.21 [0.90, 1.63] |
| 2.57 Stroke according to clinical trial registration status Show forest plot | 5 | 9457 | Risk Ratio (M‐H, Random, 95% CI) | 1.17 [0.90, 1.53] |
| 2.57.1 Pre‐registration | 2 | 8534 | Risk Ratio (M‐H, Random, 95% CI) | 1.17 [0.88, 1.54] |
| 2.57.2 Post‐registration | 0 | 0 | Risk Ratio (M‐H, Random, 95% CI) | Not estimable |
| 2.57.3 No registration | 3 | 923 | Risk Ratio (M‐H, Random, 95% CI) | 1.24 [0.52, 2.95] |
| 2.58 Stroke according to class of antibiotic Show forest plot | 5 | 9457 | Risk Ratio (M‐H, Random, 95% CI) | 1.17 [0.90, 1.53] |
| 2.58.1 Macrolide | 4 | 5295 | Risk Ratio (M‐H, Random, 95% CI) | 1.21 [0.90, 1.63] |
| 2.58.2 Tetracycline | 0 | 0 | Risk Ratio (M‐H, Random, 95% CI) | Not estimable |
| 2.58.3 Quinolone | 1 | 4162 | Risk Ratio (M‐H, Random, 95% CI) | 1.05 [0.59, 1.88] |
| 2.59 Stroke according to funding Show forest plot | 5 | 9457 | Risk Ratio (M‐H, Random, 95% CI) | 1.17 [0.90, 1.53] |
| 2.59.1 Industry funded or unknown funded trials | 3 | 4783 | Risk Ratio (M‐H, Random, 95% CI) | 1.17 [0.71, 1.92] |
| 2.59.2 Non‐industry funded trials | 2 | 4674 | Risk Ratio (M‐H, Random, 95% CI) | 1.06 [0.50, 2.25] |
| 2.60 Stroke according to control intervention Show forest plot | 5 | 9457 | Risk Ratio (M‐H, Random, 95% CI) | 1.17 [0.90, 1.53] |
| 2.60.1 Placebo‐controlled trials | 5 | 9457 | Risk Ratio (M‐H, Random, 95% CI) | 1.17 [0.90, 1.53] |
| 2.60.2 No control intervention | 0 | 0 | Risk Ratio (M‐H, Random, 95% CI) | Not estimable |
| 2.61 SUDDEN CARDIAC DEATH Show forest plot | 2 | 4520 | Risk Ratio (M‐H, Fixed, 95% CI) | 1.77 [1.28, 2.44] |
| 2.62 Sudden cardiac death ‐ trials at low risk of bias Show forest plot | 1 | 4372 | Risk Ratio (M‐H, Fixed, 95% CI) | 1.75 [1.27, 2.42] |
| 2.63 Sudden cardiac death ‐ 'best‐worst case' scenario Show forest plot | 2 | 4521 | Risk Ratio (M‐H, Fixed, 95% CI) | 1.68 [1.22, 2.30] |
| 2.64 Sudden cardiac death ‐ 'worst‐best case' scenario Show forest plot | 2 | 4521 | Risk Ratio (M‐H, Fixed, 95% CI) | 1.91 [1.39, 2.62] |
| 2.65 Sudden cardiac death ‐ modified 'best‐worst case' scenario Show forest plot | 2 | 4521 | Risk Ratio (M‐H, Fixed, 95% CI) | 1.74 [1.26, 2.39] |
| 2.66 Sudden cardiac death ‐ modified 'worst‐best case' scenario Show forest plot | 2 | 4521 | Risk Ratio (M‐H, Fixed, 95% CI) | 1.84 [1.34, 2.53] |
| 2.67 Sudden cardiac death according to clinical trial registration status Show forest plot | 2 | 4520 | Risk Ratio (M‐H, Fixed, 95% CI) | 1.77 [1.28, 2.44] |
| 2.67.1 Pre‐registration | 1 | 4372 | Risk Ratio (M‐H, Fixed, 95% CI) | 1.75 [1.27, 2.42] |
| 2.67.2 Post‐registration | 0 | 0 | Risk Ratio (M‐H, Fixed, 95% CI) | Not estimable |
| 2.67.3 No registration | 1 | 148 | Risk Ratio (M‐H, Fixed, 95% CI) | 3.00 [0.12, 72.47] |
| 2.68 Sudden cardiac death according to funding Show forest plot | 2 | 4520 | Risk Ratio (M‐H, Fixed, 95% CI) | 1.77 [1.28, 2.44] |
| 2.68.1 Industry funded or unknown funded trials | 1 | 148 | Risk Ratio (M‐H, Fixed, 95% CI) | 3.00 [0.12, 72.47] |
| 2.68.2 Non‐industry funded trials | 1 | 4372 | Risk Ratio (M‐H, Fixed, 95% CI) | 1.75 [1.27, 2.42] |
| 2.69 Sudden cardiac death according to type of antibiotic Show forest plot | 2 | 4520 | Risk Ratio (M‐H, Fixed, 95% CI) | 1.77 [1.28, 2.44] |
| 2.69.1 Clarithromycin | 2 | 4520 | Risk Ratio (M‐H, Fixed, 95% CI) | 1.77 [1.28, 2.44] |
| 2.70 Sudden cardiac death according to antibody status Show forest plot | 2 | 4520 | Risk Ratio (M‐H, Fixed, 95% CI) | 1.77 [1.28, 2.44] |
| 2.70.1 People with antibodies | 0 | 0 | Risk Ratio (M‐H, Fixed, 95% CI) | Not estimable |
| 2.70.2 People without antibodies | 0 | 0 | Risk Ratio (M‐H, Fixed, 95% CI) | Not estimable |
| 2.70.3 Mixed | 2 | 4520 | Risk Ratio (M‐H, Fixed, 95% CI) | 1.77 [1.28, 2.44] |
| 2.71 Sudden cardiac death according to use of statins Show forest plot | 2 | 4520 | Risk Ratio (M‐H, Fixed, 95% CI) | 1.77 [1.28, 2.44] |
| 2.71.1 People with use of statins | 0 | 0 | Risk Ratio (M‐H, Fixed, 95% CI) | Not estimable |
| 2.71.2 People without use of statins | 0 | 0 | Risk Ratio (M‐H, Fixed, 95% CI) | Not estimable |
| 2.71.3 Mixed | 2 | 4520 | Risk Ratio (M‐H, Fixed, 95% CI) | 1.77 [1.28, 2.44] |
| 2.72 Sudden cardiac death according to the mean age Show forest plot | 2 | 4520 | Risk Ratio (M‐H, Fixed, 95% CI) | 1.77 [1.28, 2.44] |
| 2.72.1 18 to 59 years | 0 | 0 | Risk Ratio (M‐H, Fixed, 95% CI) | Not estimable |
| 2.72.2 60 and above | 2 | 4520 | Risk Ratio (M‐H, Fixed, 95% CI) | 1.77 [1.28, 2.44] |
| 2.73 Sudden cardiac death according to class of antibiotic Show forest plot | 2 | 4520 | Risk Ratio (M‐H, Fixed, 95% CI) | 1.77 [1.28, 2.44] |
| 2.73.1 Macrolide | 2 | 4520 | Risk Ratio (M‐H, Fixed, 95% CI) | 1.77 [1.28, 2.44] |
| 2.73.2 Tetracycline | 0 | 0 | Risk Ratio (M‐H, Fixed, 95% CI) | Not estimable |
| 2.73.3 Quinolone | 0 | 0 | Risk Ratio (M‐H, Fixed, 95% CI) | Not estimable |
| 2.74 Sudden cardiac death according to control intervention Show forest plot | 2 | 4520 | Risk Ratio (M‐H, Fixed, 95% CI) | 1.77 [1.28, 2.44] |
| 2.74.1 Placebo‐controlled trials | 2 | 4520 | Risk Ratio (M‐H, Fixed, 95% CI) | 1.77 [1.28, 2.44] |
| 2.74.2 No control intervention | 0 | 0 | Risk Ratio (M‐H, Fixed, 95% CI) | Not estimable |
| 2.75 HOSPITALISATION FOR ANY CAUSE Show forest plot | 2 | 4464 | Risk Ratio (M‐H, Fixed, 95% CI) | 1.03 [0.78, 1.34] |
| 2.76 REVASCULARISATION Show forest plot | 3 | 4937 | Risk Ratio (M‐H, Fixed, 95% CI) | 0.94 [0.83, 1.07] |
| 2.77 UNSTABLE ANGINA PECTORIS Show forest plot | 4 | 5085 | Risk Ratio (M‐H, Random, 95% CI) | 0.96 [0.75, 1.23] |