| 1 Osteodistraction versus inlay bone graft (binary) Show forest plot | 1 | | Odds Ratio (M‐H, Fixed, 95% CI) | Subtotals only |
|
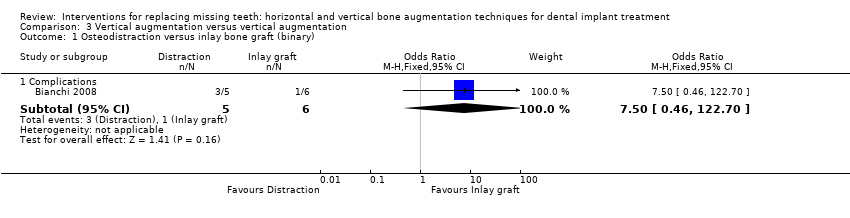
| 1.1 Complications | 1 | 11 | Odds Ratio (M‐H, Fixed, 95% CI) | 7.50 [0.46, 122.70] |
| 2 Osteodistraction versus inlay bone graft (continuous) Show forest plot | 1 | | Mean Difference (IV, Fixed, 95% CI) | Subtotals only |
|
| 2.1 Bone gain | 1 | 11 | Mean Difference (IV, Fixed, 95% CI) | 3.25 [1.66, 4.84] |
| 3 Osteodistraction versus onlay bone graft (binary) Show forest plot | 1 | | Odds Ratio (M‐H, Fixed, 95% CI) | Subtotals only |
|
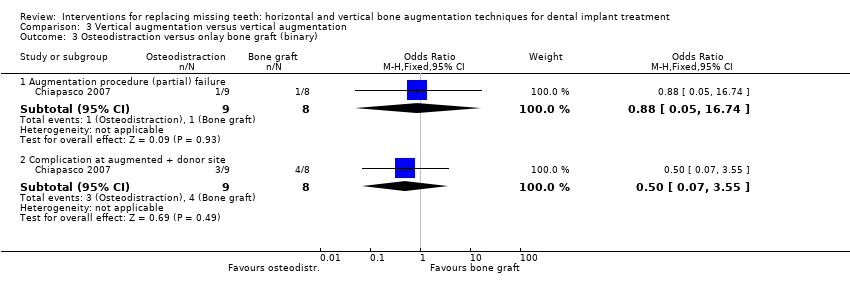
| 3.1 Augmentation procedure (partial) failure | 1 | 17 | Odds Ratio (M‐H, Fixed, 95% CI) | 0.88 [0.05, 16.74] |
| 3.2 Complication at augmented + donor site | 1 | 17 | Odds Ratio (M‐H, Fixed, 95% CI) | 0.5 [0.07, 3.55] |
| 4 Osteodistraction versus onlay bone graft (continuous) Show forest plot | 1 | | Mean Difference (IV, Fixed, 95% CI) | Subtotals only |
|
| 4.1 Vertical bone gain | 1 | 17 | Mean Difference (IV, Fixed, 95% CI) | 0.30 [‐0.97, 1.57] |
| 4.2 1‐year post‐loading bone level changes | 1 | 17 | Mean Difference (IV, Fixed, 95% CI) | 0.09 [‐0.26, 0.44] |
| 4.3 3‐year post‐loading bone level changes | 1 | 17 | Mean Difference (IV, Fixed, 95% CI) | 0.29 [‐0.14, 0.72] |
| 5 Osteodistraction versus GBR (binary) Show forest plot | 1 | | Odds Ratio (M‐H, Fixed, 95% CI) | Subtotals only |
|
| 5.1 Complication at augmentation + donor site | 1 | 21 | Odds Ratio (M‐H, Fixed, 95% CI) | 0.3 [0.04, 2.11] |
| 6 GBR: autogenous bone versus bone substitute (continuous) Show forest plot | 1 | | Mean Difference (Fixed, 95% CI) | Subtotals only |
|
| 6.1 Vertical bone gain | 1 | | Mean Difference (Fixed, 95% CI) | 0.6 [0.21, 0.99] |
| 7 GBR: non‐resorbable versus resorbable barriers (binary) Show forest plot | 1 | | Odds Ratio (M‐H, Fixed, 95% CI) | Subtotals only |
|
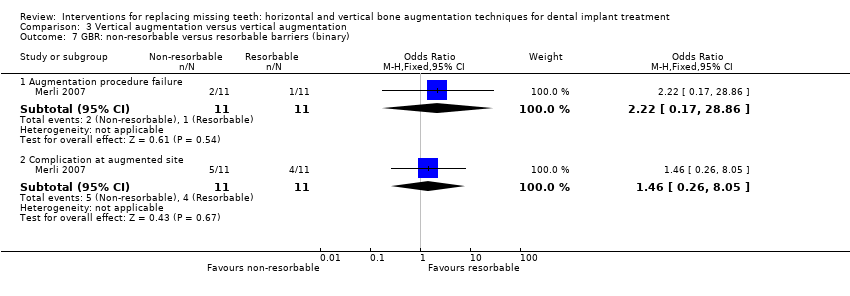
| 7.1 Augmentation procedure failure | 1 | 22 | Odds Ratio (M‐H, Fixed, 95% CI) | 2.22 [0.17, 28.86] |
| 7.2 Complication at augmented site | 1 | 22 | Odds Ratio (M‐H, Fixed, 95% CI) | 1.46 [0.26, 8.05] |
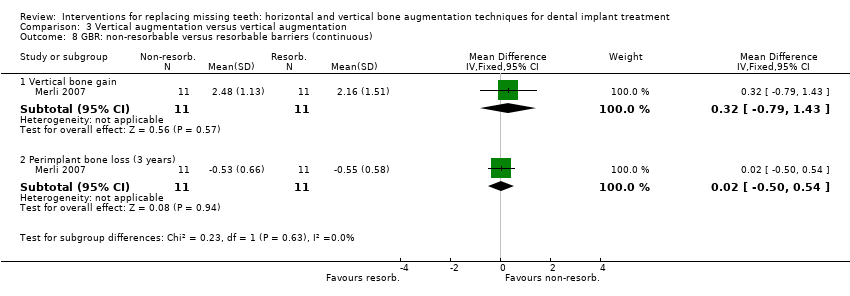
| 8 GBR: non‐resorbable versus resorbable barriers (continuous) Show forest plot | 1 | | Mean Difference (IV, Fixed, 95% CI) | Subtotals only |
|
| 8.1 Vertical bone gain | 1 | 22 | Mean Difference (IV, Fixed, 95% CI) | 0.32 [‐0.79, 1.43] |
| 8.2 Perimplant bone loss (3 years) | 1 | 22 | Mean Difference (IV, Fixed, 95% CI) | 0.02 [‐0.50, 0.54] |
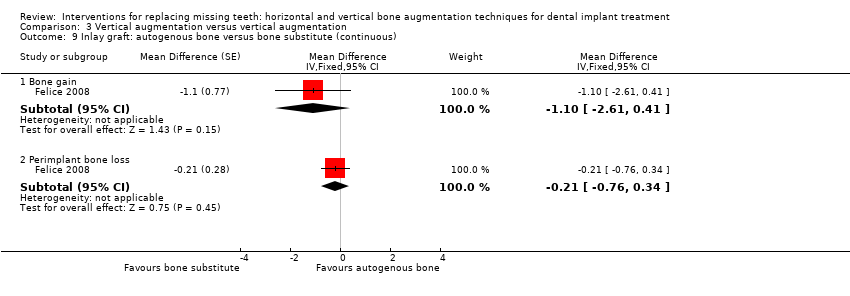
| 9 Inlay graft: autogenous bone versus bone substitute (continuous) Show forest plot | 1 | | Mean Difference (Fixed, 95% CI) | Subtotals only |
|
| 9.1 Bone gain | 1 | | Mean Difference (Fixed, 95% CI) | ‐1.1 [‐2.61, 0.41] |
| 9.2 Perimplant bone loss | 1 | | Mean Difference (Fixed, 95% CI) | ‐0.21 [‐0.76, 0.34] |
| 10 Inlay graft: autogenous bone versus bone substitute (binary) Show forest plot | 1 | | Odds Ratio (Fixed, 95% CI) | Subtotals only |
|
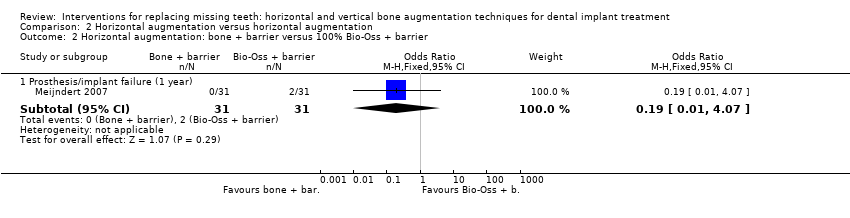
| 10.1 Prosthesis failure | 1 | | Odds Ratio (Fixed, 95% CI) | 1.0 [0.01, 82.26] |
| 10.2 Implant failure | 1 | | Odds Ratio (Fixed, 95% CI) | 1.0 [0.01, 82.26] |
| 10.3 Major complications | 1 | | Odds Ratio (Fixed, 95% CI) | 2.00 [0.11, 37.83] |
| 11 Autogenous bone: inlay versus onlay (binary) Show forest plot | 1 | | Odds Ratio (M‐H, Fixed, 95% CI) | Subtotals only |
|
| 11.1 Graft failure | 1 | 23 | Odds Ratio (M‐H, Fixed, 95% CI) | 1.33 [0.07, 24.32] |
| 11.2 Major complications | 1 | 23 | Odds Ratio (M‐H, Fixed, 95% CI) | 1.07 [0.20, 5.77] |
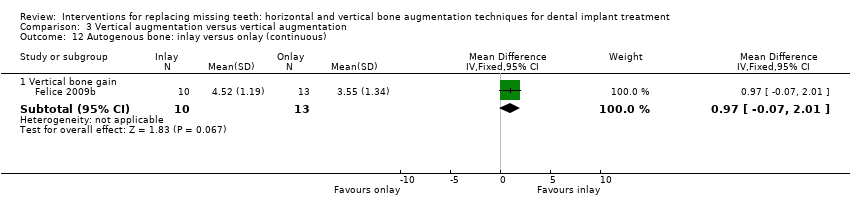
| 12 Autogenous bone: inlay versus onlay (continuous) Show forest plot | 1 | | Mean Difference (IV, Fixed, 95% CI) | Subtotals only |
|
| 12.1 Vertical bone gain | 1 | 23 | Mean Difference (IV, Fixed, 95% CI) | 0.97 [‐0.07, 2.01] |