Scolaris Content Display Scolaris Content Display

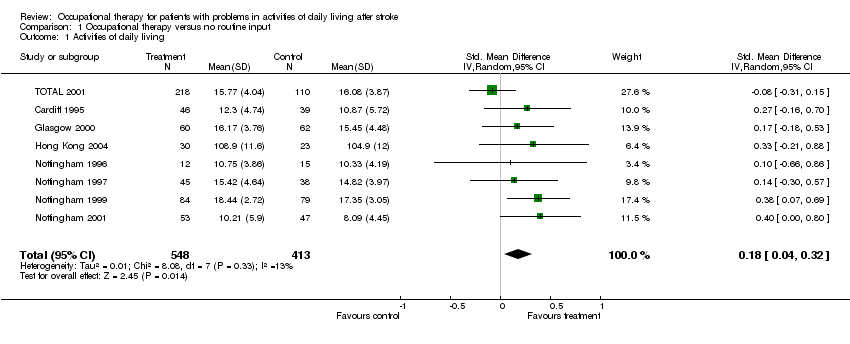
Comparison 1 Occupational therapy versus no routine input, Outcome 1 Activities of daily living.
Figuras y tablas -
Analysis 1.1

Comparison 1 Occupational therapy versus no routine input, Outcome 1 Activities of daily living.

Comparison 1 Occupational therapy versus no routine input, Outcome 2 Death or 'poor outcome' (deterioration or dependency).
Figuras y tablas -
Analysis 1.2

Comparison 1 Occupational therapy versus no routine input, Outcome 2 Death or 'poor outcome' (deterioration or dependency).

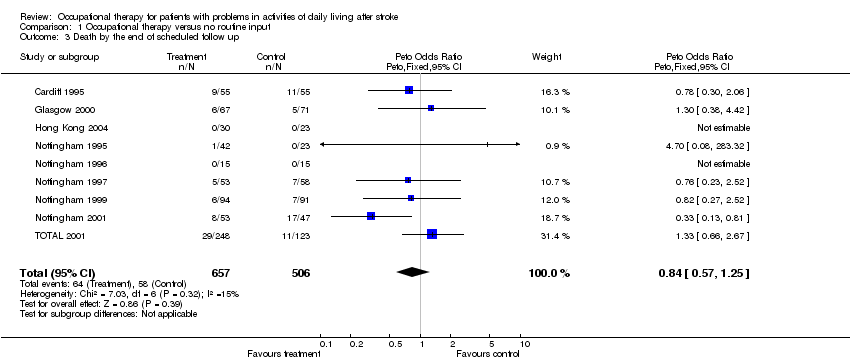
Comparison 1 Occupational therapy versus no routine input, Outcome 3 Death by the end of scheduled follow up.
Figuras y tablas -
Analysis 1.3

Comparison 1 Occupational therapy versus no routine input, Outcome 3 Death by the end of scheduled follow up.

Comparison 1 Occupational therapy versus no routine input, Outcome 4 Death or requiring institutional care by the end of scheduled follow up.
Figuras y tablas -
Analysis 1.4

Comparison 1 Occupational therapy versus no routine input, Outcome 4 Death or requiring institutional care by the end of scheduled follow up.

Comparison 1 Occupational therapy versus no routine input, Outcome 5 Death or dependency by the end of scheduled follow up.
Figuras y tablas -
Analysis 1.5

Comparison 1 Occupational therapy versus no routine input, Outcome 5 Death or dependency by the end of scheduled follow up.

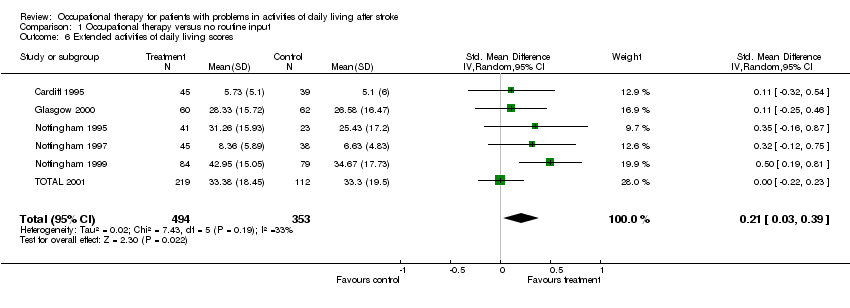
Comparison 1 Occupational therapy versus no routine input, Outcome 6 Extended activities of daily living scores.
Figuras y tablas -
Analysis 1.6

Comparison 1 Occupational therapy versus no routine input, Outcome 6 Extended activities of daily living scores.

Comparison 1 Occupational therapy versus no routine input, Outcome 7 Subjective health status scores.
Figuras y tablas -
Analysis 1.7

Comparison 1 Occupational therapy versus no routine input, Outcome 7 Subjective health status scores.

Comparison 1 Occupational therapy versus no routine input, Outcome 8 Mood/distress scores.
Figuras y tablas -
Analysis 1.8

Comparison 1 Occupational therapy versus no routine input, Outcome 8 Mood/distress scores.

Comparison 1 Occupational therapy versus no routine input, Outcome 9 Carers: quality of life.
Figuras y tablas -
Analysis 1.9

Comparison 1 Occupational therapy versus no routine input, Outcome 9 Carers: quality of life.

Comparison 1 Occupational therapy versus no routine input, Outcome 10 Carers: mood/distress.
Figuras y tablas -
Analysis 1.10

Comparison 1 Occupational therapy versus no routine input, Outcome 10 Carers: mood/distress.

Comparison 1 Occupational therapy versus no routine input, Outcome 11 Sensitivity to missing data (odds of poor outcome: better).
Figuras y tablas -
Analysis 1.11

Comparison 1 Occupational therapy versus no routine input, Outcome 11 Sensitivity to missing data (odds of poor outcome: better).

Comparison 1 Occupational therapy versus no routine input, Outcome 12 Sensitivity to missing data (odds of poor outcome: worse).
Figuras y tablas -
Analysis 1.12

Comparison 1 Occupational therapy versus no routine input, Outcome 12 Sensitivity to missing data (odds of poor outcome: worse).

Table 1. Completeness of data: activities of daily living (outcome 1)

Study

N(I)

n(I)

Dead(I)

Missing(I)

N(C)

n(C)

Dead(C)

Missing(C)

Cardiff 1995

55

46

9

0

55

39

11

5

Nottingham 1996

15

12

0

3

15

15

0

0

Nottingham 1997

53

45

5

3

58

38

7

13

Nottingham 1999

94

84

6

4

91

79

7

5

Glasgow 2000

67

60

6

1

71

62

5

4

Nottingham 2001

53

53

8

0

47

47

17

0

TOTAL 2001

309

218

29

62

157

110

11

36

Hong Kong 2004

30

30

0

0

23

23

0

0

Figuras y tablas -
Table 1. Completeness of data: activities of daily living (outcome 1)
Table 2. Completeness of data: death or poor outcome (outcome 2)

Study

N(I)

n(I)

Dead(I) or deterior

Missing(I)

N(C)

n(C)

Dead(C) or deterior

Missing(C)

Measure

Cardiff 1995

55

55

9 + 24 = 33

0

55

54

11 + 21 = 32

1

Barthel deterioration

Nottingham 1995

42

42

0 + 2 = 2

0

23

23

1 + 2 = 3

0

Barthel deterioration

Nottingham 1997

53

53

5 + 1 = 6

0

58

58

7 + 7 = 14

0

Institutionalisation

Nottingham 1999

94

90

6 + 12 = 18

4

91

86

7 + 20 = 27

5

Barthel < 15 dependence

Glasgow 2000

67

66

6 + 27 = 33

1

71

67

5 + 36 = 41

4

Barthel deterioration

Nottingham 2001

53

53

27

0

47

47

36

0

Barthel deterioration

TOTAL 2001

309

248

29 + 77 = 106

61

157

123

11 + 45 = 56

34

Barthel < 15 dependence

Figuras y tablas -
Table 2. Completeness of data: death or poor outcome (outcome 2)
Table 3. Completeness of data: death (outcome 3)

Study

N(I)

n(I)

Dead(I)

Missing(I)

N(C)

n(C)

Dead(C)

Missing(C)

Cardiff 1995

55

55

9

0

55

55

11

0

Nottingham 1995

42

42

1

0

23

23

0

0

Nottingham 1996

15

15

0

0

15

15

0

0

Nottingham 1997

53

53

5

0

58

58

7

0

Nottingham 1999

94

94

6

0

91

91

7

0

Glasgow 2000

67

67

6

0

71

71

5

0

Nottingham 2001

53

53

8

0

47

47

17

0

TOTAL 2001

309

248

29

61

157

123

11

34

Hong Kong 2004

30

30

0

0

23

23

0

0

Figuras y tablas -
Table 3. Completeness of data: death (outcome 3)
Table 4. Completeness of data: death or requiring institutional care (outcome 4)

Study

N(I)

n(I)

Dead(I) or instit

Missing(I)

N(C)

n(C)

Dead(C) or instit

Missing(C)

Cardiff 1995

55

55

9 + 16 = 25

0

55

54

11 + 18 = 29

1

Nottingham 1997

53

53

5 + 1 = 6

0

58

58

7 + 7 = 14

0

Glasgow 2000

67

67

6 + 4 = 10

0

71

71

5 + 4 = 9

0

Figuras y tablas -
Table 4. Completeness of data: death or requiring institutional care (outcome 4)
Table 5. Completeness of data: death or dependency (outcome 5)

Study

N(I)

n(I)

Dead(I) or dependent

Missing(I)

N(C)

n(C)

Dead(C) or dependent

Missing(C)

Measure

Cardiff 1995

55

55

9 + 32 = 41

0

55

54

11 + 30 = 41

1

Barthel < 15

Nottingham 1999

94

90

6 + 12 = 18

4

91

86

7 + 20 = 27

5

Barthel < 15

Glasgow 2000

67

66

6 + 21 = 27

1

71

66

6 + 14 = 20

5

Barthel < 15

TOTAL 2001

309

248

29 + 77 = 106

61

157

123

11 + 45 = 56

34

Barthel < 15

Figuras y tablas -
Table 5. Completeness of data: death or dependency (outcome 5)
Table 6. Completeness of data: extended activities of daily living (outcome 6)

Study

N(I)

n(I)

Dead(I)

Missing(I)

N(C)

n(C)

Dead(C)

Missing(C)

Cardiff 1995

55

45

9

1

55

39

11

5

Nottingham 1995

42

41

0

1

23

23

1

0

Nottingham 1997

53

45

5

3

58

38

7

13

Nottingham 1999

94

84

6

4

91

79

7

5

Glasgow 2000

67

60

6

1

71

62

5

4

TOTAL 2001

309

219

29

61

157

112

11

34

Figuras y tablas -
Table 6. Completeness of data: extended activities of daily living (outcome 6)
Table 7. Completeness of data: quality of life (outcome 7)

Study

N(I)

n(I)

Dead(I)

Missing(I)

N(C)

n(C)

Dead(C)

Missing(C)

Nottingham 1995

42

40

0

2

23

19

1

4

Glasgow 2000

67

54

6

7

71

54

5

12

Figuras y tablas -
Table 7. Completeness of data: quality of life (outcome 7)
Table 8. Completeness of data: mood/distress (outcome 8)

Study

N(I)

n(I)

Dead(I)

Missing(I)

N(C)

n(C)

Dead(C)

Missing(C)

Cardiff 1995

55

41

9

5

55

31

11

13

Nottingham 1997

53

39

5

9

58

34

7

17

Nottingham 1999

94

83

6

5

91

77

7

7

TOTAL 2001

309

219

29

61

157

112

11

34

Figuras y tablas -
Table 8. Completeness of data: mood/distress (outcome 8)
Table 9. Completeness of data: carers quality of life (outcome 9)

Study

N(I)

n(I)

Dead(I)

Missing(I)

N(C)

n(C)

Dead(C)

Missing(C)

Cardiff 1995

55

30

0

25

55

24

0

31

Figuras y tablas -
Table 9. Completeness of data: carers quality of life (outcome 9)
Table 10. Completeness of data: carers mood (outcome 10)

Study

N(I)

n(I)

Missing(I)

N(C)

n(C)

Missing(C)

Measure

Nottingham 1997

53

29

24

58

26

32

General Health Questionnaire

Nottingham 1999

94

58

36

91

39

52

General Health Questionnaire

Glasgow 2000

67

49

18

71

58

13

General Health Questionnaire

TOTAL 2001

309

219

90

157

112

45

General Health Questionnaire

Figuras y tablas -
Table 10. Completeness of data: carers mood (outcome 10)
Comparison 1. Occupational therapy versus no routine input

Outcome or subgroup title

No. of studies

No. of participants

Statistical method

Effect size

1 Activities of daily living Show forest plot

8

961

Std. Mean Difference (IV, Random, 95% CI)

0.18 [0.04, 0.32]

2 Death or 'poor outcome' (deterioration or dependency) Show forest plot

7

1065

Peto Odds Ratio (Peto, Fixed, 95% CI)

0.67 [0.51, 0.87]

3 Death by the end of scheduled follow up Show forest plot

9

1163

Peto Odds Ratio (Peto, Fixed, 95% CI)

0.84 [0.57, 1.25]

4 Death or requiring institutional care by the end of scheduled follow up Show forest plot

3

358

Peto Odds Ratio (Peto, Fixed, 95% CI)

0.72 [0.43, 1.19]

5 Death or dependency by the end of scheduled follow up Show forest plot

4

788

Peto Odds Ratio (Peto, Fixed, 95% CI)

0.90 [0.67, 1.23]

6 Extended activities of daily living scores Show forest plot

6

847

Std. Mean Difference (IV, Random, 95% CI)

0.21 [0.03, 0.39]

7 Subjective health status scores Show forest plot

2

167

Std. Mean Difference (IV, Random, 95% CI)

0.17 [‐0.14, 0.48]

8 Mood/distress scores Show forest plot

4

636

Std. Mean Difference (IV, Random, 95% CI)

0.07 [‐0.09, 0.23]

9 Carers: quality of life Show forest plot

1

54

Std. Mean Difference (IV, Random, 95% CI)

0.12 [‐0.41, 0.66]

10 Carers: mood/distress Show forest plot

4

590

Std. Mean Difference (IV, Random, 95% CI)

0.23 [‐0.05, 0.51]

11 Sensitivity to missing data (odds of poor outcome: better) Show forest plot

7

1175

Peto Odds Ratio (Peto, Fixed, 95% CI)

0.71 [0.55, 0.92]

12 Sensitivity to missing data (odds of poor outcome: worse) Show forest plot

7

1175

Peto Odds Ratio (Peto, Fixed, 95% CI)

0.67 [0.52, 0.86]

Figuras y tablas -
Comparison 1. Occupational therapy versus no routine input