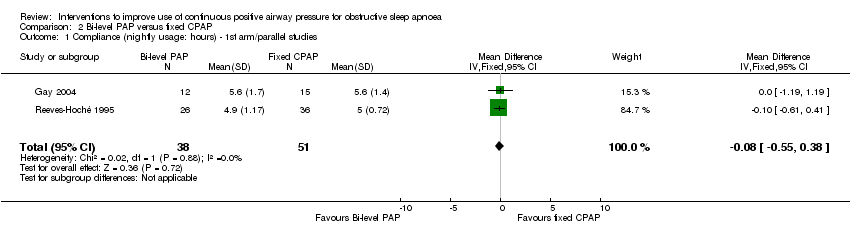
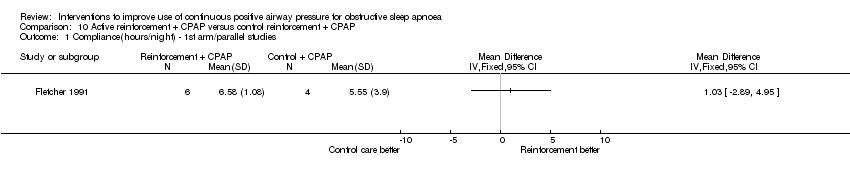
| 1 Compliance (nightly usage: hours) ‐ 1st arm/parallel studies Show forest plot | 5 | 237 | Mean Difference (IV, Random, 95% CI) | 0.32 [‐0.26, 0.90] |
|
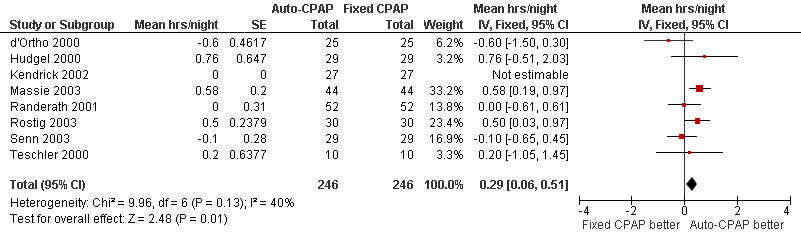
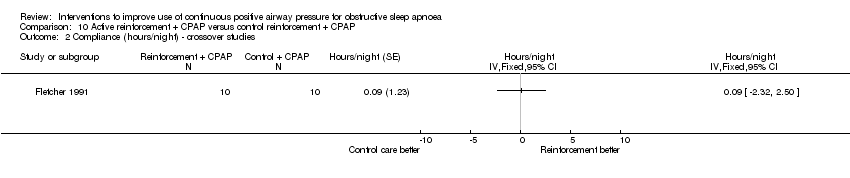
| 2 Compliance (nightly usage) ‐ crossover studies Show forest plot | 8 | 492 | Mean hrs/night (Fixed, 95% CI) | 0.29 [0.06, 0.51] |
|
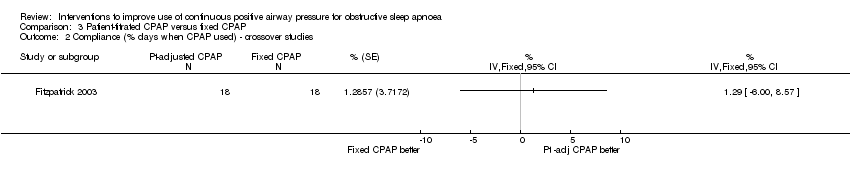
| 3 Compliance (frequency of usage as % of days) ‐ crossover studies Show forest plot | 4 | 176 | % (Fixed, 95% CI) | 3.15 [‐0.97, 7.27] |
|
| 4 Compliance (frequency of usage as % of days) ‐ 1st arm/parallel studies Show forest plot | 1 | | Mean Difference (IV, Fixed, 95% CI) | Totals not selected |
|
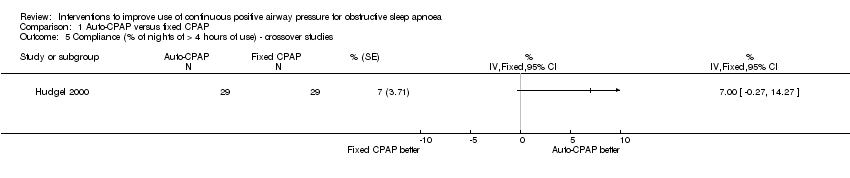
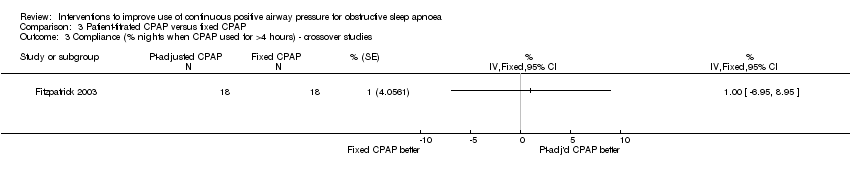
| 5 Compliance (% of nights of > 4 hours of use) ‐ crossover studies Show forest plot | 1 | | % (Fixed, 95% CI) | Totals not selected |
|
| 6 Number of participants who applied CPAP therapy >4 hrs day/5 days/week ‐ 1st arm/parallel studies Show forest plot | 1 | | Odds Ratio (M‐H, Fixed, 95% CI) | Totals not selected |
|
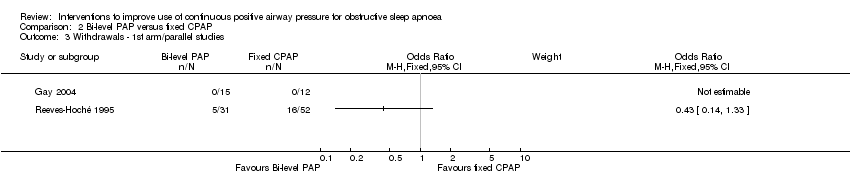
| 7 Withdrawals (Parallel group trials/first arm crossover trials) Show forest plot | 4 | 142 | Odds Ratio (M‐H, Fixed, 95% CI) | 0.59 [0.12, 2.88] |
|
| 8 Patient preference (auto CPAP/not auto CPAP) Show forest plot | 5 | | Risk Ratio (M‐H, Random, 95% CI) | Totals not selected |
|
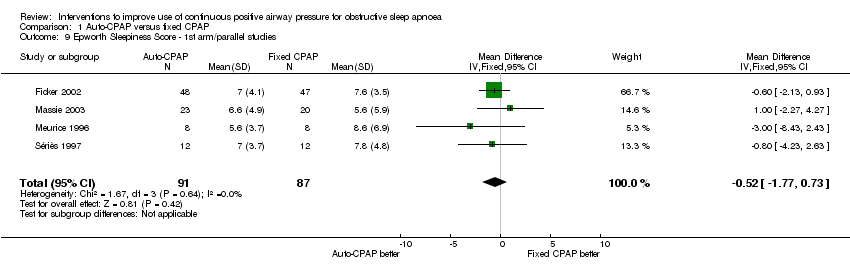
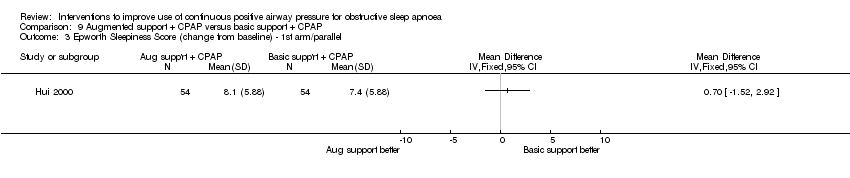
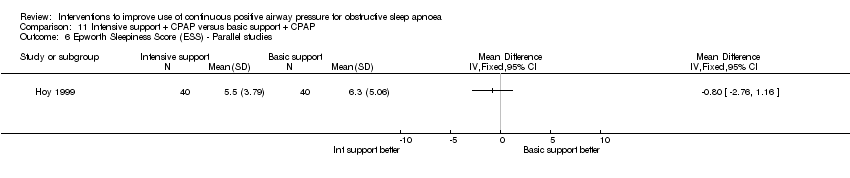
| 9 Epworth Sleepiness Score ‐ 1st arm/parallel studies Show forest plot | 4 | 178 | Mean Difference (IV, Fixed, 95% CI) | ‐0.52 [‐1.77, 0.73] |
|
| 10 Epworth Sleepiness Score ‐ crossover studies Show forest plot | 5 | 308 | ESS (Fixed, 95% CI) | ‐0.36 [‐1.67, 0.96] |
|
| 11 Arousals(events/hour) ‐ 1st arm/parallel studies Show forest plot | 1 | | Mean Difference (IV, Fixed, 95% CI) | Totals not selected |
|
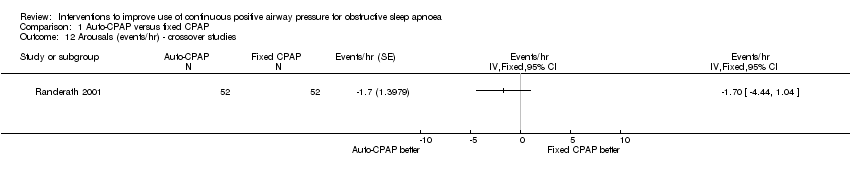
| 12 Arousals (events/hr) ‐ crossover studies Show forest plot | 1 | | Events/hr (Fixed, 95% CI) | Totals not selected |
|
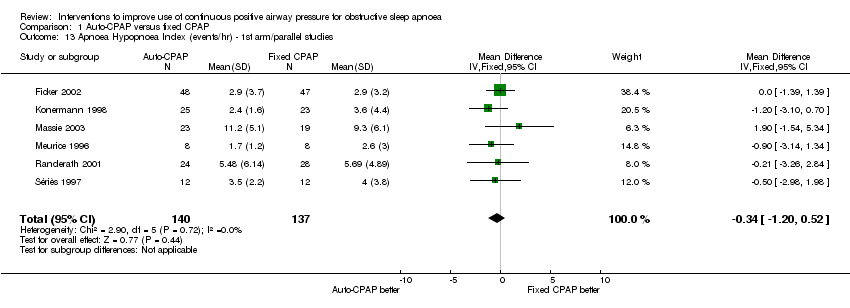
| 13 Apnoea Hypopnoea Index (events/hr) ‐ 1st arm/parallel studies Show forest plot | 6 | 277 | Mean Difference (IV, Fixed, 95% CI) | ‐0.34 [‐1.20, 0.52] |
|
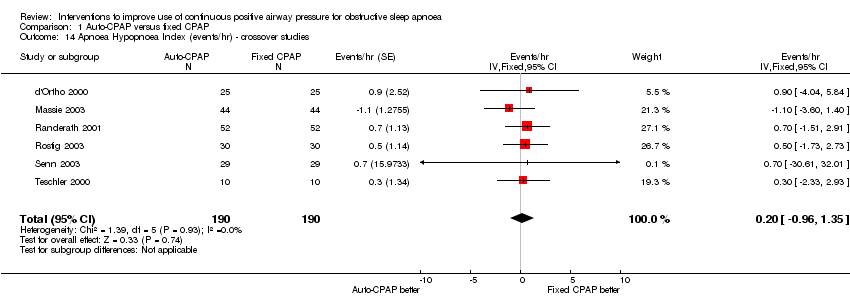
| 14 Apnoea Hypopnoea Index (events/hr) ‐ crossover studies Show forest plot | 6 | 380 | Events/hr (Fixed, 95% CI) | 0.20 [‐0.96, 1.35] |
|
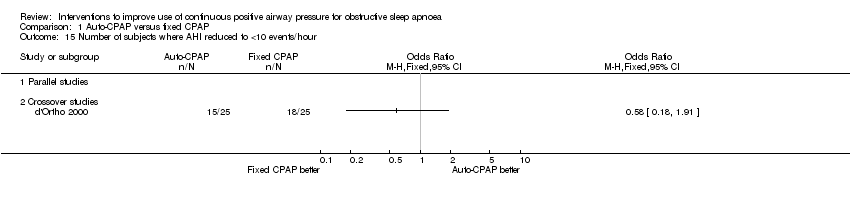
| 15 Number of subjects where AHI reduced to <10 events/hour Show forest plot | 1 | | Odds Ratio (M‐H, Fixed, 95% CI) | Totals not selected |
|
| 15.1 Parallel studies | 0 | | Odds Ratio (M‐H, Fixed, 95% CI) | 0.0 [0.0, 0.0] |
| 15.2 Crossover studies | 1 | | Odds Ratio (M‐H, Fixed, 95% CI) | 0.0 [0.0, 0.0] |
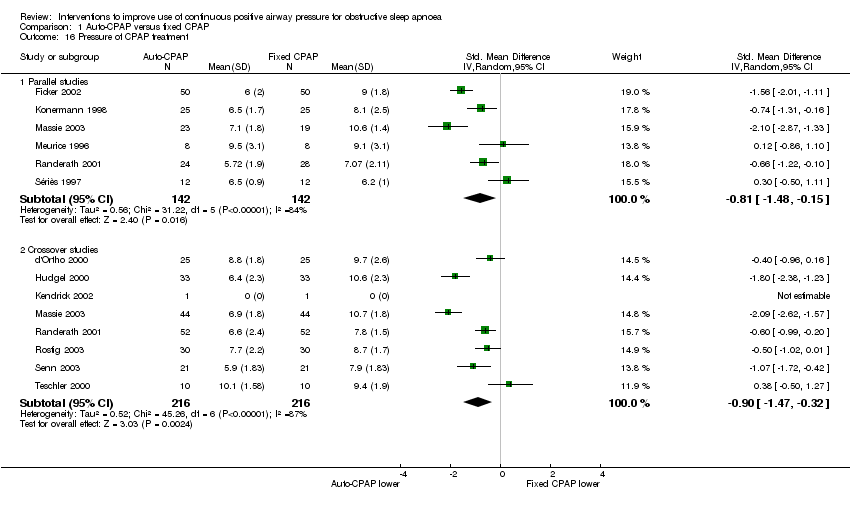
| 16 Pressure of CPAP treatment Show forest plot | 12 | | Std. Mean Difference (IV, Random, 95% CI) | Subtotals only |
|
| 16.1 Parallel studies | 6 | 284 | Std. Mean Difference (IV, Random, 95% CI) | ‐0.81 [‐1.48, ‐0.15] |
| 16.2 Crossover studies | 8 | 432 | Std. Mean Difference (IV, Random, 95% CI) | ‐0.90 [‐1.47, ‐0.32] |
| 17 Vitality (SF‐36) ‐ crossover studies Show forest plot | 3 | 148 | SF‐36 units (Fixed, 95% CI) | 3.90 [‐1.83, 9.63] |
|