Masaje de fricción transversal profundo para el tratamiento de la tendinitis lateral del codo o de la rodilla
Información
- DOI:
- https://doi.org/10.1002/14651858.CD003528.pub2Copiar DOI

- Base de datos:
-
- Cochrane Database of Systematic Reviews
- Versión publicada:
-
- 08 noviembre 2014see what's new
- Tipo:
-
- Intervention
- Etapa:
-
- Review
- Grupo Editorial Cochrane:
-
Grupo Cochrane de Salud musculoesquelética
- Copyright:
-
- Copyright © 2014 The Cochrane Collaboration. Published by John Wiley & Sons, Ltd.
Cifras del artículo
Altmetric:
Citado por:
Autores
Contributions of authors
LB and LML were responsible for writing the manuscript, extracting and analyzing data, and selecting trials for the initial review.
LML, PR and GDA performed data extraction and updated selections from the reference list, the analyses, and the interpretation of results.
PR was responsible for the literature search update.
BS, PT, GW, VW and SP contributed methodological expertise and commented on early drafts.
Sources of support
Internal sources
-
Institute for Population Health, University of Ottawa, Canada.
-
Ottawa Health Research Institute, Canada.
External sources
-
Holistic Health Research Foundation of Canada, Canada.
Declarations of interest
All the authors have no conflict of interest to declare.
Acknowledgements
The review authors thank Lisa Levesque, Shaïman Gibeault, Judith Robitaille, Michel Boudreau, Michael Saginur, and Sarah Clément for help with data extraction and literature retrieval, as well as the editorial team of the Cochrane Musculoskeletal Review Group for valuable comments on early drafts.
Version history
| Published | Title | Stage | Authors | Version |
| 2014 Nov 08 | Deep transverse friction massage for treating lateral elbow or lateral knee tendinitis | Review | Laurianne M Loew, Lucie Brosseau, Peter Tugwell, George A Wells, Vivian Welch, Beverley Shea, Stephane Poitras, Gino De Angelis, Prinon Rahman | |
| 2002 Oct 21 | Deep transverse friction massage for treating tendinitis | Review | Lucie Brosseau, Lynn Casimiro, Sarah Milne, Vivian Welch, Beverley Shea, Peter Tugwell, George A Wells | |
Differences between protocol and review
We used the "Risk of bias" tool to assess the risk of bias in included studies and presented the results in "Summary of findings" tables.
Keywords
MeSH
Medical Subject Headings (MeSH) Keywords
Medical Subject Headings Check Words
Humans;
PICO

Study flow diagram.

Risk of bias graph: review authors' judgements about each risk of bias item presented as percentages across all included studies.

Risk of bias summary: review authors' judgements about each risk of bias item for each included study.
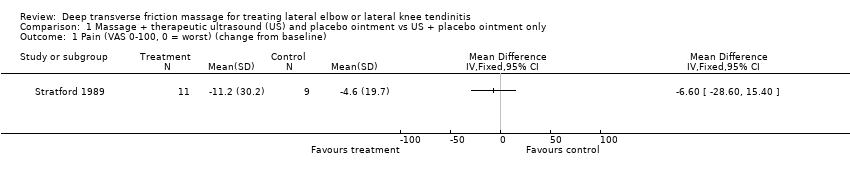
Comparison 1 Massage + therapeutic ultrasound (US) and placebo ointment vs US + placebo ointment only, Outcome 1 Pain (VAS 0‐100, 0 = worst) (change from baseline).

Comparison 1 Massage + therapeutic ultrasound (US) and placebo ointment vs US + placebo ointment only, Outcome 2 Grip strength (ratio index, higher is better).

Comparison 1 Massage + therapeutic ultrasound (US) and placebo ointment vs US + placebo ointment only, Outcome 3 Function (VAS 0‐100, 0 = worst).
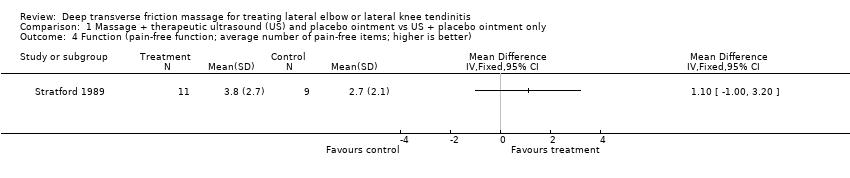
Comparison 1 Massage + therapeutic ultrasound (US) and placebo ointment vs US + placebo ointment only, Outcome 4 Function (pain‐free function; average number of pain‐free items; higher is better).

Comparison 1 Massage + therapeutic ultrasound (US) and placebo ointment vs US + placebo ointment only, Outcome 5 Functional status (number of successes to perform strengthening program).

Comparison 2 Massage + phonophoresis vs phonophoresis only, Outcome 1 Pain (VAS 0‐100, 0 = worst).

Comparison 2 Massage + phonophoresis vs phonophoresis only, Outcome 2 Grip strength (ratio index, higher is better).

Comparison 2 Massage + phonophoresis vs phonophoresis only, Outcome 3 Function (VAS 0‐100, 0 = worst).

Comparison 2 Massage + phonophoresis vs phonophoresis only, Outcome 4 Function (pain‐free function; average number of pain‐free items; higher is better).
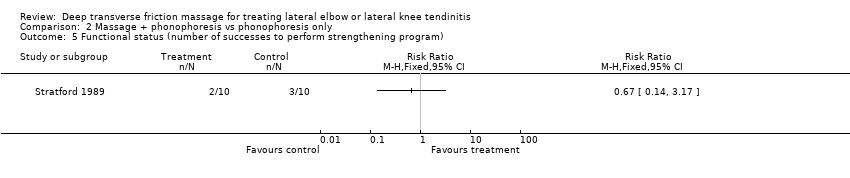
Comparison 2 Massage + phonophoresis vs phonophoresis only, Outcome 5 Functional status (number of successes to perform strengthening program).

Comparison 3 Massage + physical therapy vs physical therapy only, Outcome 1 Pain.
| Massage + therapeutic ultrasound and placebo ointment compared with ultrasound + placebo ointment only (follow‐up 2 weeks) for treating tendinitis | ||||||
| Patient or population: patients with extensor carpi radialis tendinitis | ||||||
| Outcomes | Illustrative comparative risks* (95% CI) | Relative effect | Number of participants | Quality of the evidence | Comments | |
| Assumed risk | Corresponding risk | |||||
| Control (US + placebo ointment only) | Massage + US and placebo ointment | |||||
| Pain Scale from 0 to 100 (lower is better) | Mean change in pain in the control groups was | Mean change in pain in the intervention groups was | 20 | ⊕⊝⊝⊝ | MD = ‐6.60 (‐28.60 to 15.40) Absolute improvement = ‐7% (‐29% to ‐15%) Relative percentage change = 8% (‐24% to 37%) Not statistically significant | |
| Proportion reporting pain relief of 30% or greater not measured | See comment | See comment | Not estimable | ‐ | See comment | Not measured |
| Function Scale from 0 to 100 (higher is better) | Mean function (vas 0 to 100, 0 = worst) in the control groups was | Mean function (VAS 0‐100, 0 = worst) in the intervention groups was | 20 | ⊕⊝⊝⊝ | MD = ‐1.80 (‐18.64 to 15.04) Absolute improvement = 2% (‐19% to 15%) Relative percentage change = ‐3% (‐28% to 23%) Not statistically significant | |
| Quality of life—not measured | See comment | See comment | Not estimable | ‐ | See comment | Not measured |
| Patient global assessment of success not measured | See comment | See comment | Not estimable | ‐ | See comment | Not measured |
| Adverse events not measured | See comment | See comment | Not estimable | ‐ | See comment | Not measured |
| Withdrawals due to adverse events not measured | See comment | See comment | Not estimable | ‐ | See comment | Not measured |
| *The basis for the assumed risk (e.g. median control group risk across studies) is provided in footnotes. The corresponding risk (and its 95% confidence interval) is based on the assumed risk in the comparison group and the relative effect of the intervention (and its 95% CI). | ||||||
| GRADE Working Group grades of evidence. | ||||||
| aAllocation concealment was unclear. Only assessors were blinded. Baseline imbalance was reported. | ||||||
| Massage + phonophoresis compared with control (phonophoresis only) (follow‐up 2 weeks) for treating tendinitis | ||||||
| Patient or population: patients with extensor carpi radialis tendinitis | ||||||
| Outcomes | Illustrative comparative risks* (95% CI) | Relative effect | Number of participants | Quality of the evidence | Comments | |
| Assumed risk | Corresponding risk | |||||
| Control (phonophoresis only) (follow‐up 2 weeks) | Massage + phonophoresis | |||||
| Pain Scale from 0 to 100 (lower is better) | Mean change in pain in the control groups was | Mean change in pain in the intervention groups was | 20 | ⊕⊝⊝⊝ | MD = ‐1.2 (‐20.24 to 17.84) Absolute improvement = ‐1% Relative percentage change = 6% (‐86% to 97%) Not statistically significant | |
| Proportion reporting pain relief of 30% or greater not measured | See comment | See comment | Not estimable | ‐ | See comment | Not measured |
| Function Scale from 0 to 100 (higher is better) | Mean function in the control groups was | Mean function in the intervention groups was | ‐ | 20 | ⊕⊝⊝⊝ | MD = 3.70 (‐14.13 to 21.53) Absolute improvement = 4% (‐14% to 22%) Relative percentage change = 5% (‐18% to 28%) Not statistically significant |
| Quality of life not measured | See comment | See comment | Not estimable | ‐ | See comment | Not measured |
| Patient global assessment of success not measured | See comment | See comment | Not estimable | ‐ | See comment | Not measured |
| Adverse events not measured | See comment | See comment | Not estimable | ‐ | See comment | Not measured |
| Withdrawals due to adverse events not measured | See comment | See comment | Not estimable | ‐ | See comment | Not measured |
| *The basis for the assumed risk (e.g. median control group risk across studies) is provided in footnotes. The corresponding risk (and its 95% confidence interval) is based on the assumed risk in the comparison group and the relative effect of the intervention (and its 95% CI). | ||||||
| GRADE Working Group grades of evidence. | ||||||
| aAllocation concealment was unclear. Only assessors were blinded. Baseline imbalance was reported. | ||||||
| Deep transverse friction massage + physical therapy compared with physical therapy alone | ||||||
| Patient or population: patients with iliotibial band friction syndrome (knee tendinitis) Settings: community sports injury clinic in South Africa Intervention: deep transverse massage and physical therapy Comparison: physical therapy alone | ||||||
| Outcomes | Illustrative comparative risks* (95% CI) | Relative effect | Number of participants | Quality of the evidence | Comments | |
| Assumed risk | Corresponding risk | |||||
| Control | Deep transverse massage | |||||
| Daily pain Follow‐up mean 2 | Mean daily pain | Mean daily pain in the intervention groups was | 17 | ⊕⊝⊝⊝ | MD = ‐0.4 (‐0.8 to 0) Absolute improvement = ‐4% (‐8% to 0%) Relative percentage change = ‐40% (‐80% to 0%) Not statistically significant | |
| Proportion reporting pain relief of 30% or greater not measured | See comment | See comment | Not estimable | ‐ | See comment | Not measured |
| Function not measured | See comment | See comment | Not estimable | ‐ | See comment | Not measured |
| Quality of life not measured | See comment | See comment | Not estimable | ‐ | See comment | Not measured |
| Patient global assessment not measured | See comment | See comment | Not estimable | ‐ | See comment | Not measured |
| Adverse events not measured | See comment | See comment | Not estimable | ‐ | See comment | Not measured |
| Withdrawals due to adverse events | See comment | See comment | Not estimable | ‐ | See comment | Not measured |
| *The basis for the assumed risk (e.g. median control group risk across studies) is provided in footnotes. The corresponding risk (and its 95% confidence interval) is based on the assumed risk in the comparison group and the relative effect of the intervention (and its 95% CI). | ||||||
| GRADE Working Group grades of evidence. | ||||||
| aRandomization and allocation concealment were unclear. Only assessors were blinded. No intention‐to‐treat analysis was done, and baseline imbalance was reported. | ||||||
| Inclusion | Exclusion |
| Participants/Population (P)
| Participants/Population (P)
|
| Interventions (I)
| Interventions (I)
|
| Comparisons (C) Studies were included if they compared an intervention group (eg, deep transverse frictions techniques combined with modalities, exercises) with a comparison group (eg, placebo, no treatment, active treatment such as modalities, exercises) | Comparisons (C) Studies were excluded if they did not compare the intervention group with a comparison group (eg, placebo, no treatment, active treatment such as modalities, exercises) |
| Outcomes (O)
| Outcomes (O)
|
| Period of time (P) Studies were included if the intervention period lasted longer than 1 week or 1 treatment session, with or without a follow‐up period | Period of time (P) Studies were excluded if the intervention period lasted less than 1 week or 1 treatment session |
| Study designs (S)
*English and French articles only. | Study designs (S)
|
| BMI: Body mass index. | |
| Outcome or subgroup title | No. of studies | No. of participants | Statistical method | Effect size |
| 1 Pain (VAS 0‐100, 0 = worst) (change from baseline) Show forest plot | 1 | Mean Difference (IV, Fixed, 95% CI) | Totals not selected | |
| 2 Grip strength (ratio index, higher is better) Show forest plot | 1 | Mean Difference (IV, Fixed, 95% CI) | Totals not selected | |
| 3 Function (VAS 0‐100, 0 = worst) Show forest plot | 1 | Mean Difference (IV, Fixed, 95% CI) | Totals not selected | |
| 4 Function (pain‐free function; average number of pain‐free items; higher is better) Show forest plot | 1 | Mean Difference (IV, Fixed, 95% CI) | Totals not selected | |
| 5 Functional status (number of successes to perform strengthening program) Show forest plot | 1 | Risk Ratio (M‐H, Fixed, 95% CI) | Totals not selected | |
| Outcome or subgroup title | No. of studies | No. of participants | Statistical method | Effect size |
| 1 Pain (VAS 0‐100, 0 = worst) Show forest plot | 1 | Mean Difference (IV, Fixed, 95% CI) | Totals not selected | |
| 2 Grip strength (ratio index, higher is better) Show forest plot | 1 | Mean Difference (IV, Fixed, 95% CI) | Totals not selected | |
| 3 Function (VAS 0‐100, 0 = worst) Show forest plot | 1 | Mean Difference (IV, Fixed, 95% CI) | Totals not selected | |
| 4 Function (pain‐free function; average number of pain‐free items; higher is better) Show forest plot | 1 | Mean Difference (IV, Fixed, 95% CI) | Totals not selected | |
| 5 Functional status (number of successes to perform strengthening program) Show forest plot | 1 | Risk Ratio (M‐H, Fixed, 95% CI) | Totals not selected | |
| Outcome or subgroup title | No. of studies | No. of participants | Statistical method | Effect size |
| 1 Pain Show forest plot | 1 | Mean Difference (IV, Fixed, 95% CI) | Totals not selected | |
| 1.1 Daily pain | 1 | Mean Difference (IV, Fixed, 95% CI) | 0.0 [0.0, 0.0] | |
| 1.2 Pain while running | 1 | Mean Difference (IV, Fixed, 95% CI) | 0.0 [0.0, 0.0] | |
| 1.3 % of maximum pain while running | 1 | Mean Difference (IV, Fixed, 95% CI) | 0.0 [0.0, 0.0] | |