| Electromagnetic field treatment compared to placebo for the treatment of osteoarthritis |
| Patient or population: patients with osteoarthritis
Settings: out‐patients recruited from healthcare facilities in Australia, Denmark, UK and the US
Intervention: electromagnetic field treatment
Comparison: placebo |
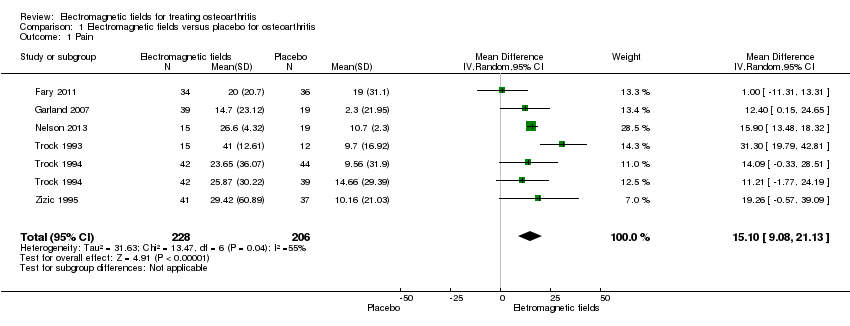
| Pain
100 mm VAS Scale from: 0 to 100 (Higher scores mean worse pain)
Follow‐up: mean 6 weeks | The mean change in pain in the control groups was 10.7 | The mean change in pain in the intervention groups was
15.10lower
(9.08 to 21.13 lower) | | 434
(6 studies) | ⊕⊕⊕⊝
moderate1 | MD 15.10 (95% CI 9.08 to 21.13) Absolute risk difference: 15% (95% CI 9.08% to 21.13%) Relative per cent change: 21.03% (95% CI 12.65% to 29.43%) NNT: 2 (95% CI 1 to 6) |
| Physical function WOMAC function Scale from: 0 to 100 (Higher scores mean more severe limitation)
Follow‐up: mean 3 months | The mean change in physical function in the control groups was
1.7 | The mean change in physical function in the intervention groups was
4.55lower
(2.23 lower to 11.32 higher) | | 197
(3 studies) | ⊕⊕⊝⊝
low2 | MD 4.55 (95% CI ‐2.23 to 11.32) Absolute risk difference: 4.55% (95% CI ‐2.23% to 11.32%) Relative per cent change: 268% (95% CI ‐131% to 666%) NNT: not statistically significant |
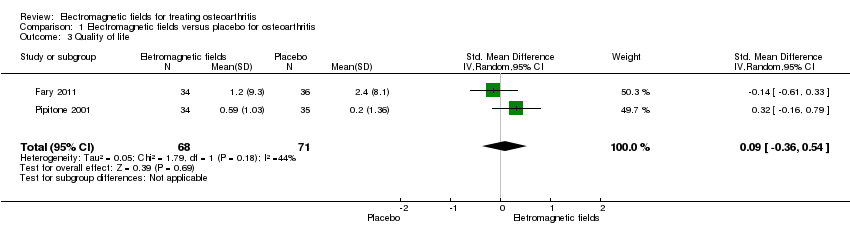
| Quality of life SF‐36 item Scale from: 0 to 100 (Lower scores mean worse quality) Follow‐up: mean 16 weeks | The mean change in quality of life in the control groups was
2.4 | The mean change in quality of life in the intervention groups was
0.09 lower
(0.36 lower to 0.54 higher) | | 145
(2 studies) | ⊕⊕⊕⊝
moderate3 | SMD 0.09 (95% CI ‐0.36 to 0.54) Absolute risk difference: 1% (95% CI ‐2.92% to 4.37%) Relative per cent change: 30.38% (95% CI ‐121.5% to 182.25%) NNT: not statistically significant |
| Radiographic progression Bone scintigraphic examinations Follow‐up: mean 2.5 months | See comment | See comment | Not estimable | 78
(1 study) | See comment | No related data were available |
| Number of patients experiencing any adverse event Follow‐up: mean 1 month | 167 per 1000 | 195 per 1000
(120 to 320) | RR 1.17
(0.72 to 1.92) | 288
(4 studies) | ⊕⊕⊕⊝
moderate4 | Absolute risk difference: 3% (95% CI ‐6% to 12%) Relative per cent change: 17% (95% CI ‐28% to 92%) NNT: not statistically significant |
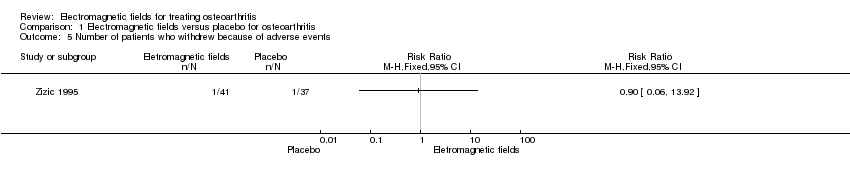
| Number of patients who withdrew because of adverse events Follow‐up: mean 6 months | 27 per 1000 | 24 per 1000 (2 to 376) | RR 0.90 (0.06 to 13.92) | 78
(1 study) | ⊕⊕⊝⊝
low5 | Only 1 study: 1 participant withdrew from each group because of adverse skin reactions unrelated to the therapy |
| *The basis for the assumed risk (e.g. the median control group risk across studies) is provided in footnotes. The corresponding risk (and its 95% confidence interval) is based on the assumed risk in the comparison group and the relative effect of the intervention (and its 95% CI).
CI: confidence interval; MD: mean difference; NNT: number needed to treat; RR: risk ratio; VAS: visual analogue scale;WOMAC: Western Ontario and McMaster Universities osteoarthritis index |
| GRADE Working Group grades of evidence
High quality: Further research is very unlikely to change our confidence in the estimate of effect.
Moderate quality: Further research is likely to have an important impact on our confidence in the estimate of effect and may change the estimate.
Low quality: Further research is very likely to have an important impact on our confidence in the estimate of effect and is likely to change the estimate.
Very low quality: We are very uncertain about the estimate. |