変形性関節炎治療における電磁場療法
アブストラクト
背景
本システマティック・レビューは2002年発表のレビューの更新である。変形性関節炎は滑膜関節に影響を与える疾患で、硝子軟骨および軟骨下骨に変成や崩壊を引き起こす。電磁場療法は、現在では理学療法士によって行われており、骨および軟骨の成長や修復を促進する可能性がある。これは、ウォルフの法則、圧電効果、および流動電位の概念などの物理学の原則に基づいている。
目的
変形性関節炎の治療に対する電磁場の有効性および有害性を、プラセボまたはシャムと比較して評価すること。
検索戦略
Cochrane Central Register of Controlled Trials(CENTRAL)(コクラン・ライブラリ 2013年9号)、PreMEDLINE(1966年以前に発表された試験)、MEDLINE(1966年~2013年10月)、CINAHLおよびPEDro(2013年10月まで)を検索した。電子検索を補うためハンドサーチによる検索も行った。
選択基準
変形性関節炎に対する電磁場について調べたランダム化比較試験(RCT)で、治療期間が4週間以上のもの。あらゆる言語の論文を対象とした。
データ収集と分析
2名のレビュー著者が独立して本レビューで扱った研究を評価し、意見の相違については3人目の著者との合意により解決した。事前に開発したデータ抽出フォームを用いて、データを抽出した。同じレビュー著者らが、コクランのバイアスのリスクツールを用いて、試験のバイアスのリスクを独立して評価した。Rheumatology Clinical Trials(OMERACT)ガイドラインのアウトカム指標に基づき、変形性関節炎に関するアウトカムを出版物から入手した。連続的なアウトカム指標の結果を、95%信頼区間(CI)を伴う平均差(MD)または標準化平均差(SMD)として表した。リスク比(RR)を用いて二値アウトカム指標を統合し、治療必要数(NNT)を算出した。
主な結果
合計636例の変形性関節炎を伴う参加者を対象とした9件の研究を選択し、このうち6件を本レビューの更新に追記した。研究のデザインと実施に関する報告が不十分であるため、全9件の研究で選択的なアウトカム報告が不明であった。また、3件の研究ではアウトカムデータが不完全であるため、バイアスのリスクが高かった。その他の分野に関して、9件の研究の総バイアスのリスクは低かった。
4~26週間の治療後に、0~100点で疼痛を評価したところ、プラセボ群と比較して電磁場療法にランダム化された参加者では、15.10点分多く疼痛緩和がみられた(MD 15.10、95% CI 9.08~21.13;絶対改善度15%)。12~26週間の治療後に、Western Ontario and McMaster Universities osteoarthritis index(WOMAC)を用いて0~100点で身体機能を評価したところ、電磁場療法は統計学的に有意な効果を示さなかった(MD 4.55、 95% CI ‐2.23~11.32;絶対改善度4.55%)。また、4~6週間の治療後に、SF‐36を用いて0~100点でQOLを評価したところ、統計学的な有意差はみられなかった(SMD 0.09、 95% CI ‐0.36~0.54;絶対改善度0.09%)。X線像の変化の解析に利用できるデータはなかった。288例に上る参加者を対象にした4件の試験で安全性を評価した。4~12週間の治療後で、プラセボと比較して有害事象の発生に差はなかった(RR 1.17、95% CI 0.72~1.92)。4週間の治療後で、有害事象により試験を中止した参加者数(1件の試験で測定)に差はなかった(RR 0.90、95% CI 0.06~13.92)。重篤な有害事象を発現した参加者はいなかった。
著者の結論
現在のエビデンスでは、電磁場療法が変形性関節炎における疼痛緩和に中等度の効果をもたらす可能性があることを示唆している。本療法が身体機能とQOLに関して臨床的に重要な効果をもたらすのかを裏付けるには、さらなる研究が必要である。2002年に実施した前回のレビューから変化はないと結論づける。
PICO
一般語訳
変形性関節炎治療における電磁場療法
レビューの論点
本レビューでは変形性関節炎に対する電磁場の効果を対象とした。636例を対象とした9件の研究を見出した。
背景:変形性関節炎や電磁場とは何か?
変形性関節炎はもっともよくみられる関節炎で、手、腰、肩、および膝に影響がみられることがある。変形性関節炎では、骨の両端を保護する軟骨が崩壊し、痛みや腫れを引き起こす。
電磁場は物を磁石に引きつける目に見えない力である。この目に見えない引力は電流を使って発生させることができ、関節周囲の軟骨に作用する可能性がある。変形性関節炎において、電磁場は電流を用いる療法の一種であり、関節周囲の皮膚に当てる。小型の機械やマットを使用して、全身または関節に電磁場を照射する。本療法は医師や理学療法士が実施することもあるが、自宅で機械を使って行うこともできる。
研究の特性
2013年10月までの関連性のあるあらゆる研究を検索し、変形性関節炎の成人636例を対象として、4~26週間にわたり、シャム治療(偽治療)と比較して電磁場療法の効果を調査した9件の研究を見出した。
主な結果
痛み(0~100点;点数が高いほど痛みが強いまたは激しい)
-電磁場はおそらく変形性関節炎の痛みを和らげると考えられる。
-電磁場療法を受けた人では、偽の治療を受けた人と比較して15点分多く痛みが緩和した(15%の改善)。
-電磁場療法を受けた人では、痛みの評価が26点(スケール:0‐100)低くなった。
-偽の治療を受けた人では、痛みの評価が11点(スケール:0‐100)低くなった。
身体機能
-電磁場は身体機能を改善する可能性があるが、偶然起きる場合もある。
総合的な健康とウェルビーイング(幸福)
-電磁場は、おそらく総合的な健康とウェルビーイング(幸福)に影響を与えない。
副作用
-おそらく、電磁場が副作用を与えたり、副作用で本療法を中止したりすることはないと考えられるが、こうしたことが偶然起きる場合もある。
副作用や合併症に関する正確な情報はない。特に、まれではあるが重篤な副作用に関する情報がない。起こりうる副作用は皮膚発疹と痛みの悪化である。
X線の変化
電磁場による変形性関節炎の改善がX線で認められるかについては、情報が得られなかった。
エビデンスの質
-電磁場は、おそらく痛みを改善し、総合的な健康とウェルビーイング(幸福)や、副作用には影響を与えないと考えられる。この見解はさらなる研究によって変わることもある。
-電磁場は身体機能を改善する可能性がある。この見解はさらなる研究によって変わる可能性が非常に高い。
Authors' conclusions
Summary of findings
| Electromagnetic field treatment compared to placebo for the treatment of osteoarthritis | ||||||
| Patient or population: patients with osteoarthritis | ||||||
| Outcomes | Illustrative comparative risks* (95% CI) | Relative effect | No of participants | Quality of the evidence | Comments | |
| Assumed risk | Corresponding risk | |||||
| Placebo | Electromagnetic field treatment | |||||
| Pain Scale from: 0 to 100 (Higher scores mean worse pain) | The mean change in pain in the control groups was 10.7 | The mean change in pain in the intervention groups was | 434 | ⊕⊕⊕⊝ | MD 15.10 (95% CI 9.08 to 21.13) Absolute risk difference: 15% (95% CI 9.08% to 21.13%) Relative per cent change: 21.03% (95% CI 12.65% to 29.43%) NNT: 2 (95% CI 1 to 6) | |
| Physical function WOMAC function Scale from: 0 to 100 (Higher scores mean more severe limitation) | The mean change in physical function in the control groups was | The mean change in physical function in the intervention groups was | 197 | ⊕⊕⊝⊝ | MD 4.55 (95% CI ‐2.23 to 11.32) Absolute risk difference: 4.55% (95% CI ‐2.23% to 11.32%) Relative per cent change: 268% (95% CI ‐131% to 666%) NNT: not statistically significant | |
| Quality of life SF‐36 item Scale from: 0 to 100 (Lower scores mean worse quality) Follow‐up: mean 16 weeks | The mean change in quality of life in the control groups was | The mean change in quality of life in the intervention groups was | 145 | ⊕⊕⊕⊝ | SMD 0.09 (95% CI ‐0.36 to 0.54) Absolute risk difference: 1% (95% CI ‐2.92% to 4.37%) Relative per cent change: 30.38% (95% CI ‐121.5% to 182.25%) NNT: not statistically significant | |
| Radiographic progression Bone scintigraphic examinations Follow‐up: mean 2.5 months | See comment | See comment | Not estimable | 78 | See comment | No related data were available |
| Number of patients experiencing any adverse event Follow‐up: mean 1 month | 167 per 1000 | 195 per 1000 | RR 1.17 | 288 | ⊕⊕⊕⊝ | Absolute risk difference: 3% (95% CI ‐6% to 12%) Relative per cent change: 17% (95% CI ‐28% to 92%) NNT: not statistically significant |
| Number of patients who withdrew because of adverse events Follow‐up: mean 6 months | 27 per 1000 | 24 per 1000 (2 to 376) | RR 0.90 (0.06 to 13.92) | 78 | ⊕⊕⊝⊝ | Only 1 study: 1 participant withdrew from each group because of adverse skin reactions unrelated to the therapy |
| *The basis for the assumed risk (e.g. the median control group risk across studies) is provided in footnotes. The corresponding risk (and its 95% confidence interval) is based on the assumed risk in the comparison group and the relative effect of the intervention (and its 95% CI). | ||||||
| GRADE Working Group grades of evidence | ||||||
| 1Downgraded for moderate heterogeneity (I2 = 55%); unclear risk for random sequence generation (Zizic 1995), allocation concealment (Zizic 1995), blinding of outcome assessors (Fary 2011; Nelson 2013; Zizic 1995), selective reporting (all six studies) and high risk for incomplete outcome data (Zizic 1995). | ||||||
Background
Description of the condition
Osteoarthritis is a progressive rheumatic disease which occurs most commonly in older populations. It is becoming increasingly common due to the ageing population in many societies. The degeneration and eventual loss of articular cartilage causes changes in periarticular bone, synovial tissue and other periarticular soft tissue structures such as ligaments and muscles. This causes the pain, swelling, tenderness and stiffness that characterise osteoarthritis, especially in the weight‐bearing joints of the lower extremities.
Description of the intervention
Current osteoarthritis treatment options include pharmacological and non‐pharmacological procedures to decrease progression and treat the pain associated with this condition. They include:
-
oral pharmacological medications: analgesics such as acetaminophen, aspirin, non‐steroidal anti‐inflammatory drugs (NSAIDs); symptomatic slow‐acting drugs for osteoarthritis (SYSADOA) such as glucosamine sulphate (Towheed 2005), diacerein (Fidelix 2006) and the non‐saponifiable oils of avocado and soya; and the newer disease‐modifying osteoarthritis drugs (DMOAD);
-
topical therapies (applied as gels or creams), including NSAIDs and capsaicin;
-
intra‐articular therapies, including corticosteroid and hyaluronic acid injections (Bellamy 2006a; Bellamy 2006b);
-
non‐pharmacological therapies, including aquatic exercise therapy (Bartels 2007), balneotherapy (Verhagen 2007), physical therapy (Rutjes 2010), occupational therapy, strengthening exercises (Fransen 2008; Fransen 2009), wedged insoles and braces and orthoses (Brouwer 2005); and
-
surgical treatment: joint replacement (Singh 2013a; Singh 2013b) and arthroscopic debridement (Laupattarakasem 2008) of the affected joint.
Management of osteoarthritis of the knee aims to relieve pain, maintain or improve mobility, and minimise disability. However, these goals are seldom achieved through drug therapy alone, as many treatments are ineffective or lead to serious adverse effects, including the potentially lethal complications encountered with selective NSAIDS (Blower 1996). Different modalities in physiotherapy have been shown to help improve clinical symptoms and function in knee osteoarthritis, generally with fewer adverse effects than medical treatment (Brosseau 2003; Rutjes 2010). Electromagnetic fields are among these non‐invasive therapies, already considered a proven adjunct therapy for delayed union fractures (Bassett 1974). Interest in electromagnetic field stimulation began after observing that physical stress on bone causes the appearance of tiny electric currents called piezoelectric potentials that are thought to act as the transduction signals to promote bone formation. In vitro studies showed that chondrocyte proliferation and matrix synthesis are significantly enhanced by pulsed electromagnetic field stimulation (De Mattei 2001; De Mattei 2003; De Mattei 2004; Fioravanti 2002; Pezzetti 1999). A number of multicentric randomised and double‐blind clinical trials have been carried out with promising results (Fini 2005).
Electromagnetic fields can be delivered to biological systems by the direct placement of an electrode or non‐invasively by two means:
-
capacitive coupling, in which opposing electrodes are placed within a conducting medium, that is, in contact with the skin surface overlying a target tissue (e.g. bone, joint, wound);
-
inductive coupling, in which a time‐varying pulsed electromagnetic field induces an electrical current in the target tissue. This technique does not require direct contact with the skin or biological system.
Although the former relies on direct application of an electrical field rather than creating induced current through magnetic impulses, they act by the same mechanism. Thus both pulsed electromagnetic fields and pulsed electrical stimulation are considered electromagnetic field interventions in this update.
How the intervention might work
Three basic principles of physics are proposed to explain how electromagnetic fields may promote the growth and repair of bone and cartilage: Wolff's Law, the piezoelectric effect and the concept of streaming potentials (Shupak 2003).
Electromagnetic field stimulation first garnered interest as treatment for osteoarthritis following the discovery of evidence that stimulation of chondrocytes increased the synthesis of the major component of the cartilage matrix, known as proteoglycans (Aaron 1993). Experimental studies suggest that electromagnetic fields may interact with ligands on the chondrocyte cell surface membrane, potentially leading to changes in internal calcium concentrations which trigger proteoglycan synthesis (Graziana 1990; Lee 1993).
Electromagnetic field treatments might also help to preserve extracellular matrix integrity in the early stages of osteoarthritis by down‐regulating proteoglycan production and degradation (Ciombor 2001; Liu 1997) and by increasing chondrocyte DNA replication and cell proliferation (Pezzetti 1999; Rodan 1978).
Through these improvements in bone and cartilage maintenance and repair, pulsed electromagnetic field stimulation could influence the osteoarthritic disease process by decreasing inflammation and providing temporary relief from pain (Darendeliler 1997; Lee 1997; Trock 2000).
Why it is important to do this review
Electromagnetic field therapy is already being widely used for the management of joint pain associated with osteoarthritis and has a promising theoretical basis for clinical application. Clinical trials evaluating its therapeutic effectiveness have been conducted recently, but with inconsistent results. A 2002 Cochrane review suggested that pulsed electromagnetic field therapy led to improvements in all measurements for knee osteoarthritis, but concluded that further studies were required to confirm whether the statistically significant results shown in these trials conferred important benefits to patients (Hulme 2002). The optimal frequency, duration and intensity of electromagnetic fields for osteoarthritis were also yet to be determined. This update of the 2002 review will include new clinical studies which have since been published.
Objectives
To assess the benefits and harms of electromagnetic fields for the treatment of osteoarthritis as compared to placebo or sham.
Methods
Criteria for considering studies for this review
Types of studies
Randomised controlled trials or quasi‐randomised trials which examined the effects of electromagnetic fields for treating osteoarthritis, with four or more weeks treatment duration.
Types of participants
Participants over 18 years of age, with clinical or radiological confirmation of the diagnosis (or both) were considered. The diagnosis of osteoarthritis was defined using the American College of Rheumatology (ACR) criteria for classification of osteoarthritis (Altman 1986; Altman 1997). We excluded trials where participants had received any previous surgical intervention for the treatment of osteoarthritis.
Types of interventions
All types of pulsed electromagnetic fields and pulsed electrical stimulation were included. Trials that compared the intervention group using electromagnetic fields to usual care were included, as well as placebo‐controlled studies.
Types of outcome measures
The primary measure of effectiveness was pain relief, as suggested by the third Outcome Measures in Rheumatology (OMERACT) conference (Bellamy 1997). We included the other outcomes from this conference for analysis. According to OMERACT 3 (Bellamy 1997) (last reviewed in OMERACT 6) (Pham 2003) standardised, validated instruments, such as visual analogue scales (VAS) (Carlsson 1983) and the Western Ontario and McMaster Universities osteoarthritis index (WOMAC) scale for pain (Bellamy 1988) and the Lequesne Functional Severity Index (Lequesne 1987), should be used to evaluate these outcomes.
Major outcomes
-
Pain
-
Physical function
-
Health‐related quality of life measure
-
Radiographic joint structure changes
-
Number of patients experiencing any adverse event
-
Patients who withdrew because of adverse events
-
Patients experiencing any serious adverse event
Search methods for identification of studies
Electronic searches
We identified relevant studies by searching the Cochrane Central Register of Controlled Trials (CENTRAL) (The Cochrane Library 2013, Issue 9), PreMEDLINE for trials published before 1966, MEDLINE from 1966 to October 2013, CINAHL and PEDro up to and including October 2013. We used the search strategies recommended in the Cochrane Handbook for Systematic Reviews of Interventions (Higgins 2011). Details of the search strategy can be found in the following appendices: MEDLINE (Appendix 1), CINAHL (Appendix 2), EMBASE (Appendix 3), CENTRAL (Appendix 4) and PEDro (Appendix 5).
Searching other resources
We complemented the electronic searches with handsearching:
-
bibliographic references; and
-
abstracts published in special issues of specialised journals or in conference proceedings (American Orthopaedic Physicians Annual Meeting; Asia‐Pacific Orthopedic Society for Sports Medicine Meeting).
We contacted the Trial Search Co‐ordinators of the Cochrane Rehabilitation and Related Therapies Field and the Cochrane Musculoskeletal Group.
We manually searched conference proceedings, used the Science Citation Index to retrieve reports citing relevant articles, contacted content experts and trialists, and screened the references of all articles obtained, including related reviews. We did not use abstracts if additional data could not be obtained.
Finally, we searched several clinical trial registries (www.clinicaltrials.gov, http://www.controlled‐trials.com, http://www.anzctr.org.au/, www.umin.ac.jp/ctr) to identify ongoing trials.
The last update of the manual search was conducted on 3 October 2013.
Data collection and analysis
Selection of studies
Two review authors (SL and BY) independently screened the abstract, keywords and publication type of all publications obtained from the searches described. We obtained all studies which might be eligible RCTs, or quasi‐RCTs, in full and independently assessed these. The two review authors independently selected trials according to the selection criteria.
When necessary, we sought information from the authors of the primary studies.
Data extraction and management
Two review authors (SL, BY) extracted data using a standard, pre‐developed form that we pilot‐tested. We extracted details of trial design, patient characteristics, treatment duration and the mechanics of the electromagnetic field device used, and established baseline and end of study outcomes. We resolved differences in data extraction by referring back to the original article and by establishing consensus. A third review author (CH or JH) was consulted to help resolve differences. Where the method of randomisation or allocation concealment was not clearly described, or where data were missing, we contacted the authors of the study to clarify the issues.
Assessment of risk of bias in included studies
The review authors assessed the risk of bias in the included studies using The Cochrane Collaboration 'Risk of bias' tool (Higgins 2011). We considered six domains: random sequence generation, allocation concealment, blinding of participants and personnel, blinding of outcome assessors, selective outcome reporting and incomplete outcome reporting. We expressed the judgements simply as 'low risk', 'high risk' or 'unclear risk' of bias.
We assessed two components of randomisation: generation of allocation sequence and concealment of allocation. We considered the generation of sequence adequate if it resulted in an unpredictable allocation schedule; mechanisms considered adequate included random number tables, computer‐generated random numbers, minimisation, coin tossing, shuffling cards and drawing lots. We considered trials using an unpredictable allocation sequence to be randomised. We considered trials using potentially predictable allocation mechanisms, such as alternation or the allocation of patients according to date of birth, to be quasi‐randomised.
We considered concealment of allocation adequate if both the patients and the investigators responsible for patient selection were unable to predict allocation to treatment or placebo groups. Adequate concealment included central randomisation and sequentially numbered, sealed, opaque envelopes.
Since the primary measure of effectiveness was patient‐reported pain relief, we considered blinding of patients adequate if experimental and control preparations were explicitly described as indistinguishable or if a double‐dummy technique was used.
We considered analyses adequate if all randomised patients were included in the analysis according to the intention‐to‐treat principle. We further assessed the reporting of major outcomes.
Measures of treatment effect
For continuous data, we presented results as a mean difference (MD). However, where different scales were used to measure the same concept or outcome, we used standardised mean difference (SMD). For dichotomous data, we used risk ratio (RR) (Hennekens 1987; Petitti 2000). Only if a comparison resulted in a statistically significant difference and baseline values were reported did we calculate the clinical relevance, i.e. the number need to treat to benefit (NNTB) or harm (NNTH).
Unit of analysis issues
If we identified cross‐over trials presenting continuous outcome data which precluded paired analysis, we did not plan to include these data in a meta‐analysis to avoid unit of analysis error. Where carry‐over effects were thought to exist, and sufficient data existed, we planned to include only data from the first period in the analysis (Higgins 2011).
Dealing with missing data
We contacted the study investigators for missing data via email. Where possible, the analyses were based on intention‐to‐treat data from individual clinical trials.
Assessment of heterogeneity
We assessed statistical heterogeneity by examining the I2 statistic (Higgins 2011), a quantity that describes approximately the proportion of variation in point estimates due to heterogeneity rather than sampling error. If considerable between‐group statistical heterogeneity was detected (i.e. an I2 value of more than 75%), we explored the causes of heterogeneity (Higgins 2011). In addition, we employed the Chi2 test of homogeneity to determine the strength of evidence that the heterogeneity is genuine. We considered heterogeneity significant when the probability (P value) was < 0.10.
Assessment of reporting biases
We planned to assess reporting bias by screening the clinical trials register at the International Clinical Trials Registry Platform of the World Health Organization (http://apps.who.int/trialsearch/) (De Angelis 2004) to determine whether the protocol for each RCT was published before recruitment of patients for the study was started. Furthermore, we planned a comparison between the fixed‐effect estimate and the random‐effects estimate, as well as a funnel plot if data were available, in order to assess for the possible presence of small sample bias and reporting bias, respectively.
Data synthesis
We planned to pool clinically homogeneous studies using the fixed‐effect model for meta‐analysis. When there was important heterogeneity (I2 > 25%), we pooled studies using the random‐effects model for meta‐analysis.
Subgroup analysis and investigation of heterogeneity
We planned to conduct subgroup analysis to examine the efficacy of electromagnetic fields with different application methods and modalities, including frequency, length of treatment and different techniques, if data were available.
Sensitivity analysis
We conducted a sensitivity analysis based on the methodological quality of each trial. We undertook sensitivity analyses to explore the impact of studies with poor ratings for domains described in the 'Risk of bias' table. We planned a priori sensitivity analyses for:
-
concealment of allocation;
-
blinding of outcome assessors;
-
extent of drop‐outs (we considered 20% as a cut‐point).
'Summary of findings' table
We presented key findings in a 'Summary of findings' table. These included the magnitude of effect of the interventions examined, the sum of available data on the main outcomes and the quality of the evidence.
For dichotomous outcomes, we calculated the absolute risk difference using the risk difference (RD) statistic in RevMan (RevMan 2012) (RR ‐ 1 calculated the weighted relative per cent change). We calculated the number needed to treat to benefit (NNTB) or to harm (NNTH) from the control group event rate (unless the population event rate was known) and the risk ratio using the Visual Rx NNT calculator (Cates 2004).
For continuous outcomes, we calculated the absolute benefit as the improvement in the treatment group (follow‐up mean minus baseline mean) less the improvement in the control group (follow‐up mean minus baseline mean). We calculated the relative difference in the change from baseline as the absolute benefit divided by the baseline mean of the control group. We calculated NNTB or NNTH using the Wells calculator software available at the CMSG editorial office. We determined the minimal clinically important difference (MCID) for each outcome for input into the calculator.
We used GRADE to describe the quality of the overall body of evidence (Guyatt 2008; Higgins 2011), defined as the extent of confidence in the estimates of treatment benefits and harms. The GRADE approach specifies four levels of quality (high, moderate, low and very low).
Results
Description of studies
Results of the search
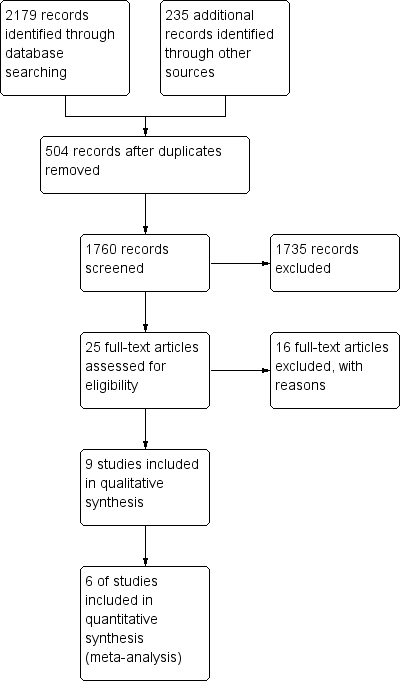
The search strategies retrieved 2037 articles (Figure 1). The literature search identified 25 potentially relevant articles. Of these, only nine studies met the inclusion criteria (Fary 2011; Garland 2007; Nelson 2013; Nicolakis 2002; Pipitone 2001; Thamsborg 2005; Trock 1993; Trock 1994; Zizic 1995) (see Characteristics of included studies table). Sixteen studies were excluded for the reasons given in the Characteristics of excluded studies table (Alcidi 2007; Ay 2009; Battisti 2004; Danao‐Camara 2001; Fischer 2005; Fischer 2006; Hinman 2002; Jack 2006; Jacobson 2001; Kulcu 2009; Liu 2004; Ozgüçlü 2010; Pavlović 2012; Rigato 2002; Sutbeyaz 2006; Tomruk 2007).

Study flow diagram.
Included studies
The eligible RCTs collectively involved 327 participants in active electromagnetic field treatment groups and 309 participants in placebo groups.
Six trials used pulsed electromagnetic fields (Nelson 2013; Nicolakis 2002; Pipitone 2001; Thamsborg 2005; Trock 1993; Trock 1994) while three studies (Fary 2011; Garland 2007; Zizic 1995) used pulsed electrical stimulation.
One study used a pulsed electromagnetic field signal consisting of a 7 ms burst of 6.8 MHz sinusoidal waves repeating at one burst/s and delivering a peak induced electrical field of 34 ± 8 V/m in the knee from a portable battery‐operated device (Palermo, Ivivi Health Sciences, LLC, San Francisco, CA). Patients were treated for 15 minutes twice daily for 42 days (Nelson 2013).
Another study reviewed a pulsed electromagnetic field device (Medicur) that generates pulses of magnetic energy via a soft iron core treated with 62 trace elements. Pulses are selected at base frequencies of 3 Hz, 7.8 Hz and 20 Hz and have a rise time of 1 μs, a low magnetic output (< 0.5 gauss) and a range of activity of up to 30 cm around the unit. The Medicur device runs on batteries, requires no wires or electrodes, and only needs to be held close to the area to be treated. Patients were treated for 30 minutes per session three times a day for six weeks (Pipitone 2001).
In one study a pulsed electromagnetic field was administered to the whole body using a mat which produced a field from 1 Hz to 3000 Hz with a mean intensity of 40 μT (wave ranger professional, program 12, Mediscan GmbH, Bad Haller Straße34, 4500 Kremsmünster, Austria). The frequency of the pulsed electromagnetic field ranged from 1 Hz to 3000 Hz. Patients lay on the mat for 30 minutes per session twice a day for six weeks (Nicolakis 2002).
A fourth study measured the effect of a pulse generator that yields G50V in 50 Hz pulses, changing voltage at 3 ms intervals. This results in a maximal electrical gradient of 1 to 100 mV/cm as sensed by charged particles in the tissue, depending on the distance from the coils. As a result of this current, the coils become slightly warmer than the surroundings after 30 minutes (28 to 35 °C). Treatment was given for two hours daily, five days per week for six weeks (Thamsborg 2005).
Two other trials used a non‐contact device that delivered three signals in a stepwise fashion, ranging from 5 Hz to 12 Hz frequency at 10 G to 25 G of magnetic energy (Trock 1993; Trock 1994). These studies exposed the affected knee to nine hours of stimulation over a one‐month period.
In one study a commercially available TENS stimulator (Metron Digi‐10s) was modified by a biomedical engineer to deliver pulsed electrical stimulation current parameters as follows: pulsed, asymmetrically biphasic, exponentially decreasing waveform with a frequency of 100 Hz and pulse width of 4 ms. Current was delivered via 120 mm x 80 mm multiple‐use conductive silicone electrodes inserted into larger calico pockets. The participants were asked to wear the device seven hours daily, preferably overnight, for 26 weeks (Fary 2011).
Two other pulsed electrical stimulation studies used a pulsed electrical device to deliver a 100 Hz low‐amplitude signal to the knee joint via skin surface electrodes. The patients were exposed for 6 to 14 hours a day for three months and 6 to 10 hours a day for four weeks, respectively (Garland 2007; Zizic 1995).
All studies reported on patients with knee osteoarthritis and Trock 1994 also included patients with cervical osteoarthritis, with their results reported separately. The main outcome measures related to pain (Fary 2011; Garland 2007; Nelson 2013; Nicolakis 2002; Pipitone 2001; Thamsborg 2005; Trock 1993; Trock 1994; Zizic 1995). The major outcomes were assessed using the WOMAC osteoarthritis index: severity of joint pain, stiffness and limitation of physical function (Garland 2007; Nicolakis 2002; Pipitone 2001; Thamsborg 2005), ability to conduct activities of daily living (ADL) in terms of pain or difficulty (Trock 1993; Trock 1994), joint pain on motion (Trock 1993; Trock 1994), patient's overall assessment (Garland 2007; Trock 1994), patient evaluation of function (Zizic 1995) and physician's global assessment (Trock 1993; Trock 1994; Zizic 1995). The UK 36‐item short form of the Medical Outcomes Study (SF‐36) and the EuroQol (Euro‐Quality of Life, EQ‐5D) were also considered (Pipitone 2001).
Excluded studies
We excluded nine RCTs with a shorter duration than four weeks since this time frame may be too short to assess harms and benefits based on biological plausibility (Alcidi 2007; Ay 2009; Battisti 2004; Jacobson 2001; Kulcu 2009; Liu 2004; Ozgüçlü 2010; Pavlović 2012; Sutbeyaz 2006;Tomruk 2007). We excluded one RCT because it included patients with cervical spondylosis and shoulder periarthritis without separately reporting results and we could not extract data on cervical osteoarthritis (Rigato 2002). We excluded four other studies because they were not RCTs (Danao‐Camara 2001; Fischer 2005; Fischer 2006; Jack 2006). We excluded one study because the aim of the study was to assess the effect of static magnetic fields for chronic knee pain but not specifically for osteoarthritis (Hinman 2002). We excluded one study because the treatment period was only 10 days (Pavlović 2012).
Risk of bias in included studies
Two review authors (SL, BY) assessed risk of bias independently. Differences were resolved by consensus with a third review author (DZ).
The overall assessment of the methodological quality of the trials in this review was as follows: we judged seven studies (Fary 2011; Garland 2007; Nelson 2013; Nicolakis 2002; Pipitone 2001; Trock 1993; Trock 1994) to be at a low risk of bias for random sequence generation, and two studies omitted a description of the randomisation process (Thamsborg 2005; Zizic 1995).
Nine of the included studies met the allocation concealment criterion (Fary 2011; Garland 2007; Nelson 2013; Nicolakis 2002; Pipitone 2001; Thamsborg 2005; Trock 1993; Trock 1994).
Seven trials (Fary 2011; Garland 2007; Nelson 2013; Nicolakis 2002; Pipitone 2001; Trock 1993; Zizic 1995) had appropriate, well‐described placebo treatments and we assessed them as low risk of bias for blinding.
We assessed seven studies (Fary 2011; Garland 2007; Nelson 2013; Nicolakis 2002; Thamsborg 2005; Trock 1994; Zizic 1995) as low risk of bias for incomplete outcome data; six trials reported loss to follow‐up ranging from 5% to 20% (Garland 2007; Nicolakis 2002; Thamsborg 2005; Trock 1993; Trock 1994; Zizic 1995), balanced across compared groups, while one trial did not report the loss to follow‐up (Pipitone 2001).
No information on selective outcome reporting was found in any study.
See the 'Risk of bias' graph (Figure 2) and 'Risk of bias' summary (Figure 3).

'Risk of bias' graph: review authors' judgements about each risk of bias item presented as percentages across all included studies.

'Risk of bias' summary: review authors' judgements about each risk of bias item for each included study.
Effects of interventions
In the nine controlled trials included in the analysis, a total of 636 participants were randomised: 327 participants to electromagnetic field treatment and 309 to a placebo device. The pulsed electromagnetic field treatment trials lasted approximately four to six weeks, with treatment duration ranging from 27 hours to 60 hours (Nelson 2013; Nicolakis 2002; Pipitone 2001; Thamsborg 2005; Trock 1993; Trock 1994). The treatments in three other pulsed electrical stimulation trials were more intensive, involving 26 weeks of seven hours treatment daily (Fary 2011), four weeks of six hours per day treatment (Zizic 1995) and three months of 6 to 14 hours per day, respectively (Garland 2007). These trials did not provide the statistical details required for inclusion in meta‐analysis, therefore the analysis of the relative effects of treatment times, frequencies and modes of treatment delivery was limited (see summary of findings Table for the main comparison).
Electromagnetic field treatment versus placebo for osteoarthritis
Pain
The combined results from the six included studies of electromagnetic field treatment which measured pain as an outcome (Fary 2011; Garland 2007; Nelson 2013; Trock 1993; Trock 1994; Zizic 1995) showed a statistically significant beneficial effect for patient pain relief (mean difference (MD) 15.10, 95% confidence interval (CI) 9.08 to 21.13). People who received electromagnetic field treatment rated their pain to be 15.10 points lower on a scale of 0 to 100 (15.10% absolute improvement and 21.03% relative improvement) (Analysis 1.1).
Physical function
Three studies including 107 patients in the electromagnetic field treatment group and 90 patients in the placebo group measured function as an outcome (Fary 2011; Garland 2007; Pipitone 2001). Improvement of function was not statistically significant in electromagnetic field‐treated patients compared to control group patients (MD 4.55, 95% CI ‐2.33 to 11.32; 4.55% absolute effect and 10.13% relative effect) (Analysis 1.2).
Health‐related quality of life measure
Two studies including 68 patients in the electromagnetic field treatment group and 71 patients in the placebo group measured quality of life as an outcome (Fary 2011). Improvement in quality of life was not statistically significant in electromagnetic field‐treated patients compared to control group patients (SMD 0.09, 95% CI ‐0.36 to 0.54; 9% absolute effect and 100.8% relative effect) (Analysis 1.3).
Radiographic joint structure changes
Only two studies (Thamsborg 2005; Trock 1993) mentioned radiographic joint structure change but no data were available.
Number of patients experiencing any adverse event
Adverse events were presented in four studies with 156 participants in the intervention group and 132 participants in the control group (Garland 2007; Pipitone 2001; Thamsborg 2005; Zizic 1995), although specific definitions of adverse events were not provided in any study. The total number of adverse events was not statistically significantly increased in electromagnetic field‐treated patients (19.9%) compared to 16.7% of placebo‐treated patients, after six weeks (RR 1.17, 95% CI 0.72 to 1.92) (Analysis 1.4).
Patients who withdrew because of adverse events
Specific reasons for withdrawals were unrelated to the therapy except in the case of adverse skin reactions which were encountered in Zizic 1995 and occurred in patients receiving both placebo and active electrical stimulation treatment. There was no significant difference between groups (RR 0.90, 95% CI 0.06 to 13.92) (Analysis 1.5), suggesting that there is no difference between the active treatment and placebo in terms of adverse effects.
Patients experiencing any serious adverse event
No study reported any serious adverse events.
Subgroup analyses
We did not conduct the pre‐planned subgroup analyses of the most effective means of delivering therapy due to the small number of trials and insufficient data.
Sensitivity analyses
We undertook sensitivity analyses to explore the impact of studies with poor ratings for concealment of allocation, blinding of outcome asessors and extent of drop‐out and there was no change in the direction and significance of the effect sizes (results not shown).
Discussion
Summary of main results
Osteoarthritis is the most common of the rheumatic diseases. With an estimated 40,000 new cases of osteoarthritis diagnosed each year, it is the third leading cause of life‐years lost due to disability and is associated with high morbidity and healthcare utilisation (March 2004; Towheed 2004). The range of treatments for osteoarthritis is continually increasing as conventional therapies, such as pharmaceutical management, physiotherapy and joint replacement surgery, are coupled with emerging and established complementary therapies.
Osteoarthritis results from a failure of chondrocytes within the joint to synthesise a good‐quality matrix and to maintain a balance between synthesis and degradation of the extracellular matrix. The change in the quality of the matrix is mainly the result of dedifferentiation of chondrocytes, whereas the imbalance between synthesis and degradation of the extracellular matrix is caused by increased synthesis of proteinases and decreased anabolic effects of growth factors, mainly from chondrocytes but also from synovial tissue and subchondral bone. The biochemical reasoning behind the electrical stimulation of cartilage has been clearly demonstrated in vitro; its value in the treatment of delayed union fracture has been proven over two decades of use and it has been established as a standard of care (Aaron 1989; Baker 1974; Bassett 1974). The question remains as to whether it provides a financially accessible, clinically significant alternative to current therapies for osteoarthritis. The purpose of this systematic review was to evaluate the effectiveness of electrical stimulation treatment. However, its major limitation is the small number of contributing studies that could be included; this also prevented the planned subgroup analysis of variations in treatment.
All of the studies' participants had osteoarthritis of one or both knees, or cervical osteoarthritis, diagnosed by clinical symptoms and radiographic evidence, and the osteoarthritis was painful despite medical treatment.
The protocols for pulsed electrical stimulation or pulsed electromagnetic field device setting and application varied widely between studies, as did the outcome measures. Some pulsed electrical stimulation devices delivered a low‐frequency (100 Hz), low‐amplitude, voltage sourced (mean = 6.2 peak volts), monophasic, spiked signal to the knee via skin surface electrodes (Fary 2011; Garland 2007; Zizic 1995). In Nelson 2013 a pulsed electromagnetic field signal consisting of a 7 ms burst of 6.8 MHz sinusoidal waves repeating at one burst/s delivered a peak induced electrical field of 34 ± 8 V/m to the knee from a portable battery‐operated device. Other devices used in the included trials generated a pulsating electromagnetic field with a mean intensity of 40 μT (the frequency of the pulsed magnetic field ranged: 1 Hz to 3000 Hz) (Nicolakis 2002); or generated pulses of magnetic energy via a soft iron core with base frequencies (3 Hz, 7.8 Hz and 20 Hz) (Pipitone 2001), G50V in 50 Hz pulses changing voltage in 3 ms intervals (Thamsborg 2005) and extremely low‐frequency pulsed waves at 5 Hz, 10 to 15 gauss for 10 minutes, 10 Hz 15 to 25 gauss for 10 minutes and 12 Hz 15 to 25 gauss for 10 minutes (Trock 1993; Trock 1994). Characteristics of the devices, such as electromagnetic field modes, and application characteristics, such as duration, could not be evaluated in this systematic review due to the small number of trials.
Pain relief was measured using visual analogue scales (VAS). We pooled this outcome from six trials and found a significant difference between the electromagnetic field and placebo‐treated groups (Fary 2011; Garland 2007; Nelson 2013; Trock 1993; Trock 1994; Zizic 1995). All were randomised controlled trials with appropriate blinding and they had appropriate, well‐described placebo treatments (see Characteristics of included studies). There was moderate heterogeneity in the results. The intervention and its duration also differed between the studies.
The improvement in physical function in patients with knee osteoarthritis treated with pulsed electromagnetic fields was not statistically significant (Fary 2011; Garland 2007; Pipitone 2001). There was high heterogeneity in the results. This might be due to the different measurement tools used in the included studies. Two studies (Fary 2011; Garland 2007) used WOMAC physical function (on a 100 mm VAS) to measure the efficacy variable, while one study (Pipitone 2001) used the WOMAC disability score on a 20 cm VAS of the EuroQol. The intervention duration also differed among these studies.
Quality of life was not statistically significantly different between the treatment and placebo groups (Fary 2011; Pipitone 2001). This might be explained by the small sample sizes of the included studies measuring these outcomes, the wide variation in electromagnetic field devices and application protocols, or the inadequate intervention periods.
There were no life‐threatening events reported among participants exposed to electromagnetic fields.
Overall completeness and applicability of evidence
A comprehensive search of the literature revealed a number of studies of electromagnetic field interventions for osteoarthritis. Although the studies presented differences between placebo and active treatment for osteoarthritis for some outcomes, these effects did not meet the generally accepted criteria for clinical importance. There are currently insufficient data to draw conclusions about the efficacy of electromagnetic field interventions in the management of osteoarthritis, thus highlighting the need for larger independent studies that focus on the OMERACT core outcomes with complete documentation of results.
In summary, electromagnetic field treatment has a moderate benefit for patients' pain relief. There is inconclusive evidence that electromagnetic field treatment improves physical function, quality of life or radiographic joint structure. No serious adverse effects of electromagnetic field treatment were reported in the included trials. This might be because of the relative safety of electromagnetic fields compared to physiotherapy, which could be an advantage. This meta‐analysis did not reveal clinically important results overall and the analysis was limited by the paucity of literature on electromagnetic fields for osteoarthritis. However, the statistically significant benefits seen here do support the undertaking of further large‐scale studies to allow definite conclusions to be drawn.
Quality of the evidence
The quality of the evidence of all included trials was moderate or low. Six trials described generation of allocation sequence or concealment of allocation, or reported whether primary outcomes were specified a priori. All trials described double‐blinding of patients and physicians or assessors. Four of the trials were analysed according to the intention‐to‐treat principle. We also downgraded for heterogeneity and imprecision.
Potential biases in the review process
We believe that we identified all relevant studies. We devised a thorough search strategy and searched all major databases for relevant studies, and we applied no language restrictions. Two review authors independently assessed the trials for inclusion in the review and for risk of bias, with a third review author adjudicating if there was any discrepancy. The biggest limitation of the review process was the heterogeneity between the trials and the lack of data in a form that could be extracted for meta‐analysis.
Agreements and disagreements with other studies or reviews
A systematic review has assessed the effectiveness of pulsed electromagnetic fields compared with placebo in the management of osteoarthritis of the knee (Vavken 2009). Nine studies, including 483 patients, were pooled. They reported that pulsed electromagnetic field treatment improved clinical scores and function in patients with osteoarthritis of the knee and that it should be considered as an adjuvant therapy in the management of these patients. However, there is still equipoise regarding the evidence in the literature for an effect on pain.
Study flow diagram.
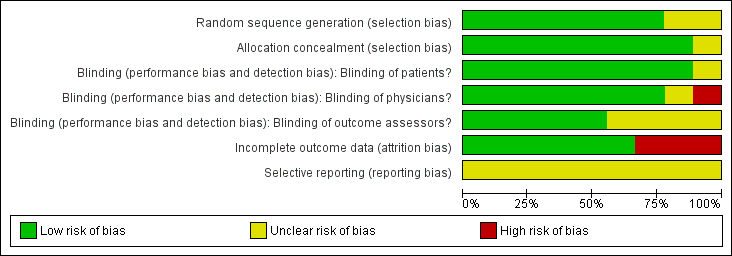
'Risk of bias' graph: review authors' judgements about each risk of bias item presented as percentages across all included studies.
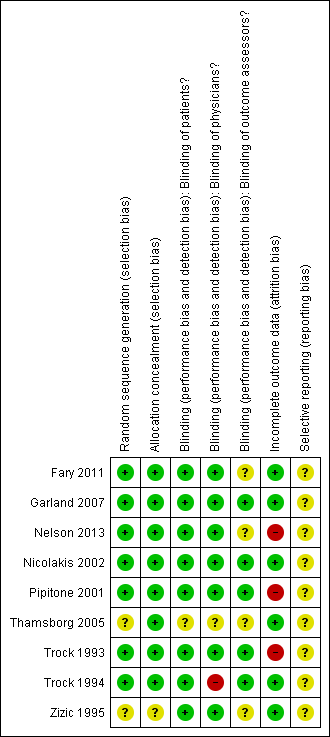
'Risk of bias' summary: review authors' judgements about each risk of bias item for each included study.
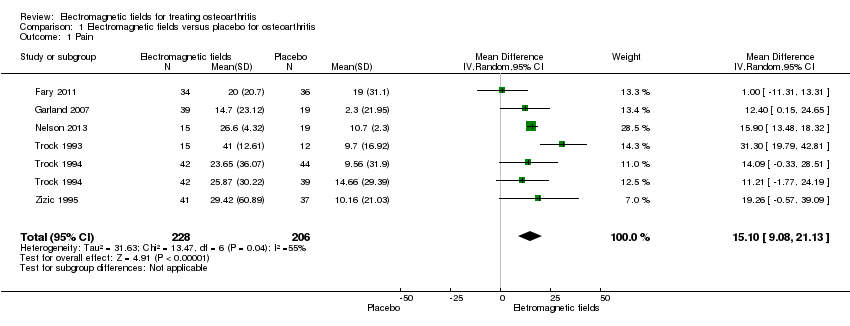
Comparison 1 Electromagnetic fields versus placebo for osteoarthritis, Outcome 1 Pain.

Comparison 1 Electromagnetic fields versus placebo for osteoarthritis, Outcome 2 Physical function.
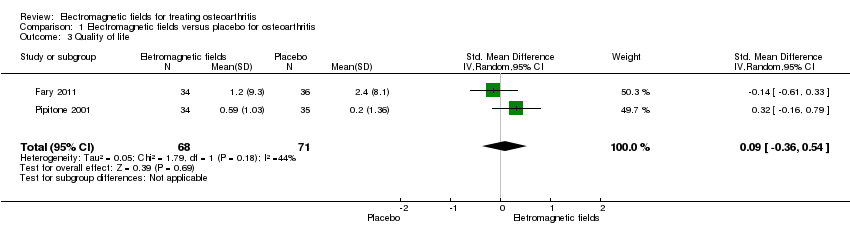
Comparison 1 Electromagnetic fields versus placebo for osteoarthritis, Outcome 3 Quality of life.

Comparison 1 Electromagnetic fields versus placebo for osteoarthritis, Outcome 4 Number of patients experiencing any adverse event.
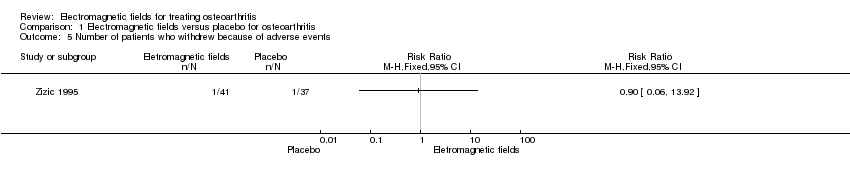
Comparison 1 Electromagnetic fields versus placebo for osteoarthritis, Outcome 5 Number of patients who withdrew because of adverse events.
| Electromagnetic field treatment compared to placebo for the treatment of osteoarthritis | ||||||
| Patient or population: patients with osteoarthritis | ||||||
| Outcomes | Illustrative comparative risks* (95% CI) | Relative effect | No of participants | Quality of the evidence | Comments | |
| Assumed risk | Corresponding risk | |||||
| Placebo | Electromagnetic field treatment | |||||
| Pain Scale from: 0 to 100 (Higher scores mean worse pain) | The mean change in pain in the control groups was 10.7 | The mean change in pain in the intervention groups was | 434 | ⊕⊕⊕⊝ | MD 15.10 (95% CI 9.08 to 21.13) Absolute risk difference: 15% (95% CI 9.08% to 21.13%) Relative per cent change: 21.03% (95% CI 12.65% to 29.43%) NNT: 2 (95% CI 1 to 6) | |
| Physical function WOMAC function Scale from: 0 to 100 (Higher scores mean more severe limitation) | The mean change in physical function in the control groups was | The mean change in physical function in the intervention groups was | 197 | ⊕⊕⊝⊝ | MD 4.55 (95% CI ‐2.23 to 11.32) Absolute risk difference: 4.55% (95% CI ‐2.23% to 11.32%) Relative per cent change: 268% (95% CI ‐131% to 666%) NNT: not statistically significant | |
| Quality of life SF‐36 item Scale from: 0 to 100 (Lower scores mean worse quality) Follow‐up: mean 16 weeks | The mean change in quality of life in the control groups was | The mean change in quality of life in the intervention groups was | 145 | ⊕⊕⊕⊝ | SMD 0.09 (95% CI ‐0.36 to 0.54) Absolute risk difference: 1% (95% CI ‐2.92% to 4.37%) Relative per cent change: 30.38% (95% CI ‐121.5% to 182.25%) NNT: not statistically significant | |
| Radiographic progression Bone scintigraphic examinations Follow‐up: mean 2.5 months | See comment | See comment | Not estimable | 78 | See comment | No related data were available |
| Number of patients experiencing any adverse event Follow‐up: mean 1 month | 167 per 1000 | 195 per 1000 | RR 1.17 | 288 | ⊕⊕⊕⊝ | Absolute risk difference: 3% (95% CI ‐6% to 12%) Relative per cent change: 17% (95% CI ‐28% to 92%) NNT: not statistically significant |
| Number of patients who withdrew because of adverse events Follow‐up: mean 6 months | 27 per 1000 | 24 per 1000 (2 to 376) | RR 0.90 (0.06 to 13.92) | 78 | ⊕⊕⊝⊝ | Only 1 study: 1 participant withdrew from each group because of adverse skin reactions unrelated to the therapy |
| *The basis for the assumed risk (e.g. the median control group risk across studies) is provided in footnotes. The corresponding risk (and its 95% confidence interval) is based on the assumed risk in the comparison group and the relative effect of the intervention (and its 95% CI). | ||||||
| GRADE Working Group grades of evidence | ||||||
| 1Downgraded for moderate heterogeneity (I2 = 55%); unclear risk for random sequence generation (Zizic 1995), allocation concealment (Zizic 1995), blinding of outcome assessors (Fary 2011; Nelson 2013; Zizic 1995), selective reporting (all six studies) and high risk for incomplete outcome data (Zizic 1995). | ||||||
| Outcome or subgroup title | No. of studies | No. of participants | Statistical method | Effect size |
| 1 Pain Show forest plot | 6 | 434 | Mean Difference (IV, Random, 95% CI) | 15.10 [9.08, 21.13] |
| 2 Physical function Show forest plot | 3 | 197 | Mean Difference (IV, Random, 95% CI) | 4.55 [‐2.23, 11.32] |
| 3 Quality of life Show forest plot | 2 | 139 | Std. Mean Difference (IV, Random, 95% CI) | 0.09 [‐0.36, 0.54] |
| 4 Number of patients experiencing any adverse event Show forest plot | 4 | 288 | Risk Ratio (M‐H, Fixed, 95% CI) | 1.17 [0.72, 1.92] |
| 5 Number of patients who withdrew because of adverse events Show forest plot | 1 | Risk Ratio (M‐H, Fixed, 95% CI) | Totals not selected | |