Intervenciones de estilo de vida para el tratamiento de la incontinencia urinaria en adultos
Referencias
Referencias de los estudios incluidos en esta revisión
Referencias de los estudios excluidos de esta revisión
Referencias de los estudios en espera de evaluación
Referencias de los estudios en curso
Referencias adicionales
Characteristics of studies
Characteristics of included studies [ordered by study ID]
| Methods | Design: A sub‐study of the Diabetes Prevention Program (DPP), an RCT with overweight non‐diabetic individuals, randomly allocated to the intensive lifestyle weight loss programme (Group I), metformin (Group II) or placebo (Group III). For the purpose of this sub‐study, men were excluded from analysis Recruitment period: 1996‐1999 Power calculation: performed for the original DPP trial | |
| Participants | Number of (female) participants randomized: total = 2191 Gender: female BMI mean (SD): Group I: 34.7 (6.9); Group II: 34.8 (6.9); Group III: 35.1 (7.0) Ethnicity: Group I: white = 343; African American = 138; Hispanic = 103; Native American = 51; Asian = 25 Group II: white = 333; African American = 148; Hispanic = 97; Native American = 45; Asian = 13 Group III: white = 355; African American = 144; Hispanic = 94; Native American = 51; Asian = 17 Education: not stated Employment status: not stated Severity of symptoms: not stated Inclusion criteria: age at least 25 years, BMI ≥ 24 kg/m², a fasting plasma glucose level 95–125 mg/dl, and a 2‐h post challenge glucose level 140–199 mg/dl Diagnostic groups: not stated | |
| Interventions | Group I: intensive lifestyle intervention. The goals were at least 7% weight loss and at least 150 minutes of moderate‐intensity physical activity per week. A 16‐lesson curriculum covering diet, exercise, and behaviour modification, taught by case managers during the first 24 weeks after enrolment, was "flexible, culturally sensitive, and individualized". Subsequent individual sessions (usually monthly) and group sessions with the case managers were also provided to reinforce the behavioural changes Length of follow‐up: average 2.8 (range 1.8‐4.6) years Training provided by: case managers, with training in nutrition, exercise or behaviour modification, on a one‐to‐one basis Group II: metformin 850 mg twice daily with standard lifestyle intervention Group III: placebo twice daily with standard lifestyle intervention The standard lifestyle intervention included written information and an individual meeting (20‐30 minutes) that emphasized a healthy diet, reduced weight, increased activity levels and smoking cessation, at baseline and annually Co‐interventions: not stated Compliance: Mean change in weight, kg (SD): Group I = ‐3.4 (8.2); Group II = ‐1.5 (7.6); Group III = +0.5 (6.7); P value < 0.001 | |
| Outcomes | Weekly prevalence of UI by type (stress, urge or any UI) based on participant's report at the end‐of‐trial visit | |
| Notes | The primary aim of the DPP trial was to evaluate whether an intensive lifestyle intervention with improved diet and increased physical activity or metformin therapy among overweight pre‐diabetic men and women would prevent or delay the onset of type 2 diabetes. Not all participants had UI at baseline. The objective of the analysis included in this review was to assess whether these interventions were associated with a lower prevalence of incontinence in women, because weight loss may decrease incontinence, whereas increased physical activity may worsen incontinence, and incontinence may also be a barrier to exercise Funding: The DPP trial was supported by the following: The Diabetes Prevention Program, National Institutes of Health/National Institute of Diabetes and Digestive and Kidney Diseases, the National Institute of Child Health and Human Development, the National Institute on Aging, the Office of Research on Minority Health and Health Disparities, the Office of Women’s Health, the Indian Health Service, the Centers for Disease Control and Prevention, the General Clinical Research Program, the National Center for Research Resources, the American Diabetes Association, Bristol‐Myers Squibb, Lipha Pharmaceuticals, and Parke‐Davis. LifeScan, Health O Meter, Hoechst Marion Roussel, Merck‐Medco Managed Care, Merck, Nike Sports Marketing, and Slim Fast Foods. Quaker Oats donated materials, equipment, or medicines for concomitant conditions. McKesson ioServices, Matthews Media Group, and the Henry M Jackson Foundation provided support services under subcontract with the Co‐ordinating Center | |
| Risk of bias | ||
| Bias | Authors' judgement | Support for judgement |
| Random sequence generation (selection bias) | Low risk | Quote: "Adaptive randomisation stratified by clinical centre" |
| Allocation concealment (selection bias) | Unclear risk | Not mentioned |
| Blinding of participants and personnel (performance bias) | High risk | Assignments to metformin and placebo were blinded but the lifestyle intervention was not |
| Blinding of outcome assessment (detection bias) | Unclear risk | Not mentioned |
| Incomplete outcome data (attrition bias) | Low risk | Of the 2191 women enrolled in the 3 arms of the DPP, 234 (11%) women with missing UI data were excluded from the analysis. The study stated that "women missing data on urinary incontinence did not differ in incident diabetes, mean weight change, or mean change in physical activity overall or within treatment groups compared with women with completed urinary incontinence data" |
| Selective reporting (reporting bias) | Unclear risk | Insufficient information provided. The main outcome for this analysis was prevalence of incontinence |
| Other bias | Unclear risk | The DPP trial was closed early after 2.9 years when lifestyle changes and metformin treatment had each reduced the incidence of diabetes |
| Methods | Design: quasi‐RCT. Participants were randomized by health record numbers and allocated to caffeine reduction education (Group I) or control (Group II) Recruitment period: not stated Power calculation: performed | |
| Participants | Number of participants randomized: total = 95; Group I = 48; Group II = 47 Gender (number and % female): Group I = 45 (94%); Group II = 41 (87%) Mean body weight, kg (SD): Group I = 69 (17); Group II = 68 (20) Ethnicity: not stated Education: not stated Employment status: not stated Severity of symptoms: mean number of leakage episodes per 24 hours (SD): Group I = 2.8 (3.2); Group II = 3.1 (3.9) Inclusion criteria: adults with symptoms of urgency, frequency and/or urge incontinence, and who routinely ingested caffeine at levels of 100 mg or more every 24 hours Diagnostic groups: 83% of the sample had urge UI, while 17% reported no UI at baseline (only frequency and urgency) | |
| Interventions | Group I: educational intervention (with bladder training) to reduce caffeine intake to < 100 mg a day. The intervention consisted of a thorough review (with participants) of their caffeine intake history, urinary symptoms and time/volume/caffeine charts for 3 randomly selected 24‐hour periods, followed by a planned caffeine reduction intervention using a caffeine fading method (James 1988). This method decreases caffeine intake by one drink each day until the desired maximum intake of 100 mg caffeine a day is reached and the caffeinated drinks have been replaced by other fluids Training provided by: not stated Group II: continued usual daily caffeine intake of > 100 mg every 24 hours. Also received bladder training Co‐interventions: not stated Compliance: mean caffeine intake reduction per 24 hours, (SD): Group I: 58%; Group II: 11%; P value < 0.0001 | |
| Outcomes | Number of incontinent episodes in 24 hours | |
| Notes | ||
| Risk of bias | ||
| Bias | Authors' judgement | Support for judgement |
| Random sequence generation (selection bias) | High risk | Quote: "Patients were randomized by health record number to two groups" |
| Allocation concealment (selection bias) | High risk | Quote: "Patients were randomized by health record number to two groups" |
| Blinding of participants and personnel (performance bias) | High risk | Not mentioned but unlikely |
| Blinding of outcome assessment (detection bias) | Unclear risk | Not mentioned |
| Incomplete outcome data (attrition bias) | Unclear risk | Data reported for 74 (78%) of 95 participants who completed the study. Reasons for withdrawal were reported but not separately for each group. The study states that caffeine levels did not differ between the completers and those who withdrew, but it is unclear if severity of incontinence differed |
| Selective reporting (reporting bias) | Unclear risk | Insufficient information. Reported outcomes specified in the method section |
| Other bias | Unclear risk | Insufficient information provided |
| Methods | Design: RCT. Participants were assigned randomly to increased fluid intake (Group I), decreased fluid intake (Group II) or maintained fluid intake (Group III) Recruitment period: not stated Power calculation: not stated | |
| Participants | Number of participants randomized: total = 58; Group I = 20; Group II = 18; Group III = 20 Gender: female BMI: 19/32 participants with data had normal or below normal weight; 8/32 participants were obese Ethnicity: not stated Education: not stated Employment status: not stated Severity of symptoms (mean daily UI episodes per day): 0.6 (n = 32) Inclusion criteria: women over 50 years of age who had had UI for 6 months or more, were independent in self‐care, scored over 20 on the Mini‐Mental State Examination (Folstein 1975) and were English speaking Diagnostic groups: not stated | |
| Interventions | The first week served as the baseline, after which participants were assigned to 1 of the 3 groups. Participants were instructed in the detailed recording of intake using the same measuring cups and glasses for the duration of the study and were instructed to keep intake and output diaries for 5 weeks Group I: increased fluid intake by 500 ml, total intake not to exceed 2400 ml per day Group II: decreased intake by 300 ml, total intake not to be less than 1000 ml per day Group III: maintained fluid intake at baseline level Treatment duration: 5 weeks (randomisation in second week) Treatment provided by: registered nurses who were given in‐service training on UI and oriented to the study procedures. They provided new data‐collection sheets and responded to questions on a weekly basis Co‐interventions: not stated Compliance (mean daily fluid intake): Group I = fluid intake was increased until week 3 when they returned closer to the baseline level; Group II = intake was less than baseline through the first 4 weeks but increased in week 5; Group III = increased intake by approximately 170 ml in week 5; this suggests generally low compliance across the groups | |
| Outcomes | Number of incontinent episodes in 24 hours | |
| Notes | The secondary aim of the study was to assess whether there was any relationship between caffeine intake and incontinence episodes Funding: Kidney Foundation of Summit County in Akron, Ohio, USA | |
| Risk of bias | ||
| Bias | Authors' judgement | Support for judgement |
| Random sequence generation (selection bias) | Unclear risk | Quote: "The women were assigned randomly" |
| Allocation concealment (selection bias) | Unclear risk | Not mentioned |
| Blinding of participants and personnel (performance bias) | High risk | Not mentioned but unlikely |
| Blinding of outcome assessment (detection bias) | Unclear risk | Not mentioned |
| Incomplete outcome data (attrition bias) | High risk | Data were presented for 32/58 (55%) of the women randomized who maintained the diaries for the entire study |
| Selective reporting (reporting bias) | Unclear risk | Insufficient information provided. The only outcome reported was the number of incontinence episodes, but this was according to the study aim |
| Other bias | High risk | The study reported that adherence to the fluid manipulation was poor and made results difficult to interpret |
| Methods | Design: prospective 2‐group cross‐over trial. After a 4‐day screening period (baseline), there were 4 phases of 4‐day fluid manipulation and 2‐day washout over the period of 4 weeks. Participants were randomly assigned to 1 of the 2 groups and asked either to increase or decrease their fluid intake first, from baseline Recruitment period: not stated Power calculation: performed | |
| Participants | Number of participants randomized: 67 were contacted, 40 were recruited and 24 were randomized Gender: male = 11; female = 13 BMI: not stated Ethnicity: not stated Education: not stated Employment status: not stated Severity of symptoms: not stated Prior incontinence surgery: not stated Inclusion criteria: adult men and women (≥18 years old) with symptoms of OAB. Enrolled after a 4‐day screening period (to establish baseline values) using frequency/volume charts (FVC), completed daily, if they had a mean of 8 or more voids and 1 or more urgency and/or urgency incontinence episodes in 24 hours. Participants were identified from a database that included those who were contacted and/or participated in previous trials. They were initially screened by telephone to see if they would agree to take part in the trial and were eligible for it Exclusion criteria: participants were excluded from any part of the study if their increase/decrease resulted in them drinking > 3 L or < 1 L of fluid, as drinking 3 L would be excessive and drinking < 1 L would cause symptoms of dehydration, e.g. headaches and constipation. People were also excluded if they were pregnant or breast‐feeding; had haematuria, bacteriuria, pyuria, proteinuria, glucosuria or ketosuria on urine dipstick testing; had a residual volume of > 150 mL, as assessed by a bladder scan; had uncontrolled hypertension, suspicion or evidence of clinically relevant cardiac failure, renal disease or hepatic disease; were diagnosed with or suspected of having diabetes insipidus/primary polydipsia or diabetes mellitus; had neurogenic dysfunction of the lower urinary tract; were known alcohol or drug abusers; were scheduled to be admitted to hospital for inpatient surgery during the trial; had any history of clinically relevant psychiatric disorders within the last 24 months preceding enrolment in the trial; had a history of not complying with medical regimens or were not compliant with protocol requirements or unable to keep a diary or perform the required volume measurements on their own; had significant pelvic organ prolapse (Stage III or IV) or had significant stress UI. Diagnostic groups: OAB = 24 (100%). Only 7 (29%) participants had 1 or more urge UI episode at baseline | |
| Interventions | 4‐day screening period with FVC to establish baseline drinking habits, prior to randomisation to Group I or II
Group I: 4 days drinking 25% less than baseline followed by 2 days normal drinking (i.e. a washout); followed by 4 days drinking 50% less than baseline followed by 2 days normal drinking; followed by 4 days drinking 25% more than baseline followed by 2 days normal drinking; followed by 4 days drinking 50% more than baseline
Group II: 4 days drinking 25% more than baseline followed by 2 days normal drinking; followed by 4 days drinking 50% more than baseline followed by 2 days normal drinking; followed by 4 days drinking 25% less than baseline followed by 2 days normal drinking; followed by 4 days drinking 50% less than baseline
Participants who drank > 3 L or < 1 L were excluded. Patients completed a 4‐day FVC in each part of the study, and the ICIQ‐OAB questionnaire at the end of each 4‐day period, to assess their quality of life for that period Significance was analyzed by comparing each intervention group to the overall baseline of the study group (n = 24). The number of participants differed in each period so this is presented for reference Treatment duration: 4 weeks Co‐intervention: not stated Compliance: all 24 participants participated in the period with a 25% reduction, but not all participated in the other parts of the study because they did not fulfil the criteria, i.e. their input was < 1 L or > 3 L when the fluid intake was manipulated. The mean fluid output was approximately 289 ml higher than the fluid intake. When participants were asked to drink 25% more than their normal fluid input they only managed to drink 17% more, and when asked to drink 50% more they managed 23% more, when comparing the respective groups with baseline. When asked to drink 50% less, participants managed to drink 32% less than the baseline. The 25% reduction was adhered to quite well | |
| Outcomes | Condition‐specific quality of life Adverse effects Number of incontinent episodes in 24 hours | |
| Notes | Funding: Bristol Urological Institute PA Research Fund | |
| Risk of bias | ||
| Bias | Authors' judgement | Support for judgement |
| Random sequence generation (selection bias) | Unclear risk | Quote: "randomized into one of the two groups" |
| Allocation concealment (selection bias) | Unclear risk | Not mentioned |
| Blinding of participants and personnel (performance bias) | High risk | Not mentioned but unlikely |
| Blinding of outcome assessment (detection bias) | Unclear risk | Not mentioned |
| Incomplete outcome data (attrition bias) | Low risk | No missing outcomes |
| Selective reporting (reporting bias) | Unclear risk | Insufficient information available. The study described what was measured by frequency/volume charts in the method section |
| Other bias | High risk | The study reported that participants had difficulty in adhering to the study protocol when they were asked either to increase or decrease fluids by 50% |
| Methods | Design: cross‐over trial with 2 x 12‐week diet periods and 2 x 4‐week washout periods before and between treatments. Participants were randomly allocated to the order in which they followed an isocaloric soy‐rich diet or a control diet Recruitment period: not stated Power calculation: not stated | |
| Participants | Number of participants randomized: 42 Gender: female BMI: not stated Ethnicity: not stated Education: not stated Employment status: not stated Severity of symptoms: not stated Inclusion criteria: healthy women whose periods had ceased at least 3 months previously,who were 45‐70 years of age, not using hormone therapy and did not regularly consume a vegetarian diet. All women had experienced at least one type of urinary or genital symptoms owing to urogenital atrophy Diagnostic groups: before soy‐rich diet, 61% had SUI and 19% had UUI; and before control diet 63% had SUI and 11% had UUI. Some women may have had symptoms of both SUI and UUI. Other women had frequency, urgency or other vaginal symptoms, e.g. vaginal dryness, but no UI | |
| Interventions | During both study periods, participants consumed self‐selected diets with low‐fat and low‐cholesterol foods. Subjects were advised to maintain their physical activity consistently throughout the study and were instructed to avoid all additional soy products, herbal or vitamin and mineral supplements. They were also instructed to keep an accurate 3‐day food record Intervention period I: isocaloriic soy‐rich diet: Participants consumed 25 g soy protein in various forms containing > 50 mg per day of isoflavones, which was substituted for an equivalent amount of animal protein. All soy foods for the study were provided monthly Intervention period II: control diet Treatment duration: 2 x 12‐week diet periods with 2 x 4‐week washout periods before and between treatments Treatment provided by: the same nutritionist throughout the study Co‐intervention: not stated Compliance: good compliance was shown by the significant elevation of serum levels of daidzein and genistein during the soy‐rich diet period | |
| Outcomes | Number of women with incontinent episodes Incontinence symptom scores | |
| Notes | Funding: Thai Health Promotion Foundation | |
| Risk of bias | ||
| Bias | Authors' judgement | Support for judgement |
| Random sequence generation (selection bias) | Unclear risk | Quote: "The subjects were randomized into two groups" |
| Allocation concealment (selection bias) | Unclear risk | No information available |
| Blinding of participants and personnel (performance bias) | High risk | Not mentioned but unlikely |
| Blinding of outcome assessment (detection bias) | Unclear risk | Pelvic examination and vaginal pH test were performed by the same examiner who was blinded, but these outcomes were not relevant to this review. No mention of blinded assessment for the outcomes specified in the review |
| Incomplete outcome data (attrition bias) | Unclear risk | Data are presented for 36 (86%) of 42 women who completed the study. Reasons for withdrawals and drop‐outs were described but their incontinence severity was unclear and it was also unclear at what time point the withdrawals/drop‐out occurred |
| Selective reporting (reporting bias) | Unclear risk | Insufficient information available. Reported outcomes were specified in the methods section |
| Other bias | Unclear risk | Insufficient information available |
| Methods | Design: RCT with 2 groups Study period: 01 January 2007‐31 December 2007 | |
| Participants | Number of participants: Group I = around 30; Group II = around 30 Gender: female Diagnostic groups: OAB (unclear if wet or dry) | |
| Interventions | Group I: reduced intake of 'irritating' beverages (caffeine or non‐caffeine). Participants were instructed to maintain the overall volume of fluid intake by replacing the 'irritating' beverages with water or milk Group II: control (no details provided) Treatment duration: unclear | |
| Outcomes | The study found a significant reduction in OAB symptoms (not defined) in the intervention group. However, the author noted that findings were confounded by a significant reduction in overall fluid intake in the intervention group from baseline (by an average of 8 fluid oz (around 230 ml) per 24 hours). The author also notes that caffeine reduction was not associated with the OAB symptom reduction | |
| Notes | Unpublished trial. All information was obtained from an author email to the Cochrane Incontinence Group search co‐ordinator (26 January 2009) Funding: Pfizer, GA6120A8 Detrol Competitive Grant | |
| Risk of bias | ||
| Bias | Authors' judgement | Support for judgement |
| Random sequence generation (selection bias) | Unclear risk | Insufficient information available |
| Allocation concealment (selection bias) | Unclear risk | Insufficient information available |
| Blinding of participants and personnel (performance bias) | Unclear risk | Insufficient information available |
| Blinding of outcome assessment (detection bias) | Unclear risk | Insufficient information available |
| Incomplete outcome data (attrition bias) | Unclear risk | Insufficient information available |
| Selective reporting (reporting bias) | Unclear risk | Insufficient information available |
| Other bias | High risk | The study author noted non‐adherence to the protocol among study participants |
| Methods | Design: a sub‐study of the Look AHEAD (Action for Health in Diabetes) trial, an RCT with overweight or obese individuals with type 2 diabetes, randomly allocated to intensive lifestyle weight loss intervention (Group I) or a diabetes support and education control condition (Group II). For the purpose of this sub‐study, men were excluded from analysis Recruitment period: from 2001. Planned follow‐up until 2014 Power calculation: performed | |
| Participants | Number of (female) participants randomized in Look AHEAD trial: 3063. Of these, 69 who did not complete baseline incontinence assessment were excluded from this sub‐study Number of randomized participants in this sub‐study: Group I = 1495; Group II = 1499 Gender: female Mean BMI (SD): Group I: 36.3 (6.2); Group II: 36.7 (6.0) Ethnicity: Group I: non‐Hispanic white 56%, African‐American 20%, Hispanic 15%, Native American/Alaskan native 6%, Other 3%; Group II: non‐Hispanic white 55%, African‐American 20%, Hispanic 15%, Native American/Alaskan native 7%, Other 3% Education: not stated Employment status: not stated Severity of symptoms: not stated Inclusion criteria: overweight and obese individuals (men and women) with type 2 diabetes, 45‐76 years of age with a BMI of ≥ 25 kg/m² (> 27 kg/m² if currently taking insulin) Exclusion criteria: ≥ HbA1c 11%, blood pressure ≥ 160/100 mmHg, triglycerides ≥ 600 mg/dl, inadequate control of comorbid conditions, factors that may limit adherence to the intervention, and underlying disease likely to limit life span and/or affect safety of the interventions Diagnositic groups: at baseline 27% of participants reported weekly (or more frequent) urinary incontinence. The reference group was 'less than weekly'. Predominant type of UI was coded based on whether a participant reported a higher frequency of stress or urgency episodes. About 13% in each group reported predominant SUI and 10% reported predominant UUI. Only 2% of women were classified as having MUI (defined as frequency of SUI = frequency of UUI) | |
| Interventions | Group I: intensive lifestyle intervention designed to promote an average of 7% or greater weight loss at 1 year. Participants were encouraged to consume a low calorie and low fat, portion controlled diet that included liquid meal replacements, and to achieve at least 175 minutes of physical activity weekly. The participants were seen weekly for the first 6 months and 3 times monthly for the next 6 months for a total of 44 sessions (Phase I, months 1‐12) Length of follow‐up: for the purpose of this sub‐study, outcomes were assessed after 1 year of intervention Training provided by: lifestyle counsellor Group II: diabetes support and education: participants were invited to 3 group sessions during the year which focused on diet, physical activity or social support Co‐interventions: not reported Compliance: Mean weight lost at 1 year, kg (SD): Group I: 7.7 (7.0); Group II: 0.7 (5.0); P value < 0.0001 | |
| Outcomes | Improvement (decrease of at least 2 episodes per week) and resolution (cure) in women who had weekly or more frequent incontinence episodes at baseline, assessed by validated self‐report questions after 1 year of intervention Prevalence of UI (that occurred at least weekly) assessed by validated self‐report questions after 1 year of intervention | |
| Notes | The primary objective of the LOOK AHEAD trial was to assess the intervention effects on cardiovascular morbidity and mortality Funding: the Department of Health and Human Services. The following organizations have committed to make major contributions to Look AHEAD: FedEx Corp; Health Management Resources; LifeScan, Inc, a Johnson and Johnson Company; Optifast ® of Nestle HealthCare Nutrition, Inc; Hoffmann‐La Roche Inc; Abbott Nutrition; and Slim‐Fast Brand of Unilever North America | |
| Risk of bias | ||
| Bias | Authors' judgement | Support for judgement |
| Random sequence generation (selection bias) | Unclear risk | Quote: "Partiicpants were randomly assigned within centers to the ILI [intensive lifestyle intervention] or the DSE [diabetes support and education] conditions with equal probability". "Randomisation is stratified by clinical center and blocked with random block sizes" |
| Allocation concealment (selection bias) | Unclear risk | No information available |
| Blinding of participants and personnel (performance bias) | High risk | Blinding of patient and personnel not mentioned but unlikely |
| Blinding of outcome assessment (detection bias) | Low risk | Quote: "All measures were completed at baseline and 1 year by assessors who were masked to participant treatment group." |
| Incomplete outcome data (attrition bias) | Unclear risk | Of the 3063 women enrolled in the Look AHEAD trial, 69 (2%) women with no UI data at baseline were excluded from this sub‐study. The 1‐year follow‐up rate was 93% (1385/1495) in the intervention group and 90% (1354/1499) for the control group. Survey completers were more likely to be white and non‐smokers. The implication for the incontinence outcome is unknown |
| Selective reporting (reporting bias) | Unclear risk | Insufficient information available |
| Other bias | Unclear risk | Insufficient information available |
| Methods | Design: RCT stratified by type of incontinence (either stress only and stress‐predominate MUI or urge only and urge‐predominate MUI), then randomly allocated to immediate (Group I) or delayed (Group II) enrolment in the weight reduction programme Recruitment period: January 1999‐March 2000 Power calculation: performed | |
| Participants | Number of participants randomized: total = 48; Group I = 24; Group II = 24 Gender: female Median BMI (IQR): Group I = 34 (32‐40); Group II = 36 (32‐38) Ethnicity: Group I: white = 18; other 2; Group II: white = 17; other = 3 Education: not stated Employment status: not stated Severity of symptoms (number of women with 'severe' incontinence defined as > 10 episodes per week): Group I = 19; Group II = 20 Prior incontinence surgery (number of women): Group I = 1; Group II = 3 Inclusion criteria: a consecutive sample of women 18 to 80 years old with BMI between 25‐45 kg/m², UI for at least 3 months and at least 4 incontinent episodes in a 7‐day urinary diary. Prior incontinence therapies (including surgery) were not exclusions from study eligibility Diagnostic groups: Group I: stress alone = 3; stress‐predominate MUI = 9; urge alone = 3; urge‐predominate MUI = 9 Group II: stress alone = 0; stress‐predominate MUI = 10; urge alone = 2; urge‐predominate MUI = 11 | |
| Interventions | Group I: a 3‐month intensive group‐based medical and behavioural weight loss programme. Participants were placed on a standard low calorie liquid diet (800 kcals per day or less), encouraged to increase physical activity gradually until they were exercising 60 minutes daily, and were taught standard cognitive and behavioural skills to assist in modifying eating and exercise habits. Participants met weekly in group sessions led by a nutritionist, exercise physiologist or behavioral therapist and followed a structured protocol Training provided by: nutritionist, exercise physiologist or behavioural therapist Group II: a waiting list control group had no intervention for 3 months and then entered the weight reduction programme Co‐interventions: participants currently using incontinence therapy were included in the study, but were asked to not change treatment during study Compliance: median % weight improvement, (IQR): Group I: 16 (9‐20); Group II: 0 (‐2‐2) | |
| Outcomes | Condition‐specific quality of life Adverse effects Cure rates based on quantification of symptoms (defined as number of women with a 100% reduction in weekly UI episodes recorded by 7‐day diary) Improvement (including cure) rates based on quantification of symptoms (defined as number of women with a 75%‐100% reduction in weekly UI episodes recorded by 7‐day diary) Number of incontinent episodes per week Generic quality of life | |
| Notes | Funding: Mount Zion Health Services Inc and University of California | |
| Risk of bias | ||
| Bias | Authors' judgement | Support for judgement |
| Random sequence generation (selection bias) | Low risk | Quote: "The randomization codes were prepared by computer generated random numbers" |
| Allocation concealment (selection bias) | Low risk | Quote: "sealed, opaque envelopes numbered consecutively" |
| Blinding of participants and personnel (performance bias) | High risk | Quote: "Participants could not be blinded" |
| Blinding of outcome assessment (detection bias) | Low risk | Quote: "... research investigators assessing outcomes and statistical analysts were blinded" |
| Incomplete outcome data (attrition bias) | Low risk | The analysis was "by intent to treat". The study states that the "40 women (83%) who completed the first 3 months of the trial were similar in demographic and clinical characteristics to the 8 women (17%) who did not complete the first 3 months of the trial". |
| Selective reporting (reporting bias) | Unclear risk | Insufficient information available |
| Other bias | Unclear risk | Imbalance in age at baseline due to chance (P value = 0.006), the effect(s) on outcome are unknown |
| Methods | Design: RCT stratified by clinical centre, then randomly allocated by 2:1 ratio to 6‐month weight loss programme (Group I) or 4‐session education programme (Group II) Recruitment period: 2004‐2006 Power calculation: performed | |
| Participants | Number of participants randomized: total = 338; Group I = 226; Group II = 112 Number of participants with data on incontinence at 12 months: total = 294; Group I = 207; Group II = 87 Number of participants with data on incontinence at 18 months: total = 287; Group I = 197; Group II = 90 Gender: female Mean BMI (SD): Group I = 36 (6); Group II = 36 (5) Ethnicity: Group I: white = 171; black = 47; other = 8; Group II: white = 91; black = 17; other = 4 Education (beyond high school): Group I = 200; Group II = 93 Employment status: not stated Severity of symptoms: not stated Inclusion criteria: women at least 30 years of age, BMI of 25‐50, and at baseline reported 10 or more UI episodes in a 7‐day diary of voiding. Previous medical therapy for incontinence or obesity did not affect eligibility Diagnostic groups: Group I: stress alone = 8; stress‐predominant (at least 2/3 of the total number of episodes were stress episodes) = 36; urge alone = 33; urge‐predominant (at least 2/3 of the total number of episodes were urge episodes) = 71 MUI with no predominant type = 78; Group II: stress alone = 10; stress‐predominant = 21; urge alone = 8; urge‐predominant = 37; MUI with no predominant type = 36 | |
| Interventions | At randomisation, all participants were given a self‐help behavioural‐treatment booklet with instructions for improving bladder control (including pelvic floor muscle training). Incontinence was not discussed further with either group Group I: weight loss programme designed to produce an average loss of 7% to 9% of initial body weight within the first 6 months of the program, modelled after that used in 2 large clinical trials: the Look AHEAD (Action for Health in Diabetes), and the DPP (Diabetes Prevention Program). Participants met weekly for 6 months in groups of 10‐15 for 1‐hour sessions that were led by experts in nutrition, exercise, and behaviour change and were based on a structured protocol. Given a standard reduced‐calorie diet (1200‐1500 kcal per day), with a goal of providing no more than 30% of the calories from fat. To improve adherence, the participants were provided with sample meal plans and were given vouchers for a meal‐replacement product (Slim‐Fast) to be used for 2 meals a day during months 1‐4 and for 1 meal a day thereafter. Encouraged to increase physical activity (brisk walking or activities of similar intensity) gradually until active for at least 200 minutes each week. Behavioural skills, including self‐monitoring, stimulus control, and problem‐solving, were emphasized Treatment duration: 6 months Training provided by: experts in nutrition, exercise, and behaviour change Group II: structured education programme (control): 4 education sessions at months 1, 2, 3, and 4. During these 1‐hour group sessions, which included 10‐15 women, general information was presented about weight loss, physical activity, and healthful eating habits, according to a structured protocol Co‐intervention: see exclusion criteria Compliance (mean weight, kg (SD)): Group I: baseline = 98 (17); 6 months = 90 (17); Group II: baseline = 95 (16); 6 months = 94 (17) Compliance (weight % change(95% CI)): Group I: 6 months = ‐8.0 (‐9.0 to ‐ ‐7.0); 12 months = ‐7.5 (‐8.6 to ‐ ‐6.4); 18 months = ‐5.5 (‐6.7 to ‐ ‐4.3); Group II: 6 months = ‐1.6 (‐2.7 to ‐ ‐0.4); 12 months = ‐1.7 (‐3.2 to ‐ ‐0.2); 18 months = ‐1.6 (‐3.4 to ‐ 0.7) | |
| Outcomes | Improvement rates based on participant's report (women reported that overall leakage was better or much better) Cure rates based on quantification of symptoms (defined as number of women reporting a 100% reduction in weekly UI episodes recorded by 7‐day voiding diary) Improvement rates based on quantification of symptoms (defined as number of women with a 70%‐100% reduction in weekly UI episodes recorded by 7‐day voiding diary) Change in the number of incontinent episodes per week | |
| Notes | Funding:the National Institute of Diabetes and Digestive and Kidney Diseases and the Office of Research on Women’s Health | |
| Risk of bias | ||
| Bias | Authors' judgement | Support for judgement |
| Random sequence generation (selection bias) | Low risk | Quote: "Randomization was performed with the use of randomly permuted blocks of three or six, stratified according to clinical center" |
| Allocation concealment (selection bias) | Low risk | Quote: "... random assignment [was] concealed in tamper‐proof envelopes" |
| Blinding of participants and personnel (performance bias) | High risk | Quote: "The participants were aware of their treatment assignment ..." |
| Blinding of outcome assessment (detection bias) | Low risk | Quote: "... the staff members who collected the outcome data were not" aware of their treatment assignment |
| Incomplete outcome data (attrition bias) | Low risk | Quote: "Baseline variables, including age, race, parity, BMI, type of incontinence, frequency of incontinence episodes, and pad weight were not significantly associated with the retention of participants at 6 months". Also, multiple imputation methods were used for missing data The study stated that "Participants who dropped out of the study had a higher number of baseline UI episodes than completers ... but dropouts in the intervention and control groups did not differ" (Wing 2010b) |
| Selective reporting (reporting bias) | Unclear risk | Insufficient information available. Reported outcomes were specified in the methods section |
| Other bias | Unclear risk | Insufficient information available |
| Methods | Design: cross‐over trial with random allocation to the order in which participants increased or decreased decaffeinated fluids in weeks 3 or 4 Recruitment period: not stated Power calculation: performed | |
| Participants | Number of participants randomized: 110 women were approached to enter the study, 26 refused, the remaining 84 were included in the study (by incontinence type: USI = 48; IDO = 36) Gender: female BMI: not stated Ethnicity: not stated Education: not stated Employment status: not stated Severity of symptoms: not stated Inclusion criteria: women with USI or IDO: women in the IDO group had been referred for investigation of symptoms of frequency, urgency and urgency incontinence, and women with USI had been referred because of leakage secondary to coughing and exercise; the USI group was naive to surgery Exclusion criteria: urinary tract infection, hepatic, cardiac or renal disease, diabetes mellitus; those on anti‐depressants, anticholinergics or diuretics Diagnostic groups: USI = 48; IDO = 36 | |
| Interventions | Treatment duration: 4 weeks Week 1: participants drank normally (baseline) Week 2: all participants drank normally, but only caffeine‐free fluids Weeks 3 and 4: participants were randomized to either increasing caffeine‐free fluids to 3 L (20 cups) per day for a week followed by a week of reducing caffeine‐free fluids to 750 ml (5 cups) per day, or vice versa. Results from the weeks with increased and decreased fluids were compared. Urine osmolality was measured at weekly clinic visit to assess compliance Detailed urinary diaries that included information concerning episodes of urgency and leakage were kept for each day of the 4‐week study period. A reason for randomising the order of increased or decreased fluid intake was to counter the placebo effect (e.g. a bladder training effect) of keeping urinary diaries Co‐interventions: not stated Compliance (mean fluid intake per day, ml; all women with USI or IDO): week 1 = 1639 ml; week 2 with caffeine‐free fluids = 1630 ml; week increasing fluid = 2673 ml; week decreasing fluid: 872 ml | |
| Outcomes | Condition‐specific quality of life Adverse effects Number of incontinent episodes in 24 hours | |
| Notes | Funding: not stated | |
| Risk of bias | ||
| Bias | Authors' judgement | Support for judgement |
| Random sequence generation (selection bias) | Unclear risk | Quote: "randomized in the order in which [participants] increased and decreased fluids" |
| Allocation concealment (selection bias) | Unclear risk | Not mentioned |
| Blinding of participants and personnel (performance bias) | High risk | Not mentioned but unlikely |
| Blinding of outcome assessment (detection bias) | Unclear risk | Not mentioned |
| Incomplete outcome data (attrition bias) | Unclear risk | Data not available for 15 (18%) of 84 participants enrolled. Reasons for this were not provided |
| Selective reporting (reporting bias) | Unclear risk | Insufficient information available. Reported outcomes were specified in the methods section |
| Other bias | Unclear risk | Insufficient information available |
| Methods | Design: cross‐over trial with random allocation to the order in which participants consumed caffeinated or caffeine‐free fluids (feasibility study) Recruitment period: not reported Power calculation: not reported | |
| Participants | Number of participants randomized: total = 14 Gender: female BMI: not reported Ethnicity: not reported Education: not reported Employment status: not reported Severity of symptoms: not reported Inclusion criteria: women aged > 18 years with newly diagnosed OAB, experiencing > 7 voids per day and > 2 episodes per night, self‐rated urgency and/or UUI with or without stress incontinent symptoms, and consuming > 2 caffeinated drinks per day (minimum 60 mg caffeine per 24 hours) Diagnositic groups: OAB with or without UI | |
| Interventions | All participants underwent 2 x 2‐week periods of caffeinated and caffeine‐free fluid intake with the 2 periods separated by a 14‐day washout period. Before starting their assigned period, participants took part in a run‐In period of caffeine withdrawal, during which they were requested to reduce their caffeine intake by substituting one cup of caffeinated tea or coffee with decaffeinated every other day Co‐interventions: not reported Compliance: "2 participants did not comply with caffeine substitution" based on caffeine levels from saliva samples | |
| Outcomes | ICIQ‐OAB; ICIQ‐OABqol Number of incontinent episodes (3‐day bladder diary) | |
| Notes | Available as abstract only Funding: not reported | |
| Risk of bias | ||
| Bias | Authors' judgement | Support for judgement |
| Random sequence generation (selection bias) | Low risk | Quote: "… randomized … via random number generator" |
| Allocation concealment (selection bias) | Unclear risk | No information available |
| Blinding of participants and personnel (performance bias) | High risk | Not mentioned but unlikely |
| Blinding of outcome assessment (detection bias) | Unclear risk | No information available |
| Incomplete outcome data (attrition bias) | Unclear risk | 14 randomized and 11 completed the follow‐up (79%). No further details |
| Selective reporting (reporting bias) | Unclear risk | Insufficient information |
| Other bias | High risk | 2 participants did not comply with caffeine substitution |
Abbreviations
BMI: body mass index
DPP: Diabetes Prevention Program
FVC: frequency volume charts
HbA1c: glycated haemoglobin
ICIQ‐OAB: Internatioanal Consultation on Incontinence Questionnaire Overactive Bladder
ICIA‐OABqol:Internatioanal Consultation on Incontinence Questionnaire Overactive Bladder Symptoms Quality of Life
IDO: idiopathic detrusor overactivity
MUI: mixed urinary incontinence
OAB: overactive bladder
oz: (fluid) ounce
RCT: randomized controlled trial
SD: standard deviation
SUI: stress urinary incontinence
UI: urinary incontinence
USI: urodynamic stress incontinence
UUI: urgency urinary incontinence
Characteristics of excluded studies [ordered by study ID]
| Study | Reason for exclusion |
| Anticholinergic medications plus behavioural training versus anticholinergic medications alone. Behavioural training included specific fluid management as well as pelvic floor muscle control and exercises, urge suppression, and delayed voiding. Study conducted by the Urinary Incontinence Treatment Network (UITN). Complex interventions for which we could not separate the effect of lifestyle interventions | |
| Not a relevant population. Healthy volunteers (N = 80). Caffeine tablet versus placebo. Outcome: perceived change in LUTS | |
| Self‐management plus standard care versus standard care. Self‐management included lifestyle (fluid, caffeine, alcohol), bladder training and toileting. Complex intervention meant we could not separate the effect of lifestyle interventions | |
| BMC versus control. BMC = lifestyle change, if needed; if lifestyle not needed, bladder training (BT); if BT not effective, PFMT + biofeedback (BF). Complex intervention meant we could not separate the effect of lifestyle interventions | |
| Physiotherapy versus control. Physiotherapy treatment combined 1) PFMT and other exercises with 2) dietary recommendations/changes and constipation management. We could not separate the effect of (2) from (1) | |
| Not a relevant intervention. PFMT (for all UI) plus bladder training (for urge UI) versus control | |
| Tolterodine plus health education intervention versus tolterodine alone. N = 84. Abstract only, so no details of health education intervention available. Possibly related to Herschorn 2004 | |
| Health education intervention plus tolterodine versus tolterodine alone. Participants received a behavioural modification information sheet with multiple components including: 1) fluid intake regulation, 2) caffeine limitation, 3) scheduled toileting, 4) bladder stretching, 5) PFMT, and 6) urge suppression. We could not separate the effect of 1) and 2) from the rest | |
| Not a relevant intervention. Electrical stimulation (ES) + 'gymnastic' versus 'gymnastic' versus ES versus sham ES. German publication | |
| Multidimensional exercise treatment, consisting of stretching, PFMT and fitness exercises. Community‐dwelling elderly Japanese women with SUI, UUI or MUI. We could not separate the effect of non‐PFMT exercise | |
| Exercise treatment with or without heat and steam generating sheet (HSGS). Exercise consisted of stretching, PFMT and fitness exercises. A 4‐arm trial comparing: 1) exercise + HSGS, 2) exercise only, 3) HSGS only, and 4) education. Community‐dwelling elderly Japanese women with stress, urge or mixed UI. We could not separate the effect of non‐PFMT exercise | |
| Described the characteristics of women participating in 2 clinical trials and explored the relationships between demographic characteristics, caffeine and fluid intake, quality of life, and severity of urine loss. No usable data | |
| Self‐monitoring including: 1) caffeine, 2) fluid intake, 3) PFMT, 4) voiding frequency, 5) constipation. We could not separate the effect of lifestyle change | |
| The study did not focus on UI, but assessed the effects of Tai Chi on physical function. The only incontinence‐related outcome was use of toilet, as part of a composite measure of "eating, dressing, bathing or using the toilet" | |
| Not a relevant population. Healthy volunteers (N = 64). Caffeine tablet versus placebo. Outcome: LUTS. Abstract only. Probably related to Bird 2005 | |
| The study did not focus on UI, but examined whether strenuous physical activity could produce pelvic floor muscle fatigue among young nulliparous women with stress UI. No outcome data on UI | |
| Not a relevant intervention. 'UroLogic' versus placebo. UroLogic is a nutritional supplement containing Equisetum arvense and Crataeva murvale | |
| Complex intervention for which we could not separate the effect of lifestyle change. BMC versus control. The three phases of BMC were: 1) self‐monitoring including fluid management and caffeine reduction; 2) bladder training; and 3) pelvic muscle exercise with biofeedback. 218 women were randomized into treatment or control. Analysis focused on 41 women who were randomized into the treatment and completed the first phase of BMC. No data were available for the control group | |
| Not a relevant population. RCT of the UI training programme, INCOndition, including training of pelvic floor muscles, bladder function and mobility, for women living in homes for the elderly. German with English abstract | |
| Lifestyle leaflet versus structured help in clinic (including BT and PFMT). Leaflet‐only interventions, without a standardised (within trial) protocol, are not eligible |
Abbreviations
BF: biofeedback
BMC: behavioural management for continence
BT: bladder training
ES: electrical stimulation
LUTS: lower urinary tract symptoms
MUI: mixed urinary incontinence
PFMT: pelvic floor muscle training
RCT: randomized controlled trial
SUI: stress urinary incontinence
UI: urinary incontinence
UUI: urgency urinary incontinence
Characteristics of studies awaiting assessment [ordered by study ID]
| Methods | RCT |
| Participants | Women with urgency incontinence |
| Interventions | Mindfulness‐based stress reduction technique and yoga (MBSR‐yoga) versus sham yoga |
| Outcomes | Change from baseline in mean number of urge incontinent episodes from pre treatment to post treatment |
| Notes | Estimated enrolment: 30 Study start date: February 2011 Primary completion date: May 2012 (final data collection date for primary outcome measure) |
| Methods | RCT |
| Participants | Overweight/obese women with UI recorded in a 3‐day diary |
| Interventions | Behavioural weight loss versus structured education programme |
| Outcomes | Change in voiding diary from baseline to 6 months in voiding diary parameters; Pelvic Floor Distress Inventory and POP‐Q |
| Notes | Enrolment: 158 Study start date: June 2008 |
| Methods | RCT |
| Participants | Patients with OAB |
| Interventions | Low versus normal versus high fluid intake |
| Outcomes | Urine osmolality; PPIUS (Perception of Intensity of Urgency Scale) urge‐score |
| Notes | Enrollment: 0 Study start date: July 2009 Primary completion date: December 2010 (final data collection date for primary outcome measure) |
| Methods | RCT |
| Participants | Women with UI or OAB |
| Interventions | Yoga therapy versus control |
| Outcomes | Change in the number of incontinence episodes over 7 days from pre treatment to post treatment |
| Notes | Enrollment: 20 Study start date: August 2012 Study completion date: December 2012 |
| Methods | RCT |
| Participants | Older women with UI |
| Interventions | Vitamin D supplementation versus placebo |
| Outcomes | Change in the number of incontinent episodes on a 7‐day bladder diary from the baseline evaluation to the final visit at 12‐weeks |
| Notes | Estimated enrollment: 100 Study start date: January 2014 Estimated study completion date: November 2015 |
| Methods | RCT |
| Participants | Individuals with incontinence due to stress or OAB |
| Interventions | Aerobic pelvic floor muscle exercise versus targeted Pilates exercise group |
| Outcomes | Change in SEAPI quality of life score from baseline |
| Notes | Enrolment: 80 Poster only, minimal detail available |
| Methods | Randomised cross‐over trial |
| Participants | Women with newly diagnosed OAB and history of caffeine consumption |
| Interventions | Group A: 14‐day caffeinated drink period followed by a 14‐day decaffeinated drink period |
| Outcomes | Episodes of urgency and frequency, volume per void and incontinence recorded in a 3‐day diary |
| Notes | Enrolment: 11 |
Abbreviations
OAB: overactive bladder
POP‐Q: Pelvic Organ Prolapse Quantification System
RCT: randomized controlled trial
SEAPI: stress‐related leak (S), emptying ability (E), anatomy (A), protection (P), inhibition (I)
UI: urinary incontinence
Characteristics of ongoing studies [ordered by study ID]
| Trial name or title | Exercise Training in Pregnancy (ETIP) for obese women |
| Methods | Design: randomised controlled trial with 2 parallel arms (intervention versus control) Study centre: the Norwegian University of Science and Technology and the St Olav's Hospital, Trondheim University Hospital |
| Participants | 150 previously sedentary, pregnant women with a pre‐pregnancy BMI at or above 30 kg/m² |
| Interventions | Intervention: organised exercise training 3 times per week Control: standard antenatal care |
| Outcomes | The main outcome measure will be weight gain from baseline to delivery Secondary outcomes include incontinence |
| Starting date | September 2010. Recruitment anticipated until the end of 2012 |
| Contact information | Trine T Moholdt, Department of Publich Health and General Practice, Norwegian University of Science and Technology, Trondheim, Norway. Email: [email protected] |
| Notes |
Abbreviation
BMI: body mass index
Data and analyses
| Outcome or subgroup title | No. of studies | No. of participants | Statistical method | Effect size | ||||||||||||||||||||||||||||||||||||||||||||||||||||||||||||||||||||||||||||||||||||||||||||||||||||||||||||||||||||||||||||||||||||||||||||
| 1 Improvement rates based on women's perception (all types UI) Show forest plot | 1 | Risk Ratio (M‐H, Fixed, 95% CI) | Totals not selected | |||||||||||||||||||||||||||||||||||||||||||||||||||||||||||||||||||||||||||||||||||||||||||||||||||||||||||||||||||||||||||||||||||||||||||||
| Analysis 1.1  Comparison 1 Weight loss versus no active intervention, Outcome 1 Improvement rates based on women's perception (all types UI). | ||||||||||||||||||||||||||||||||||||||||||||||||||||||||||||||||||||||||||||||||||||||||||||||||||||||||||||||||||||||||||||||||||||||||||||||||
| 1.1 At 6 months | 1 | Risk Ratio (M‐H, Fixed, 95% CI) | 0.0 [0.0, 0.0] | |||||||||||||||||||||||||||||||||||||||||||||||||||||||||||||||||||||||||||||||||||||||||||||||||||||||||||||||||||||||||||||||||||||||||||||
| 2 Improvement rates based on women's perception (all types UI) Show forest plot | Other data | No numeric data | ||||||||||||||||||||||||||||||||||||||||||||||||||||||||||||||||||||||||||||||||||||||||||||||||||||||||||||||||||||||||||||||||||||||||||||||
| Analysis 1.2
Comparison 1 Weight loss versus no active intervention, Outcome 2 Improvement rates based on women's perception (all types UI). | ||||||||||||||||||||||||||||||||||||||||||||||||||||||||||||||||||||||||||||||||||||||||||||||||||||||||||||||||||||||||||||||||||||||||||||||||
| 3 Quality of life and symptom scores Show forest plot | Other data | No numeric data | ||||||||||||||||||||||||||||||||||||||||||||||||||||||||||||||||||||||||||||||||||||||||||||||||||||||||||||||||||||||||||||||||||||||||||||||
| Analysis 1.3
Comparison 1 Weight loss versus no active intervention, Outcome 3 Quality of life and symptom scores. | ||||||||||||||||||||||||||||||||||||||||||||||||||||||||||||||||||||||||||||||||||||||||||||||||||||||||||||||||||||||||||||||||||||||||||||||||
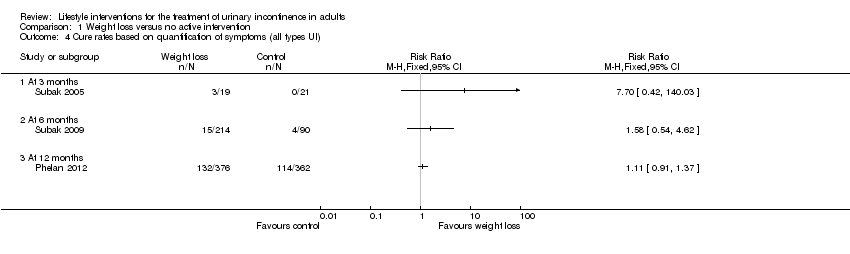
| 4 Cure rates based on quantification of symptoms (all types UI) Show forest plot | 3 | Risk Ratio (M‐H, Fixed, 95% CI) | Totals not selected | |||||||||||||||||||||||||||||||||||||||||||||||||||||||||||||||||||||||||||||||||||||||||||||||||||||||||||||||||||||||||||||||||||||||||||||
| Analysis 1.4  Comparison 1 Weight loss versus no active intervention, Outcome 4 Cure rates based on quantification of symptoms (all types UI). | ||||||||||||||||||||||||||||||||||||||||||||||||||||||||||||||||||||||||||||||||||||||||||||||||||||||||||||||||||||||||||||||||||||||||||||||||
| 4.1 At 3 months | 1 | Risk Ratio (M‐H, Fixed, 95% CI) | 0.0 [0.0, 0.0] | |||||||||||||||||||||||||||||||||||||||||||||||||||||||||||||||||||||||||||||||||||||||||||||||||||||||||||||||||||||||||||||||||||||||||||||
| 4.2 At 6 months | 1 | Risk Ratio (M‐H, Fixed, 95% CI) | 0.0 [0.0, 0.0] | |||||||||||||||||||||||||||||||||||||||||||||||||||||||||||||||||||||||||||||||||||||||||||||||||||||||||||||||||||||||||||||||||||||||||||||
| 4.3 At 12 months | 1 | Risk Ratio (M‐H, Fixed, 95% CI) | 0.0 [0.0, 0.0] | |||||||||||||||||||||||||||||||||||||||||||||||||||||||||||||||||||||||||||||||||||||||||||||||||||||||||||||||||||||||||||||||||||||||||||||
| 5 Cure rates based on quantification of symptoms (by type of UI) Show forest plot | Other data | No numeric data | ||||||||||||||||||||||||||||||||||||||||||||||||||||||||||||||||||||||||||||||||||||||||||||||||||||||||||||||||||||||||||||||||||||||||||||||
| Analysis 1.5
Comparison 1 Weight loss versus no active intervention, Outcome 5 Cure rates based on quantification of symptoms (by type of UI). | ||||||||||||||||||||||||||||||||||||||||||||||||||||||||||||||||||||||||||||||||||||||||||||||||||||||||||||||||||||||||||||||||||||||||||||||||
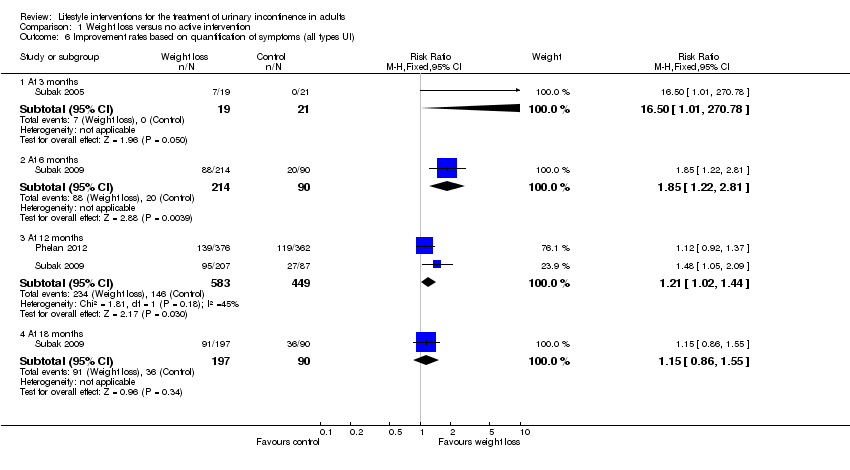
| 6 Improvement rates based on quantification of symptoms (all types UI) Show forest plot | 3 | Risk Ratio (M‐H, Fixed, 95% CI) | Subtotals only | |||||||||||||||||||||||||||||||||||||||||||||||||||||||||||||||||||||||||||||||||||||||||||||||||||||||||||||||||||||||||||||||||||||||||||||
| Analysis 1.6  Comparison 1 Weight loss versus no active intervention, Outcome 6 Improvement rates based on quantification of symptoms (all types UI). | ||||||||||||||||||||||||||||||||||||||||||||||||||||||||||||||||||||||||||||||||||||||||||||||||||||||||||||||||||||||||||||||||||||||||||||||||
| 6.1 At 3 months | 1 | 40 | Risk Ratio (M‐H, Fixed, 95% CI) | 16.5 [1.01, 270.78] | ||||||||||||||||||||||||||||||||||||||||||||||||||||||||||||||||||||||||||||||||||||||||||||||||||||||||||||||||||||||||||||||||||||||||||||
| 6.2 At 6 months | 1 | 304 | Risk Ratio (M‐H, Fixed, 95% CI) | 1.85 [1.22, 2.81] | ||||||||||||||||||||||||||||||||||||||||||||||||||||||||||||||||||||||||||||||||||||||||||||||||||||||||||||||||||||||||||||||||||||||||||||
| 6.3 At 12 months | 2 | 1032 | Risk Ratio (M‐H, Fixed, 95% CI) | 1.21 [1.02, 1.44] | ||||||||||||||||||||||||||||||||||||||||||||||||||||||||||||||||||||||||||||||||||||||||||||||||||||||||||||||||||||||||||||||||||||||||||||
| 6.4 At 18 months | 1 | 287 | Risk Ratio (M‐H, Fixed, 95% CI) | 1.15 [0.86, 1.55] | ||||||||||||||||||||||||||||||||||||||||||||||||||||||||||||||||||||||||||||||||||||||||||||||||||||||||||||||||||||||||||||||||||||||||||||
| 7 Improvement rates based on quantification of symptoms (by type of UI) Show forest plot | Other data | No numeric data | ||||||||||||||||||||||||||||||||||||||||||||||||||||||||||||||||||||||||||||||||||||||||||||||||||||||||||||||||||||||||||||||||||||||||||||||
| Analysis 1.7
Comparison 1 Weight loss versus no active intervention, Outcome 7 Improvement rates based on quantification of symptoms (by type of UI). | ||||||||||||||||||||||||||||||||||||||||||||||||||||||||||||||||||||||||||||||||||||||||||||||||||||||||||||||||||||||||||||||||||||||||||||||||
| 8 Prevalence of weekly urinary incontinence after intervention (all types UI) Show forest plot | 2 | Risk Ratio (M‐H, Fixed, 95% CI) | Totals not selected | |||||||||||||||||||||||||||||||||||||||||||||||||||||||||||||||||||||||||||||||||||||||||||||||||||||||||||||||||||||||||||||||||||||||||||||
| Analysis 1.8  Comparison 1 Weight loss versus no active intervention, Outcome 8 Prevalence of weekly urinary incontinence after intervention (all types UI). | ||||||||||||||||||||||||||||||||||||||||||||||||||||||||||||||||||||||||||||||||||||||||||||||||||||||||||||||||||||||||||||||||||||||||||||||||
| 8.1 At 12 months | 1 | Risk Ratio (M‐H, Fixed, 95% CI) | 0.0 [0.0, 0.0] | |||||||||||||||||||||||||||||||||||||||||||||||||||||||||||||||||||||||||||||||||||||||||||||||||||||||||||||||||||||||||||||||||||||||||||||
| 8.2 At 2.8 years | 1 | Risk Ratio (M‐H, Fixed, 95% CI) | 0.0 [0.0, 0.0] | |||||||||||||||||||||||||||||||||||||||||||||||||||||||||||||||||||||||||||||||||||||||||||||||||||||||||||||||||||||||||||||||||||||||||||||
| 9 Prevalence of weekly urinary incontinence after intervention (by type of UI) Show forest plot | Other data | No numeric data | ||||||||||||||||||||||||||||||||||||||||||||||||||||||||||||||||||||||||||||||||||||||||||||||||||||||||||||||||||||||||||||||||||||||||||||||
| Analysis 1.9
Comparison 1 Weight loss versus no active intervention, Outcome 9 Prevalence of weekly urinary incontinence after intervention (by type of UI). | ||||||||||||||||||||||||||||||||||||||||||||||||||||||||||||||||||||||||||||||||||||||||||||||||||||||||||||||||||||||||||||||||||||||||||||||||
| 10 Incontinent episodes per week (% change from baseline; all UI types) Show forest plot | 1 | Mean Difference (IV, Fixed, 95% CI) | Totals not selected | |||||||||||||||||||||||||||||||||||||||||||||||||||||||||||||||||||||||||||||||||||||||||||||||||||||||||||||||||||||||||||||||||||||||||||||
| Analysis 1.10  Comparison 1 Weight loss versus no active intervention, Outcome 10 Incontinent episodes per week (% change from baseline; all UI types). | ||||||||||||||||||||||||||||||||||||||||||||||||||||||||||||||||||||||||||||||||||||||||||||||||||||||||||||||||||||||||||||||||||||||||||||||||
| 10.1 At 6 months | 1 | Mean Difference (IV, Fixed, 95% CI) | 0.0 [0.0, 0.0] | |||||||||||||||||||||||||||||||||||||||||||||||||||||||||||||||||||||||||||||||||||||||||||||||||||||||||||||||||||||||||||||||||||||||||||||
| 10.2 At 12 months | 1 | Mean Difference (IV, Fixed, 95% CI) | 0.0 [0.0, 0.0] | |||||||||||||||||||||||||||||||||||||||||||||||||||||||||||||||||||||||||||||||||||||||||||||||||||||||||||||||||||||||||||||||||||||||||||||
| 10.3 At 18 months | 1 | Mean Difference (IV, Fixed, 95% CI) | 0.0 [0.0, 0.0] | |||||||||||||||||||||||||||||||||||||||||||||||||||||||||||||||||||||||||||||||||||||||||||||||||||||||||||||||||||||||||||||||||||||||||||||
| 11 Incontinence episodes per week (% change from baseline; by type of UI) Show forest plot | Other data | No numeric data | ||||||||||||||||||||||||||||||||||||||||||||||||||||||||||||||||||||||||||||||||||||||||||||||||||||||||||||||||||||||||||||||||||||||||||||||
| Analysis 1.11
Comparison 1 Weight loss versus no active intervention, Outcome 11 Incontinence episodes per week (% change from baseline; by type of UI). | ||||||||||||||||||||||||||||||||||||||||||||||||||||||||||||||||||||||||||||||||||||||||||||||||||||||||||||||||||||||||||||||||||||||||||||||||
| Outcome or subgroup title | No. of studies | No. of participants | Statistical method | Effect size | ||||||||||||||||||||||||||||||||||||
| 1 Number of women with UI episodes: soy‐rich diet versus control Show forest plot | Other data | No numeric data | ||||||||||||||||||||||||||||||||||||||
| Analysis 2.1
Comparison 2 Soy‐rich diet versus control, Outcome 1 Number of women with UI episodes: soy‐rich diet versus control. | ||||||||||||||||||||||||||||||||||||||||
| 2 Mean UI symptom scores (SD; 0 = none, 1 = mild, 2 = moderate, 3 = severe): soy‐rich diet versus control Show forest plot | Other data | No numeric data | ||||||||||||||||||||||||||||||||||||||
| Analysis 2.2
Comparison 2 Soy‐rich diet versus control, Outcome 2 Mean UI symptom scores (SD; 0 = none, 1 = mild, 2 = moderate, 3 = severe): soy‐rich diet versus control. | ||||||||||||||||||||||||||||||||||||||||
| Outcome or subgroup title | No. of studies | No. of participants | Statistical method | Effect size | |||||||||||||||||||||||||||||||||||
| 1 Median number of daily UI episodes (IQR) Show forest plot | Other data | No numeric data | |||||||||||||||||||||||||||||||||||||
| Analysis 3.1
Comparison 3 Increase in fluid intake versus decrease in fluid intake, Outcome 1 Median number of daily UI episodes (IQR). | |||||||||||||||||||||||||||||||||||||||
| 2 Median number of daily UI episodes (range) Show forest plot | Other data | No numeric data | |||||||||||||||||||||||||||||||||||||
| Analysis 3.2
Comparison 3 Increase in fluid intake versus decrease in fluid intake, Outcome 2 Median number of daily UI episodes (range). | |||||||||||||||||||||||||||||||||||||||
| 3 Mean number of daily UI episodes (any UI) Show forest plot | Other data | No numeric data | |||||||||||||||||||||||||||||||||||||
| Analysis 3.3
Comparison 3 Increase in fluid intake versus decrease in fluid intake, Outcome 3 Mean number of daily UI episodes (any UI). | |||||||||||||||||||||||||||||||||||||||
| Outcome or subgroup title | No. of studies | No. of participants | Statistical method | Effect size | ||||||||||||||||||||||||||||||||||||||||
| 1 Mean quality of life scores Show forest plot | Other data | No numeric data | ||||||||||||||||||||||||||||||||||||||||||
| Analysis 4.1
Comparison 4 Caffeine reduction versus control, Outcome 1 Mean quality of life scores. | ||||||||||||||||||||||||||||||||||||||||||||
| 2 Mean number of UI episodes per 24 hours (SD) Show forest plot | 1 | Mean Difference (IV, Fixed, 95% CI) | Totals not selected | |||||||||||||||||||||||||||||||||||||||||
| Analysis 4.2  Comparison 4 Caffeine reduction versus control, Outcome 2 Mean number of UI episodes per 24 hours (SD). | ||||||||||||||||||||||||||||||||||||||||||||
| Outcome or subgroup title | No. of studies | No. of participants | Statistical method | Effect size |
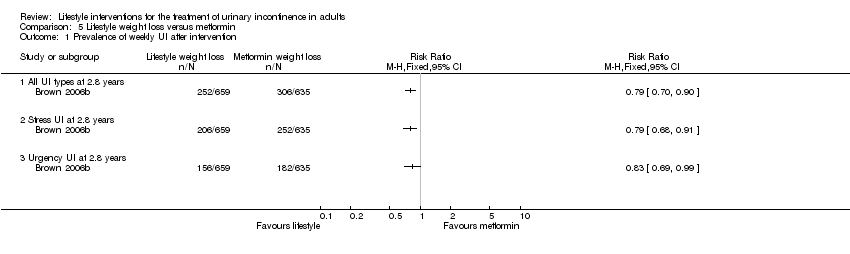
| 1 Prevalence of weekly UI after intervention Show forest plot | 1 | Risk Ratio (M‐H, Fixed, 95% CI) | Totals not selected | |
| Analysis 5.1  Comparison 5 Lifestyle weight loss versus metformin, Outcome 1 Prevalence of weekly UI after intervention. | ||||
| 1.1 All UI types at 2.8 years | 1 | Risk Ratio (M‐H, Fixed, 95% CI) | 0.0 [0.0, 0.0] | |
| 1.2 Stress UI at 2.8 years | 1 | Risk Ratio (M‐H, Fixed, 95% CI) | 0.0 [0.0, 0.0] | |
| 1.3 Urgency UI at 2.8 years | 1 | Risk Ratio (M‐H, Fixed, 95% CI) | 0.0 [0.0, 0.0] | |

PRISMA study flow diagram

Risk of bias graph: review authors' judgements about each risk of bias item presented as percentages across all included studies
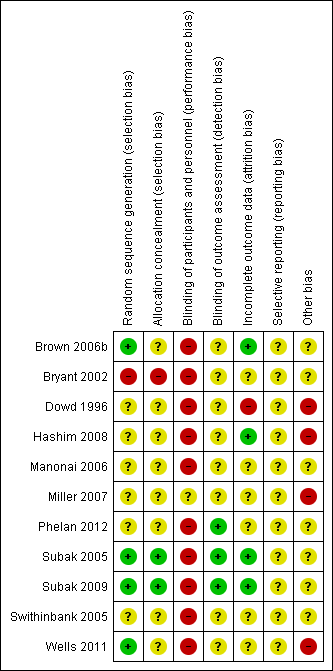
Risk of bias summary: review authors' judgements about each risk of bias item for each included study

Comparison 1 Weight loss versus no active intervention, Outcome 1 Improvement rates based on women's perception (all types UI).
| Study | Outcome | Weight loss | Weight loss | Weight loss | Control | Control | Control | Reported P value |
| Subak 2009 | At 12 months (N = 298) | Not reported | Not reported | 75 | Not reported | Not reported | 68 | 0.2 |
| Subak 2009 | At 18 months (N = 291) | Not reported | Not reported | 75 | Not reported | Not reported | 62 | 0.02 |
Comparison 1 Weight loss versus no active intervention, Outcome 2 Improvement rates based on women's perception (all types UI).
| Study | Outcome | Weight loss (total N) | Weight loss, median (IQR) | Control (total N) | Control, median (IQR) | Reported P value |
| Subak 2005 | 3 months | |||||
| Subak 2005 | Incontinence Impact Questionnaire (score range 0‐400 with lower score indicating better quality of life) | 19 | 37 (11 to 86) | 21 | 89 (56 to 136) | 0.01 |
| Subak 2005 | Urogenital Distress Inventory (score range 0‐300 with lower scores indicating less distress) | 19 | 104 (67 to 122) | 21 | 195 (156 to 228) | <0.0001 |
| Subak 2005 | SF‐36 physical component (higher scores indicate better quality of life) | 19 | 55 (49 to 58) | 21 | 47 (41 to 50) | 0.003 |
| Subak 2005 | SF‐36 mental component (higher scores indicate better quality of life) | 19 | 48 (46 to 49) | 21 | 51 (48 to 54) | 0.09 |
Comparison 1 Weight loss versus no active intervention, Outcome 3 Quality of life and symptom scores.
Comparison 1 Weight loss versus no active intervention, Outcome 4 Cure rates based on quantification of symptoms (all types UI).
| Study | Outcome | Weight loss (number | Weight loss | Weight loss (%) | Control (number | Control (total N) | Control (%) | Reported P value |
| Subak 2009 | Stress UI at 6 months | Not reported | Not reported | 27 | Not reported | Not reported | 15 | 0.004 |
| Subak 2009 | Urgency UI at 6 months | Not reported | Not reported | 19 | Not reported | Not reported | 11 | 0.02 |
Comparison 1 Weight loss versus no active intervention, Outcome 5 Cure rates based on quantification of symptoms (by type of UI).
Comparison 1 Weight loss versus no active intervention, Outcome 6 Improvement rates based on quantification of symptoms (all types UI).
| Study | Outcome | Weight loss | Weight loss | Weight loss | Control | Control | Control | Reported P value |
| Subak 2009 | Stress UI at 6 months | Not reported | Not reported | 51 | Not reported | Not reported | 34 | 0.01 |
| Subak 2009 | Urgency UI at 6 months | Not reported | Not reported | 41 | Not reported | Not reported | 29 | 0.04 |
| Subak 2009 | Stress UI at 6 months | Not reported | Not reported | 51 | Not reported | Not reported | 34 | 0.01 |
| Subak 2009 | Urgency UI at 6 months | Not reported | Not reported | 41 | Not reported | Not reported | 29 | 0.04 |
| Subak 2009 | Stress UI at 18 months | Not reported | Not reported | 61 | Not reported | Not reported | 62 | 0.92 |
| Subak 2009 | Urgency UI at 18 months | Not reported | Not reported | 47 | Not reported | Not reported | 34 | 0.03 |
Comparison 1 Weight loss versus no active intervention, Outcome 7 Improvement rates based on quantification of symptoms (by type of UI).

Comparison 1 Weight loss versus no active intervention, Outcome 8 Prevalence of weekly urinary incontinence after intervention (all types UI).
| Study | Outcome | Weight loss (number | Weight loss (total N) | Weight loss (%) | Control (number | Control (total N) | Control (%) | Reported P value | Reported adjusted odds ratio (95% CI) |
| Brown 2006b | SUI at 2.8 years | 206 | 659 | 31 | 242 | 660 | 37 | 0.04 | 0.80 (0.64 to 1.01) |
| Brown 2006b | UUI at 2.8 years | 156 | 659 | 24 | 169 | 660 | 26 | 0.41 | Not reported |
| Phelan 2012 | SUI at 1 year | 145 | 1385 | 11 | 173 | 1354 | 13 | 0.07 | 0.73 (0.55 to 0.96) |
| Phelan 2012 | UUI at 1 year | Not reported | Not reported | Not reported | Not reported | Not reported | Not reported | Not reported | 0.93 (0.70 to 1.23) |
Comparison 1 Weight loss versus no active intervention, Outcome 9 Prevalence of weekly urinary incontinence after intervention (by type of UI).

Comparison 1 Weight loss versus no active intervention, Outcome 10 Incontinent episodes per week (% change from baseline; all UI types).
| Study | Outcome | Weight loss (total N) | Weight loss | Control (total N) | Control (% change from baseline) | Reported P value |
| Subak 2005 | All UI at 3 months, median (IQR) | 19 | ‐60 (‐89 to ‐30) | 21 | ‐15 (‐25 to 9) | 0.0005 |
| Subak 2005 | Stress UI at 3 months, median (IQR) | 19 | ‐92 (‐100 to ‐66) | 21 | 5 (‐63 to 33) | 0.003 |
| Subak 2005 | Urgency UI at 3 months, median (IQR) | 19 | ‐70 (‐100 to ‐16) | 21 | ‐11 (‐67 to 69) | 0.03 |
| Subak 2005 | ||||||
| Subak 2005 | ||||||
| Subak 2005 | ||||||
| Subak 2005 | ||||||
| Subak 2005 | ||||||
| Subak 2005 | ||||||
| Subak 2009 | All UI at 6 months, mean (95% CI) | 214 | ‐47 (‐54 to ‐40) | 90 | ‐28 (‐41 to ‐13) | 0.01 |
| Subak 2009 | Stress UI at 6 months, mean (95% CI) | 214 | ‐58 (‐67 to ‐46) | 90 | ‐33 (‐50 to ‐9) | 0.02 |
| Subak 2009 | Urgency UI at 6 months, mean (95% CI) | 214 | ‐42 (‐51 to ‐32) | 90 | ‐26 (‐44 to ‐3) | 0.14 |
| Subak 2009 | All UI at 12 months, mean (95% CI) | 207 | ‐57 (‐63 to ‐50) | 87 | ‐45 (‐56 to ‐32) | 0.08 |
| Subak 2009 | Stress UI at 12 months, mean (95% CI) | 207 | ‐66 (‐71 to ‐59) | 87 | ‐45 (‐59 to ‐27) | <0.001 |
| Subak 2009 | Urgency UI at 12 months, mean (95% CI) | 207 | ‐50 (‐59 to ‐39) | 87 | ‐48 (‐63 to ‐29) | 0.87 |
| Subak 2009 | All UI at 18 months, mean (95% CI) | 197 | ‐62 (‐67 to ‐55) | 90 | ‐55 (‐65 to ‐43) | 0.3 |
| Subak 2009 | Stress UI at 18 months, mean (95% CI) | 197 | ‐69 (‐76 to ‐61) | 90 | ‐62 (‐73 to ‐48) | 0.32 |
| Subak 2009 | Urgency UI at 18 months, mean (95% CI) | 197 | ‐56 (‐64 to ‐46) | 90 | ‐49 (‐64 to ‐28) | 0.46 |
Comparison 1 Weight loss versus no active intervention, Outcome 11 Incontinence episodes per week (% change from baseline; by type of UI).
| Study | Outcome | Soy‐rich diet (n/N) | Soy‐rich diet (%) | Control diet (n/N) | Control diet (%) |
| Manonai 2006 | SUI episodes: before (baseline) | 22/36 | 61 | 23/36 | 63 |
| Manonai 2006 | SUI episodes: after | 22/36 | 61 | 18/36 | 51 |
| Manonai 2006 | UUI episodes: before (baseline) | 7/36 | 19 | 4/36 | 11 |
| Manonai 2006 | UUI episodes: after | 6/36 | 17 | 8/36 | 22 |
Comparison 2 Soy‐rich diet versus control, Outcome 1 Number of women with UI episodes: soy‐rich diet versus control.
| Study | Outcome | Soy‐rich diet (n = 36) | Soy‐rich diet (n = 36) |
| Manonai 2006 | SUI episodes: before (baseline) | 0.67 (0.68) | 0.75 (0.65) |
| Manonai 2006 | SUI episodes: after | 0.72 (0.66) | 0.72 (0.74) |
| Manonai 2006 | Reported P value | > 0.05 | > 0.05 |
| Manonai 2006 | UUI episodes: before (baseline) | 0.17 (0.38) | 0.14 (0.35) |
| Manonai 2006 | UUI episodes: after | 0.19 (0.47) | 0.25 (0.50) |
| Manonai 2006 | Reported P value | > 0.05 | < 0.05 |
Comparison 2 Soy‐rich diet versus control, Outcome 2 Mean UI symptom scores (SD; 0 = none, 1 = mild, 2 = moderate, 3 = severe): soy‐rich diet versus control.
| Study | Type of UI | Baseline | Caffeine‐free baseline | Caffeine‐free | Caffeine‐free |
| Swithinbank 2005 | Urodynamic stress incontinence (SUI), n = 39 | 1.6 (0.6 to 2.8) | 0.8 (0.1 to 1.9) | 0.7 (0.3 to 3) | 0.5 (0.2 to 2.1) |
| Swithinbank 2005 | Idiopathic detrusor overactivity (IDO), n = 30 | 0.9 (0.4 to 2) | 0.6 (0.2 to 1.8) | 1.1 (0.2 to 3) | 0.5 (0.2 to 1.2) |
Comparison 3 Increase in fluid intake versus decrease in fluid intake, Outcome 1 Median number of daily UI episodes (IQR).
| Study | Randomised group | N | Median (range) | Reported P value |
| Hashim 2008 | Baseline | 24 | 0 (0, 4.8) | |
| Hashim 2008 | 25% less fluid | 24 | 0 (0, 5.5) | 1.0 |
| Hashim 2008 | 50% less fluid | 12 | 0 (0, 4.5) | 0.69 |
| Hashim 2008 | 25% more fluid | 21 | 0 (0, 10.3) | 1.00 |
| Hashim 2008 | 50% more fluid | 14 | 0 (0, 12.8) | 0.69 |
Comparison 3 Increase in fluid intake versus decrease in fluid intake, Outcome 2 Median number of daily UI episodes (range).
| Study | Time period | Maintain fluid | Increase fluid (N = 10) | Decrease fluid (N = 8) |
| Dowd 1996 | Week 1 (baseline) | 0.48 | 0.6 | 0.54 |
| Dowd 1996 | Week 2 | 0.71 | 0.61 | 0.26 |
| Dowd 1996 | Week 3 | 0.81 | 0.67 | 0.17 |
| Dowd 1996 | Week 4 | 0.57 | 0.5 | 0.14 |
| Dowd 1996 | Week 5 | 0.48 | 0.55 | 0.07 |
Comparison 3 Increase in fluid intake versus decrease in fluid intake, Outcome 3 Mean number of daily UI episodes (any UI).
| Study | Outcome | Caffeine substitution | Caffeine exposure | Reported |
| Wells 2011 | ICIQ Overactive Bladder (ICIQ‐OAB) total score (N = 11); 0‐16 overall score with greater values indicating increased symptom severity | 4.64 | 6.55 | < 0.01 |
| Wells 2011 | ICIQ Overactive Bladder Symptoms Quality of Life (ICIQ‐OABqol) score (N = 11); 25‐160 overall score with greater values indicating increased impact on quality of life | |||
| Wells 2011 | 1) How regularly bladder symptoms interfered with the ability to get a good night's rest | 2.64 | 4.09 | < 0.01 |
| Wells 2011 | 2) How often bladder symptoms caused anxiety or worry | 1.73 | 2.64 | < 0.05 |
| Wells 2011 | 3) How much bladder symptoms interfered with everyday life overall | 3.73 | 5.64 | < 0.01 |
| Wells 2011 | 4) Total scores for the ICIQ‐OABqol | 53.91 | 68.36 | 0.065 |
Comparison 4 Caffeine reduction versus control, Outcome 1 Mean quality of life scores.

Comparison 4 Caffeine reduction versus control, Outcome 2 Mean number of UI episodes per 24 hours (SD).
Comparison 5 Lifestyle weight loss versus metformin, Outcome 1 Prevalence of weekly UI after intervention.
| Weight loss compared to control for the treatment of urinary incontinence in adults | ||||||
| Patient or population: adults with urinary incontinence | ||||||
| Outcomes | Illustrative comparative risks* (95% CI) | Relative effect | No of participants | Quality of the evidence | Comments | |
| Assumed risk | Corresponding risk | |||||
| Control | Weight loss | |||||
| Cure rates by patient observation (all UI types) ‐ not reported | Not estimable | ‐ | ||||
| Improvement rates by patient observation (all UI types) | 544 per 1000 | 762 per 1000 | RR 1.4 | 304 | ⊕⊕⊝⊝ | |
| Condition‐specific quality of life | The median condition‐specific quality of life in the control groups was | The median condition‐specific quality of life in the intervention groups was | 40 | ⊕⊕⊝⊝ | ||
| Adverse effects | Not estimable | 48 | The study reported that the intervention had 'few side effects'. | |||
| Cure rates by symptom quantification (all UI types) | 315 per 1000 | 350 per 1000 | RR 1.11 | 738 | ⊕⊕⊝⊝ | |
| Improvement rates by symptom quantification (all UI type) | 325 per 1000 | 393 per 1000 | RR 1.21 | 1032 | ⊕⊕⊝⊝ | |
| Prevalence of weekly UI (all UI type) | 286 per 1000 | 252 per 1000 | RR 0.88 | 2739 | ⊕⊝⊝⊝ | |
| *The basis for the assumed risk (e.g. the median control group risk across studies) is provided in footnotes. The corresponding risk (and its 95% confidence interval) is based on the assumed risk in the comparison group and the relative effect of the intervention (and its 95% CI). | ||||||
| GRADE Working Group grades of evidence | ||||||
| 1 Risk of bias: We downgraded the evidence by one level because blinding of participants and personnel was unlikely. | ||||||
| Soy‐rich diet compared to control for the treatment of urinary incontinence in adults | ||||||
| Patient or population: adults with urinary incontinence | ||||||
| Outcomes | Illustrative comparative risks* (95% CI) | Relative effect | No of participants | Quality of the evidence | Comments | |
| Assumed risk | Corresponding risk | |||||
| Control | Soy rich diet | |||||
| Cure rates by patient observation (all UI types) ‐ not reported | Not estimable | ‐ | ||||
| Improvement rates by patient observation (all UI types) ‐ not reported | Not estimable | ‐ | ||||
| Condition‐specific quality of life ‐ not reported | Not estimable | ‐ | ||||
| Adverse effects ‐ not reported | Not estimable | ‐ | ||||
| Cure rates by symptom quantification (all UI types) ‐ not reported | Not estimable | ‐ | ||||
| Improvement rates by symptom quantification (all UI types) ‐ not reported | Not estimable | ‐ | ||||
| Incontinent episodes per week (all UI types) ‐ not reported | Not estimable | ‐ | ||||
| *The basis for the assumed risk (e.g. the median control group risk across studies) is provided in footnotes. The corresponding risk (and its 95% confidence interval) is based on the assumed risk in the comparison group and the relative effect of the intervention (and its 95% CI). | ||||||
| GRADE Working Group grades of evidence | ||||||
| Decreasing fluids compared to increasing fluids for the treatment of urinary incontinence in adults | ||||||
| Patient or population: adults with urinary incontinence | ||||||
| Outcomes | Illustrative comparative risks* (95% CI) | Relative effect | No of participants | Quality of the evidence | Comments | |
| Assumed risk | Corresponding risk | |||||
| Increasing fluids | Decreasing fluids | |||||
| Cure rates by patient observation (all UI types) ‐ not reported | Not estimable | ‐ | ||||
| Improvement rates by patient observation (all UI types) ‐ not reported | Not estimable | ‐ | ||||
| Condition‐specific quality of life | See comment | See comment | Not estimable | 69 | ⊕⊝⊝⊝ | Quality of life improved when fluid intake was decreased but the impact of incontinence on daily life did not differ significantly before or after the treatment |
| Adverse effects | See comment | See comment | Not estimable | 93 | ⊕⊝⊝⊝ | Reported adverse effects include constipation, thirst, headache and concentrated urine with decreasing fluids |
| Cure rates by symptom quantification (all UI types) ‐ not reported | Not estimable | ‐ | ||||
| Improvement rates by symptom quantification (all UI types) ‐ not reported | Not estimable | ‐ | ||||
| Incontinent episodes per week (all UI types) | See comment | See comment | Not estimable | 125 | ⊕⊝⊝⊝ | Decreasing fluid intake significantly reduced incontinent episodes in one study, no difference was found in another study and the results were inconclusive in the other study |
| *The basis for the assumed risk (e.g. the median control group risk across studies) is provided in footnotes. The corresponding risk (and its 95% confidence interval) is based on the assumed risk in the comparison group and the relative effect of the intervention (and its 95% CI). | ||||||
| GRADE Working Group grades of evidence | ||||||
| 1 Randomised cross‐over trial | ||||||
| Caffeine reduction compared to control for the treatment of urinary incontinence in adults | ||||||
| Patient or population: adults with urinary incontinence | ||||||
| Outcomes | Illustrative comparative risks* (95% CI) | Relative effect | No of participants | Quality of the evidence | Comments | |
| Assumed risk | Corresponding risk | |||||
| Control | Caffeine reduction | |||||
| Cure rates by patient observation (all UI types) ‐ not reported | Not estimable | ‐ | ||||
| Improvement rates by patient observation (all UI types) ‐ not reported | Not estimable | ‐ | ||||
| Condition‐specific quality of life | The mean condition‐specific quality of life in the control groups was | The mean condition‐specific quality of life in the intervention groups was | Not estimable | 11 | ⊕⊝⊝⊝ | |
| Adverse effects ‐ not reported | Not estimable | ‐ | ||||
| Cure rates by symptom quantification (all UI types) ‐ not reported | Not estimable | ‐ | ||||
| Improvement rates by symptom quantification (all UI types) ‐ not reported | Not estimable | ‐ | ||||
| Incontinent episodes per day (all UI types) | The mean number of incontinent episodes per day (all UI types) in the control groups was | The mean number of incontinent episodes per day (all UI types) in the intervention groups was | Not estimable | 74 | ⊕⊝⊝⊝ | |
| *The basis for the assumed risk (e.g. the median control group risk across studies) is provided in footnotes. The corresponding risk (and its 95% confidence interval) is based on the assumed risk in the comparison group and the relative effect of the intervention (and its 95% CI). | ||||||
| GRADE Working Group grades of evidence | ||||||
| 1 Randomised cross‐over trial; feasibility study. | ||||||
| Lifestyle weight loss compared to metformin weight loss for the treatment of urinary incontinence in adults | ||||||
| Patient or population: adults with urinary incontinence | ||||||
| Outcomes | Illustrative comparative risks* (95% CI) | Relative effect | No of participants | Quality of the evidence | Comments | |
| Assumed risk | Corresponding risk | |||||
| Metformin weight loss | Lifestyle weight loss | |||||
| Cure rates by patient observation (all UI types) ‐ not reported | Not estimable | ‐ | ||||
| Improvement rates by patient observation (all UI types) ‐ not reported | Not estimable | ‐ | ||||
| Condition‐specific quality of life ‐ not reported | Not estimable | ‐ | ||||
| Adverse effects ‐ not reported | Not estimable | ‐ | ||||
| Cure rates by symptom quantification (all UI types) ‐ not reported | Not estimable | ‐ | ||||
| Improvement rates by symptom quantification (all UI types) ‐ not reported | Not estimable | ‐ | ||||
| Prevalence of weekly UI (all UI types) | 482 per 1000 | 381 per 1000 | RR 0.79 | 1294 | ⊕⊝⊝⊝ | |
| *The basis for the assumed risk (e.g. the median control group risk across studies) is provided in footnotes. The corresponding risk (and its 95% confidence interval) is based on the assumed risk in the comparison group and the relative effect of the intervention (and its 95% CI). | ||||||
| GRADE Working Group grades of evidence | ||||||
| 1 Risk of bias: We downgraded the evidence by one level because blinding of participants, personnel and outcome assessors was not mentioned and may introduce bias. | ||||||
| Outcome or subgroup title | No. of studies | No. of participants | Statistical method | Effect size |
| 1 Improvement rates based on women's perception (all types UI) Show forest plot | 1 | Risk Ratio (M‐H, Fixed, 95% CI) | Totals not selected | |
| 1.1 At 6 months | 1 | Risk Ratio (M‐H, Fixed, 95% CI) | 0.0 [0.0, 0.0] | |
| 2 Improvement rates based on women's perception (all types UI) Show forest plot | Other data | No numeric data | ||
| 3 Quality of life and symptom scores Show forest plot | Other data | No numeric data | ||
| 4 Cure rates based on quantification of symptoms (all types UI) Show forest plot | 3 | Risk Ratio (M‐H, Fixed, 95% CI) | Totals not selected | |
| 4.1 At 3 months | 1 | Risk Ratio (M‐H, Fixed, 95% CI) | 0.0 [0.0, 0.0] | |
| 4.2 At 6 months | 1 | Risk Ratio (M‐H, Fixed, 95% CI) | 0.0 [0.0, 0.0] | |
| 4.3 At 12 months | 1 | Risk Ratio (M‐H, Fixed, 95% CI) | 0.0 [0.0, 0.0] | |
| 5 Cure rates based on quantification of symptoms (by type of UI) Show forest plot | Other data | No numeric data | ||
| 6 Improvement rates based on quantification of symptoms (all types UI) Show forest plot | 3 | Risk Ratio (M‐H, Fixed, 95% CI) | Subtotals only | |
| 6.1 At 3 months | 1 | 40 | Risk Ratio (M‐H, Fixed, 95% CI) | 16.5 [1.01, 270.78] |
| 6.2 At 6 months | 1 | 304 | Risk Ratio (M‐H, Fixed, 95% CI) | 1.85 [1.22, 2.81] |
| 6.3 At 12 months | 2 | 1032 | Risk Ratio (M‐H, Fixed, 95% CI) | 1.21 [1.02, 1.44] |
| 6.4 At 18 months | 1 | 287 | Risk Ratio (M‐H, Fixed, 95% CI) | 1.15 [0.86, 1.55] |
| 7 Improvement rates based on quantification of symptoms (by type of UI) Show forest plot | Other data | No numeric data | ||
| 8 Prevalence of weekly urinary incontinence after intervention (all types UI) Show forest plot | 2 | Risk Ratio (M‐H, Fixed, 95% CI) | Totals not selected | |
| 8.1 At 12 months | 1 | Risk Ratio (M‐H, Fixed, 95% CI) | 0.0 [0.0, 0.0] | |
| 8.2 At 2.8 years | 1 | Risk Ratio (M‐H, Fixed, 95% CI) | 0.0 [0.0, 0.0] | |
| 9 Prevalence of weekly urinary incontinence after intervention (by type of UI) Show forest plot | Other data | No numeric data | ||
| 10 Incontinent episodes per week (% change from baseline; all UI types) Show forest plot | 1 | Mean Difference (IV, Fixed, 95% CI) | Totals not selected | |
| 10.1 At 6 months | 1 | Mean Difference (IV, Fixed, 95% CI) | 0.0 [0.0, 0.0] | |
| 10.2 At 12 months | 1 | Mean Difference (IV, Fixed, 95% CI) | 0.0 [0.0, 0.0] | |
| 10.3 At 18 months | 1 | Mean Difference (IV, Fixed, 95% CI) | 0.0 [0.0, 0.0] | |
| 11 Incontinence episodes per week (% change from baseline; by type of UI) Show forest plot | Other data | No numeric data | ||
| Outcome or subgroup title | No. of studies | No. of participants | Statistical method | Effect size |
| 1 Number of women with UI episodes: soy‐rich diet versus control Show forest plot | Other data | No numeric data | ||
| 2 Mean UI symptom scores (SD; 0 = none, 1 = mild, 2 = moderate, 3 = severe): soy‐rich diet versus control Show forest plot | Other data | No numeric data | ||
| Outcome or subgroup title | No. of studies | No. of participants | Statistical method | Effect size |
| 1 Median number of daily UI episodes (IQR) Show forest plot | Other data | No numeric data | ||
| 2 Median number of daily UI episodes (range) Show forest plot | Other data | No numeric data | ||
| 3 Mean number of daily UI episodes (any UI) Show forest plot | Other data | No numeric data | ||
| Outcome or subgroup title | No. of studies | No. of participants | Statistical method | Effect size |
| 1 Mean quality of life scores Show forest plot | Other data | No numeric data | ||
| 2 Mean number of UI episodes per 24 hours (SD) Show forest plot | 1 | Mean Difference (IV, Fixed, 95% CI) | Totals not selected | |
| Outcome or subgroup title | No. of studies | No. of participants | Statistical method | Effect size |
| 1 Prevalence of weekly UI after intervention Show forest plot | 1 | Risk Ratio (M‐H, Fixed, 95% CI) | Totals not selected | |
| 1.1 All UI types at 2.8 years | 1 | Risk Ratio (M‐H, Fixed, 95% CI) | 0.0 [0.0, 0.0] | |
| 1.2 Stress UI at 2.8 years | 1 | Risk Ratio (M‐H, Fixed, 95% CI) | 0.0 [0.0, 0.0] | |
| 1.3 Urgency UI at 2.8 years | 1 | Risk Ratio (M‐H, Fixed, 95% CI) | 0.0 [0.0, 0.0] | |