Scolaris Content Display Scolaris Content Display

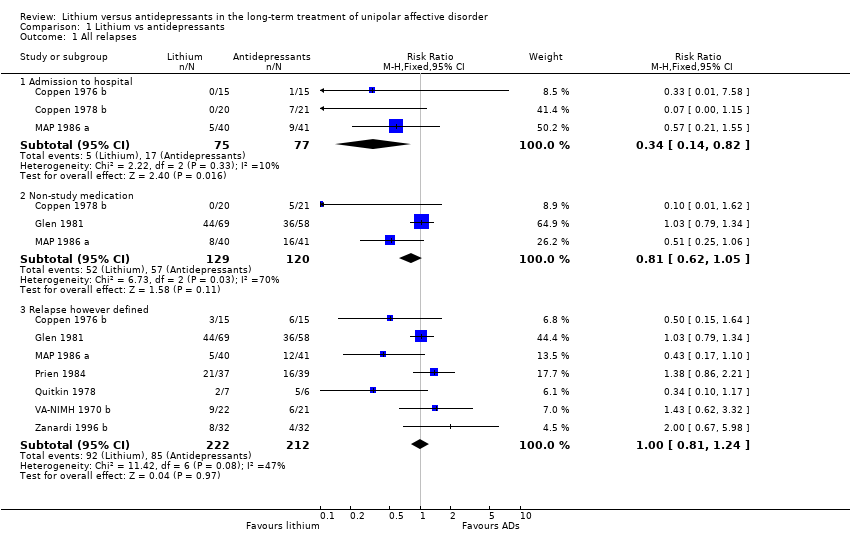
Comparison 1 Lithium vs antidepressants, Outcome 1 All relapses.
Figuras y tablas -
Analysis 1.1

Comparison 1 Lithium vs antidepressants, Outcome 1 All relapses.

Comparison 1 Lithium vs antidepressants, Outcome 2 Depressive relapse.
Figuras y tablas -
Analysis 1.2

Comparison 1 Lithium vs antidepressants, Outcome 2 Depressive relapse.

Comparison 1 Lithium vs antidepressants, Outcome 3 Manic relapse.
Figuras y tablas -
Analysis 1.3

Comparison 1 Lithium vs antidepressants, Outcome 3 Manic relapse.

Comparison 1 Lithium vs antidepressants, Outcome 4 Overall dropout rate.
Figuras y tablas -
Analysis 1.4

Comparison 1 Lithium vs antidepressants, Outcome 4 Overall dropout rate.

Comparison 1 Lithium vs antidepressants, Outcome 5 Dropout rate due to side effects.
Figuras y tablas -
Analysis 1.5

Comparison 1 Lithium vs antidepressants, Outcome 5 Dropout rate due to side effects.

Comparison 1 Lithium vs antidepressants, Outcome 6 Side effects.
Figuras y tablas -
Analysis 1.6

Comparison 1 Lithium vs antidepressants, Outcome 6 Side effects.

Comparison 1 Lithium vs antidepressants, Outcome 7 Mortality.
Figuras y tablas -
Analysis 1.7

Comparison 1 Lithium vs antidepressants, Outcome 7 Mortality.

Comparison 1 Lithium vs antidepressants, Outcome 8 Suicide.
Figuras y tablas -
Analysis 1.8

Comparison 1 Lithium vs antidepressants, Outcome 8 Suicide.

Comparison 1. Lithium vs antidepressants

Outcome or subgroup title

No. of studies

No. of participants

Statistical method

Effect size

1 All relapses Show forest plot

8

Risk Ratio (M‐H, Fixed, 95% CI)

Subtotals only

1.1 Admission to hospital

3

152

Risk Ratio (M‐H, Fixed, 95% CI)

0.34 [0.14, 0.82]

1.2 Non‐study medication

3

249

Risk Ratio (M‐H, Fixed, 95% CI)

0.81 [0.62, 1.05]

1.3 Relapse however defined

7

434

Risk Ratio (M‐H, Fixed, 95% CI)

1.00 [0.81, 1.24]

2 Depressive relapse Show forest plot

6

Risk Ratio (M‐H, Fixed, 95% CI)

Subtotals only

2.1 Admission to hospital

0

0

Risk Ratio (M‐H, Fixed, 95% CI)

0.0 [0.0, 0.0]

2.2 Non‐study medication

0

0

Risk Ratio (M‐H, Fixed, 95% CI)

0.0 [0.0, 0.0]

2.3 Relapse however defined

6

404

Risk Ratio (M‐H, Fixed, 95% CI)

1.13 [0.90, 1.42]

3 Manic relapse Show forest plot

6

Risk Ratio (M‐H, Fixed, 95% CI)

Subtotals only

3.1 Admission to hospital

0

0

Risk Ratio (M‐H, Fixed, 95% CI)

0.0 [0.0, 0.0]

3.2 Non‐study medication

0

0

Risk Ratio (M‐H, Fixed, 95% CI)

0.0 [0.0, 0.0]

3.3 Relapse however defined

6

404

Risk Ratio (M‐H, Fixed, 95% CI)

0.46 [0.17, 1.25]

4 Overall dropout rate Show forest plot

6

345

Risk Ratio (M‐H, Fixed, 95% CI)

0.67 [0.43, 1.06]

5 Dropout rate due to side effects Show forest plot

4

262

Risk Ratio (M‐H, Fixed, 95% CI)

1.04 [0.31, 3.52]

6 Side effects Show forest plot

2

Risk Ratio (M‐H, Fixed, 95% CI)

Subtotals only

6.1 Any reported

2

203

Risk Ratio (M‐H, Fixed, 95% CI)

0.97 [0.78, 1.22]

6.2 Troublesome

1

76

Risk Ratio (M‐H, Fixed, 95% CI)

0.53 [0.20, 1.40]

7 Mortality Show forest plot

3

272

Risk Ratio (M‐H, Fixed, 95% CI)

0.39 [0.06, 2.60]

8 Suicide Show forest plot

8

475

Risk Ratio (M‐H, Fixed, 95% CI)

0.31 [0.03, 2.92]

Figuras y tablas -
Comparison 1. Lithium vs antidepressants