Intervenciones para la hipertensión intracraneal idiopática
Información
- DOI:
- https://doi.org/10.1002/14651858.CD003434.pub3Copiar DOI

- Base de datos:
-
- Cochrane Database of Systematic Reviews
- Versión publicada:
-
- 07 agosto 2015see what's new
- Tipo:
-
- Intervention
- Etapa:
-
- Review
- Grupo Editorial Cochrane:
-
Grupo Cochrane de Salud ocular y de la visión
- Copyright:
-
- Copyright © 2015 The Cochrane Collaboration. Published by John Wiley & Sons, Ltd.
Cifras del artículo
Altmetric:
Citado por:
Autores
Contributions of authors
CL and GM conceived and designed the review (Lueck 2002; Lueck 2005).
Original review
CL wrote the protocol and discussed the search strategy with the Cochrane Eyes and Vision Group editorial team. He was responsible for reading and assessing studies identified by the search (with regard to both inclusion criteria and quality), and for writing the definitive review.
GM also read and assessed studies identified by the search (with regard to both inclusion criteria and quality), and assisted in the writing of the definitive review.
CL coordinated the review and screened the search results.
CL and GM screened the retrieved papers against inclusion criteria, and appraised the quality of the papers.
CL wrote the review.
2015 update
RJP coordinated the review update.
RJP and AMHY screened the search results.
AABJ acted as a third party decision on screening disagreements.
RJP and AABJ screened retrieved papers against inclusion criteria and appraised the quality of the papers.
RJP, AVK, AMHY, MAH, AABJ and IPF wrote the review.
Sources of support
Internal sources
-
No sources of support supplied
External sources
-
National Institute for Health Research (NIHR), UK.
-
Richard Wormald, Co‐ordinating Editor for the Cochrane Eyes and Vision Group (CEVG) acknowledges financial support for his CEVG research sessions from the Department of Health through the award made by the National Institute for Health Research to Moorfields Eye Hospital NHS Foundation Trust and UCL Institute of Ophthalmology for a Specialist Biomedical Research Centre for Ophthalmology.
-
The NIHR also funds the CEVG Editorial Base in London.
The views expressed in this publication are those of the authors and not necessarily those of the NIHR, NHS, or the Department of Health.
-
Declarations of interest
RJP, AMHY, AABJ, AVK, MAH, IPF: none known.
Acknowledgements
We have used text adapted from a standard template used by the Cochrane Eyes and Vision Review Group (CEVG) in the Methods section.
We thank James Acheson for peer review comments on the original version of this review.
The CEVG developed and performed the electronic searches. We thank Jennifer Evans and Anupa Shah from the CEVG editorial team for their assistance with the review process.
We thank Christian Lueck (CL) and Gawn McIllwaine (GM) for their work on the original published versions of this review (Lueck 2002; Lueck 2005).
Version history
| Published | Title | Stage | Authors | Version |
| 2015 Aug 07 | Interventions for idiopathic intracranial hypertension | Review | Rory J Piper, Aristotelis V Kalyvas, Adam MH Young, Mark A Hughes, Aimun AB Jamjoom, Ioannis P Fouyas | |
| 2005 Jul 20 | Interventions for idiopathic intracranial hypertension | Review | Christian J Lueck, Gawn G McIlwaine | |
| 2002 Jul 22 | Interventions for idiopathic intracranial hypertension | Review | Christian J Lueck, G McIlwaine | |
Differences between protocol and review
We have updated the protocol of this review in line with current methodological expectations for Cochrane reviews. Therefore there are some differences compared with the original published protocol. However, we did not use these updated methods in this review version because only two trials met the inclusion criteria and we were unable to perform meta‐analysis. We may use the updated methods in future review updates.
Keywords
MeSH
Medical Subject Headings (MeSH) Keywords
Medical Subject Headings Check Words
Adult; Female; Humans; Male; Middle Aged;
PICO

Study flow diagram.
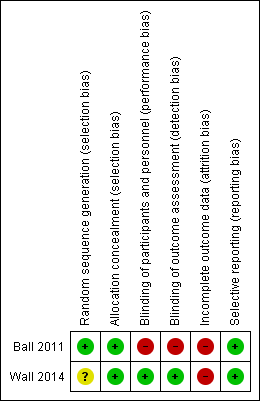
Risk of bias summary: review authors' judgements about each risk of bias item for each included study.
| Outcome | Acetalomazide | Placebo | MD (95% CI) adjusted for centre, baseline value of outcome and baseline papilloedema grade, with multiple imputation for missing data | ||||
| Mean | SD | N | Mean | SD | N | ||
| Wall 2014: Change in perimetric mean deviation (decibels) between baseline and 6 months | 1.43 | 2.23 | 86 | 0.71 | 2.49 | 69 | 0.71 (0 to 1.43) |
| Abbreviations: MD = mean difference; SD = standard deviation; CI = confidence interval. | |||||||
| Outcome | Acetalomazide | Placebo | MD (95% CI) | ||||
| Mean | SD | N | Mean | SD | N | ||
| Ball 2011: Change in logMAR acuity in the right eye between baseline and 12 months | Not reported | Not reported | 21 | Not reported | Not reported | 20 | 0.04 (‐0.08, 0.16) |
| Ball 2011: Change in logMAR acuity in the left eye between baseline and 12 months | Not reported | Not reported | 21 | Not reported | Not reported | 20 | 0.03 (‐0.09, 0.15) |
| Wall 2014a: Change in visual acuity (number of correct letters) between baseline and 6 months | 2.65 | Not reported (SE 0.49) | b | 2.64 | Not reported (SE 0.51) | b | 0.01 (‐1.45, 1.46) |
| aIn Wall 2014 MD adjusted for centre, baseline value of outcome and baseline papilloedema grade. | |||||||
| Outcome | Acetalomazide | Placebo | OR (95% CI) | ||
| n | N | n | N | ||
| Ball 2011: Visual loss (logMAR 0.2 or more) at 12 months | 0 | 21 | 2 | 20 | 0.17 (0.01, 3.82) |
| Abbreviations: MD = mean difference; SD = standard deviation; CI = confidence interval; n = number of events; N = number of participants; OR = odds ratio. | |||||
| Outcome | Acetalomazide | Placebo | MD (95% CI) adjusted for centre, baseline value of outcome and baseline papilloedema grade | ||||
| Mean | SD | N | Mean | SD | N | ||
| Wall 2014: Change in CSF pressure (mmH20) between baseline and 6 months | ‐112.3 | Not reported | 47 | ‐52.4 | Not reported | 38 | ‐59.9 (‐96.4 to ‐23.4) |
| Outcome | Acetalomazide | Placebo | MD (95% CI) adjusted for centre and baseline papilloedema grade | ||||
| Mean | SD | N | Mean | SD | N | ||
| Wall 2014: Change in papilloedema grade between baseline and 6 months, graded by fundus photographs | ‐1.31 | SE 0.11a | a | ‐0.61 | SE 0.11a | a | ‐0.70 (‐1.00 to ‐0.40) |
| Wall 2014: Change in papilloedema grade between baseline and 6 months, clinical grading | ‐1.75 | SE 0.13a | a | ‐0.85 | SE 0.14a | a | ‐0.91 (‐1.27 to ‐0.54) |
| aIt is unclear how many patients were included in these analyses. | |||||||
| Outcome | Acetalomazide | Placebo | MD (95% CI) adjusted for centre, baseline value of outcome and baseline papilloedema grade | ||||
| Mean | SD | N | Mean | SD | N | ||
| Ball 2011: Change in headache score as measured on a 10‐point visual analogue score at 12 months | Not reported | Not reported | 21 | Not reported | Not reported | 20 | 1.0 (‐1.80 to 3.70) |
| Wall 2014: Change in HIT‐6 total score between baseline and 6 months | ‐9.56 | Not reporteda | a | ‐9.11 | Not reporteda | a | ‐0.45 (‐3.50 to 2.60) |
| aIt is unclear how many patients were included in these analyses. | |||||||
| Outcome | Acetalomazide | Placebo | OR (95% CI) | ||
| n | N | n | N | ||
| Ball 2011: Number of people with headache at 12 months | 9 | 21 | 13 | 20 | 0.42 (0.12 to 1.41) |
| Abbreviations: CI = confidence interval; n = number of events; N = number of participants; OR = odds ratio. | |||||
| Outcome | Acetalomazide | Placebo | OR (95% CI) | ||
| n | N | n | N | ||
| Ball 2011: Number of people in remission at 12 months | 9 | 21 | 8 | 20 | 1.13 (0.32 to 3.90) |
| Abbreviations: CI = confidence interval; n = number of events; N = number of participants; OR = odds ratio. | |||||
| Outcome | Acetalomazide | Placebo | OR (95% CI) | ||
| n | N | n | N | ||
| Elevated ALT | 6 | 69 | 3 | 79 | 1.90 (0.46 to 7.87) |
| Decreased CO2 | 9 | 69 | 0 | 79 | 19.49 (1.12 to 340.66) |
| Diarrhea | 12 | 69 | 3 | 79 | 4.11 (1.11 to 15.15) |
| Dizziness | 8 | 69 | 3 | 79 | 2.60 (0.66 to 10.16) |
| Dysgeusia | 13 | 69 | 0 | 79 | 29.20 (1.71 to 500.07) |
| Dyspepsia | 7 | 69 | 1 | 79 | 6.91 (0.83 to 57.49) |
| Dyspnea | 7 | 69 | 2 | 79 | 3.41 (0.69 to 16.94) |
| Fatigue | 14 | 69 | 1 | 79 | 15.17 (1.94 to 118.27) |
| Headache | 13 | 69 | 11 | 79 | 1.10 (0.46 to 2.62) |
| Nasopharyngitis | 5 | 69 | 8 | 79 | 0.55 (0.17 to 1.75) |
| Nausea | 26 | 69 | 10 | 79 | 2.99 (1.33 to 6.70) |
| Paresthesia | 41 | 69 | 5 | 79 | 13.48 (4.96 to 36.64) |
| Post‐LP syndrome | 5 | 69 | 6 | 79 | 0.75 (0.22 to 2.56) |
| Rash | 7 | 69 | 2 | 79 | 3.41 (0.69 to 16.94) |
| Sinusitis | 3 | 69 | 6 | 79 | 0.44 (0.11 to 1.82) |
| Tinnitus | 11 | 69 | 3 | 79 | 3.72 (1.00 to 13.85) |
| Vomiting | 12 | 69 | 3 | 79 | 4.11 (1.11 to 15.15) |
| This data is from one study (Wall 2014). Abbreviations: CI = confidence interval; n = number of events; N = number of participants; OR = odds ratio. | |||||
| Outcome | Acetalomazide | Placebo | MD (95% CI) adjusted for centre, baseline value of outcome and baseline papilloedema grade | ||||
| Mean | SD | N | Mean | SD | N | ||
| Wall 2014: Change in VFQ‐25 total score between baseline and 6 months | 8.33 | SE 1.47a | a | 1.98 | SE 1.53a | a | 6.35 (2.22 to 10.47) |
| Wall 2014: Change in VFQ‐25 10‐item neuro‐ophthalmic supplement between baseline and 6 months | 9.82 | SE 1.55a | a | 1.59 | SE 1.62a | a | 8.23 (3.89 to 12.56) |
| Wall 2014: Change in SF‐36 Physical Component Summary between baseline and 6 months | 5.84 | SE 1.01a | a | 2.82 | SE 1.03a | a | 3.02 (0.34 to 5.70) |
| Wall 2014: Change in SF‐36 Mental Component Summary between baseline and 6 months | 5.62 | SE 1.16a | a | 2.17 | SE 1.17a | a | 3.45 (0.35 to 6.55) |
| aIt is unclear how many patients were included in these analyses. | |||||||