مداخلاتی برای مدیریت بالینی هیپرتانسیون داخل جمجمهای ایدیوپاتیک
Appendices
Appendix 1. CENTRAL search strategy
#1 MeSH descriptor Pseudotumor Cerebri
#2 MeSH descriptor Sinus Thrombosis, Intracranial
#3 MeSH descriptor Intracranial Hypertension
#4 MeSH descriptor Papilledema
#5 (#1 OR #2 OR #3 OR #4)
#6 intracranial
#7 intra cranial
#8 intercranial
#9 inter cranial
#10 (#6 OR #7 OR #8 OR #9)
#11 hypertens* or pressur*
#12 increas* or elevat* or high*
#13 benign* or idiopathic* or secondary
#14 (#10 AND #11 AND #12 AND #13)
#15 pseudotumor or pseudo tumor* near cerebr*
#16 pseudoabscess* or pseudo abscess*
#17 otitic or toxic* near hydroceph*
#18 sinus near thrombosis
#19 meningeal near hydrop*
#20 (#15 OR #16 OR #17 OR #18 OR #19)
#21 (#5 OR #14 OR #20)
Appendix 2. MEDLINE (Ovid) search strategy
1 randomized controlled trial.pt.
2 (randomized or randomised).ab,ti.
3 placebo.ab,ti.
4 dt.fs.
5 randomly.ab,ti.
6 trial.ab,ti.
7 groups.ab,ti.
8 or/1‐7
9 exp animals/
10 exp humans/
11 9 not (9 and 10)
12 8 not 11
13 exp pseudotumor cerebri/
14 exp sinus thrombosis intracranial/
15 exp intracranial hypertension/
16 exp papilledema/
17 or/13‐16
18 intra?cranial.tw.
19 intra cranial.tw.
20 inter?cranial.tw.
21 inter cranial.tw.
22 or/18‐21
23 (hypertens$ or pressur$).tw.
24 (increas$ or elevat$ or high$).tw.
25 (benign$ or idiopathic$ or secondary).tw.
26 22 and 23 and 24 and 25
27 ((pseudotumor or pseudo tumor$) adj3 cerebr$).tw.
28 (pseudoabscess$ or pseudo abscess$).tw.
29 ((otitic or toxic$) adj5 hydroceph$).tw.
30 (sinus adj3 thrombosis).tw.
31 (meningeal adj3 hydrop$).tw.
32 or/13‐15
33 or/26‐32
34 12 and 33
The search filter for trials at the beginning of the MEDLINE strategy is from the published paper by Glanville et al (Glanville 2006).
Appendix 3. EMBASE (Ovid) search strategy
1 exp randomized controlled trial/
2 exp randomization/
3 exp double blind procedure/
4 exp single blind procedure/
5 random$.tw.
6 or/1‐5
7 (animal or animal experiment).sh.
8 human.sh.
9 7 and 8
10 7 not 9
11 6 not 10
12 exp clinical trial/
13 (clin$ adj3 trial$).tw.
14 ((singl$ or doubl$ or trebl$ or tripl$) adj3 (blind$ or mask$)).tw.
15 exp placebo/
16 placebo$.tw.
17 random$.tw.
18 exp experimental design/
19 exp crossover procedure/
20 exp control group/
21 exp latin square design/
22 or/12‐21
23 22 not 10
24 23 not 11
25 exp comparative study/
26 exp evaluation/
27 exp prospective study/
28 (control$ or prospectiv$ or volunteer$).tw.
29 or/25‐28
30 29 not 10
31 30 not (11 or 23)
32 11 or 24 or 31
33 exp brain pseudotumor/
34 exp cerebral sinus thrombosis/
35 exp intracranial hypertension/
36 exp papilledema/
37 or/33‐36
38 intra?cranial.tw.
39 intra cranial.tw.
40 inter?cranial.tw.
41 inter cranial.tw.
42 or/38‐41
43 (hypertens$ or pressur$).tw.
44 (increas$ or elevat$ or high$).tw.
45 (benign$ or idiopathic$ or secondary).tw.
46 42 and 43 and 44 and 45
47 ((pseudotumor or pseudo tumor$) adj3 cerebr$).tw.
48 (pseudoabscess$ or pseudo abscess$).tw.
49 ((otitic or toxic$) adj5 hydroceph$).tw.
50 (sinus adj3 thrombosis).tw.
51 (meningeal adj3 hydrop$).tw.
52 or/47‐51
53 37 or 46 or 52
54 32 and 53
Appendix 4. ISRCTN search strategy
(benign or idiopathic) and intracranial hypertension
Appendix 5. Clinicaltrials.gov search strategy
(Benign OR Idiopathic) AND Intracranial Hypertension
Appendix 6. ICTRP search strategy
Idiopathic Intracranial Hypertension
Benign Intracranial Hypertension

Study flow diagram.
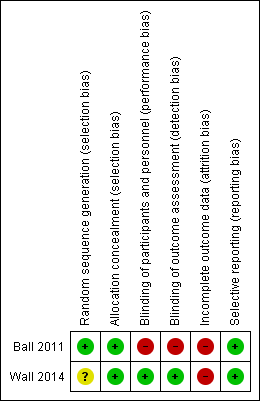
Risk of bias summary: review authors' judgements about each risk of bias item for each included study.
| Outcome | Acetalomazide | Placebo | MD (95% CI) adjusted for centre, baseline value of outcome and baseline papilloedema grade, with multiple imputation for missing data | ||||
| Mean | SD | N | Mean | SD | N | ||
| Wall 2014: Change in perimetric mean deviation (decibels) between baseline and 6 months | 1.43 | 2.23 | 86 | 0.71 | 2.49 | 69 | 0.71 (0 to 1.43) |
| Abbreviations: MD = mean difference; SD = standard deviation; CI = confidence interval. | |||||||
| Outcome | Acetalomazide | Placebo | MD (95% CI) | ||||
| Mean | SD | N | Mean | SD | N | ||
| Ball 2011: Change in logMAR acuity in the right eye between baseline and 12 months | Not reported | Not reported | 21 | Not reported | Not reported | 20 | 0.04 (‐0.08, 0.16) |
| Ball 2011: Change in logMAR acuity in the left eye between baseline and 12 months | Not reported | Not reported | 21 | Not reported | Not reported | 20 | 0.03 (‐0.09, 0.15) |
| Wall 2014a: Change in visual acuity (number of correct letters) between baseline and 6 months | 2.65 | Not reported (SE 0.49) | b | 2.64 | Not reported (SE 0.51) | b | 0.01 (‐1.45, 1.46) |
| aIn Wall 2014 MD adjusted for centre, baseline value of outcome and baseline papilloedema grade. | |||||||
| Outcome | Acetalomazide | Placebo | OR (95% CI) | ||
| n | N | n | N | ||
| Ball 2011: Visual loss (logMAR 0.2 or more) at 12 months | 0 | 21 | 2 | 20 | 0.17 (0.01, 3.82) |
| Abbreviations: MD = mean difference; SD = standard deviation; CI = confidence interval; n = number of events; N = number of participants; OR = odds ratio. | |||||
| Outcome | Acetalomazide | Placebo | MD (95% CI) adjusted for centre, baseline value of outcome and baseline papilloedema grade | ||||
| Mean | SD | N | Mean | SD | N | ||
| Wall 2014: Change in CSF pressure (mmH20) between baseline and 6 months | ‐112.3 | Not reported | 47 | ‐52.4 | Not reported | 38 | ‐59.9 (‐96.4 to ‐23.4) |
| Outcome | Acetalomazide | Placebo | MD (95% CI) adjusted for centre and baseline papilloedema grade | ||||
| Mean | SD | N | Mean | SD | N | ||
| Wall 2014: Change in papilloedema grade between baseline and 6 months, graded by fundus photographs | ‐1.31 | SE 0.11a | a | ‐0.61 | SE 0.11a | a | ‐0.70 (‐1.00 to ‐0.40) |
| Wall 2014: Change in papilloedema grade between baseline and 6 months, clinical grading | ‐1.75 | SE 0.13a | a | ‐0.85 | SE 0.14a | a | ‐0.91 (‐1.27 to ‐0.54) |
| aIt is unclear how many patients were included in these analyses. | |||||||
| Outcome | Acetalomazide | Placebo | MD (95% CI) adjusted for centre, baseline value of outcome and baseline papilloedema grade | ||||
| Mean | SD | N | Mean | SD | N | ||
| Ball 2011: Change in headache score as measured on a 10‐point visual analogue score at 12 months | Not reported | Not reported | 21 | Not reported | Not reported | 20 | 1.0 (‐1.80 to 3.70) |
| Wall 2014: Change in HIT‐6 total score between baseline and 6 months | ‐9.56 | Not reporteda | a | ‐9.11 | Not reporteda | a | ‐0.45 (‐3.50 to 2.60) |
| aIt is unclear how many patients were included in these analyses. | |||||||
| Outcome | Acetalomazide | Placebo | OR (95% CI) | ||
| n | N | n | N | ||
| Ball 2011: Number of people with headache at 12 months | 9 | 21 | 13 | 20 | 0.42 (0.12 to 1.41) |
| Abbreviations: CI = confidence interval; n = number of events; N = number of participants; OR = odds ratio. | |||||
| Outcome | Acetalomazide | Placebo | OR (95% CI) | ||
| n | N | n | N | ||
| Ball 2011: Number of people in remission at 12 months | 9 | 21 | 8 | 20 | 1.13 (0.32 to 3.90) |
| Abbreviations: CI = confidence interval; n = number of events; N = number of participants; OR = odds ratio. | |||||
| Outcome | Acetalomazide | Placebo | OR (95% CI) | ||
| n | N | n | N | ||
| Elevated ALT | 6 | 69 | 3 | 79 | 1.90 (0.46 to 7.87) |
| Decreased CO2 | 9 | 69 | 0 | 79 | 19.49 (1.12 to 340.66) |
| Diarrhea | 12 | 69 | 3 | 79 | 4.11 (1.11 to 15.15) |
| Dizziness | 8 | 69 | 3 | 79 | 2.60 (0.66 to 10.16) |
| Dysgeusia | 13 | 69 | 0 | 79 | 29.20 (1.71 to 500.07) |
| Dyspepsia | 7 | 69 | 1 | 79 | 6.91 (0.83 to 57.49) |
| Dyspnea | 7 | 69 | 2 | 79 | 3.41 (0.69 to 16.94) |
| Fatigue | 14 | 69 | 1 | 79 | 15.17 (1.94 to 118.27) |
| Headache | 13 | 69 | 11 | 79 | 1.10 (0.46 to 2.62) |
| Nasopharyngitis | 5 | 69 | 8 | 79 | 0.55 (0.17 to 1.75) |
| Nausea | 26 | 69 | 10 | 79 | 2.99 (1.33 to 6.70) |
| Paresthesia | 41 | 69 | 5 | 79 | 13.48 (4.96 to 36.64) |
| Post‐LP syndrome | 5 | 69 | 6 | 79 | 0.75 (0.22 to 2.56) |
| Rash | 7 | 69 | 2 | 79 | 3.41 (0.69 to 16.94) |
| Sinusitis | 3 | 69 | 6 | 79 | 0.44 (0.11 to 1.82) |
| Tinnitus | 11 | 69 | 3 | 79 | 3.72 (1.00 to 13.85) |
| Vomiting | 12 | 69 | 3 | 79 | 4.11 (1.11 to 15.15) |
| This data is from one study (Wall 2014). Abbreviations: CI = confidence interval; n = number of events; N = number of participants; OR = odds ratio. | |||||
| Outcome | Acetalomazide | Placebo | MD (95% CI) adjusted for centre, baseline value of outcome and baseline papilloedema grade | ||||
| Mean | SD | N | Mean | SD | N | ||
| Wall 2014: Change in VFQ‐25 total score between baseline and 6 months | 8.33 | SE 1.47a | a | 1.98 | SE 1.53a | a | 6.35 (2.22 to 10.47) |
| Wall 2014: Change in VFQ‐25 10‐item neuro‐ophthalmic supplement between baseline and 6 months | 9.82 | SE 1.55a | a | 1.59 | SE 1.62a | a | 8.23 (3.89 to 12.56) |
| Wall 2014: Change in SF‐36 Physical Component Summary between baseline and 6 months | 5.84 | SE 1.01a | a | 2.82 | SE 1.03a | a | 3.02 (0.34 to 5.70) |
| Wall 2014: Change in SF‐36 Mental Component Summary between baseline and 6 months | 5.62 | SE 1.16a | a | 2.17 | SE 1.17a | a | 3.45 (0.35 to 6.55) |
| aIt is unclear how many patients were included in these analyses. | |||||||