Пищевые волокна для профилактики рецидивов колоректальных аденом и карцином
Referencias
References to studies included in this review
References to studies excluded from this review
References to studies awaiting assessment
References to ongoing studies
Additional references
References to other published versions of this review
Characteristics of studies
Characteristics of included studies [ordered by study ID]
| Methods | Allocation: randomisation numbers were computer‐generated Blindness: only one of the biostatisticians had access to the uncoded list of participant names, agent codes, and agent identities Setting: USA | |
| Participants | Inclusion criteria: age 50‐75 years, a complete colonoscopy with colonic polyp removal within 24 months of study entry, no history of invasive cancer, severe metabolic disorders, or other life‐threatening acute or chronic diseases, a performance status of 0‐1 (Southwest Oncology Group performance status criteria) adequate dietary intakes of calories and protein N = 100 Sex: % male: 49.4 Age: mean: 66‐70 years Exclusion criteria: dietary fibre intake of ≥ 30.0 g/d or elemental calcium intake of ≥ 2.0 g/d, serum creatinine levels of ≥ 1.3 mg/dL, and serum bilirubin levels of ≥ 2.0 mg/dL Baseline dietary fibre intake g/day: 15.6‐20.0 | |
| Interventions |
| |
| Outcomes | Unable to use: Compliance [3H]thymidine labeling of normal colonic epithelial cells in 24‐h outgrowth culture [3H]thymidine labeling in crypt organ culture | |
| Notes | None. | |
| Risk of bias | ||
| Bias | Authors' judgement | Support for judgement |
| Random sequence generation (selection bias) | Low risk | Randomisation numbers were computer‐generated |
| Allocation concealment (selection bias) | Low risk | Only one of the biostatisticians had access to the uncoded list of participant names, agent codes, and agent identities. |
| Blinding (performance bias and detection bias) | Unclear risk | No details |
| Blinding of outcome assessment (detection bias) | Unclear risk | No details |
| Incomplete outcome data (attrition bias) | Low risk | 5 participants dropped out of the study during the first 3 months of post randomisation treatment because of supplement adherence problems, 2 participants refused participation in the rectal mucosal biopsy procedures |
| Selective reporting (reporting bias) | Low risk | It appears all pre‐defined outcomes were reported |
| Other bias | Unclear risk | No details |
| Methods | Allocation: randomized Setting: outpatients, multicenter, USA | |
| Participants | Inclusion criteria: age 40‐80 yrs, removal of ≥ 1 colonic adenoma(s) > = 3 mm at colonoscopy within 3 months of study entry, adequate nutritional status, normal renal and liver function Exclusion criteria: invasive cancer ≤ 5 years, ≥ 2 first degree relatives with CRC previous colon resection N = 1429 Sex: % male (low‐fibre group/high‐fibre group): 65.2/67.1 Age: mean (low‐fibre group/high‐fibre group): 66.0/66.8 years Baseline dietary fibre intake g/day: ˜19 g | |
| Interventions |
| |
| Outcomes | Adenoma recurrence Adenoma size Multiple adenomas Colorectal cancer occurrence | |
| Notes |
| |
| Risk of bias | ||
| Bias | Authors' judgement | Support for judgement |
| Random sequence generation (selection bias) | High risk | The sequence generation was described as randomised, however, there was a large discrepancy (175 people) in the number of between intervention and control group suggesting that randomisation was not generated successfully and may be biased. |
| Allocation concealment (selection bias) | Low risk | "The treatment assignments were not revealed to the participants, their physicians, or members of the study staff." |
| Blinding (performance bias and detection bias) | High risk | Described as double‐blind but participants were aware of receiving cereal |
| Blinding of outcome assessment (detection bias) | Unclear risk | Described as double‐blind but not stated who was blinded |
| Incomplete outcome data (attrition bias) | Unclear risk | Reasons for loss to follow‐up not reported, 126 out of 1429 participants (8.8%) dropped out from the study early |
| Selective reporting (reporting bias) | Low risk | All measured outcomes were reported |
| Other bias | Unclear risk | No details |
| Methods | Allocation: randomised after stratification according to centre, in a 3‐group parallel design Setting: multicenter in 10 countries (Belgium, Denmark, France, Germany, Ireland, Israel, Italy, Portugal, Spain, and the UK) | |
| Participants | Inclusion criteria: complete colonoscopy demonstrating >= 2 adenomas or 1 adenoma ≥ 5 mm, age 35‐75, at entry with a complete colonoscopy and a clean colon (Faivre 1997), no debilitating disease N = 665 Sex: % male (calcium/fibre/placebo) 65.9/64.6/60.1 Age: mean (calcium/fibre/placebo) 58.8/59.1/59.3 years Baseline dietary fibre intake g/day: ˜19 g Baseline characteristics similar for each group: yes | |
| Interventions |
| |
| Outcomes | Adenoma recurrence Adenoma size Adverse effects | |
| Notes |
| |
| Risk of bias | ||
| Bias | Authors' judgement | Support for judgement |
| Random sequence generation (selection bias) | Low risk | Randomisation after stratification according to centre, in a 3‐group parallel design |
| Allocation concealment (selection bias) | Low risk | Independent randomisation centre |
| Blinding (performance bias and detection bias) | Low risk | Participants, staff in the clinical centre, and study investigators were not aware of the treatment assignments. |
| Blinding of outcome assessment (detection bias) | Unclear risk | It is unclear if outcome assessors were blinded. |
| Incomplete outcome data (attrition bias) | High risk | Full reasons for loss to follow‐up not given. High attrition rate 17.0%, 113 out of 665 participants dropped out from the study early. |
| Selective reporting (reporting bias) | Low risk | All measured outcomes were reported. |
| Other bias | High risk | Recruitment was lower than intended. The original intended sample size to detect a 15% difference in new adenoma formation rate was 210 participants in each arm, but the number of people who completed the study in the treatment arm was 198, and 178 in the placebo arm. |
| Methods | Allocation: randomly assigned based on a table of random numbers Setting: USA | |
| Participants | Inclusion criteria: adults with familial adenomatous polyposis; each of these participants had had a total colectomy and ileorectal anastomosis at least 1 year before entry into the trial N = 62. (4 participants withdrew from the study early) Sex: % male 36.2 Age: mean (Group 1/Group 2/Group 3) 35.2/31.0/34.7 years | |
| Interventions |
| |
| Outcomes | Unable to use: Adverse events (no adverse symptoms or findings could be attributed to the treatment agents) Compliance Dietary analysis Polyp number ratios | |
| Notes | This study was supported by Public Health Service grants CA‐31711 and CA‐43601 from the National Cancer Institute, National Institutes of Health, Department of Health and Human Services | |
| Risk of bias | ||
| Bias | Authors' judgement | Support for judgement |
| Random sequence generation (selection bias) | Low risk | Participants were randomly assigned based on a table of random numbers. |
| Allocation concealment (selection bias) | Unclear risk | No details |
| Blinding (performance bias and detection bias) | Low risk | "Only the pharmacist and the statistician knew the treatment allocations. One patient, a nurse, obtained a chemical analysis of her placebo capsule; all other patients and investigators remained blinded." (p.1291) |
| Blinding of outcome assessment (detection bias) | Unclear risk | No details |
| Incomplete outcome data (attrition bias) | Low risk | 4 participants withdrew from the study early. ITT analysis was used. |
| Selective reporting (reporting bias) | Low risk | All measured outcomes were reported. |
| Other bias | Unclear risk | No details |
| Methods | Allocation: randomised trial with a 2 x 2 x 2 factorial design Setting: multicenter, Australia | |
| Participants | Inclusion criteria: age 30‐74 yrs, ≥ one adenoma, polyp‐free colon post colonoscopy N = 424* Sex: % male (monitoring at 24 months/48 months) 66.7/68.0 Age: mean (monitoring at 24 months/48 months) 56.3/55.9 years | |
| Interventions |
| |
| Outcomes | Adenoma recurrence Adenoma size | |
| Notes | Other Interventions arms not used:
Control:
*The study randomised 424 participants, however, they did not report the number of participants in each group. Only data from 390 participants were reported with 193 in the WBF group and 197 in the WBF supplement group, respectively. So we conducted the sensitivity analysis based on 390 participants | |
| Risk of bias | ||
| Bias | Authors' judgement | Support for judgement |
| Random sequence generation (selection bias) | Low risk | Randomized trial with a 2 x 2 x 2 factorial design, following pre‐randomisation stratification. Randomisation was computerised |
| Allocation concealment (selection bias) | Unclear risk | No details |
| Blinding (performance bias and detection bias) | Unclear risk | Described as partially double‐blind but did not state who was blinded. |
| Blinding of outcome assessment (detection bias) | Unclear risk | Described as partially double‐blind but did not state who was blinded. |
| Incomplete outcome data (attrition bias) | High risk | Full reasons for loss to follow‐up not given. High attrition rate (27.8%), 118 participants lost to follow‐up at 48 months |
| Selective reporting (reporting bias) | Low risk | All measured outcomes were reported. |
| Other bias | Unclear risk | No details |
| Methods | Allocation: randomised Setting: 7 Toronto hospitals, Canada | |
| Participants | Inclusion criteria: ≥ 1 pathologically confirmed colorectal adenomatous polyp, after polypectomy for adenomatous colorectal polyps, age < 85 years N = 201 Sex: % male (low fat, high fibre diet/normal diet) 56.6/52.9 Age: mean 57.9/57.7 years Baseline dietary fibre intake g/d: 18 g (intervention), 15 g (control) Baseline characteristics similar for each group: protein, carbohydrates. vitamin D, riboflavin and total calories significantly higher in the intervention group; majority of baseline markers were not significantly different | |
| Interventions |
| |
| Outcomes | Adenoma recurrence | |
| Notes |
| |
| Risk of bias | ||
| Bias | Authors' judgement | Support for judgement |
| Random sequence generation (selection bias) | Low risk | Randomised by stratification |
| Allocation concealment (selection bias) | Unclear risk | No details |
| Blinding (performance bias and detection bias) | High risk | Participants were aware of the details of their diet |
| Blinding of outcome assessment (detection bias) | Low risk | The endoscopist performed both the initial and follow‐up examinations without knowledge of the participants's dietary assignment |
| Incomplete outcome data (attrition bias) | High risk | Reasons for loss to follow‐up not described. High attrition rate (17.9%) 36 out of 201 participants lost to follow‐up |
| Selective reporting (reporting bias) | Low risk | All measured outcomes were reported |
| Other bias | Unclear risk | No details |
| Methods | Allocation: randomised Setting: 8 clinical centres, USA | |
| Participants | Inclusion criteria: ≥ 1 large bowel adenoma removed within 6 months, polyp‐free colon post colonoscopy, age ≥ 35 years Sex: % male (intervention/control) 65.8/63.2 Age: mean (intervention/control) 61.0/61.1 Baseline dietary fibre intake g/d: not reported Baseline characteristics similar for each group: yes | |
| Interventions |
| |
| Outcomes | Adenoma recurrence Colorectal cancer occurrence Adenoma size Multiple adenomas | |
| Notes |
| |
| Risk of bias | ||
| Bias | Authors' judgement | Support for judgement |
| Random sequence generation (selection bias) | Low risk | Randomisation stratified by clinical centre. Assignment done by a computer programme |
| Allocation concealment (selection bias) | Unclear risk | No details |
| Blinding (performance bias and detection bias) | High risk | Participants were aware of treatment regimens. |
| Blinding of outcome assessment (detection bias) | Unclear risk | Participants were aware of allocation, but were told not to tell the endoscopist. |
| Incomplete outcome data (attrition bias) | Unclear risk | Reasons for loss to follow‐up were reported, 174 out of 2079 participants (8.4%) dropped out from the study. |
| Selective reporting (reporting bias) | Low risk | All measured outcomes were reported. |
| Other bias | Unclear risk | None identified |
BC: beta carotene
CRC: colorectal cancer
IBD: inflammatory bowel disease
FAP: familial adenomatous polyposis
ITT: intention‐to‐treat
RCT: randomised controlled trial
WBF: wheat bran fibre
Characteristics of excluded studies [ordered by study ID]
| Study | Reason for exclusion |
| Not RCT. Review article | |
| Not RCT | |
| Participants were diagnosed with Lynch syndrome in this study. Only a minority of participants had a procedure to remove polyps and data were unavailable for the few participants who had the procedure. Furthermore, the control group intervention was aspirin rather than placebo. | |
| Not RCT. Review article | |
| Not RCT. Review article | |
| Not RCT. Review article | |
| Not RCT. Review article | |
| Not RCT. Review article | |
| Not RCT. Review article | |
| Not RCT. Review article | |
| Feasibility study, not RCT. Outcome measures were not by direct visualisation | |
| Not RCT, but pooled analysis from two trials which has been included by our review | |
| The interventions did not meet inclusion criteria: flexible sigmoidoscopy vs usual medical care. | |
| Article is only on the changes in dietary intake for included study Schatzkin 2000. | |
| The intervention was ORAFTI_Synergy1 prebiotic supplement, and not dietary fibre | |
| Not RCT. Review article | |
| Not RCT. Review article | |
| Not RCT. Review article | |
| This is only a summary of the included Alberts 2000 study. No additional new data | |
| Not RCT |
RCT: randomised controlled trial
Characteristics of studies awaiting assessment [ordered by study ID]
| Methods | Double blind, randomised, cross‐over placebo‐controlled trial |
| Participants | Participants with Familial Adenomatous Polyposis (FAP) |
| Interventions | Dietary butyrylated high amylose maize starch vs placebo |
| Outcomes | No details This is a conference abstract, awaiting full report |
| Notes | Awaiting full report |
Characteristics of ongoing studies [ordered by study ID]
| Trial name or title | Ishikawa 2000 |
| Methods | RCT |
| Participants | People with CRA |
| Interventions | Wheat bran fibre |
| Outcomes | Rate of CRA, CRC |
| Starting date | 1997 |
| Contact information | NA |
| Notes | Authors of this review tried to contact Dr Ishikawa (last email sent on 6 April 2016) for further information, but have not received a reply. |
CRA: colorectal adenoma
CRC: colorectal cancer
RCT: randomised controlled trial
Data and analyses
| Outcome or subgroup title | No. of studies | No. of participants | Statistical method | Effect size |
| 1 Number of participants with at least one recurrent adenoma Show forest plot | 5 | 3641 | Risk Ratio (M‐H, Fixed, 95% CI) | 1.04 [0.95, 1.13] |
| Analysis 1.1  Comparison 1 Dietary fibre (all study interventions) versus control, Outcome 1 Number of participants with at least one recurrent adenoma. | ||||
| 2 Number of participants with more than one adenoma Show forest plot | 2 | 2542 | Risk Ratio (M‐H, Fixed, 95% CI) | 1.06 [0.94, 1.20] |
| Analysis 1.2  Comparison 1 Dietary fibre (all study interventions) versus control, Outcome 2 Number of participants with more than one adenoma. | ||||
| 3 Number of participants with at least one adenoma 1 cm or greater Show forest plot | 4 | 3224 | Risk Ratio (M‐H, Fixed, 95% CI) | 0.99 [0.82, 1.20] |
| Analysis 1.3  Comparison 1 Dietary fibre (all study interventions) versus control, Outcome 3 Number of participants with at least one adenoma 1 cm or greater. | ||||
| 4 Number of participants diagnosed with colorectal cancer Show forest plot | 2 | Risk Ratio (M‐H, Fixed, 95% CI) | Subtotals only | |
| Analysis 1.4 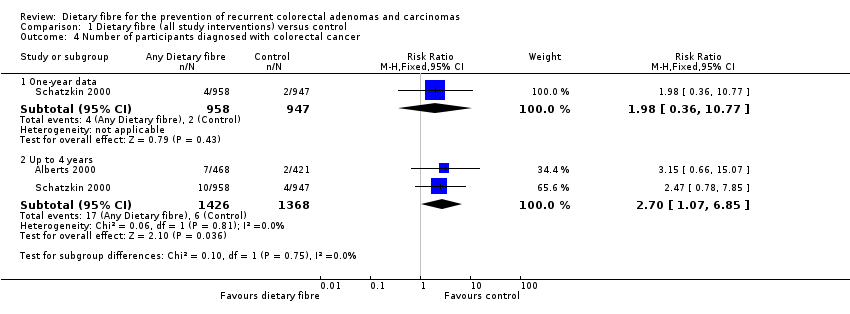 Comparison 1 Dietary fibre (all study interventions) versus control, Outcome 4 Number of participants diagnosed with colorectal cancer. | ||||
| 4.1 One‐ year data | 1 | 1905 | Risk Ratio (M‐H, Fixed, 95% CI) | 1.98 [0.36, 10.77] |
| 4.2 Up to 4 years | 2 | 2794 | Risk Ratio (M‐H, Fixed, 95% CI) | 2.70 [1.07, 6.85] |
| Outcome or subgroup title | No. of studies | No. of participants | Statistical method | Effect size |
| 1 Number of participants with at least one recurrent adenoma Show forest plot | 2 | 1195 | Risk Ratio (M‐H, Fixed, 95% CI) | 1.01 [0.87, 1.18] |
| Analysis 2.1 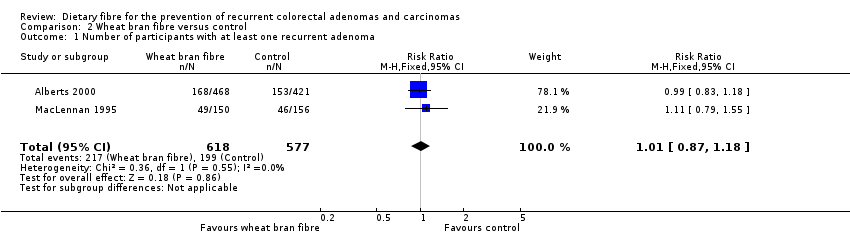 Comparison 2 Wheat bran fibre versus control, Outcome 1 Number of participants with at least one recurrent adenoma. | ||||
| 2 Number of participants with more than one adenoma Show forest plot | 1 | 637 | Risk Ratio (M‐H, Fixed, 95% CI) | 1.11 [0.97, 1.29] |
| Analysis 2.2 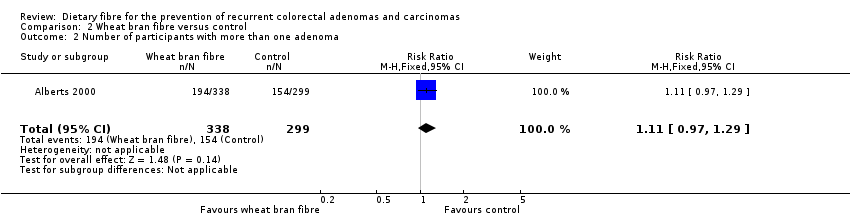 Comparison 2 Wheat bran fibre versus control, Outcome 2 Number of participants with more than one adenoma. | ||||
| 3 Number of participants with at least one adenoma 1 cm or greater Show forest plot | 1 | 637 | Risk Ratio (M‐H, Fixed, 95% CI) | 1.04 [0.83, 1.31] |
| Analysis 2.3 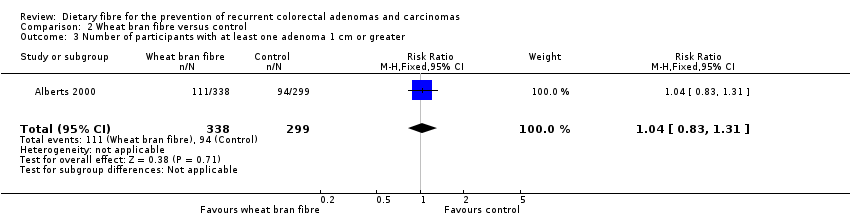 Comparison 2 Wheat bran fibre versus control, Outcome 3 Number of participants with at least one adenoma 1 cm or greater. | ||||
| Outcome or subgroup title | No. of studies | No. of participants | Statistical method | Effect size |
| 1 Number of participants with at least one recurrent adenoma Show forest plot | 1 | 165 | Risk Ratio (M‐H, Fixed, 95% CI) | 1.19 [0.64, 2.18] |
| Analysis 3.1 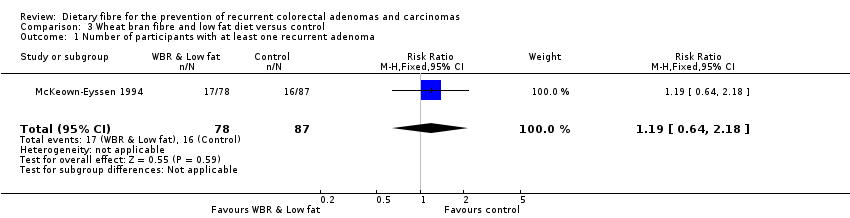 Comparison 3 Wheat bran fibre and low fat diet versus control, Outcome 1 Number of participants with at least one recurrent adenoma. | ||||
| Outcome or subgroup title | No. of studies | No. of participants | Statistical method | Effect size |
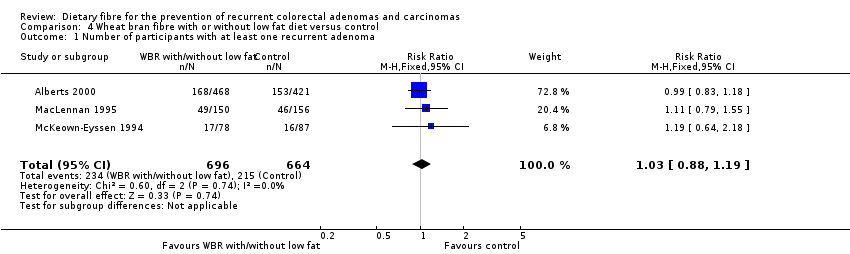
| 1 Number of participants with at least one recurrent adenoma Show forest plot | 3 | 1360 | Risk Ratio (M‐H, Fixed, 95% CI) | 1.03 [0.88, 1.19] |
| Analysis 4.1  Comparison 4 Wheat bran fibre with or without low fat diet versus control, Outcome 1 Number of participants with at least one recurrent adenoma. | ||||
| 2 Number of participants with more than one adenoma Show forest plot | 1 | 637 | Risk Ratio (M‐H, Fixed, 95% CI) | 1.11 [0.97, 1.29] |
| Analysis 4.2 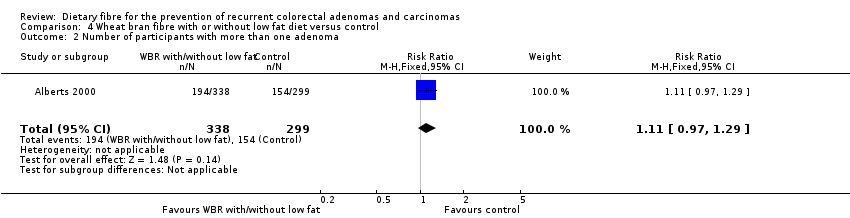 Comparison 4 Wheat bran fibre with or without low fat diet versus control, Outcome 2 Number of participants with more than one adenoma. | ||||
| 3 Number of participants with at least one adenoma 1 cm or greater Show forest plot | 2 | 943 | Risk Ratio (M‐H, Fixed, 95% CI) | 1.02 [0.81, 1.27] |
| Analysis 4.3 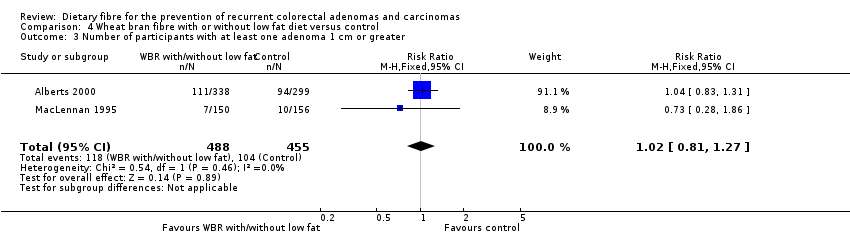 Comparison 4 Wheat bran fibre with or without low fat diet versus control, Outcome 3 Number of participants with at least one adenoma 1 cm or greater. | ||||
| Outcome or subgroup title | No. of studies | No. of participants | Statistical method | Effect size |
| 1 Number of participants with at least one recurrent adenoma (4 years) Show forest plot | 1 | 1905 | Risk Ratio (M‐H, Fixed, 95% CI) | 1.00 [0.90, 1.12] |
| Analysis 5.1 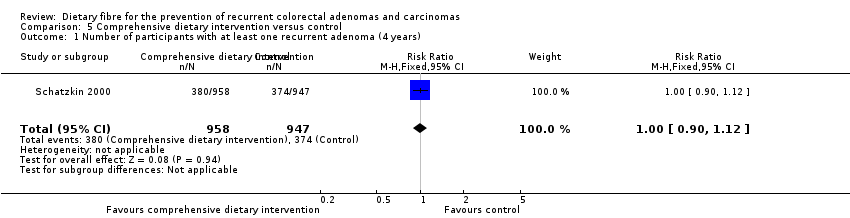 Comparison 5 Comprehensive dietary intervention versus control, Outcome 1 Number of participants with at least one recurrent adenoma (4 years). | ||||
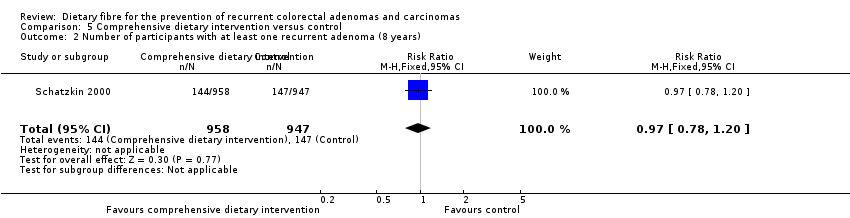
| 2 Number of participants with at least one recurrent adenoma (8 years) Show forest plot | 1 | 1905 | Risk Ratio (M‐H, Fixed, 95% CI) | 0.97 [0.78, 1.20] |
| Analysis 5.2  Comparison 5 Comprehensive dietary intervention versus control, Outcome 2 Number of participants with at least one recurrent adenoma (8 years). | ||||
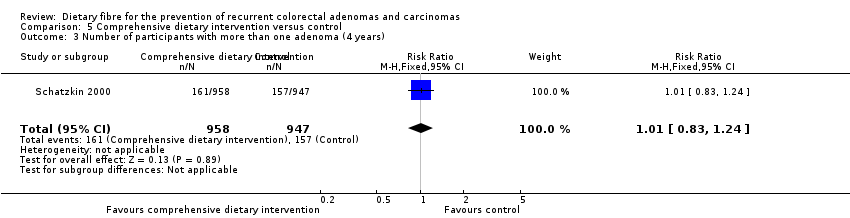
| 3 Number of participants with more than one adenoma (4 years) Show forest plot | 1 | 1905 | Risk Ratio (M‐H, Fixed, 95% CI) | 1.01 [0.83, 1.24] |
| Analysis 5.3  Comparison 5 Comprehensive dietary intervention versus control, Outcome 3 Number of participants with more than one adenoma (4 years). | ||||
| 4 Number of participants with more than one adenoma (8 years) Show forest plot | 1 | 1905 | Risk Ratio (M‐H, Fixed, 95% CI) | 0.89 [0.64, 1.24] |
| Analysis 5.4  Comparison 5 Comprehensive dietary intervention versus control, Outcome 4 Number of participants with more than one adenoma (8 years). | ||||
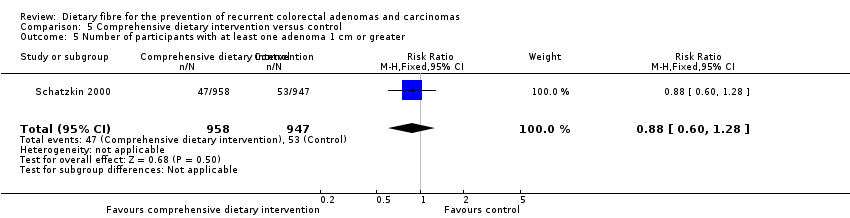
| 5 Number of participants with at least one adenoma 1 cm or greater Show forest plot | 1 | 1905 | Risk Ratio (M‐H, Fixed, 95% CI) | 0.88 [0.60, 1.28] |
| Analysis 5.5  Comparison 5 Comprehensive dietary intervention versus control, Outcome 5 Number of participants with at least one adenoma 1 cm or greater. | ||||
| Outcome or subgroup title | No. of studies | No. of participants | Statistical method | Effect size |
| 1 Number of participants with at least one recurrent adenoma Show forest plot | 1 | 376 | Risk Ratio (M‐H, Fixed, 95% CI) | 1.45 [1.01, 2.08] |
| Analysis 6.1  Comparison 6 Ispaghula husk versus control, Outcome 1 Number of participants with at least one recurrent adenoma. | ||||
| 2 Number of participants with at least one adenoma 1 cm or greater Show forest plot | 1 | 376 | Risk Ratio (M‐H, Fixed, 95% CI) | 1.80 [0.55, 5.87] |
| Analysis 6.2 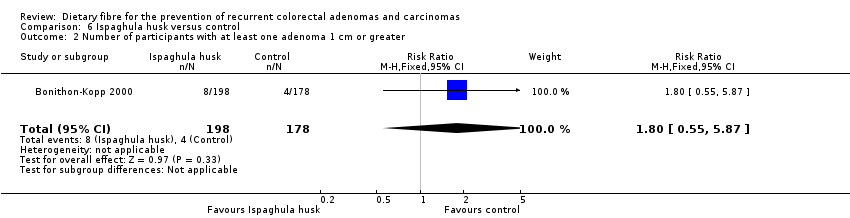 Comparison 6 Ispaghula husk versus control, Outcome 2 Number of participants with at least one adenoma 1 cm or greater. | ||||
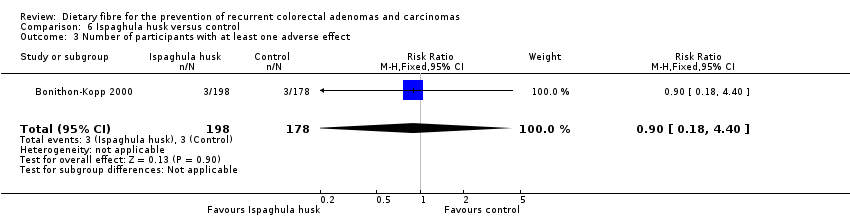
| 3 Number of participants with at least one adverse effect Show forest plot | 1 | 376 | Risk Ratio (M‐H, Fixed, 95% CI) | 0.90 [0.18, 4.40] |
| Analysis 6.3 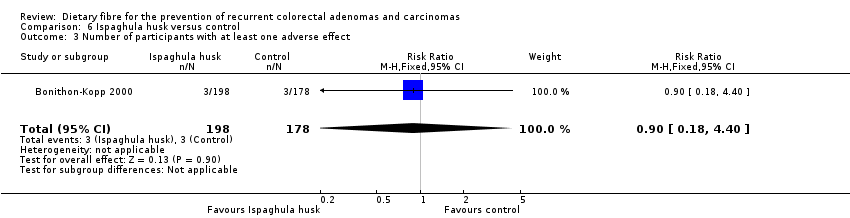 Comparison 6 Ispaghula husk versus control, Outcome 3 Number of participants with at least one adverse effect. | ||||
| Outcome or subgroup title | No. of studies | No. of participants | Statistical method | Effect size |
| 1 Number of participants with at least one recurrent adenoma Show forest plot | 5 | Risk Ratio (M‐H, Fixed, 95% CI) | Subtotals only | |
| Analysis 7.1  Comparison 7 Sensitivity analysis 1. Dietary fibre (all study interventions) versus control, Outcome 1 Number of participants with at least one recurrent adenoma. | ||||
| 1.1 Completers only | 5 | 3641 | Risk Ratio (M‐H, Fixed, 95% CI) | 1.04 [0.95, 1.13] |
| 1.2 Best case scenario | 5 | 4536 | Risk Ratio (M‐H, Fixed, 95% CI) | 0.61 [0.57, 0.66] |
| 1.3 Worst case scenario | 5 | 4536 | Risk Ratio (M‐H, Fixed, 95% CI) | 1.73 [1.60, 1.88] |
| 2 Number of participants with more than one adenoma Show forest plot | 2 | Risk Ratio (M‐H, Fixed, 95% CI) | Subtotals only | |
| Analysis 7.2  Comparison 7 Sensitivity analysis 1. Dietary fibre (all study interventions) versus control, Outcome 2 Number of participants with more than one adenoma. | ||||
| 2.1 Completers only | 2 | 2542 | Risk Ratio (M‐H, Fixed, 95% CI) | 1.06 [0.94, 1.20] |
| 2.2 Best case scenario | 2 | 3508 | Risk Ratio (M‐H, Fixed, 95% CI) | 0.43 [0.38, 0.47] |
| 2.3 Worst case scenario | 2 | 3508 | Risk Ratio (M‐H, Fixed, 95% CI) | 2.48 [2.23, 2.77] |
| 3 Number of participants with at least one adenoma 1 cm or greater Show forest plot | 4 | Risk Ratio (M‐H, Fixed, 95% CI) | Subtotals only | |
| Analysis 7.3  Comparison 7 Sensitivity analysis 1. Dietary fibre (all study interventions) versus control, Outcome 3 Number of participants with at least one adenoma 1 cm or greater. | ||||
| 3.1 Completers only | 4 | 3224 | Risk Ratio (M‐H, Fixed, 95% CI) | 0.99 [0.82, 1.20] |
| 3.2 Best case scenario | 4 | 4335 | Risk Ratio (M‐H, Fixed, 95% CI) | 0.22 [0.19, 0.26] |
| 3.3 Worst case scenario | 4 | 4335 | Risk Ratio (M‐H, Fixed, 95% CI) | 4.15 [3.56, 4.85] |
| 4 Number of participants diagnosed with colorectal cancer Show forest plot | 2 | Risk Ratio (M‐H, Fixed, 95% CI) | Subtotals only | |
| Analysis 7.4  Comparison 7 Sensitivity analysis 1. Dietary fibre (all study interventions) versus control, Outcome 4 Number of participants diagnosed with colorectal cancer. | ||||
| 4.1 One‐ year data ‐ completers only | 1 | 1905 | Risk Ratio (M‐H, Fixed, 95% CI) | 1.98 [0.36, 10.77] |
| 4.2 One‐ year data ‐ best case scenario | 1 | 2079 | Risk Ratio (M‐H, Fixed, 95% CI) | 0.04 [0.02, 0.11] |
| 4.3 One‐ year data ‐ worst case scenario | 1 | 2079 | Risk Ratio (M‐H, Fixed, 95% CI) | 41.70 [10.28, 169.08] |
| 4.4 Up to 4 years ‐ completers only | 2 | 2794 | Risk Ratio (M‐H, Fixed, 95% CI) | 2.70 [1.07, 6.85] |
| 4.5 Up to 4 years ‐ best case scenario | 2 | 3508 | Risk Ratio (M‐H, Fixed, 95% CI) | 0.05 [0.03, 0.08] |
| 4.6 Up to 4 years ‐ worst case scenario | 2 | 3508 | Risk Ratio (M‐H, Fixed, 95% CI) | 62.30 [27.32, 142.04] |
| Outcome or subgroup title | No. of studies | No. of participants | Statistical method | Effect size |
| 1 Number of participants with at least one recurrent adenoma Show forest plot | 2 | Risk Ratio (M‐H, Fixed, 95% CI) | Subtotals only | |
| Analysis 8.1  Comparison 8 Sensitivity analysis 2. Wheat bran fibre versus control, Outcome 1 Number of participants with at least one recurrent adenoma. | ||||
| 1.1 Completers only | 2 | 1195 | Risk Ratio (M‐H, Fixed, 95% CI) | 1.01 [0.87, 1.18] |
| 1.2 Best case scenario | 2 | 1819 | Risk Ratio (M‐H, Fixed, 95% CI) | 0.40 [0.35, 0.46] |
| 1.3 Worst case scenario | 2 | 1819 | Risk Ratio (M‐H, Fixed, 95% CI) | 2.46 [2.15, 2.80] |
| 2 Number of participants with more than one adenoma Show forest plot | 1 | Risk Ratio (M‐H, Fixed, 95% CI) | Subtotals only | |
| Analysis 8.2 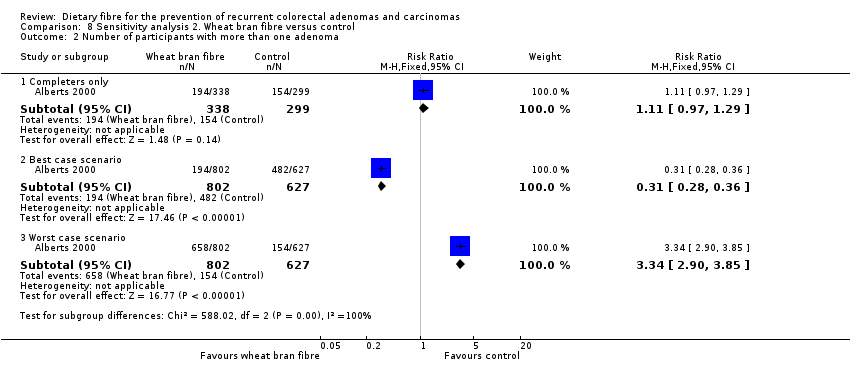 Comparison 8 Sensitivity analysis 2. Wheat bran fibre versus control, Outcome 2 Number of participants with more than one adenoma. | ||||
| 2.1 Completers only | 1 | 637 | Risk Ratio (M‐H, Fixed, 95% CI) | 1.11 [0.97, 1.29] |
| 2.2 Best case scenario | 1 | 1429 | Risk Ratio (M‐H, Fixed, 95% CI) | 0.31 [0.28, 0.36] |
| 2.3 Worst case scenario | 1 | 1429 | Risk Ratio (M‐H, Fixed, 95% CI) | 3.34 [2.90, 3.85] |
| 3 Number of participants with at least one adenoma 1 cm or greater Show forest plot | 1 | Risk Ratio (M‐H, Fixed, 95% CI) | Subtotals only | |
| Analysis 8.3 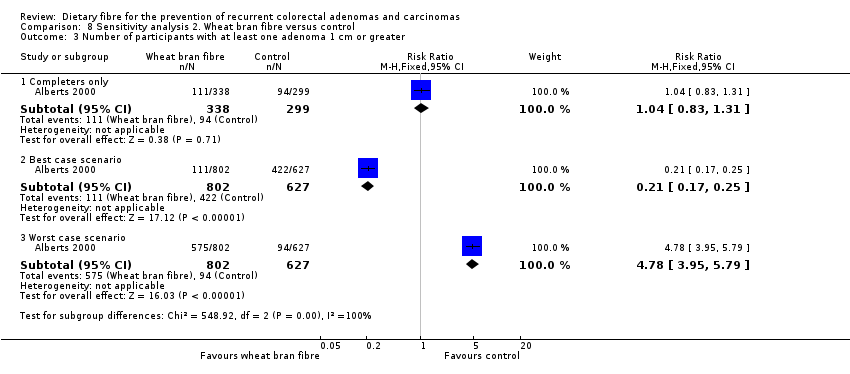 Comparison 8 Sensitivity analysis 2. Wheat bran fibre versus control, Outcome 3 Number of participants with at least one adenoma 1 cm or greater. | ||||
| 3.1 Completers only | 1 | 637 | Risk Ratio (M‐H, Fixed, 95% CI) | 1.04 [0.83, 1.31] |
| 3.2 Best case scenario | 1 | 1429 | Risk Ratio (M‐H, Fixed, 95% CI) | 0.21 [0.17, 0.25] |
| 3.3 Worst case scenario | 1 | 1429 | Risk Ratio (M‐H, Fixed, 95% CI) | 4.78 [3.95, 5.79] |
| Outcome or subgroup title | No. of studies | No. of participants | Statistical method | Effect size |
| 1 Number of participants with at least one recurrent adenoma Show forest plot | 1 | Risk Ratio (M‐H, Fixed, 95% CI) | Subtotals only | |
| Analysis 9.1 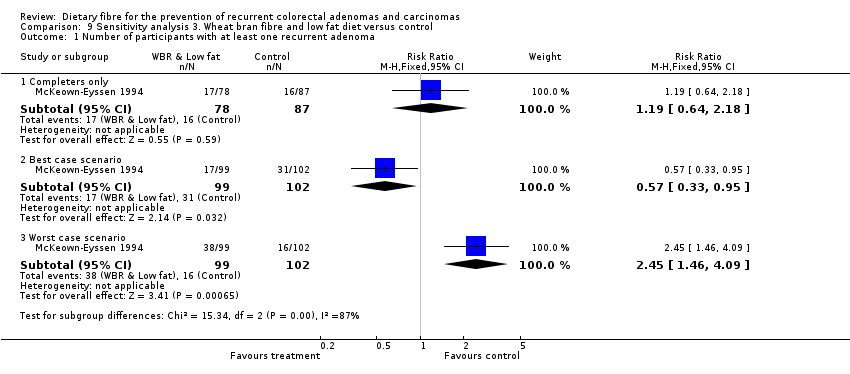 Comparison 9 Sensitivity analysis 3. Wheat bran fibre and low fat diet versus control, Outcome 1 Number of participants with at least one recurrent adenoma. | ||||
| 1.1 Completers only | 1 | 165 | Risk Ratio (M‐H, Fixed, 95% CI) | 1.19 [0.64, 2.18] |
| 1.2 Best case scenario | 1 | 201 | Risk Ratio (M‐H, Fixed, 95% CI) | 0.57 [0.33, 0.95] |
| 1.3 Worst case scenario | 1 | 201 | Risk Ratio (M‐H, Fixed, 95% CI) | 2.45 [1.46, 4.09] |
| Outcome or subgroup title | No. of studies | No. of participants | Statistical method | Effect size |
| 1 Number of participants with at least one recurrent adenoma Show forest plot | 3 | Risk Ratio (M‐H, Fixed, 95% CI) | Subtotals only | |
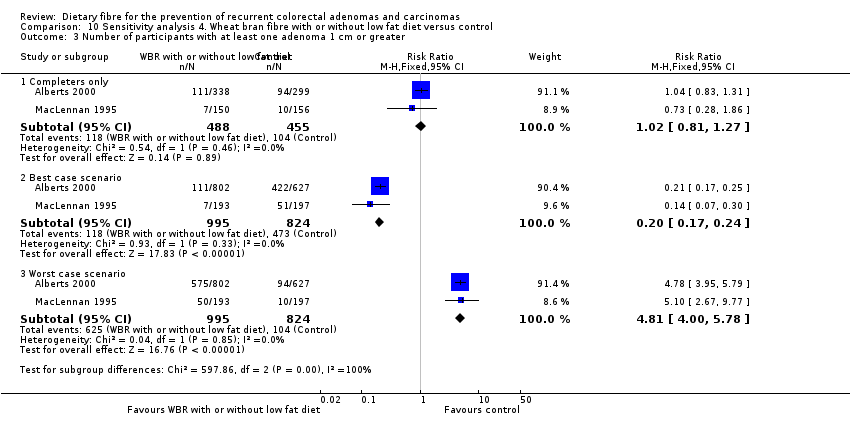
| Analysis 10.1 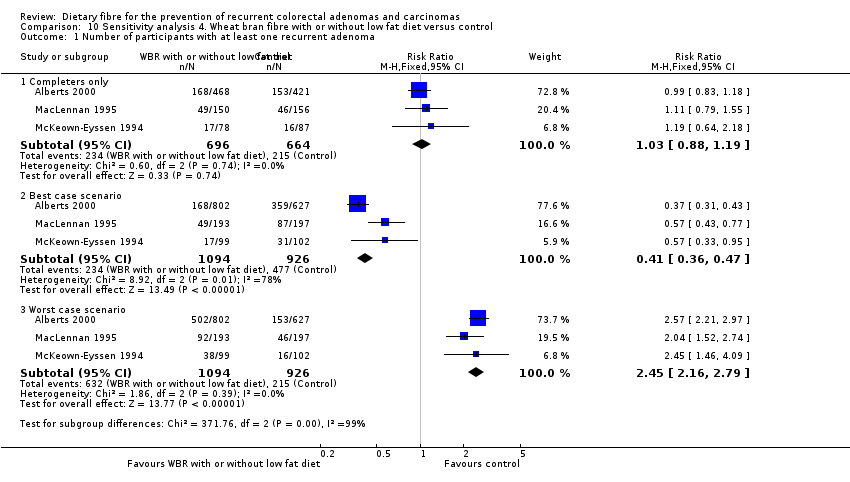 Comparison 10 Sensitivity analysis 4. Wheat bran fibre with or without low fat diet versus control, Outcome 1 Number of participants with at least one recurrent adenoma. | ||||
| 1.1 Completers only | 3 | 1360 | Risk Ratio (M‐H, Fixed, 95% CI) | 1.03 [0.88, 1.19] |
| 1.2 Best case scenario | 3 | 2020 | Risk Ratio (M‐H, Fixed, 95% CI) | 0.41 [0.36, 0.47] |
| 1.3 Worst case scenario | 3 | 2020 | Risk Ratio (M‐H, Fixed, 95% CI) | 2.45 [2.16, 2.79] |
| 2 Number of participants with more than one adenoma Show forest plot | 1 | Risk Ratio (M‐H, Fixed, 95% CI) | Subtotals only | |
| Analysis 10.2 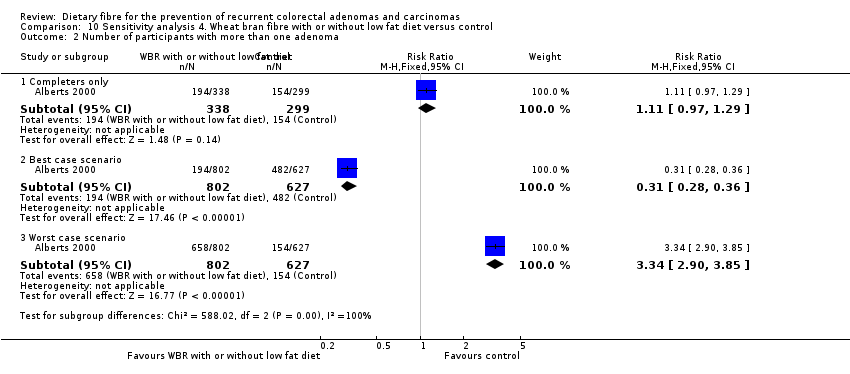 Comparison 10 Sensitivity analysis 4. Wheat bran fibre with or without low fat diet versus control, Outcome 2 Number of participants with more than one adenoma. | ||||
| 2.1 Completers only | 1 | 637 | Risk Ratio (M‐H, Fixed, 95% CI) | 1.11 [0.97, 1.29] |
| 2.2 Best case scenario | 1 | 1429 | Risk Ratio (M‐H, Fixed, 95% CI) | 0.31 [0.28, 0.36] |
| 2.3 Worst case scenario | 1 | 1429 | Risk Ratio (M‐H, Fixed, 95% CI) | 3.34 [2.90, 3.85] |
| 3 Number of participants with at least one adenoma 1 cm or greater Show forest plot | 2 | Risk Ratio (M‐H, Fixed, 95% CI) | Subtotals only | |
| Analysis 10.3  Comparison 10 Sensitivity analysis 4. Wheat bran fibre with or without low fat diet versus control, Outcome 3 Number of participants with at least one adenoma 1 cm or greater. | ||||
| 3.1 Completers only | 2 | 943 | Risk Ratio (M‐H, Fixed, 95% CI) | 1.02 [0.81, 1.27] |
| 3.2 Best case scenario | 2 | 1819 | Risk Ratio (M‐H, Fixed, 95% CI) | 0.20 [0.17, 0.24] |
| 3.3 Worst case scenario | 2 | 1819 | Risk Ratio (M‐H, Fixed, 95% CI) | 4.81 [4.00, 5.78] |
| Outcome or subgroup title | No. of studies | No. of participants | Statistical method | Effect size |
| 1 Number of participants with at least one recurrent adenoma (4 years) Show forest plot | 1 | Risk Ratio (M‐H, Fixed, 95% CI) | Subtotals only | |
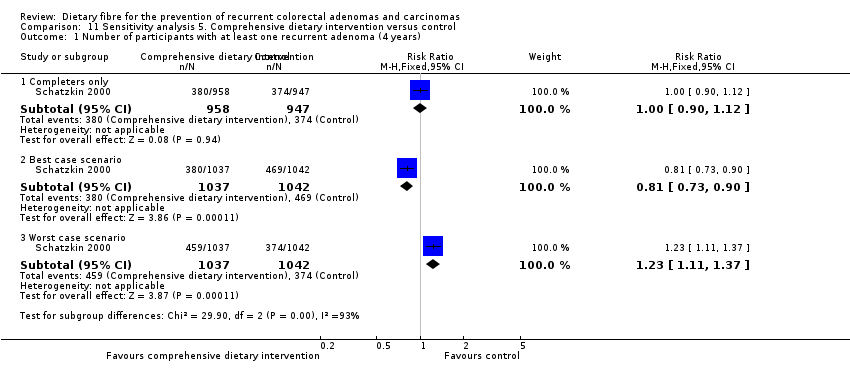
| Analysis 11.1  Comparison 11 Sensitivity analysis 5. Comprehensive dietary intervention versus control, Outcome 1 Number of participants with at least one recurrent adenoma (4 years). | ||||
| 1.1 Completers only | 1 | 1905 | Risk Ratio (M‐H, Fixed, 95% CI) | 1.00 [0.90, 1.12] |
| 1.2 Best case scenario | 1 | 2079 | Risk Ratio (M‐H, Fixed, 95% CI) | 0.81 [0.73, 0.90] |
| 1.3 Worst case scenario | 1 | 2079 | Risk Ratio (M‐H, Fixed, 95% CI) | 1.23 [1.11, 1.37] |
| 2 Number of participants with at least one recurrent adenoma (8 years) Show forest plot | 1 | Risk Ratio (M‐H, Fixed, 95% CI) | Subtotals only | |
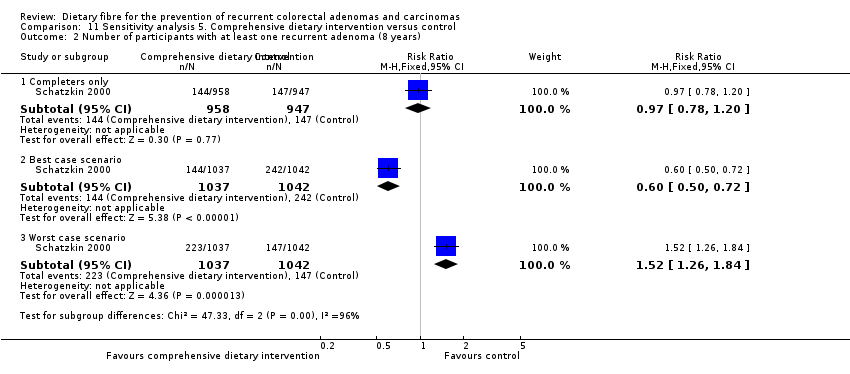
| Analysis 11.2  Comparison 11 Sensitivity analysis 5. Comprehensive dietary intervention versus control, Outcome 2 Number of participants with at least one recurrent adenoma (8 years). | ||||
| 2.1 Completers only | 1 | 1905 | Risk Ratio (M‐H, Fixed, 95% CI) | 0.97 [0.78, 1.20] |
| 2.2 Best case scenario | 1 | 2079 | Risk Ratio (M‐H, Fixed, 95% CI) | 0.60 [0.50, 0.72] |
| 2.3 Worst case scenario | 1 | 2079 | Risk Ratio (M‐H, Fixed, 95% CI) | 1.52 [1.26, 1.84] |
| 3 Number of participants with more than one adenoma (4 years) Show forest plot | 1 | Risk Ratio (M‐H, Fixed, 95% CI) | Subtotals only | |
| Analysis 11.3 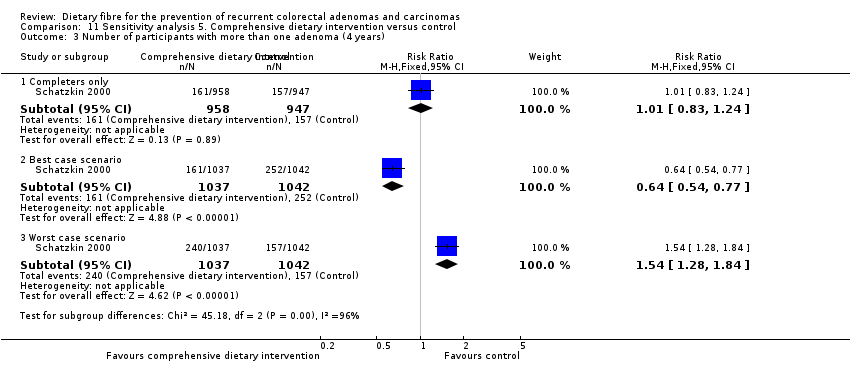 Comparison 11 Sensitivity analysis 5. Comprehensive dietary intervention versus control, Outcome 3 Number of participants with more than one adenoma (4 years). | ||||
| 3.1 Completers only | 1 | 1905 | Risk Ratio (M‐H, Fixed, 95% CI) | 1.01 [0.83, 1.24] |
| 3.2 Best case scenario | 1 | 2079 | Risk Ratio (M‐H, Fixed, 95% CI) | 0.64 [0.54, 0.77] |
| 3.3 Worst case scenario | 1 | 2079 | Risk Ratio (M‐H, Fixed, 95% CI) | 1.54 [1.28, 1.84] |
| 4 Number of participants with more than one adenoma (8 years) Show forest plot | 1 | Risk Ratio (M‐H, Fixed, 95% CI) | Subtotals only | |
| Analysis 11.4 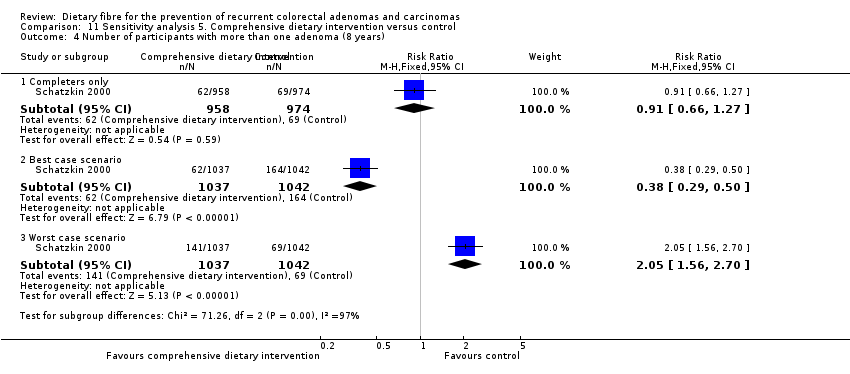 Comparison 11 Sensitivity analysis 5. Comprehensive dietary intervention versus control, Outcome 4 Number of participants with more than one adenoma (8 years). | ||||
| 4.1 Completers only | 1 | 1932 | Risk Ratio (M‐H, Fixed, 95% CI) | 0.91 [0.66, 1.27] |
| 4.2 Best case scenario | 1 | 2079 | Risk Ratio (M‐H, Fixed, 95% CI) | 0.38 [0.29, 0.50] |
| 4.3 Worst case scenario | 1 | 2079 | Risk Ratio (M‐H, Fixed, 95% CI) | 2.05 [1.56, 2.70] |
| 5 Number of participants with at least one adenoma 1 cm or greater Show forest plot | 1 | Risk Ratio (M‐H, Fixed, 95% CI) | Subtotals only | |
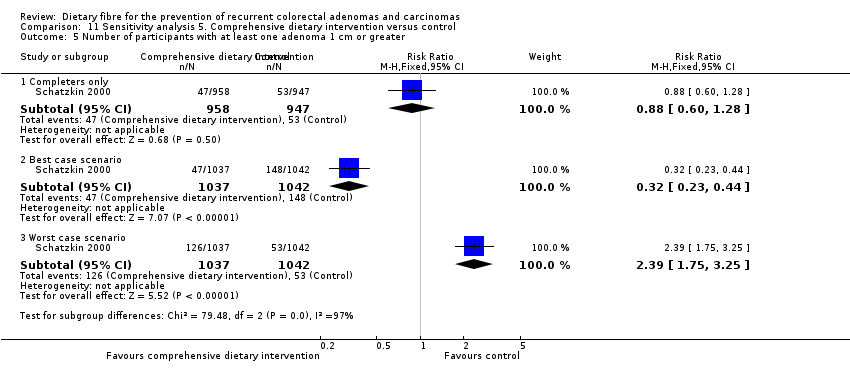
| Analysis 11.5  Comparison 11 Sensitivity analysis 5. Comprehensive dietary intervention versus control, Outcome 5 Number of participants with at least one adenoma 1 cm or greater. | ||||
| 5.1 Completers only | 1 | 1905 | Risk Ratio (M‐H, Fixed, 95% CI) | 0.88 [0.60, 1.28] |
| 5.2 Best case scenario | 1 | 2079 | Risk Ratio (M‐H, Fixed, 95% CI) | 0.32 [0.23, 0.44] |
| 5.3 Worst case scenario | 1 | 2079 | Risk Ratio (M‐H, Fixed, 95% CI) | 2.39 [1.75, 3.25] |
| Outcome or subgroup title | No. of studies | No. of participants | Statistical method | Effect size |
| 1 Number of participants with at least one recurrent adenoma Show forest plot | 1 | Risk Ratio (M‐H, Fixed, 95% CI) | Subtotals only | |
| Analysis 12.1  Comparison 12 Sensitivity analysis 6. Ispaghula husk versus control, Outcome 1 Number of participants with at least one recurrent adenoma. | ||||
| 1.1 Completers only | 1 | 376 | Risk Ratio (M‐H, Fixed, 95% CI) | 1.45 [1.01, 2.08] |
| 1.2 Best case scenario | 1 | 437 | Risk Ratio (M‐H, Fixed, 95% CI) | 0.78 [0.58, 1.05] |
| 1.3 Worst case scenario | 1 | 437 | Risk Ratio (M‐H, Fixed, 95% CI) | 2.23 [1.59, 3.14] |
| 2 Number of participants with at least one adenoma 1 cm or greater Show forest plot | 1 | Risk Ratio (M‐H, Fixed, 95% CI) | Subtotals only | |
| Analysis 12.2 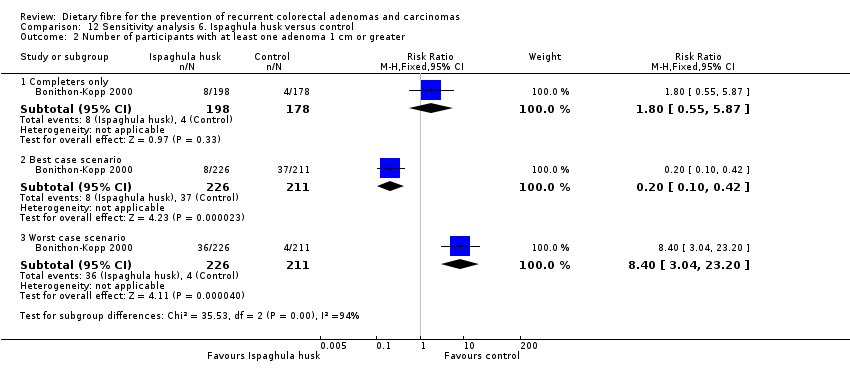 Comparison 12 Sensitivity analysis 6. Ispaghula husk versus control, Outcome 2 Number of participants with at least one adenoma 1 cm or greater. | ||||
| 2.1 Completers only | 1 | 376 | Risk Ratio (M‐H, Fixed, 95% CI) | 1.80 [0.55, 5.87] |
| 2.2 Best case scenario | 1 | 437 | Risk Ratio (M‐H, Fixed, 95% CI) | 0.20 [0.10, 0.42] |
| 2.3 Worst case scenario | 1 | 437 | Risk Ratio (M‐H, Fixed, 95% CI) | 8.40 [3.04, 23.20] |
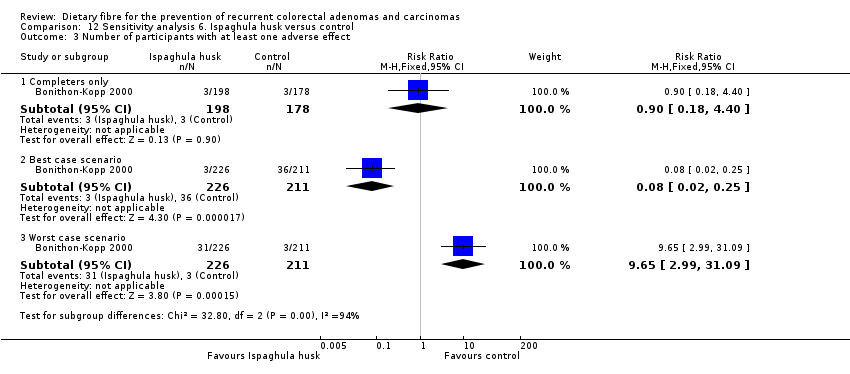
| 3 Number of participants with at least one adverse effect Show forest plot | 1 | Risk Ratio (M‐H, Fixed, 95% CI) | Subtotals only | |
| Analysis 12.3  Comparison 12 Sensitivity analysis 6. Ispaghula husk versus control, Outcome 3 Number of participants with at least one adverse effect. | ||||
| 3.1 Completers only | 1 | 376 | Risk Ratio (M‐H, Fixed, 95% CI) | 0.90 [0.18, 4.40] |
| 3.2 Best case scenario | 1 | 437 | Risk Ratio (M‐H, Fixed, 95% CI) | 0.08 [0.02, 0.25] |
| 3.3 Worst case scenario | 1 | 437 | Risk Ratio (M‐H, Fixed, 95% CI) | 9.65 [2.99, 31.09] |

Study flow diagram


Comparison 1 Dietary fibre (all study interventions) versus control, Outcome 1 Number of participants with at least one recurrent adenoma.
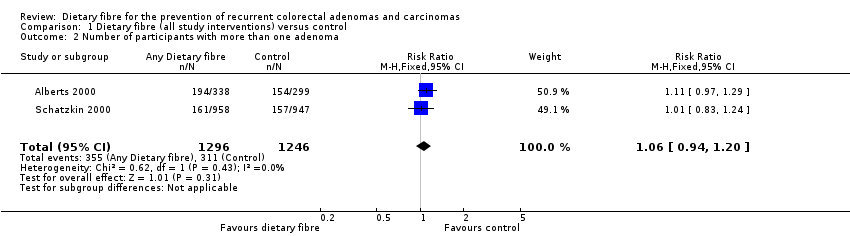
Comparison 1 Dietary fibre (all study interventions) versus control, Outcome 2 Number of participants with more than one adenoma.

Comparison 1 Dietary fibre (all study interventions) versus control, Outcome 3 Number of participants with at least one adenoma 1 cm or greater.

Comparison 1 Dietary fibre (all study interventions) versus control, Outcome 4 Number of participants diagnosed with colorectal cancer.

Comparison 2 Wheat bran fibre versus control, Outcome 1 Number of participants with at least one recurrent adenoma.

Comparison 2 Wheat bran fibre versus control, Outcome 2 Number of participants with more than one adenoma.

Comparison 2 Wheat bran fibre versus control, Outcome 3 Number of participants with at least one adenoma 1 cm or greater.

Comparison 3 Wheat bran fibre and low fat diet versus control, Outcome 1 Number of participants with at least one recurrent adenoma.
Comparison 4 Wheat bran fibre with or without low fat diet versus control, Outcome 1 Number of participants with at least one recurrent adenoma.

Comparison 4 Wheat bran fibre with or without low fat diet versus control, Outcome 2 Number of participants with more than one adenoma.

Comparison 4 Wheat bran fibre with or without low fat diet versus control, Outcome 3 Number of participants with at least one adenoma 1 cm or greater.

Comparison 5 Comprehensive dietary intervention versus control, Outcome 1 Number of participants with at least one recurrent adenoma (4 years).
Comparison 5 Comprehensive dietary intervention versus control, Outcome 2 Number of participants with at least one recurrent adenoma (8 years).
Comparison 5 Comprehensive dietary intervention versus control, Outcome 3 Number of participants with more than one adenoma (4 years).

Comparison 5 Comprehensive dietary intervention versus control, Outcome 4 Number of participants with more than one adenoma (8 years).
Comparison 5 Comprehensive dietary intervention versus control, Outcome 5 Number of participants with at least one adenoma 1 cm or greater.

Comparison 6 Ispaghula husk versus control, Outcome 1 Number of participants with at least one recurrent adenoma.

Comparison 6 Ispaghula husk versus control, Outcome 2 Number of participants with at least one adenoma 1 cm or greater.
Comparison 6 Ispaghula husk versus control, Outcome 3 Number of participants with at least one adverse effect.

Comparison 7 Sensitivity analysis 1. Dietary fibre (all study interventions) versus control, Outcome 1 Number of participants with at least one recurrent adenoma.
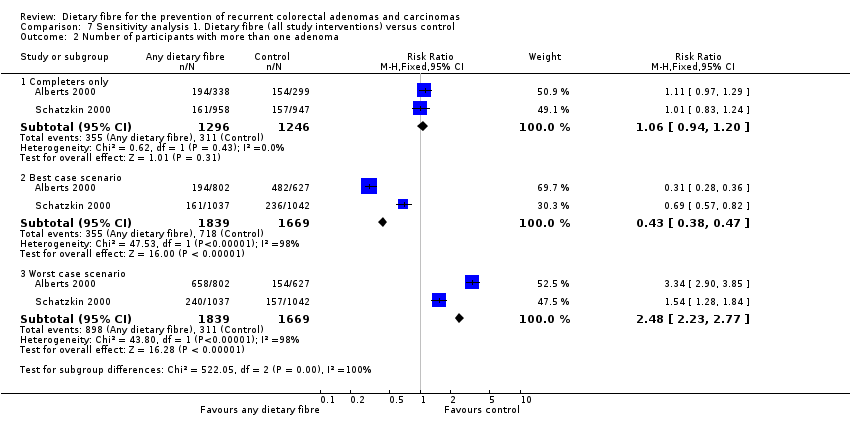
Comparison 7 Sensitivity analysis 1. Dietary fibre (all study interventions) versus control, Outcome 2 Number of participants with more than one adenoma.
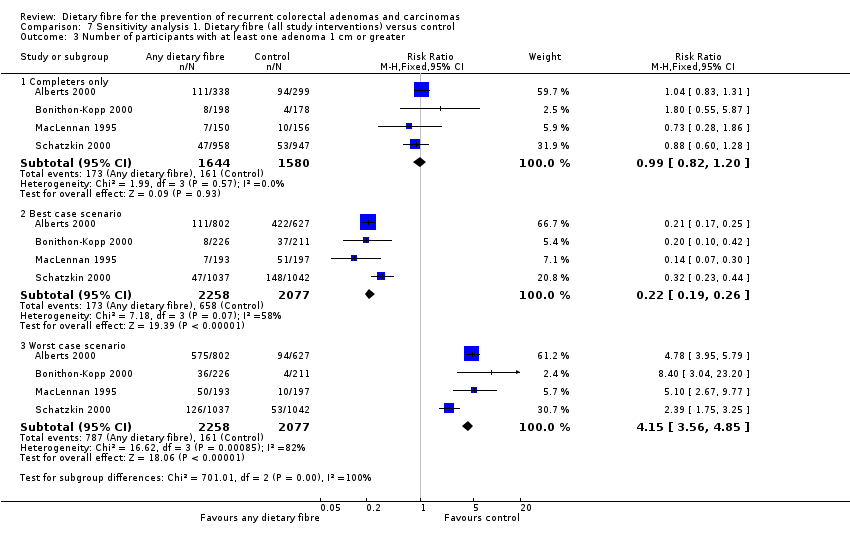
Comparison 7 Sensitivity analysis 1. Dietary fibre (all study interventions) versus control, Outcome 3 Number of participants with at least one adenoma 1 cm or greater.
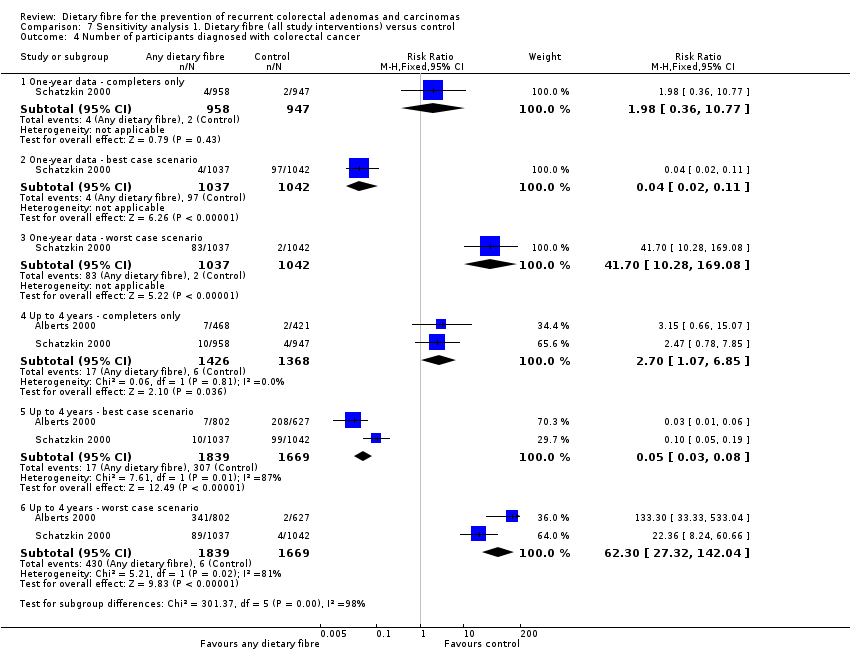
Comparison 7 Sensitivity analysis 1. Dietary fibre (all study interventions) versus control, Outcome 4 Number of participants diagnosed with colorectal cancer.
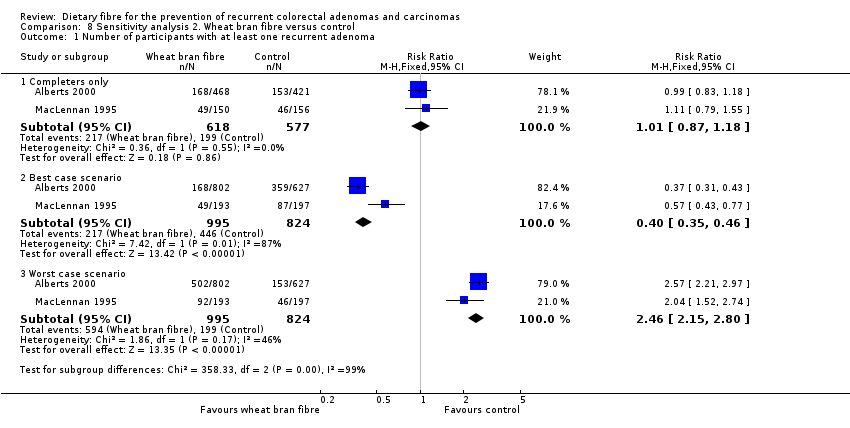
Comparison 8 Sensitivity analysis 2. Wheat bran fibre versus control, Outcome 1 Number of participants with at least one recurrent adenoma.

Comparison 8 Sensitivity analysis 2. Wheat bran fibre versus control, Outcome 2 Number of participants with more than one adenoma.

Comparison 8 Sensitivity analysis 2. Wheat bran fibre versus control, Outcome 3 Number of participants with at least one adenoma 1 cm or greater.

Comparison 9 Sensitivity analysis 3. Wheat bran fibre and low fat diet versus control, Outcome 1 Number of participants with at least one recurrent adenoma.

Comparison 10 Sensitivity analysis 4. Wheat bran fibre with or without low fat diet versus control, Outcome 1 Number of participants with at least one recurrent adenoma.

Comparison 10 Sensitivity analysis 4. Wheat bran fibre with or without low fat diet versus control, Outcome 2 Number of participants with more than one adenoma.
Comparison 10 Sensitivity analysis 4. Wheat bran fibre with or without low fat diet versus control, Outcome 3 Number of participants with at least one adenoma 1 cm or greater.
Comparison 11 Sensitivity analysis 5. Comprehensive dietary intervention versus control, Outcome 1 Number of participants with at least one recurrent adenoma (4 years).
Comparison 11 Sensitivity analysis 5. Comprehensive dietary intervention versus control, Outcome 2 Number of participants with at least one recurrent adenoma (8 years).

Comparison 11 Sensitivity analysis 5. Comprehensive dietary intervention versus control, Outcome 3 Number of participants with more than one adenoma (4 years).

Comparison 11 Sensitivity analysis 5. Comprehensive dietary intervention versus control, Outcome 4 Number of participants with more than one adenoma (8 years).
Comparison 11 Sensitivity analysis 5. Comprehensive dietary intervention versus control, Outcome 5 Number of participants with at least one adenoma 1 cm or greater.

Comparison 12 Sensitivity analysis 6. Ispaghula husk versus control, Outcome 1 Number of participants with at least one recurrent adenoma.

Comparison 12 Sensitivity analysis 6. Ispaghula husk versus control, Outcome 2 Number of participants with at least one adenoma 1 cm or greater.
Comparison 12 Sensitivity analysis 6. Ispaghula husk versus control, Outcome 3 Number of participants with at least one adverse effect.
| Dietary fibre (all study interventions) versus control for the prevention of colorectal adenomas and carcinomas | ||||||
| Patient or population: people with a history of colorectal adenomas | ||||||
| Outcomes | Illustrative comparative risks* (95% CI) | Relative effect | No of participants | Quality of the evidence | Comments | |
| Assumed risk | Corresponding risk | |||||
| Control | Dietary fibre (all study interventions) versus control | |||||
| Number of participantswith at least one recurrent adenoma | Study population | RR 1.04 | 3641 | ⊕⊕⊝⊝ | ||
| 349 per 1000 | 363 per 1000 | |||||
| Moderate | ||||||
| 295 per 1000 | 307 per 1000 | |||||
| Number of participantswith more than one adenoma | Study population | RR 1.06 | 2542 | ⊕⊕⊝⊝ | ||
| 250 per 1000 | 265 per 1000 | |||||
| Moderate | ||||||
| 340 per 1000 | 360 per 1000 | |||||
| Number of participantswith at least one adenoma 1 cm or greater Follow up: 3 to 4 years | Study population | RR 0.99 | 3224 | ⊕⊕⊝⊝ | ||
| 102 per 1000 | 101 per 1000 | |||||
| Moderate | ||||||
| 60 per 1000 | 59 per 1000 | |||||
| Number of participantsdiagnosed with colorectal cancer | Study population | RR 2.70 | 2794 | ⊕⊕⊝⊝ | The incidence of colorectal cancer is very low, so when risk was calculated by risk difference (RD), the difference between groups was very small. RD = 0.01, 95% CI 0.00 to 0.01 | |
| 4 per 1000 | 12 per 1000 | |||||
| Moderate | ||||||
| 5 per 1000 | 14 per 1000 | |||||
| *The basis for the assumed risk (e.g. the median control group risk across studies) is provided in footnotes. The corresponding risk (and its 95% confidence interval) is based on the assumed risk in the comparison group and the relative effect of the intervention (and its 95% CI). | ||||||
| GRADE Working Group grades of evidence | ||||||
| a Risk of bias: downgraded by one level due to high risk of detection/performance bias and attrition bias. | ||||||
| Outcome or subgroup title | No. of studies | No. of participants | Statistical method | Effect size |
| 1 Number of participants with at least one recurrent adenoma Show forest plot | 5 | 3641 | Risk Ratio (M‐H, Fixed, 95% CI) | 1.04 [0.95, 1.13] |
| 2 Number of participants with more than one adenoma Show forest plot | 2 | 2542 | Risk Ratio (M‐H, Fixed, 95% CI) | 1.06 [0.94, 1.20] |
| 3 Number of participants with at least one adenoma 1 cm or greater Show forest plot | 4 | 3224 | Risk Ratio (M‐H, Fixed, 95% CI) | 0.99 [0.82, 1.20] |
| 4 Number of participants diagnosed with colorectal cancer Show forest plot | 2 | Risk Ratio (M‐H, Fixed, 95% CI) | Subtotals only | |
| 4.1 One‐ year data | 1 | 1905 | Risk Ratio (M‐H, Fixed, 95% CI) | 1.98 [0.36, 10.77] |
| 4.2 Up to 4 years | 2 | 2794 | Risk Ratio (M‐H, Fixed, 95% CI) | 2.70 [1.07, 6.85] |
| Outcome or subgroup title | No. of studies | No. of participants | Statistical method | Effect size |
| 1 Number of participants with at least one recurrent adenoma Show forest plot | 2 | 1195 | Risk Ratio (M‐H, Fixed, 95% CI) | 1.01 [0.87, 1.18] |
| 2 Number of participants with more than one adenoma Show forest plot | 1 | 637 | Risk Ratio (M‐H, Fixed, 95% CI) | 1.11 [0.97, 1.29] |
| 3 Number of participants with at least one adenoma 1 cm or greater Show forest plot | 1 | 637 | Risk Ratio (M‐H, Fixed, 95% CI) | 1.04 [0.83, 1.31] |
| Outcome or subgroup title | No. of studies | No. of participants | Statistical method | Effect size |
| 1 Number of participants with at least one recurrent adenoma Show forest plot | 1 | 165 | Risk Ratio (M‐H, Fixed, 95% CI) | 1.19 [0.64, 2.18] |
| Outcome or subgroup title | No. of studies | No. of participants | Statistical method | Effect size |
| 1 Number of participants with at least one recurrent adenoma Show forest plot | 3 | 1360 | Risk Ratio (M‐H, Fixed, 95% CI) | 1.03 [0.88, 1.19] |
| 2 Number of participants with more than one adenoma Show forest plot | 1 | 637 | Risk Ratio (M‐H, Fixed, 95% CI) | 1.11 [0.97, 1.29] |
| 3 Number of participants with at least one adenoma 1 cm or greater Show forest plot | 2 | 943 | Risk Ratio (M‐H, Fixed, 95% CI) | 1.02 [0.81, 1.27] |
| Outcome or subgroup title | No. of studies | No. of participants | Statistical method | Effect size |
| 1 Number of participants with at least one recurrent adenoma (4 years) Show forest plot | 1 | 1905 | Risk Ratio (M‐H, Fixed, 95% CI) | 1.00 [0.90, 1.12] |
| 2 Number of participants with at least one recurrent adenoma (8 years) Show forest plot | 1 | 1905 | Risk Ratio (M‐H, Fixed, 95% CI) | 0.97 [0.78, 1.20] |
| 3 Number of participants with more than one adenoma (4 years) Show forest plot | 1 | 1905 | Risk Ratio (M‐H, Fixed, 95% CI) | 1.01 [0.83, 1.24] |
| 4 Number of participants with more than one adenoma (8 years) Show forest plot | 1 | 1905 | Risk Ratio (M‐H, Fixed, 95% CI) | 0.89 [0.64, 1.24] |
| 5 Number of participants with at least one adenoma 1 cm or greater Show forest plot | 1 | 1905 | Risk Ratio (M‐H, Fixed, 95% CI) | 0.88 [0.60, 1.28] |
| Outcome or subgroup title | No. of studies | No. of participants | Statistical method | Effect size |
| 1 Number of participants with at least one recurrent adenoma Show forest plot | 1 | 376 | Risk Ratio (M‐H, Fixed, 95% CI) | 1.45 [1.01, 2.08] |
| 2 Number of participants with at least one adenoma 1 cm or greater Show forest plot | 1 | 376 | Risk Ratio (M‐H, Fixed, 95% CI) | 1.80 [0.55, 5.87] |
| 3 Number of participants with at least one adverse effect Show forest plot | 1 | 376 | Risk Ratio (M‐H, Fixed, 95% CI) | 0.90 [0.18, 4.40] |
| Outcome or subgroup title | No. of studies | No. of participants | Statistical method | Effect size |
| 1 Number of participants with at least one recurrent adenoma Show forest plot | 5 | Risk Ratio (M‐H, Fixed, 95% CI) | Subtotals only | |
| 1.1 Completers only | 5 | 3641 | Risk Ratio (M‐H, Fixed, 95% CI) | 1.04 [0.95, 1.13] |
| 1.2 Best case scenario | 5 | 4536 | Risk Ratio (M‐H, Fixed, 95% CI) | 0.61 [0.57, 0.66] |
| 1.3 Worst case scenario | 5 | 4536 | Risk Ratio (M‐H, Fixed, 95% CI) | 1.73 [1.60, 1.88] |
| 2 Number of participants with more than one adenoma Show forest plot | 2 | Risk Ratio (M‐H, Fixed, 95% CI) | Subtotals only | |
| 2.1 Completers only | 2 | 2542 | Risk Ratio (M‐H, Fixed, 95% CI) | 1.06 [0.94, 1.20] |
| 2.2 Best case scenario | 2 | 3508 | Risk Ratio (M‐H, Fixed, 95% CI) | 0.43 [0.38, 0.47] |
| 2.3 Worst case scenario | 2 | 3508 | Risk Ratio (M‐H, Fixed, 95% CI) | 2.48 [2.23, 2.77] |
| 3 Number of participants with at least one adenoma 1 cm or greater Show forest plot | 4 | Risk Ratio (M‐H, Fixed, 95% CI) | Subtotals only | |
| 3.1 Completers only | 4 | 3224 | Risk Ratio (M‐H, Fixed, 95% CI) | 0.99 [0.82, 1.20] |
| 3.2 Best case scenario | 4 | 4335 | Risk Ratio (M‐H, Fixed, 95% CI) | 0.22 [0.19, 0.26] |
| 3.3 Worst case scenario | 4 | 4335 | Risk Ratio (M‐H, Fixed, 95% CI) | 4.15 [3.56, 4.85] |
| 4 Number of participants diagnosed with colorectal cancer Show forest plot | 2 | Risk Ratio (M‐H, Fixed, 95% CI) | Subtotals only | |
| 4.1 One‐ year data ‐ completers only | 1 | 1905 | Risk Ratio (M‐H, Fixed, 95% CI) | 1.98 [0.36, 10.77] |
| 4.2 One‐ year data ‐ best case scenario | 1 | 2079 | Risk Ratio (M‐H, Fixed, 95% CI) | 0.04 [0.02, 0.11] |
| 4.3 One‐ year data ‐ worst case scenario | 1 | 2079 | Risk Ratio (M‐H, Fixed, 95% CI) | 41.70 [10.28, 169.08] |
| 4.4 Up to 4 years ‐ completers only | 2 | 2794 | Risk Ratio (M‐H, Fixed, 95% CI) | 2.70 [1.07, 6.85] |
| 4.5 Up to 4 years ‐ best case scenario | 2 | 3508 | Risk Ratio (M‐H, Fixed, 95% CI) | 0.05 [0.03, 0.08] |
| 4.6 Up to 4 years ‐ worst case scenario | 2 | 3508 | Risk Ratio (M‐H, Fixed, 95% CI) | 62.30 [27.32, 142.04] |
| Outcome or subgroup title | No. of studies | No. of participants | Statistical method | Effect size |
| 1 Number of participants with at least one recurrent adenoma Show forest plot | 2 | Risk Ratio (M‐H, Fixed, 95% CI) | Subtotals only | |
| 1.1 Completers only | 2 | 1195 | Risk Ratio (M‐H, Fixed, 95% CI) | 1.01 [0.87, 1.18] |
| 1.2 Best case scenario | 2 | 1819 | Risk Ratio (M‐H, Fixed, 95% CI) | 0.40 [0.35, 0.46] |
| 1.3 Worst case scenario | 2 | 1819 | Risk Ratio (M‐H, Fixed, 95% CI) | 2.46 [2.15, 2.80] |
| 2 Number of participants with more than one adenoma Show forest plot | 1 | Risk Ratio (M‐H, Fixed, 95% CI) | Subtotals only | |
| 2.1 Completers only | 1 | 637 | Risk Ratio (M‐H, Fixed, 95% CI) | 1.11 [0.97, 1.29] |
| 2.2 Best case scenario | 1 | 1429 | Risk Ratio (M‐H, Fixed, 95% CI) | 0.31 [0.28, 0.36] |
| 2.3 Worst case scenario | 1 | 1429 | Risk Ratio (M‐H, Fixed, 95% CI) | 3.34 [2.90, 3.85] |
| 3 Number of participants with at least one adenoma 1 cm or greater Show forest plot | 1 | Risk Ratio (M‐H, Fixed, 95% CI) | Subtotals only | |
| 3.1 Completers only | 1 | 637 | Risk Ratio (M‐H, Fixed, 95% CI) | 1.04 [0.83, 1.31] |
| 3.2 Best case scenario | 1 | 1429 | Risk Ratio (M‐H, Fixed, 95% CI) | 0.21 [0.17, 0.25] |
| 3.3 Worst case scenario | 1 | 1429 | Risk Ratio (M‐H, Fixed, 95% CI) | 4.78 [3.95, 5.79] |
| Outcome or subgroup title | No. of studies | No. of participants | Statistical method | Effect size |
| 1 Number of participants with at least one recurrent adenoma Show forest plot | 1 | Risk Ratio (M‐H, Fixed, 95% CI) | Subtotals only | |
| 1.1 Completers only | 1 | 165 | Risk Ratio (M‐H, Fixed, 95% CI) | 1.19 [0.64, 2.18] |
| 1.2 Best case scenario | 1 | 201 | Risk Ratio (M‐H, Fixed, 95% CI) | 0.57 [0.33, 0.95] |
| 1.3 Worst case scenario | 1 | 201 | Risk Ratio (M‐H, Fixed, 95% CI) | 2.45 [1.46, 4.09] |
| Outcome or subgroup title | No. of studies | No. of participants | Statistical method | Effect size |
| 1 Number of participants with at least one recurrent adenoma Show forest plot | 3 | Risk Ratio (M‐H, Fixed, 95% CI) | Subtotals only | |
| 1.1 Completers only | 3 | 1360 | Risk Ratio (M‐H, Fixed, 95% CI) | 1.03 [0.88, 1.19] |
| 1.2 Best case scenario | 3 | 2020 | Risk Ratio (M‐H, Fixed, 95% CI) | 0.41 [0.36, 0.47] |
| 1.3 Worst case scenario | 3 | 2020 | Risk Ratio (M‐H, Fixed, 95% CI) | 2.45 [2.16, 2.79] |
| 2 Number of participants with more than one adenoma Show forest plot | 1 | Risk Ratio (M‐H, Fixed, 95% CI) | Subtotals only | |
| 2.1 Completers only | 1 | 637 | Risk Ratio (M‐H, Fixed, 95% CI) | 1.11 [0.97, 1.29] |
| 2.2 Best case scenario | 1 | 1429 | Risk Ratio (M‐H, Fixed, 95% CI) | 0.31 [0.28, 0.36] |
| 2.3 Worst case scenario | 1 | 1429 | Risk Ratio (M‐H, Fixed, 95% CI) | 3.34 [2.90, 3.85] |
| 3 Number of participants with at least one adenoma 1 cm or greater Show forest plot | 2 | Risk Ratio (M‐H, Fixed, 95% CI) | Subtotals only | |
| 3.1 Completers only | 2 | 943 | Risk Ratio (M‐H, Fixed, 95% CI) | 1.02 [0.81, 1.27] |
| 3.2 Best case scenario | 2 | 1819 | Risk Ratio (M‐H, Fixed, 95% CI) | 0.20 [0.17, 0.24] |
| 3.3 Worst case scenario | 2 | 1819 | Risk Ratio (M‐H, Fixed, 95% CI) | 4.81 [4.00, 5.78] |
| Outcome or subgroup title | No. of studies | No. of participants | Statistical method | Effect size |
| 1 Number of participants with at least one recurrent adenoma (4 years) Show forest plot | 1 | Risk Ratio (M‐H, Fixed, 95% CI) | Subtotals only | |
| 1.1 Completers only | 1 | 1905 | Risk Ratio (M‐H, Fixed, 95% CI) | 1.00 [0.90, 1.12] |
| 1.2 Best case scenario | 1 | 2079 | Risk Ratio (M‐H, Fixed, 95% CI) | 0.81 [0.73, 0.90] |
| 1.3 Worst case scenario | 1 | 2079 | Risk Ratio (M‐H, Fixed, 95% CI) | 1.23 [1.11, 1.37] |
| 2 Number of participants with at least one recurrent adenoma (8 years) Show forest plot | 1 | Risk Ratio (M‐H, Fixed, 95% CI) | Subtotals only | |
| 2.1 Completers only | 1 | 1905 | Risk Ratio (M‐H, Fixed, 95% CI) | 0.97 [0.78, 1.20] |
| 2.2 Best case scenario | 1 | 2079 | Risk Ratio (M‐H, Fixed, 95% CI) | 0.60 [0.50, 0.72] |
| 2.3 Worst case scenario | 1 | 2079 | Risk Ratio (M‐H, Fixed, 95% CI) | 1.52 [1.26, 1.84] |
| 3 Number of participants with more than one adenoma (4 years) Show forest plot | 1 | Risk Ratio (M‐H, Fixed, 95% CI) | Subtotals only | |
| 3.1 Completers only | 1 | 1905 | Risk Ratio (M‐H, Fixed, 95% CI) | 1.01 [0.83, 1.24] |
| 3.2 Best case scenario | 1 | 2079 | Risk Ratio (M‐H, Fixed, 95% CI) | 0.64 [0.54, 0.77] |
| 3.3 Worst case scenario | 1 | 2079 | Risk Ratio (M‐H, Fixed, 95% CI) | 1.54 [1.28, 1.84] |
| 4 Number of participants with more than one adenoma (8 years) Show forest plot | 1 | Risk Ratio (M‐H, Fixed, 95% CI) | Subtotals only | |
| 4.1 Completers only | 1 | 1932 | Risk Ratio (M‐H, Fixed, 95% CI) | 0.91 [0.66, 1.27] |
| 4.2 Best case scenario | 1 | 2079 | Risk Ratio (M‐H, Fixed, 95% CI) | 0.38 [0.29, 0.50] |
| 4.3 Worst case scenario | 1 | 2079 | Risk Ratio (M‐H, Fixed, 95% CI) | 2.05 [1.56, 2.70] |
| 5 Number of participants with at least one adenoma 1 cm or greater Show forest plot | 1 | Risk Ratio (M‐H, Fixed, 95% CI) | Subtotals only | |
| 5.1 Completers only | 1 | 1905 | Risk Ratio (M‐H, Fixed, 95% CI) | 0.88 [0.60, 1.28] |
| 5.2 Best case scenario | 1 | 2079 | Risk Ratio (M‐H, Fixed, 95% CI) | 0.32 [0.23, 0.44] |
| 5.3 Worst case scenario | 1 | 2079 | Risk Ratio (M‐H, Fixed, 95% CI) | 2.39 [1.75, 3.25] |
| Outcome or subgroup title | No. of studies | No. of participants | Statistical method | Effect size |
| 1 Number of participants with at least one recurrent adenoma Show forest plot | 1 | Risk Ratio (M‐H, Fixed, 95% CI) | Subtotals only | |
| 1.1 Completers only | 1 | 376 | Risk Ratio (M‐H, Fixed, 95% CI) | 1.45 [1.01, 2.08] |
| 1.2 Best case scenario | 1 | 437 | Risk Ratio (M‐H, Fixed, 95% CI) | 0.78 [0.58, 1.05] |
| 1.3 Worst case scenario | 1 | 437 | Risk Ratio (M‐H, Fixed, 95% CI) | 2.23 [1.59, 3.14] |
| 2 Number of participants with at least one adenoma 1 cm or greater Show forest plot | 1 | Risk Ratio (M‐H, Fixed, 95% CI) | Subtotals only | |
| 2.1 Completers only | 1 | 376 | Risk Ratio (M‐H, Fixed, 95% CI) | 1.80 [0.55, 5.87] |
| 2.2 Best case scenario | 1 | 437 | Risk Ratio (M‐H, Fixed, 95% CI) | 0.20 [0.10, 0.42] |
| 2.3 Worst case scenario | 1 | 437 | Risk Ratio (M‐H, Fixed, 95% CI) | 8.40 [3.04, 23.20] |
| 3 Number of participants with at least one adverse effect Show forest plot | 1 | Risk Ratio (M‐H, Fixed, 95% CI) | Subtotals only | |
| 3.1 Completers only | 1 | 376 | Risk Ratio (M‐H, Fixed, 95% CI) | 0.90 [0.18, 4.40] |
| 3.2 Best case scenario | 1 | 437 | Risk Ratio (M‐H, Fixed, 95% CI) | 0.08 [0.02, 0.25] |
| 3.3 Worst case scenario | 1 | 437 | Risk Ratio (M‐H, Fixed, 95% CI) | 9.65 [2.99, 31.09] |