Fibra dietética para la prevención de adenomas y carcinomas colorrectales recurrentes
Información
- DOI:
- https://doi.org/10.1002/14651858.CD003430.pub2Copiar DOI

- Base de datos:
-
- Cochrane Database of Systematic Reviews
- Versión publicada:
-
- 08 enero 2017see what's new
- Tipo:
-
- Intervention
- Etapa:
-
- Review
- Grupo Editorial Cochrane:
-
Grupo Cochrane de Colorrectal
- Copyright:
-
- Copyright © 2017 The Cochrane Collaboration. Published by John Wiley & Sons, Ltd.
Cifras del artículo
Altmetric:
Citado por:
Autores
Contributions of authors
Yibo Yao ‐ screened the search results, helped write the report
Tao Suo ‐ provided advice for study inclusion and helped write the report
Roland Andersson ‐ provided advice for study inclusion
Yong Qing Cao ‐ performed data extraction
Chen Wang ‐ performed data extraction
Jingen Lu ‐ screened the search results
Evelyne Chui ‐ statistical support and helped write the report.
Sources of support
Internal sources
-
Mount Sinai Hospital, Canada.
-
University of Toronto, Department of Surgery, Canada.
-
Long‐yi Group, Long‐hua Hospital (Affiliated hospital of Shanghai Traditional Chinese Medicine University) LYTD‐06, China.
-
Research and Innovation group, Shanghai Traditional Chinese Medicine University, China.
External sources
-
Hai‐Pai Traditional Chinese Medicine Heritage Research Base ‐ Gu's general surgery ZYSNXD‐CC‐APGC‐JD002, China.
-
National Natural Science Foundation of China. Scheme number:81273763, China.
Declarations of interest
Yibo Yao ‐ none
Tao Suo ‐ none
Roland Andersson ‐ none
Yong Qing Cao ‐ none
Chen Wang ‐ none
Jingen Lu ‐ none
Evelyne Chui ‐ none
Acknowledgements
We are grateful to:
-
the Cochrane Colorectal Cancer and Dr. Arne Ohlsson for advice on the protocol and final review;
-
trialists Dr D Alberts, V Jazmaji, Dr Faivre, Dr Bonithon‐Kopp, and Dr I Akedo for responding to requests for further information;
-
Dr J Baron for expert assistance regarding completeness of our list of included studies.
The current review authors would like to thank Tracey Asano and Robin McLeod for their contribution to the earlier version of the review.
Version history
| Published | Title | Stage | Authors | Version |
| 2017 Jan 08 | Dietary fibre for the prevention of recurrent colorectal adenomas and carcinomas | Review | Yibo Yao, Tao Suo, Roland Andersson, Yongqing Cao, Chen Wang, Jingen Lu, Evelyne Chui | |
| 2002 Jan 21 | Dietary fibre for the prevention of colorectal adenomas and carcinomas | Review | Tracey K. Asano, Robin S McLeod | |
Differences between protocol and review
This updated review has been performed according to the required methodological expectations of Cochrane intervention reviews (MECIR).
We added sensitivity analysis in the 'Dealing with missing data' section to test whether the missing data has an important impact to the results. We stated in our text that "...for those data derived from completers only, we conducted sensitivity analysis in best/worst case scenario to assess the impact of missing data on the estimates of effect". We also added the results of sensitivity analysis for each outcomes in the 'Effects of interventions' section. We discussed the impact of missing data in the 'Discussion, Quality of the evidence' section by stating that "For the risk of bias in included studies, we considered the attrition bias as a major concern. The sensitivity analysis in best and worst case scenarios showed contrary results, which means the missing data did have a significant impact on our results."
Keywords
MeSH
Medical Subject Headings (MeSH) Keywords
Medical Subject Headings Check Words
Aged; Humans; Middle Aged;
PICO

Study flow diagram


Comparison 1 Dietary fibre (all study interventions) versus control, Outcome 1 Number of participants with at least one recurrent adenoma.
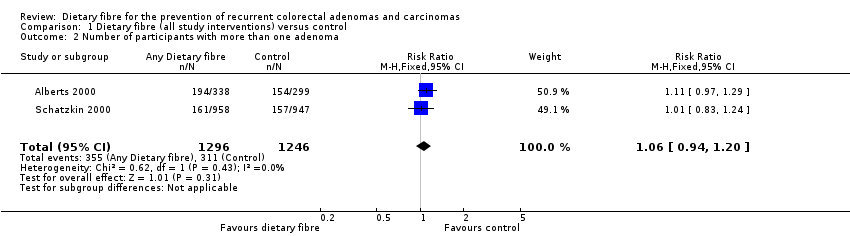
Comparison 1 Dietary fibre (all study interventions) versus control, Outcome 2 Number of participants with more than one adenoma.

Comparison 1 Dietary fibre (all study interventions) versus control, Outcome 3 Number of participants with at least one adenoma 1 cm or greater.

Comparison 1 Dietary fibre (all study interventions) versus control, Outcome 4 Number of participants diagnosed with colorectal cancer.
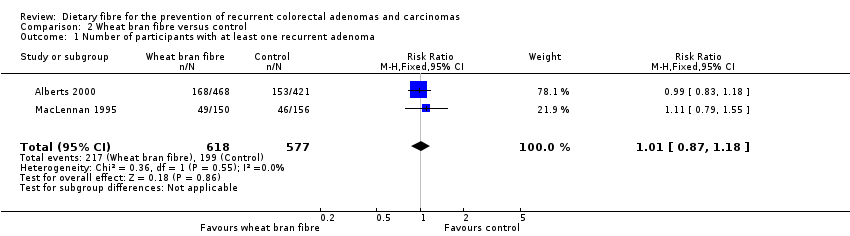
Comparison 2 Wheat bran fibre versus control, Outcome 1 Number of participants with at least one recurrent adenoma.
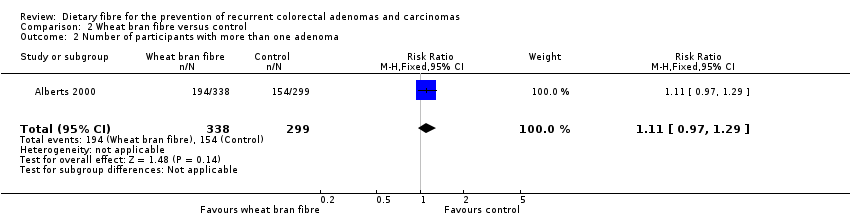
Comparison 2 Wheat bran fibre versus control, Outcome 2 Number of participants with more than one adenoma.

Comparison 2 Wheat bran fibre versus control, Outcome 3 Number of participants with at least one adenoma 1 cm or greater.

Comparison 3 Wheat bran fibre and low fat diet versus control, Outcome 1 Number of participants with at least one recurrent adenoma.
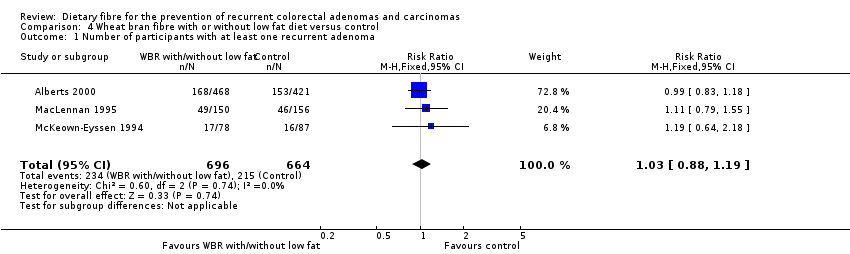
Comparison 4 Wheat bran fibre with or without low fat diet versus control, Outcome 1 Number of participants with at least one recurrent adenoma.

Comparison 4 Wheat bran fibre with or without low fat diet versus control, Outcome 2 Number of participants with more than one adenoma.

Comparison 4 Wheat bran fibre with or without low fat diet versus control, Outcome 3 Number of participants with at least one adenoma 1 cm or greater.

Comparison 5 Comprehensive dietary intervention versus control, Outcome 1 Number of participants with at least one recurrent adenoma (4 years).
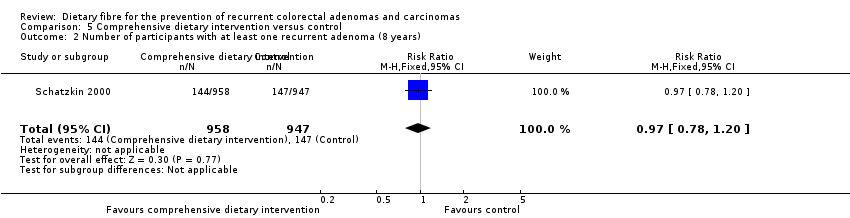
Comparison 5 Comprehensive dietary intervention versus control, Outcome 2 Number of participants with at least one recurrent adenoma (8 years).
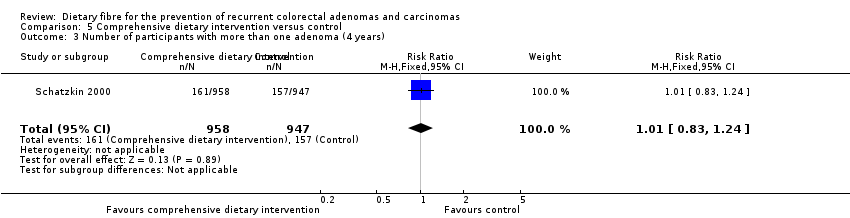
Comparison 5 Comprehensive dietary intervention versus control, Outcome 3 Number of participants with more than one adenoma (4 years).

Comparison 5 Comprehensive dietary intervention versus control, Outcome 4 Number of participants with more than one adenoma (8 years).
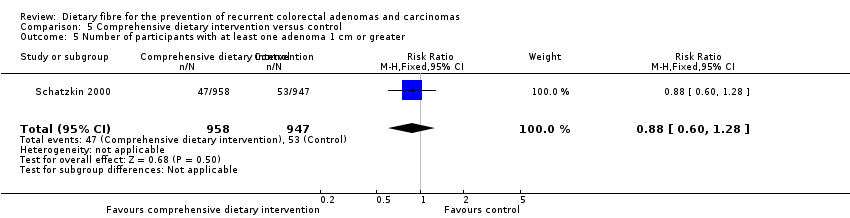
Comparison 5 Comprehensive dietary intervention versus control, Outcome 5 Number of participants with at least one adenoma 1 cm or greater.

Comparison 6 Ispaghula husk versus control, Outcome 1 Number of participants with at least one recurrent adenoma.

Comparison 6 Ispaghula husk versus control, Outcome 2 Number of participants with at least one adenoma 1 cm or greater.
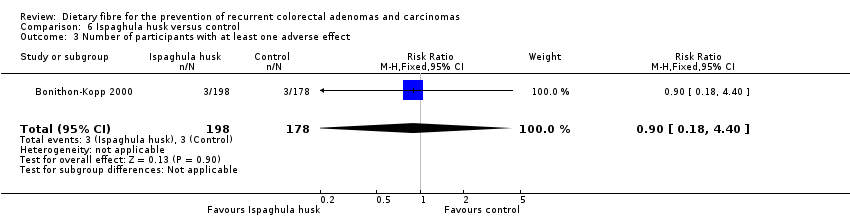
Comparison 6 Ispaghula husk versus control, Outcome 3 Number of participants with at least one adverse effect.

Comparison 7 Sensitivity analysis 1. Dietary fibre (all study interventions) versus control, Outcome 1 Number of participants with at least one recurrent adenoma.
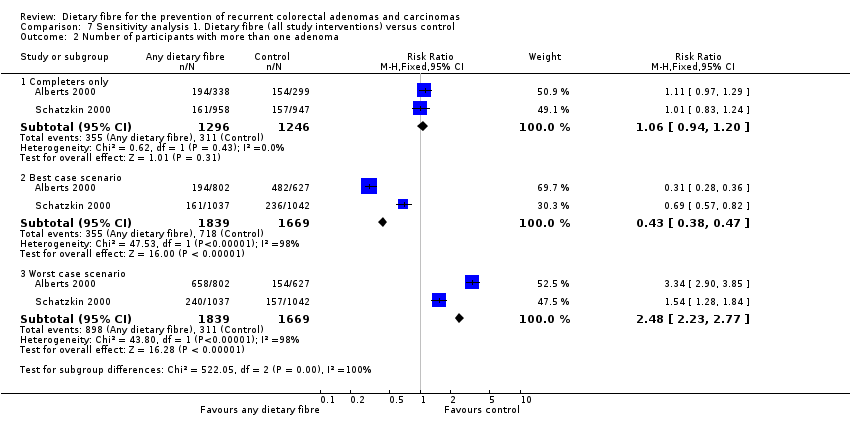
Comparison 7 Sensitivity analysis 1. Dietary fibre (all study interventions) versus control, Outcome 2 Number of participants with more than one adenoma.
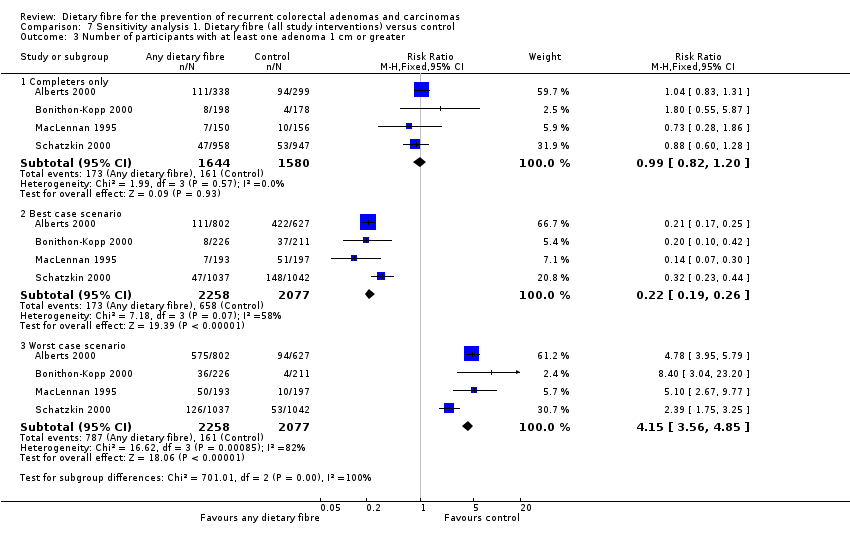
Comparison 7 Sensitivity analysis 1. Dietary fibre (all study interventions) versus control, Outcome 3 Number of participants with at least one adenoma 1 cm or greater.
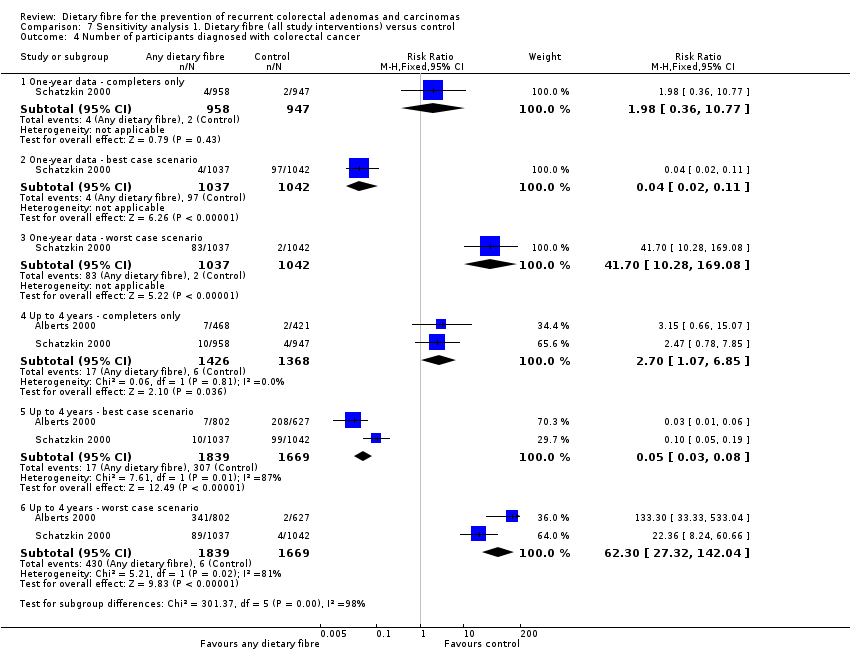
Comparison 7 Sensitivity analysis 1. Dietary fibre (all study interventions) versus control, Outcome 4 Number of participants diagnosed with colorectal cancer.
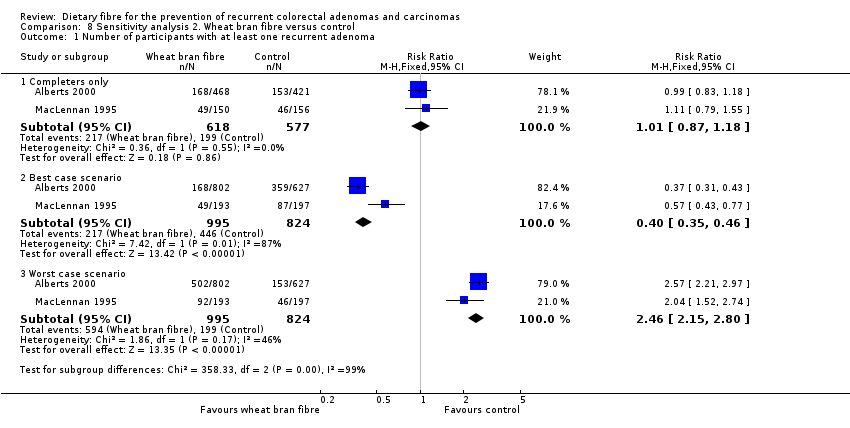
Comparison 8 Sensitivity analysis 2. Wheat bran fibre versus control, Outcome 1 Number of participants with at least one recurrent adenoma.

Comparison 8 Sensitivity analysis 2. Wheat bran fibre versus control, Outcome 2 Number of participants with more than one adenoma.
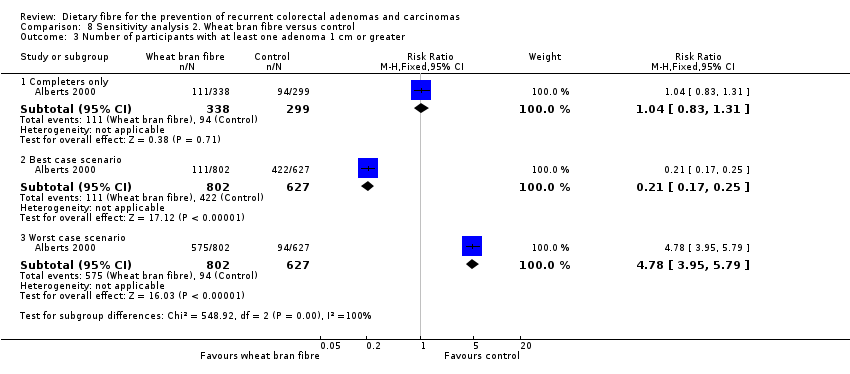
Comparison 8 Sensitivity analysis 2. Wheat bran fibre versus control, Outcome 3 Number of participants with at least one adenoma 1 cm or greater.
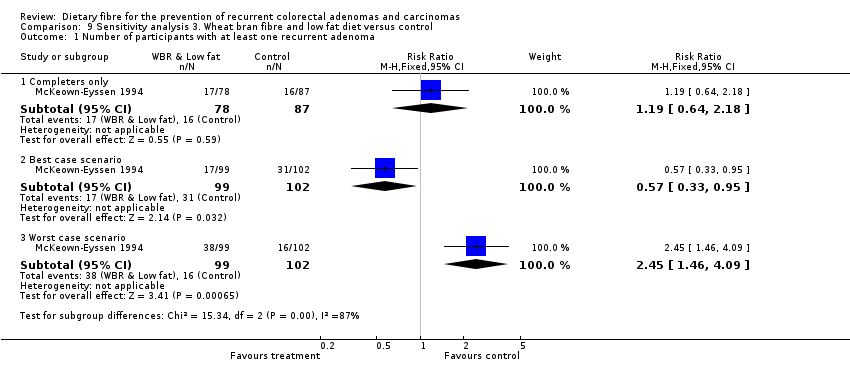
Comparison 9 Sensitivity analysis 3. Wheat bran fibre and low fat diet versus control, Outcome 1 Number of participants with at least one recurrent adenoma.

Comparison 10 Sensitivity analysis 4. Wheat bran fibre with or without low fat diet versus control, Outcome 1 Number of participants with at least one recurrent adenoma.

Comparison 10 Sensitivity analysis 4. Wheat bran fibre with or without low fat diet versus control, Outcome 2 Number of participants with more than one adenoma.
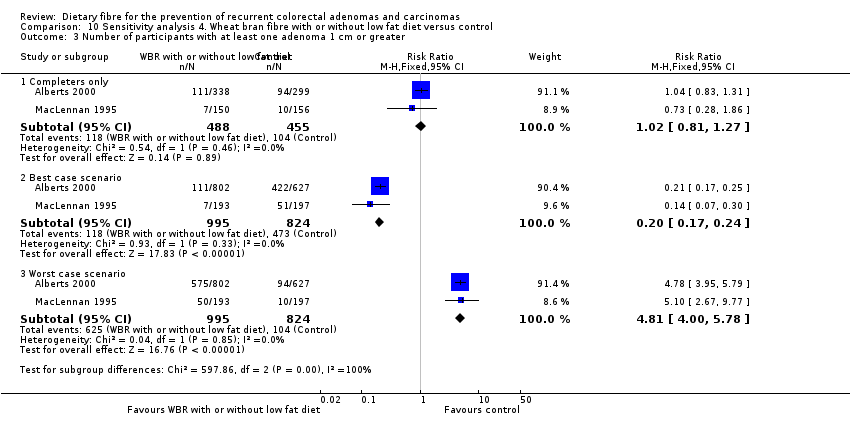
Comparison 10 Sensitivity analysis 4. Wheat bran fibre with or without low fat diet versus control, Outcome 3 Number of participants with at least one adenoma 1 cm or greater.
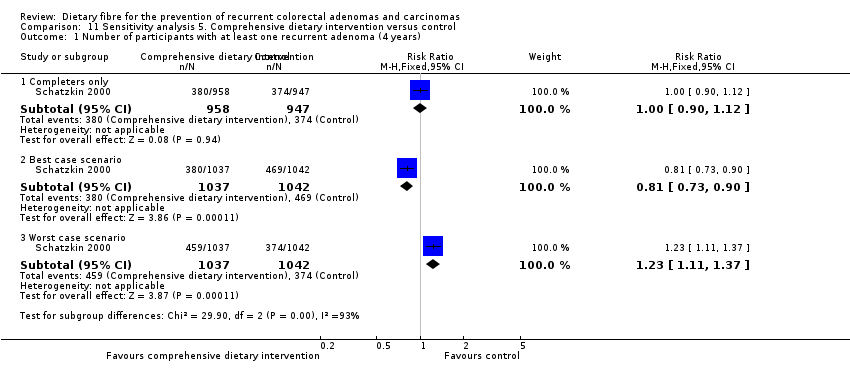
Comparison 11 Sensitivity analysis 5. Comprehensive dietary intervention versus control, Outcome 1 Number of participants with at least one recurrent adenoma (4 years).
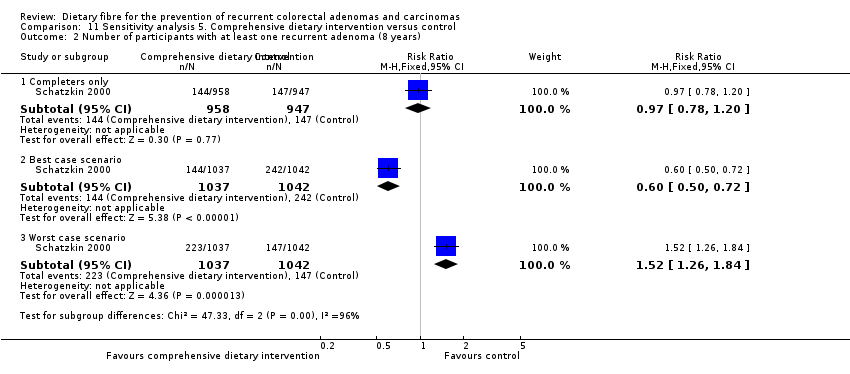
Comparison 11 Sensitivity analysis 5. Comprehensive dietary intervention versus control, Outcome 2 Number of participants with at least one recurrent adenoma (8 years).

Comparison 11 Sensitivity analysis 5. Comprehensive dietary intervention versus control, Outcome 3 Number of participants with more than one adenoma (4 years).

Comparison 11 Sensitivity analysis 5. Comprehensive dietary intervention versus control, Outcome 4 Number of participants with more than one adenoma (8 years).
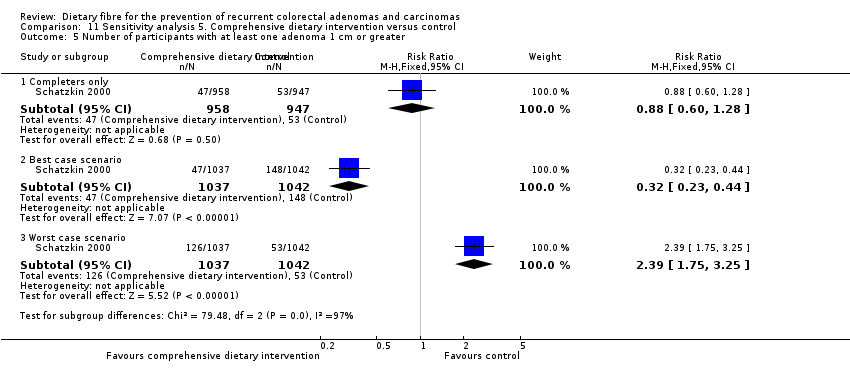
Comparison 11 Sensitivity analysis 5. Comprehensive dietary intervention versus control, Outcome 5 Number of participants with at least one adenoma 1 cm or greater.

Comparison 12 Sensitivity analysis 6. Ispaghula husk versus control, Outcome 1 Number of participants with at least one recurrent adenoma.
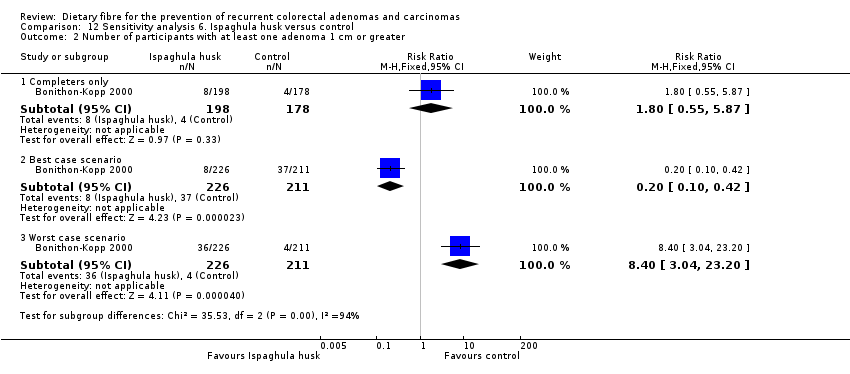
Comparison 12 Sensitivity analysis 6. Ispaghula husk versus control, Outcome 2 Number of participants with at least one adenoma 1 cm or greater.
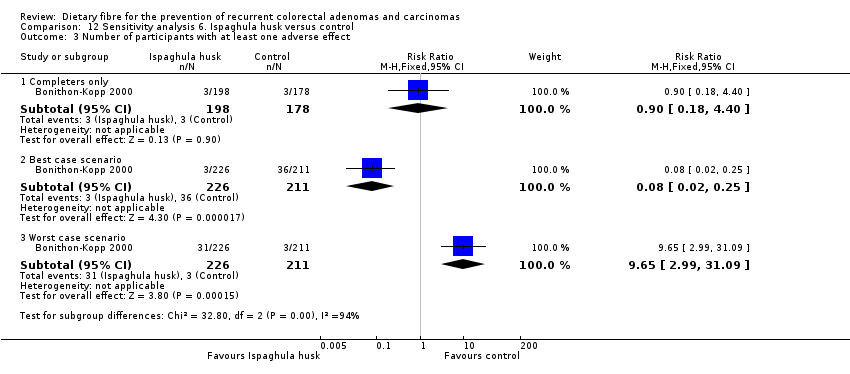
Comparison 12 Sensitivity analysis 6. Ispaghula husk versus control, Outcome 3 Number of participants with at least one adverse effect.
| Dietary fibre (all study interventions) versus control for the prevention of colorectal adenomas and carcinomas | ||||||
| Patient or population: people with a history of colorectal adenomas | ||||||
| Outcomes | Illustrative comparative risks* (95% CI) | Relative effect | No of participants | Quality of the evidence | Comments | |
| Assumed risk | Corresponding risk | |||||
| Control | Dietary fibre (all study interventions) versus control | |||||
| Number of participantswith at least one recurrent adenoma | Study population | RR 1.04 | 3641 | ⊕⊕⊝⊝ | ||
| 349 per 1000 | 363 per 1000 | |||||
| Moderate | ||||||
| 295 per 1000 | 307 per 1000 | |||||
| Number of participantswith more than one adenoma | Study population | RR 1.06 | 2542 | ⊕⊕⊝⊝ | ||
| 250 per 1000 | 265 per 1000 | |||||
| Moderate | ||||||
| 340 per 1000 | 360 per 1000 | |||||
| Number of participantswith at least one adenoma 1 cm or greater Follow up: 3 to 4 years | Study population | RR 0.99 | 3224 | ⊕⊕⊝⊝ | ||
| 102 per 1000 | 101 per 1000 | |||||
| Moderate | ||||||
| 60 per 1000 | 59 per 1000 | |||||
| Number of participantsdiagnosed with colorectal cancer | Study population | RR 2.70 | 2794 | ⊕⊕⊝⊝ | The incidence of colorectal cancer is very low, so when risk was calculated by risk difference (RD), the difference between groups was very small. RD = 0.01, 95% CI 0.00 to 0.01 | |
| 4 per 1000 | 12 per 1000 | |||||
| Moderate | ||||||
| 5 per 1000 | 14 per 1000 | |||||
| *The basis for the assumed risk (e.g. the median control group risk across studies) is provided in footnotes. The corresponding risk (and its 95% confidence interval) is based on the assumed risk in the comparison group and the relative effect of the intervention (and its 95% CI). | ||||||
| GRADE Working Group grades of evidence | ||||||
| a Risk of bias: downgraded by one level due to high risk of detection/performance bias and attrition bias. | ||||||
| Outcome or subgroup title | No. of studies | No. of participants | Statistical method | Effect size |
| 1 Number of participants with at least one recurrent adenoma Show forest plot | 5 | 3641 | Risk Ratio (M‐H, Fixed, 95% CI) | 1.04 [0.95, 1.13] |
| 2 Number of participants with more than one adenoma Show forest plot | 2 | 2542 | Risk Ratio (M‐H, Fixed, 95% CI) | 1.06 [0.94, 1.20] |
| 3 Number of participants with at least one adenoma 1 cm or greater Show forest plot | 4 | 3224 | Risk Ratio (M‐H, Fixed, 95% CI) | 0.99 [0.82, 1.20] |
| 4 Number of participants diagnosed with colorectal cancer Show forest plot | 2 | Risk Ratio (M‐H, Fixed, 95% CI) | Subtotals only | |
| 4.1 One‐ year data | 1 | 1905 | Risk Ratio (M‐H, Fixed, 95% CI) | 1.98 [0.36, 10.77] |
| 4.2 Up to 4 years | 2 | 2794 | Risk Ratio (M‐H, Fixed, 95% CI) | 2.70 [1.07, 6.85] |
| Outcome or subgroup title | No. of studies | No. of participants | Statistical method | Effect size |
| 1 Number of participants with at least one recurrent adenoma Show forest plot | 2 | 1195 | Risk Ratio (M‐H, Fixed, 95% CI) | 1.01 [0.87, 1.18] |
| 2 Number of participants with more than one adenoma Show forest plot | 1 | 637 | Risk Ratio (M‐H, Fixed, 95% CI) | 1.11 [0.97, 1.29] |
| 3 Number of participants with at least one adenoma 1 cm or greater Show forest plot | 1 | 637 | Risk Ratio (M‐H, Fixed, 95% CI) | 1.04 [0.83, 1.31] |
| Outcome or subgroup title | No. of studies | No. of participants | Statistical method | Effect size |
| 1 Number of participants with at least one recurrent adenoma Show forest plot | 1 | 165 | Risk Ratio (M‐H, Fixed, 95% CI) | 1.19 [0.64, 2.18] |
| Outcome or subgroup title | No. of studies | No. of participants | Statistical method | Effect size |
| 1 Number of participants with at least one recurrent adenoma Show forest plot | 3 | 1360 | Risk Ratio (M‐H, Fixed, 95% CI) | 1.03 [0.88, 1.19] |
| 2 Number of participants with more than one adenoma Show forest plot | 1 | 637 | Risk Ratio (M‐H, Fixed, 95% CI) | 1.11 [0.97, 1.29] |
| 3 Number of participants with at least one adenoma 1 cm or greater Show forest plot | 2 | 943 | Risk Ratio (M‐H, Fixed, 95% CI) | 1.02 [0.81, 1.27] |
| Outcome or subgroup title | No. of studies | No. of participants | Statistical method | Effect size |
| 1 Number of participants with at least one recurrent adenoma (4 years) Show forest plot | 1 | 1905 | Risk Ratio (M‐H, Fixed, 95% CI) | 1.00 [0.90, 1.12] |
| 2 Number of participants with at least one recurrent adenoma (8 years) Show forest plot | 1 | 1905 | Risk Ratio (M‐H, Fixed, 95% CI) | 0.97 [0.78, 1.20] |
| 3 Number of participants with more than one adenoma (4 years) Show forest plot | 1 | 1905 | Risk Ratio (M‐H, Fixed, 95% CI) | 1.01 [0.83, 1.24] |
| 4 Number of participants with more than one adenoma (8 years) Show forest plot | 1 | 1905 | Risk Ratio (M‐H, Fixed, 95% CI) | 0.89 [0.64, 1.24] |
| 5 Number of participants with at least one adenoma 1 cm or greater Show forest plot | 1 | 1905 | Risk Ratio (M‐H, Fixed, 95% CI) | 0.88 [0.60, 1.28] |
| Outcome or subgroup title | No. of studies | No. of participants | Statistical method | Effect size |
| 1 Number of participants with at least one recurrent adenoma Show forest plot | 1 | 376 | Risk Ratio (M‐H, Fixed, 95% CI) | 1.45 [1.01, 2.08] |
| 2 Number of participants with at least one adenoma 1 cm or greater Show forest plot | 1 | 376 | Risk Ratio (M‐H, Fixed, 95% CI) | 1.80 [0.55, 5.87] |
| 3 Number of participants with at least one adverse effect Show forest plot | 1 | 376 | Risk Ratio (M‐H, Fixed, 95% CI) | 0.90 [0.18, 4.40] |
| Outcome or subgroup title | No. of studies | No. of participants | Statistical method | Effect size |
| 1 Number of participants with at least one recurrent adenoma Show forest plot | 5 | Risk Ratio (M‐H, Fixed, 95% CI) | Subtotals only | |
| 1.1 Completers only | 5 | 3641 | Risk Ratio (M‐H, Fixed, 95% CI) | 1.04 [0.95, 1.13] |
| 1.2 Best case scenario | 5 | 4536 | Risk Ratio (M‐H, Fixed, 95% CI) | 0.61 [0.57, 0.66] |
| 1.3 Worst case scenario | 5 | 4536 | Risk Ratio (M‐H, Fixed, 95% CI) | 1.73 [1.60, 1.88] |
| 2 Number of participants with more than one adenoma Show forest plot | 2 | Risk Ratio (M‐H, Fixed, 95% CI) | Subtotals only | |
| 2.1 Completers only | 2 | 2542 | Risk Ratio (M‐H, Fixed, 95% CI) | 1.06 [0.94, 1.20] |
| 2.2 Best case scenario | 2 | 3508 | Risk Ratio (M‐H, Fixed, 95% CI) | 0.43 [0.38, 0.47] |
| 2.3 Worst case scenario | 2 | 3508 | Risk Ratio (M‐H, Fixed, 95% CI) | 2.48 [2.23, 2.77] |
| 3 Number of participants with at least one adenoma 1 cm or greater Show forest plot | 4 | Risk Ratio (M‐H, Fixed, 95% CI) | Subtotals only | |
| 3.1 Completers only | 4 | 3224 | Risk Ratio (M‐H, Fixed, 95% CI) | 0.99 [0.82, 1.20] |
| 3.2 Best case scenario | 4 | 4335 | Risk Ratio (M‐H, Fixed, 95% CI) | 0.22 [0.19, 0.26] |
| 3.3 Worst case scenario | 4 | 4335 | Risk Ratio (M‐H, Fixed, 95% CI) | 4.15 [3.56, 4.85] |
| 4 Number of participants diagnosed with colorectal cancer Show forest plot | 2 | Risk Ratio (M‐H, Fixed, 95% CI) | Subtotals only | |
| 4.1 One‐ year data ‐ completers only | 1 | 1905 | Risk Ratio (M‐H, Fixed, 95% CI) | 1.98 [0.36, 10.77] |
| 4.2 One‐ year data ‐ best case scenario | 1 | 2079 | Risk Ratio (M‐H, Fixed, 95% CI) | 0.04 [0.02, 0.11] |
| 4.3 One‐ year data ‐ worst case scenario | 1 | 2079 | Risk Ratio (M‐H, Fixed, 95% CI) | 41.70 [10.28, 169.08] |
| 4.4 Up to 4 years ‐ completers only | 2 | 2794 | Risk Ratio (M‐H, Fixed, 95% CI) | 2.70 [1.07, 6.85] |
| 4.5 Up to 4 years ‐ best case scenario | 2 | 3508 | Risk Ratio (M‐H, Fixed, 95% CI) | 0.05 [0.03, 0.08] |
| 4.6 Up to 4 years ‐ worst case scenario | 2 | 3508 | Risk Ratio (M‐H, Fixed, 95% CI) | 62.30 [27.32, 142.04] |
| Outcome or subgroup title | No. of studies | No. of participants | Statistical method | Effect size |
| 1 Number of participants with at least one recurrent adenoma Show forest plot | 2 | Risk Ratio (M‐H, Fixed, 95% CI) | Subtotals only | |
| 1.1 Completers only | 2 | 1195 | Risk Ratio (M‐H, Fixed, 95% CI) | 1.01 [0.87, 1.18] |
| 1.2 Best case scenario | 2 | 1819 | Risk Ratio (M‐H, Fixed, 95% CI) | 0.40 [0.35, 0.46] |
| 1.3 Worst case scenario | 2 | 1819 | Risk Ratio (M‐H, Fixed, 95% CI) | 2.46 [2.15, 2.80] |
| 2 Number of participants with more than one adenoma Show forest plot | 1 | Risk Ratio (M‐H, Fixed, 95% CI) | Subtotals only | |
| 2.1 Completers only | 1 | 637 | Risk Ratio (M‐H, Fixed, 95% CI) | 1.11 [0.97, 1.29] |
| 2.2 Best case scenario | 1 | 1429 | Risk Ratio (M‐H, Fixed, 95% CI) | 0.31 [0.28, 0.36] |
| 2.3 Worst case scenario | 1 | 1429 | Risk Ratio (M‐H, Fixed, 95% CI) | 3.34 [2.90, 3.85] |
| 3 Number of participants with at least one adenoma 1 cm or greater Show forest plot | 1 | Risk Ratio (M‐H, Fixed, 95% CI) | Subtotals only | |
| 3.1 Completers only | 1 | 637 | Risk Ratio (M‐H, Fixed, 95% CI) | 1.04 [0.83, 1.31] |
| 3.2 Best case scenario | 1 | 1429 | Risk Ratio (M‐H, Fixed, 95% CI) | 0.21 [0.17, 0.25] |
| 3.3 Worst case scenario | 1 | 1429 | Risk Ratio (M‐H, Fixed, 95% CI) | 4.78 [3.95, 5.79] |
| Outcome or subgroup title | No. of studies | No. of participants | Statistical method | Effect size |
| 1 Number of participants with at least one recurrent adenoma Show forest plot | 1 | Risk Ratio (M‐H, Fixed, 95% CI) | Subtotals only | |
| 1.1 Completers only | 1 | 165 | Risk Ratio (M‐H, Fixed, 95% CI) | 1.19 [0.64, 2.18] |
| 1.2 Best case scenario | 1 | 201 | Risk Ratio (M‐H, Fixed, 95% CI) | 0.57 [0.33, 0.95] |
| 1.3 Worst case scenario | 1 | 201 | Risk Ratio (M‐H, Fixed, 95% CI) | 2.45 [1.46, 4.09] |
| Outcome or subgroup title | No. of studies | No. of participants | Statistical method | Effect size |
| 1 Number of participants with at least one recurrent adenoma Show forest plot | 3 | Risk Ratio (M‐H, Fixed, 95% CI) | Subtotals only | |
| 1.1 Completers only | 3 | 1360 | Risk Ratio (M‐H, Fixed, 95% CI) | 1.03 [0.88, 1.19] |
| 1.2 Best case scenario | 3 | 2020 | Risk Ratio (M‐H, Fixed, 95% CI) | 0.41 [0.36, 0.47] |
| 1.3 Worst case scenario | 3 | 2020 | Risk Ratio (M‐H, Fixed, 95% CI) | 2.45 [2.16, 2.79] |
| 2 Number of participants with more than one adenoma Show forest plot | 1 | Risk Ratio (M‐H, Fixed, 95% CI) | Subtotals only | |
| 2.1 Completers only | 1 | 637 | Risk Ratio (M‐H, Fixed, 95% CI) | 1.11 [0.97, 1.29] |
| 2.2 Best case scenario | 1 | 1429 | Risk Ratio (M‐H, Fixed, 95% CI) | 0.31 [0.28, 0.36] |
| 2.3 Worst case scenario | 1 | 1429 | Risk Ratio (M‐H, Fixed, 95% CI) | 3.34 [2.90, 3.85] |
| 3 Number of participants with at least one adenoma 1 cm or greater Show forest plot | 2 | Risk Ratio (M‐H, Fixed, 95% CI) | Subtotals only | |
| 3.1 Completers only | 2 | 943 | Risk Ratio (M‐H, Fixed, 95% CI) | 1.02 [0.81, 1.27] |
| 3.2 Best case scenario | 2 | 1819 | Risk Ratio (M‐H, Fixed, 95% CI) | 0.20 [0.17, 0.24] |
| 3.3 Worst case scenario | 2 | 1819 | Risk Ratio (M‐H, Fixed, 95% CI) | 4.81 [4.00, 5.78] |
| Outcome or subgroup title | No. of studies | No. of participants | Statistical method | Effect size |
| 1 Number of participants with at least one recurrent adenoma (4 years) Show forest plot | 1 | Risk Ratio (M‐H, Fixed, 95% CI) | Subtotals only | |
| 1.1 Completers only | 1 | 1905 | Risk Ratio (M‐H, Fixed, 95% CI) | 1.00 [0.90, 1.12] |
| 1.2 Best case scenario | 1 | 2079 | Risk Ratio (M‐H, Fixed, 95% CI) | 0.81 [0.73, 0.90] |
| 1.3 Worst case scenario | 1 | 2079 | Risk Ratio (M‐H, Fixed, 95% CI) | 1.23 [1.11, 1.37] |
| 2 Number of participants with at least one recurrent adenoma (8 years) Show forest plot | 1 | Risk Ratio (M‐H, Fixed, 95% CI) | Subtotals only | |
| 2.1 Completers only | 1 | 1905 | Risk Ratio (M‐H, Fixed, 95% CI) | 0.97 [0.78, 1.20] |
| 2.2 Best case scenario | 1 | 2079 | Risk Ratio (M‐H, Fixed, 95% CI) | 0.60 [0.50, 0.72] |
| 2.3 Worst case scenario | 1 | 2079 | Risk Ratio (M‐H, Fixed, 95% CI) | 1.52 [1.26, 1.84] |
| 3 Number of participants with more than one adenoma (4 years) Show forest plot | 1 | Risk Ratio (M‐H, Fixed, 95% CI) | Subtotals only | |
| 3.1 Completers only | 1 | 1905 | Risk Ratio (M‐H, Fixed, 95% CI) | 1.01 [0.83, 1.24] |
| 3.2 Best case scenario | 1 | 2079 | Risk Ratio (M‐H, Fixed, 95% CI) | 0.64 [0.54, 0.77] |
| 3.3 Worst case scenario | 1 | 2079 | Risk Ratio (M‐H, Fixed, 95% CI) | 1.54 [1.28, 1.84] |
| 4 Number of participants with more than one adenoma (8 years) Show forest plot | 1 | Risk Ratio (M‐H, Fixed, 95% CI) | Subtotals only | |
| 4.1 Completers only | 1 | 1932 | Risk Ratio (M‐H, Fixed, 95% CI) | 0.91 [0.66, 1.27] |
| 4.2 Best case scenario | 1 | 2079 | Risk Ratio (M‐H, Fixed, 95% CI) | 0.38 [0.29, 0.50] |
| 4.3 Worst case scenario | 1 | 2079 | Risk Ratio (M‐H, Fixed, 95% CI) | 2.05 [1.56, 2.70] |
| 5 Number of participants with at least one adenoma 1 cm or greater Show forest plot | 1 | Risk Ratio (M‐H, Fixed, 95% CI) | Subtotals only | |
| 5.1 Completers only | 1 | 1905 | Risk Ratio (M‐H, Fixed, 95% CI) | 0.88 [0.60, 1.28] |
| 5.2 Best case scenario | 1 | 2079 | Risk Ratio (M‐H, Fixed, 95% CI) | 0.32 [0.23, 0.44] |
| 5.3 Worst case scenario | 1 | 2079 | Risk Ratio (M‐H, Fixed, 95% CI) | 2.39 [1.75, 3.25] |
| Outcome or subgroup title | No. of studies | No. of participants | Statistical method | Effect size |
| 1 Number of participants with at least one recurrent adenoma Show forest plot | 1 | Risk Ratio (M‐H, Fixed, 95% CI) | Subtotals only | |
| 1.1 Completers only | 1 | 376 | Risk Ratio (M‐H, Fixed, 95% CI) | 1.45 [1.01, 2.08] |
| 1.2 Best case scenario | 1 | 437 | Risk Ratio (M‐H, Fixed, 95% CI) | 0.78 [0.58, 1.05] |
| 1.3 Worst case scenario | 1 | 437 | Risk Ratio (M‐H, Fixed, 95% CI) | 2.23 [1.59, 3.14] |
| 2 Number of participants with at least one adenoma 1 cm or greater Show forest plot | 1 | Risk Ratio (M‐H, Fixed, 95% CI) | Subtotals only | |
| 2.1 Completers only | 1 | 376 | Risk Ratio (M‐H, Fixed, 95% CI) | 1.80 [0.55, 5.87] |
| 2.2 Best case scenario | 1 | 437 | Risk Ratio (M‐H, Fixed, 95% CI) | 0.20 [0.10, 0.42] |
| 2.3 Worst case scenario | 1 | 437 | Risk Ratio (M‐H, Fixed, 95% CI) | 8.40 [3.04, 23.20] |
| 3 Number of participants with at least one adverse effect Show forest plot | 1 | Risk Ratio (M‐H, Fixed, 95% CI) | Subtotals only | |
| 3.1 Completers only | 1 | 376 | Risk Ratio (M‐H, Fixed, 95% CI) | 0.90 [0.18, 4.40] |
| 3.2 Best case scenario | 1 | 437 | Risk Ratio (M‐H, Fixed, 95% CI) | 0.08 [0.02, 0.25] |
| 3.3 Worst case scenario | 1 | 437 | Risk Ratio (M‐H, Fixed, 95% CI) | 9.65 [2.99, 31.09] |