Fibra dietética para prevenir a recorrência de adenomas e carcinomas colorretais
Appendices
Appendix 1. Cochrane Library search strategy
#1 MeSH descriptor: [Cereals] explode all trees
#2 MeSH descriptor: [Dietary Fiber] explode all trees
#3 MeSH descriptor: [Dietary Carbohydrates] explode all trees
#4 (wholemeal$ or whole meal$ wholegrain$ or whole grain$ or cereal$ or grain$ or starch or high‐fiber or fibre or fiber or dietary intervention or dietary carbohydrate$ or roughage$ or wheat bran$)
#5 (#1 or #2 or #3 or #4)
#6 MeSH descriptor: [Colorectal Neoplasms] explode all trees
#7 MeSH descriptor: [Colonic Polyps] explode all trees
#8 ((colorect$ or colon$ or rect$ or anal$ or anus$ or intestin$ or bowel$) near/3 (carcinom$ or neoplas$ or adenocarcinom$ or cancer$ or tumor$ or tumour$ or sarcom$ or polyp$ or adenom$))
#9 (#6 or #7 or #8)
#10 (#5 and #9)
Appendix 2. MEDLINE search strategy
1. exp Cereals/
2. exp Dietary Fiber/
3. exp Dietary Carbohydrates/
4. (wholemeal$ or whole meal$ wholegrain$ or whole grain$ or cereal$ or grain$ or starch or high‐fiber or fibre or fiber or dietary intervention or dietary carbohydrate$ or roughage$ or wheat bran$).mp.
5. 1 or 2 or 3 or 4
6. exp Colorectal Neoplasms/
7. exp Colonic Polyps/
8. ((colorect$ or colon$ or rect$ or anal$ or anus$ or intestin$ or bowel$) adj3 (carcinom$ or neoplas$ or adenocarcinom$ or cancer$ or tumor$ or tumour$ or sarcom$ or polyp$ or adenom$)).mp.
9. 6 or 7 or 8
10. 5 and 9
11. randomized controlled trial.pt.
12. controlled clinical trial.pt.
13. randomized.ab.
14. placebo.ab.
15. clinical trial as topic.sh.
16. randomly.ab.
17. trial.ti.
18. 11 or 12 or 13 or 14 or 15 or 16 or 17
19. exp animals/ not humans.sh.
20. 18 not 19
21. 10 and 20
Appendix 3. Embase search strategy
1. *cereal/
2. *dietary fiber/
3. *carbohydrate diet/
4. (wholemeal$ or whole meal$ wholegrain$ or whole grain$ or cereal$ or grain$ or starch or high‐fiber or fibre or fiber or dietary intervention or dietary carbohydrate$ or roughage$ or wheat bran$).m_titl.
5. 1 or 2 or 3 or 4
6. exp large intestine tumor/
7. ((colorect$ or colon$ or rect$ or anal$ or anus$ or intestin$ or bowel$) and (carcinom$ or neoplas$ or adenocarcinom$ or cancer$ or tumor$ or tumour$ or sarcom$ or polyp$ or adenom$)).m_titl.
8. 6 or 7
9. 5 and 8
10. CROSSOVER PROCEDURE.sh.
11. DOUBLE‐BLIND PROCEDURE.sh.
12. SINGLE‐BLIND PROCEDURE.sh.
13. (crossover* or cross over*).ti,ab.
14. placebo*.ti,ab.
15. (doubl* adj blind*).ti,ab.
16. allocat*.ti,ab.
17. trial.ti.
18. RANDOMIZED CONTROLLED TRIAL.sh.
19. random*.ti,ab.
20. 10 or 11 or 12 or 13 or 14 or 15 or 16 or 17 or 18 or 19
21. (exp animal/ or exp invertebrate/ or animal.hw. or nonhuman/) not (exp human/ or human cell/ or (human or humans or man or men or wom?n).ti.)
22. 20 not 21
23. 9 and 22
Appendix 4. Criteria for judging risk of bias in the 'Risk of bias' assessment tool
| Random sequence generation Selection bias (biased allocation to interventions) due to inadequate generation of a randomised sequence. | |
| Criteria for a judgement of ‘low risk’ of bias | The investigators describe a random component in the sequence generation process such as:
*Minimisation may be implemented without a random element, and this is considered to be equivalent to being random. |
| Criteria for the judgement of ‘high risk’ of bias | The investigators describe a non‐random component in the sequence generation process. Usually, the description would involve some systematic, non‐random approach, for example:
Other non‐random approaches happen much less frequently than the systematic approaches mentioned above and tend to be obvious. They usually involve judgement or some method of non‐random categorisation of participants, for example:
|
| Criteria for the judgement of ‘unclear risk’ of bias | Insufficient information about the sequence generation process to permit judgement of ‘low risk’ or ‘high risk’ |
| Allocation concealment Selection bias (biased allocation to interventions) due to inadequate concealment of allocations prior to assignment. | |
| Criteria for a judgement of ‘low risk’ of bias | Participants and investigators enrolling participants could not foresee assignment because one of the following, or an equivalent method, was used to conceal allocation:
|
| Criteria for the judgement of ‘high risk’ of bias | Participants or investigators enrolling participants could possibly foresee assignments and thus introduce selection bias, such as allocation based on:
|
| Criteria for the judgement of ‘unclear risk’ of bias | Insufficient information to permit judgement of ‘low risk’ or ‘high risk’. This is usually the case if the method of concealment is not described or not described in sufficient detail to allow a definite judgement – for example if the use of assignment envelopes is described, but it remains unclear whether envelopes were sequentially numbered, opaque and sealed. |
| Blinding of participants and personnel Performance bias due to knowledge of the allocated interventions by participants and personnel during the study. | |
| Criteria for a judgement of ‘low risk’ of bias | Any one of the following:
|
| Criteria for the judgement of ‘high risk’ of bias | Any one of the following:
|
| Criteria for the judgement of ‘unclear risk’ of bias | Any one of the following:
|
| Blinding of outcome assessment Detection bias due to knowledge of the allocated interventions by outcome assessors. | |
| Criteria for a judgement of ‘low risk’ of bias | Any one of the following:
|
| Criteria for the judgement of ‘high risk’ of bias | Any one of the following:
|
| Criteria for the judgement of ‘unclear risk’ of bias | Any one of the following:
|
| Incomplete outcome data Attrition bias due to amount, nature or handling of incomplete outcome data. | |
| Criteria for a judgement of ‘low risk’ of bias | Any one of the following:
|
| Criteria for the judgement of ‘high risk’ of bias | Any one of the following:
|
| Criteria for the judgement of ‘unclear risk’ of bias | Any one of the following:
|
| Selective reporting Reporting bias due to selective outcome reporting. | |
| Criteria for a judgement of ‘low risk’ of bias | Any of the following:
|
| Criteria for the judgement of ‘high risk’ of bias | Any one of the following:
|
| Criteria for the judgement of ‘unclear risk’ of bias | Insufficient information to permit judgement of ‘low risk’ or ‘high risk’. It is likely that the majority of studies will fall into this category. |
| Other bias Bias due to problems not covered elsewhere in the table. | |
| Criteria for a judgement of ‘low risk’ of bias | The study appears to be free of other sources of bias. |
| Criteria for the judgement of ‘high risk’ of bias | There is at least one important risk of bias. For example, the study:
|
| Criteria for the judgement of ‘unclear risk’ of bias | There may be a risk of bias, but there is either:
|

Study flow diagram


Comparison 1 Dietary fibre (all study interventions) versus control, Outcome 1 Number of participants with at least one recurrent adenoma.
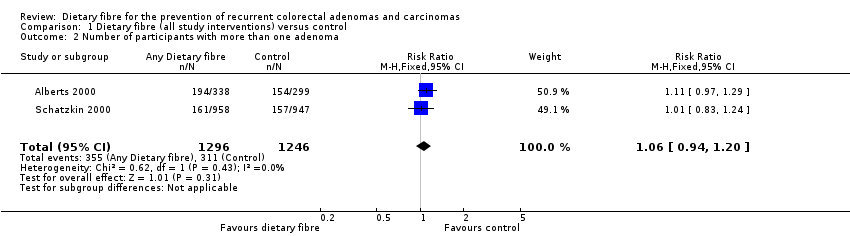
Comparison 1 Dietary fibre (all study interventions) versus control, Outcome 2 Number of participants with more than one adenoma.

Comparison 1 Dietary fibre (all study interventions) versus control, Outcome 3 Number of participants with at least one adenoma 1 cm or greater.

Comparison 1 Dietary fibre (all study interventions) versus control, Outcome 4 Number of participants diagnosed with colorectal cancer.
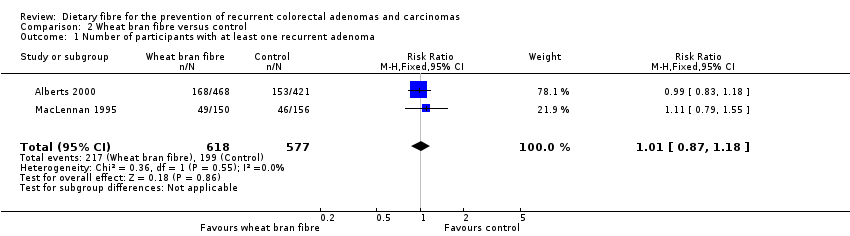
Comparison 2 Wheat bran fibre versus control, Outcome 1 Number of participants with at least one recurrent adenoma.
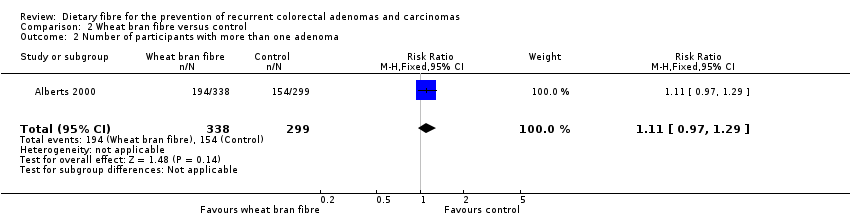
Comparison 2 Wheat bran fibre versus control, Outcome 2 Number of participants with more than one adenoma.

Comparison 2 Wheat bran fibre versus control, Outcome 3 Number of participants with at least one adenoma 1 cm or greater.

Comparison 3 Wheat bran fibre and low fat diet versus control, Outcome 1 Number of participants with at least one recurrent adenoma.
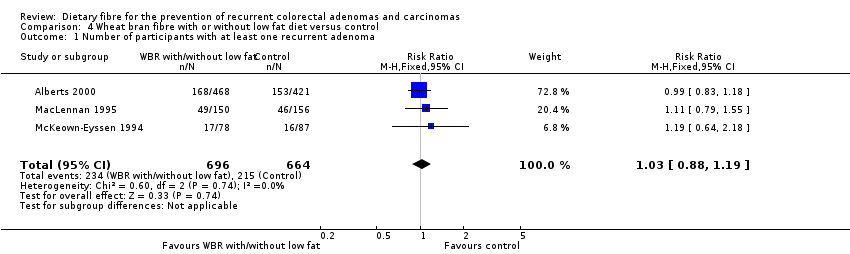
Comparison 4 Wheat bran fibre with or without low fat diet versus control, Outcome 1 Number of participants with at least one recurrent adenoma.

Comparison 4 Wheat bran fibre with or without low fat diet versus control, Outcome 2 Number of participants with more than one adenoma.

Comparison 4 Wheat bran fibre with or without low fat diet versus control, Outcome 3 Number of participants with at least one adenoma 1 cm or greater.

Comparison 5 Comprehensive dietary intervention versus control, Outcome 1 Number of participants with at least one recurrent adenoma (4 years).
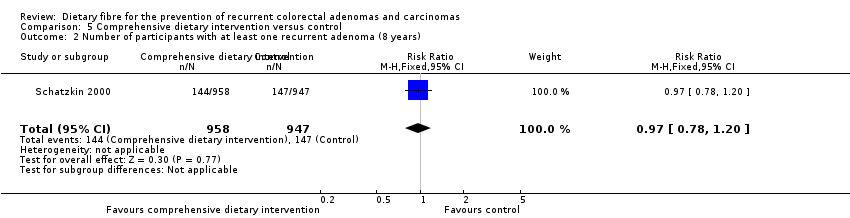
Comparison 5 Comprehensive dietary intervention versus control, Outcome 2 Number of participants with at least one recurrent adenoma (8 years).
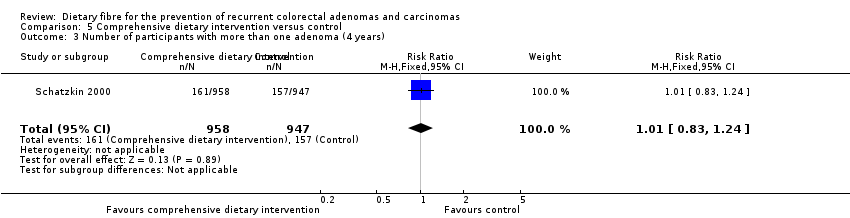
Comparison 5 Comprehensive dietary intervention versus control, Outcome 3 Number of participants with more than one adenoma (4 years).

Comparison 5 Comprehensive dietary intervention versus control, Outcome 4 Number of participants with more than one adenoma (8 years).
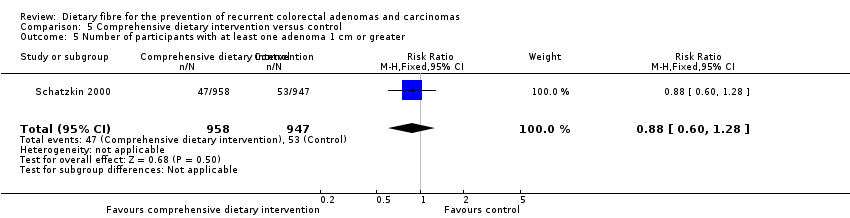
Comparison 5 Comprehensive dietary intervention versus control, Outcome 5 Number of participants with at least one adenoma 1 cm or greater.

Comparison 6 Ispaghula husk versus control, Outcome 1 Number of participants with at least one recurrent adenoma.

Comparison 6 Ispaghula husk versus control, Outcome 2 Number of participants with at least one adenoma 1 cm or greater.
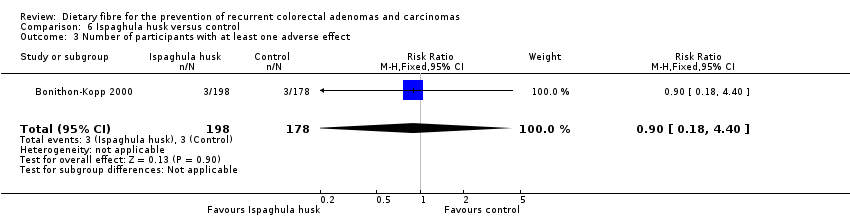
Comparison 6 Ispaghula husk versus control, Outcome 3 Number of participants with at least one adverse effect.

Comparison 7 Sensitivity analysis 1. Dietary fibre (all study interventions) versus control, Outcome 1 Number of participants with at least one recurrent adenoma.
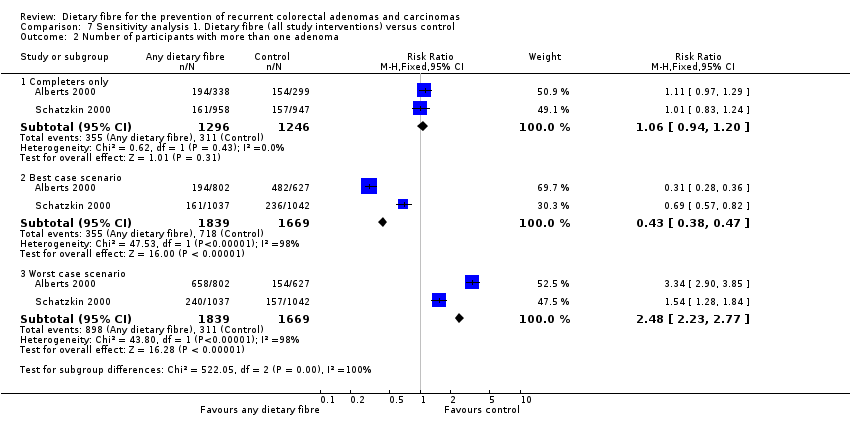
Comparison 7 Sensitivity analysis 1. Dietary fibre (all study interventions) versus control, Outcome 2 Number of participants with more than one adenoma.
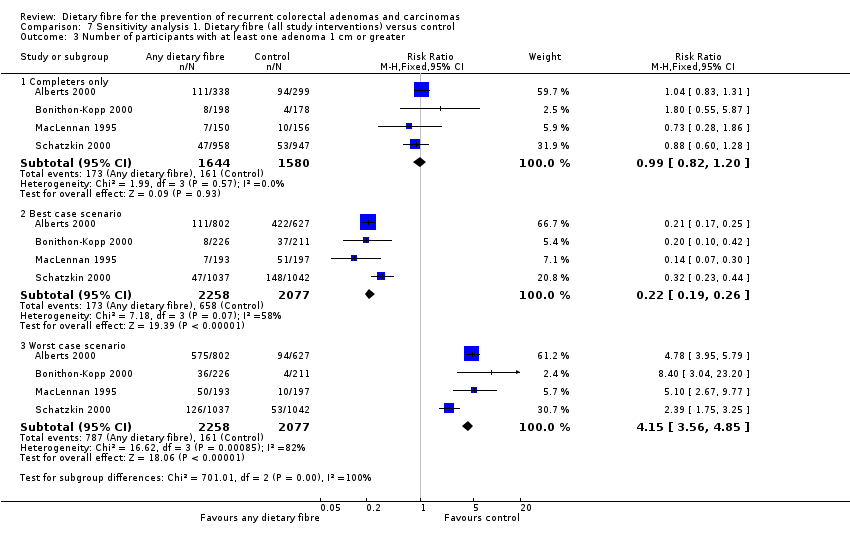
Comparison 7 Sensitivity analysis 1. Dietary fibre (all study interventions) versus control, Outcome 3 Number of participants with at least one adenoma 1 cm or greater.
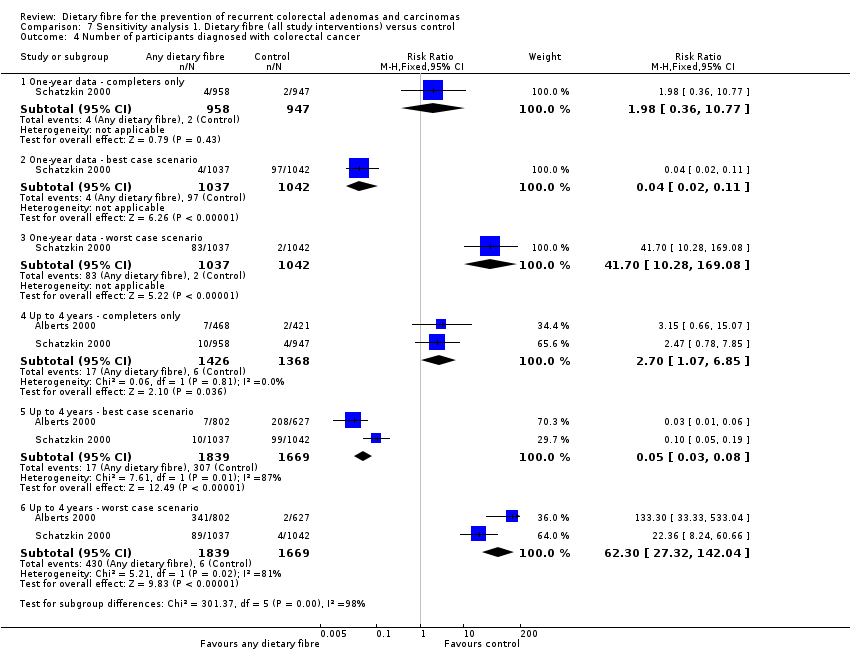
Comparison 7 Sensitivity analysis 1. Dietary fibre (all study interventions) versus control, Outcome 4 Number of participants diagnosed with colorectal cancer.
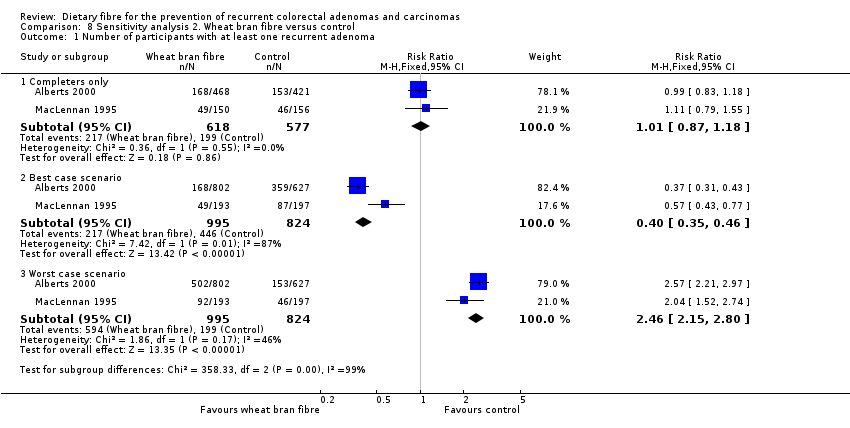
Comparison 8 Sensitivity analysis 2. Wheat bran fibre versus control, Outcome 1 Number of participants with at least one recurrent adenoma.

Comparison 8 Sensitivity analysis 2. Wheat bran fibre versus control, Outcome 2 Number of participants with more than one adenoma.
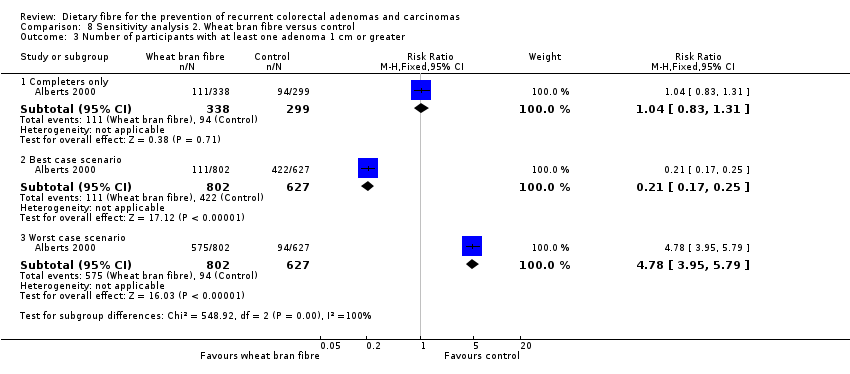
Comparison 8 Sensitivity analysis 2. Wheat bran fibre versus control, Outcome 3 Number of participants with at least one adenoma 1 cm or greater.
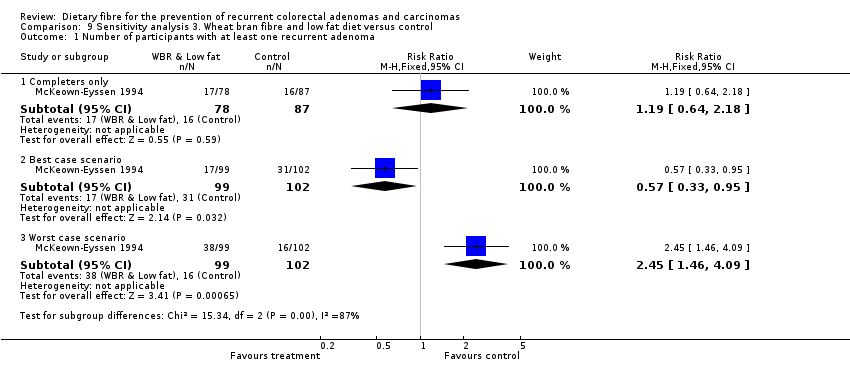
Comparison 9 Sensitivity analysis 3. Wheat bran fibre and low fat diet versus control, Outcome 1 Number of participants with at least one recurrent adenoma.

Comparison 10 Sensitivity analysis 4. Wheat bran fibre with or without low fat diet versus control, Outcome 1 Number of participants with at least one recurrent adenoma.

Comparison 10 Sensitivity analysis 4. Wheat bran fibre with or without low fat diet versus control, Outcome 2 Number of participants with more than one adenoma.
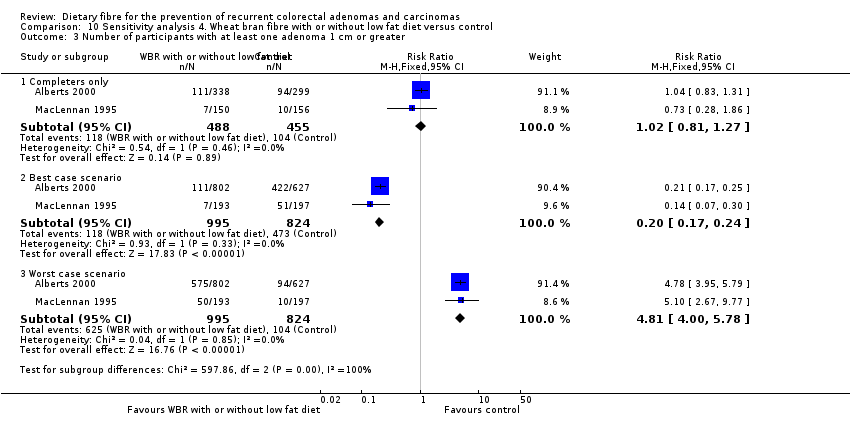
Comparison 10 Sensitivity analysis 4. Wheat bran fibre with or without low fat diet versus control, Outcome 3 Number of participants with at least one adenoma 1 cm or greater.
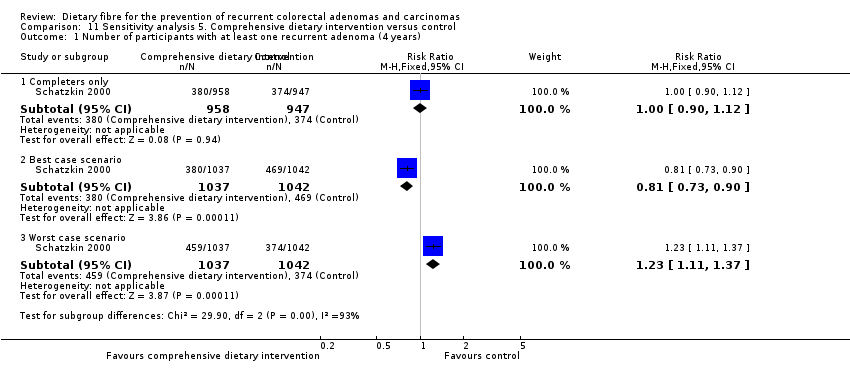
Comparison 11 Sensitivity analysis 5. Comprehensive dietary intervention versus control, Outcome 1 Number of participants with at least one recurrent adenoma (4 years).
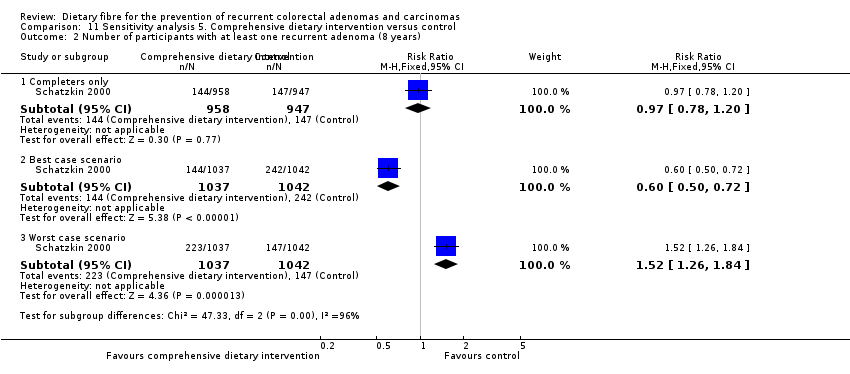
Comparison 11 Sensitivity analysis 5. Comprehensive dietary intervention versus control, Outcome 2 Number of participants with at least one recurrent adenoma (8 years).

Comparison 11 Sensitivity analysis 5. Comprehensive dietary intervention versus control, Outcome 3 Number of participants with more than one adenoma (4 years).

Comparison 11 Sensitivity analysis 5. Comprehensive dietary intervention versus control, Outcome 4 Number of participants with more than one adenoma (8 years).
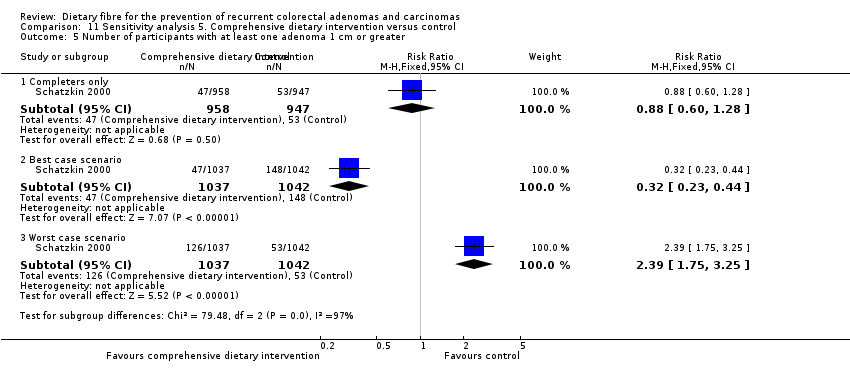
Comparison 11 Sensitivity analysis 5. Comprehensive dietary intervention versus control, Outcome 5 Number of participants with at least one adenoma 1 cm or greater.

Comparison 12 Sensitivity analysis 6. Ispaghula husk versus control, Outcome 1 Number of participants with at least one recurrent adenoma.
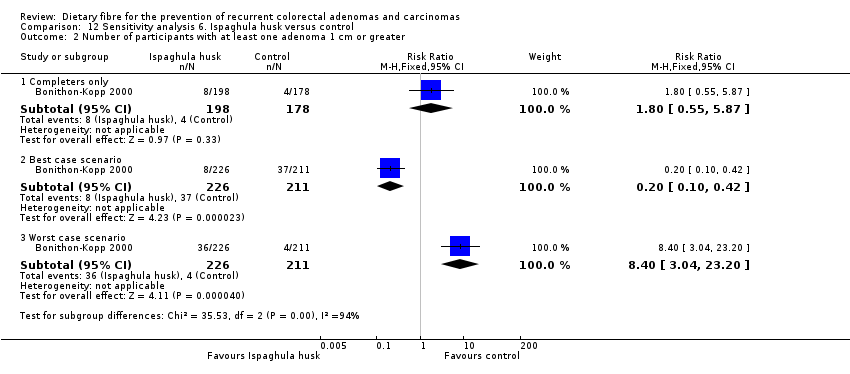
Comparison 12 Sensitivity analysis 6. Ispaghula husk versus control, Outcome 2 Number of participants with at least one adenoma 1 cm or greater.
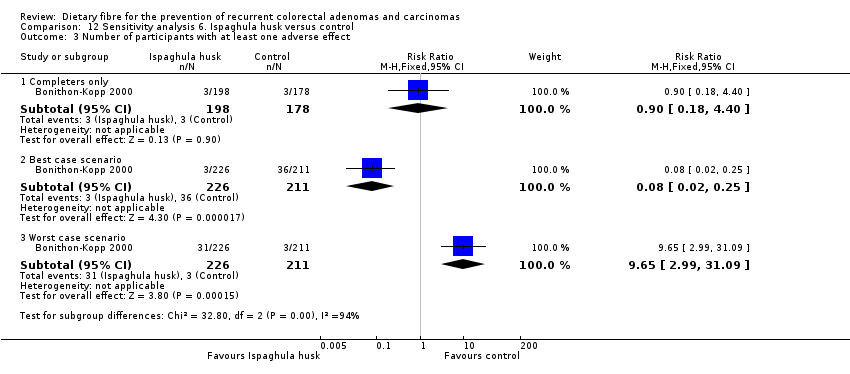
Comparison 12 Sensitivity analysis 6. Ispaghula husk versus control, Outcome 3 Number of participants with at least one adverse effect.
| Dietary fibre (all study interventions) versus control for the prevention of colorectal adenomas and carcinomas | ||||||
| Patient or population: people with a history of colorectal adenomas | ||||||
| Outcomes | Illustrative comparative risks* (95% CI) | Relative effect | No of participants | Quality of the evidence | Comments | |
| Assumed risk | Corresponding risk | |||||
| Control | Dietary fibre (all study interventions) versus control | |||||
| Number of participantswith at least one recurrent adenoma | Study population | RR 1.04 | 3641 | ⊕⊕⊝⊝ | ||
| 349 per 1000 | 363 per 1000 | |||||
| Moderate | ||||||
| 295 per 1000 | 307 per 1000 | |||||
| Number of participantswith more than one adenoma | Study population | RR 1.06 | 2542 | ⊕⊕⊝⊝ | ||
| 250 per 1000 | 265 per 1000 | |||||
| Moderate | ||||||
| 340 per 1000 | 360 per 1000 | |||||
| Number of participantswith at least one adenoma 1 cm or greater Follow up: 3 to 4 years | Study population | RR 0.99 | 3224 | ⊕⊕⊝⊝ | ||
| 102 per 1000 | 101 per 1000 | |||||
| Moderate | ||||||
| 60 per 1000 | 59 per 1000 | |||||
| Number of participantsdiagnosed with colorectal cancer | Study population | RR 2.70 | 2794 | ⊕⊕⊝⊝ | The incidence of colorectal cancer is very low, so when risk was calculated by risk difference (RD), the difference between groups was very small. RD = 0.01, 95% CI 0.00 to 0.01 | |
| 4 per 1000 | 12 per 1000 | |||||
| Moderate | ||||||
| 5 per 1000 | 14 per 1000 | |||||
| *The basis for the assumed risk (e.g. the median control group risk across studies) is provided in footnotes. The corresponding risk (and its 95% confidence interval) is based on the assumed risk in the comparison group and the relative effect of the intervention (and its 95% CI). | ||||||
| GRADE Working Group grades of evidence | ||||||
| a Risk of bias: downgraded by one level due to high risk of detection/performance bias and attrition bias. | ||||||
| Outcome or subgroup title | No. of studies | No. of participants | Statistical method | Effect size |
| 1 Number of participants with at least one recurrent adenoma Show forest plot | 5 | 3641 | Risk Ratio (M‐H, Fixed, 95% CI) | 1.04 [0.95, 1.13] |
| 2 Number of participants with more than one adenoma Show forest plot | 2 | 2542 | Risk Ratio (M‐H, Fixed, 95% CI) | 1.06 [0.94, 1.20] |
| 3 Number of participants with at least one adenoma 1 cm or greater Show forest plot | 4 | 3224 | Risk Ratio (M‐H, Fixed, 95% CI) | 0.99 [0.82, 1.20] |
| 4 Number of participants diagnosed with colorectal cancer Show forest plot | 2 | Risk Ratio (M‐H, Fixed, 95% CI) | Subtotals only | |
| 4.1 One‐ year data | 1 | 1905 | Risk Ratio (M‐H, Fixed, 95% CI) | 1.98 [0.36, 10.77] |
| 4.2 Up to 4 years | 2 | 2794 | Risk Ratio (M‐H, Fixed, 95% CI) | 2.70 [1.07, 6.85] |
| Outcome or subgroup title | No. of studies | No. of participants | Statistical method | Effect size |
| 1 Number of participants with at least one recurrent adenoma Show forest plot | 2 | 1195 | Risk Ratio (M‐H, Fixed, 95% CI) | 1.01 [0.87, 1.18] |
| 2 Number of participants with more than one adenoma Show forest plot | 1 | 637 | Risk Ratio (M‐H, Fixed, 95% CI) | 1.11 [0.97, 1.29] |
| 3 Number of participants with at least one adenoma 1 cm or greater Show forest plot | 1 | 637 | Risk Ratio (M‐H, Fixed, 95% CI) | 1.04 [0.83, 1.31] |
| Outcome or subgroup title | No. of studies | No. of participants | Statistical method | Effect size |
| 1 Number of participants with at least one recurrent adenoma Show forest plot | 1 | 165 | Risk Ratio (M‐H, Fixed, 95% CI) | 1.19 [0.64, 2.18] |
| Outcome or subgroup title | No. of studies | No. of participants | Statistical method | Effect size |
| 1 Number of participants with at least one recurrent adenoma Show forest plot | 3 | 1360 | Risk Ratio (M‐H, Fixed, 95% CI) | 1.03 [0.88, 1.19] |
| 2 Number of participants with more than one adenoma Show forest plot | 1 | 637 | Risk Ratio (M‐H, Fixed, 95% CI) | 1.11 [0.97, 1.29] |
| 3 Number of participants with at least one adenoma 1 cm or greater Show forest plot | 2 | 943 | Risk Ratio (M‐H, Fixed, 95% CI) | 1.02 [0.81, 1.27] |
| Outcome or subgroup title | No. of studies | No. of participants | Statistical method | Effect size |
| 1 Number of participants with at least one recurrent adenoma (4 years) Show forest plot | 1 | 1905 | Risk Ratio (M‐H, Fixed, 95% CI) | 1.00 [0.90, 1.12] |
| 2 Number of participants with at least one recurrent adenoma (8 years) Show forest plot | 1 | 1905 | Risk Ratio (M‐H, Fixed, 95% CI) | 0.97 [0.78, 1.20] |
| 3 Number of participants with more than one adenoma (4 years) Show forest plot | 1 | 1905 | Risk Ratio (M‐H, Fixed, 95% CI) | 1.01 [0.83, 1.24] |
| 4 Number of participants with more than one adenoma (8 years) Show forest plot | 1 | 1905 | Risk Ratio (M‐H, Fixed, 95% CI) | 0.89 [0.64, 1.24] |
| 5 Number of participants with at least one adenoma 1 cm or greater Show forest plot | 1 | 1905 | Risk Ratio (M‐H, Fixed, 95% CI) | 0.88 [0.60, 1.28] |
| Outcome or subgroup title | No. of studies | No. of participants | Statistical method | Effect size |
| 1 Number of participants with at least one recurrent adenoma Show forest plot | 1 | 376 | Risk Ratio (M‐H, Fixed, 95% CI) | 1.45 [1.01, 2.08] |
| 2 Number of participants with at least one adenoma 1 cm or greater Show forest plot | 1 | 376 | Risk Ratio (M‐H, Fixed, 95% CI) | 1.80 [0.55, 5.87] |
| 3 Number of participants with at least one adverse effect Show forest plot | 1 | 376 | Risk Ratio (M‐H, Fixed, 95% CI) | 0.90 [0.18, 4.40] |
| Outcome or subgroup title | No. of studies | No. of participants | Statistical method | Effect size |
| 1 Number of participants with at least one recurrent adenoma Show forest plot | 5 | Risk Ratio (M‐H, Fixed, 95% CI) | Subtotals only | |
| 1.1 Completers only | 5 | 3641 | Risk Ratio (M‐H, Fixed, 95% CI) | 1.04 [0.95, 1.13] |
| 1.2 Best case scenario | 5 | 4536 | Risk Ratio (M‐H, Fixed, 95% CI) | 0.61 [0.57, 0.66] |
| 1.3 Worst case scenario | 5 | 4536 | Risk Ratio (M‐H, Fixed, 95% CI) | 1.73 [1.60, 1.88] |
| 2 Number of participants with more than one adenoma Show forest plot | 2 | Risk Ratio (M‐H, Fixed, 95% CI) | Subtotals only | |
| 2.1 Completers only | 2 | 2542 | Risk Ratio (M‐H, Fixed, 95% CI) | 1.06 [0.94, 1.20] |
| 2.2 Best case scenario | 2 | 3508 | Risk Ratio (M‐H, Fixed, 95% CI) | 0.43 [0.38, 0.47] |
| 2.3 Worst case scenario | 2 | 3508 | Risk Ratio (M‐H, Fixed, 95% CI) | 2.48 [2.23, 2.77] |
| 3 Number of participants with at least one adenoma 1 cm or greater Show forest plot | 4 | Risk Ratio (M‐H, Fixed, 95% CI) | Subtotals only | |
| 3.1 Completers only | 4 | 3224 | Risk Ratio (M‐H, Fixed, 95% CI) | 0.99 [0.82, 1.20] |
| 3.2 Best case scenario | 4 | 4335 | Risk Ratio (M‐H, Fixed, 95% CI) | 0.22 [0.19, 0.26] |
| 3.3 Worst case scenario | 4 | 4335 | Risk Ratio (M‐H, Fixed, 95% CI) | 4.15 [3.56, 4.85] |
| 4 Number of participants diagnosed with colorectal cancer Show forest plot | 2 | Risk Ratio (M‐H, Fixed, 95% CI) | Subtotals only | |
| 4.1 One‐ year data ‐ completers only | 1 | 1905 | Risk Ratio (M‐H, Fixed, 95% CI) | 1.98 [0.36, 10.77] |
| 4.2 One‐ year data ‐ best case scenario | 1 | 2079 | Risk Ratio (M‐H, Fixed, 95% CI) | 0.04 [0.02, 0.11] |
| 4.3 One‐ year data ‐ worst case scenario | 1 | 2079 | Risk Ratio (M‐H, Fixed, 95% CI) | 41.70 [10.28, 169.08] |
| 4.4 Up to 4 years ‐ completers only | 2 | 2794 | Risk Ratio (M‐H, Fixed, 95% CI) | 2.70 [1.07, 6.85] |
| 4.5 Up to 4 years ‐ best case scenario | 2 | 3508 | Risk Ratio (M‐H, Fixed, 95% CI) | 0.05 [0.03, 0.08] |
| 4.6 Up to 4 years ‐ worst case scenario | 2 | 3508 | Risk Ratio (M‐H, Fixed, 95% CI) | 62.30 [27.32, 142.04] |
| Outcome or subgroup title | No. of studies | No. of participants | Statistical method | Effect size |
| 1 Number of participants with at least one recurrent adenoma Show forest plot | 2 | Risk Ratio (M‐H, Fixed, 95% CI) | Subtotals only | |
| 1.1 Completers only | 2 | 1195 | Risk Ratio (M‐H, Fixed, 95% CI) | 1.01 [0.87, 1.18] |
| 1.2 Best case scenario | 2 | 1819 | Risk Ratio (M‐H, Fixed, 95% CI) | 0.40 [0.35, 0.46] |
| 1.3 Worst case scenario | 2 | 1819 | Risk Ratio (M‐H, Fixed, 95% CI) | 2.46 [2.15, 2.80] |
| 2 Number of participants with more than one adenoma Show forest plot | 1 | Risk Ratio (M‐H, Fixed, 95% CI) | Subtotals only | |
| 2.1 Completers only | 1 | 637 | Risk Ratio (M‐H, Fixed, 95% CI) | 1.11 [0.97, 1.29] |
| 2.2 Best case scenario | 1 | 1429 | Risk Ratio (M‐H, Fixed, 95% CI) | 0.31 [0.28, 0.36] |
| 2.3 Worst case scenario | 1 | 1429 | Risk Ratio (M‐H, Fixed, 95% CI) | 3.34 [2.90, 3.85] |
| 3 Number of participants with at least one adenoma 1 cm or greater Show forest plot | 1 | Risk Ratio (M‐H, Fixed, 95% CI) | Subtotals only | |
| 3.1 Completers only | 1 | 637 | Risk Ratio (M‐H, Fixed, 95% CI) | 1.04 [0.83, 1.31] |
| 3.2 Best case scenario | 1 | 1429 | Risk Ratio (M‐H, Fixed, 95% CI) | 0.21 [0.17, 0.25] |
| 3.3 Worst case scenario | 1 | 1429 | Risk Ratio (M‐H, Fixed, 95% CI) | 4.78 [3.95, 5.79] |
| Outcome or subgroup title | No. of studies | No. of participants | Statistical method | Effect size |
| 1 Number of participants with at least one recurrent adenoma Show forest plot | 1 | Risk Ratio (M‐H, Fixed, 95% CI) | Subtotals only | |
| 1.1 Completers only | 1 | 165 | Risk Ratio (M‐H, Fixed, 95% CI) | 1.19 [0.64, 2.18] |
| 1.2 Best case scenario | 1 | 201 | Risk Ratio (M‐H, Fixed, 95% CI) | 0.57 [0.33, 0.95] |
| 1.3 Worst case scenario | 1 | 201 | Risk Ratio (M‐H, Fixed, 95% CI) | 2.45 [1.46, 4.09] |
| Outcome or subgroup title | No. of studies | No. of participants | Statistical method | Effect size |
| 1 Number of participants with at least one recurrent adenoma Show forest plot | 3 | Risk Ratio (M‐H, Fixed, 95% CI) | Subtotals only | |
| 1.1 Completers only | 3 | 1360 | Risk Ratio (M‐H, Fixed, 95% CI) | 1.03 [0.88, 1.19] |
| 1.2 Best case scenario | 3 | 2020 | Risk Ratio (M‐H, Fixed, 95% CI) | 0.41 [0.36, 0.47] |
| 1.3 Worst case scenario | 3 | 2020 | Risk Ratio (M‐H, Fixed, 95% CI) | 2.45 [2.16, 2.79] |
| 2 Number of participants with more than one adenoma Show forest plot | 1 | Risk Ratio (M‐H, Fixed, 95% CI) | Subtotals only | |
| 2.1 Completers only | 1 | 637 | Risk Ratio (M‐H, Fixed, 95% CI) | 1.11 [0.97, 1.29] |
| 2.2 Best case scenario | 1 | 1429 | Risk Ratio (M‐H, Fixed, 95% CI) | 0.31 [0.28, 0.36] |
| 2.3 Worst case scenario | 1 | 1429 | Risk Ratio (M‐H, Fixed, 95% CI) | 3.34 [2.90, 3.85] |
| 3 Number of participants with at least one adenoma 1 cm or greater Show forest plot | 2 | Risk Ratio (M‐H, Fixed, 95% CI) | Subtotals only | |
| 3.1 Completers only | 2 | 943 | Risk Ratio (M‐H, Fixed, 95% CI) | 1.02 [0.81, 1.27] |
| 3.2 Best case scenario | 2 | 1819 | Risk Ratio (M‐H, Fixed, 95% CI) | 0.20 [0.17, 0.24] |
| 3.3 Worst case scenario | 2 | 1819 | Risk Ratio (M‐H, Fixed, 95% CI) | 4.81 [4.00, 5.78] |
| Outcome or subgroup title | No. of studies | No. of participants | Statistical method | Effect size |
| 1 Number of participants with at least one recurrent adenoma (4 years) Show forest plot | 1 | Risk Ratio (M‐H, Fixed, 95% CI) | Subtotals only | |
| 1.1 Completers only | 1 | 1905 | Risk Ratio (M‐H, Fixed, 95% CI) | 1.00 [0.90, 1.12] |
| 1.2 Best case scenario | 1 | 2079 | Risk Ratio (M‐H, Fixed, 95% CI) | 0.81 [0.73, 0.90] |
| 1.3 Worst case scenario | 1 | 2079 | Risk Ratio (M‐H, Fixed, 95% CI) | 1.23 [1.11, 1.37] |
| 2 Number of participants with at least one recurrent adenoma (8 years) Show forest plot | 1 | Risk Ratio (M‐H, Fixed, 95% CI) | Subtotals only | |
| 2.1 Completers only | 1 | 1905 | Risk Ratio (M‐H, Fixed, 95% CI) | 0.97 [0.78, 1.20] |
| 2.2 Best case scenario | 1 | 2079 | Risk Ratio (M‐H, Fixed, 95% CI) | 0.60 [0.50, 0.72] |
| 2.3 Worst case scenario | 1 | 2079 | Risk Ratio (M‐H, Fixed, 95% CI) | 1.52 [1.26, 1.84] |
| 3 Number of participants with more than one adenoma (4 years) Show forest plot | 1 | Risk Ratio (M‐H, Fixed, 95% CI) | Subtotals only | |
| 3.1 Completers only | 1 | 1905 | Risk Ratio (M‐H, Fixed, 95% CI) | 1.01 [0.83, 1.24] |
| 3.2 Best case scenario | 1 | 2079 | Risk Ratio (M‐H, Fixed, 95% CI) | 0.64 [0.54, 0.77] |
| 3.3 Worst case scenario | 1 | 2079 | Risk Ratio (M‐H, Fixed, 95% CI) | 1.54 [1.28, 1.84] |
| 4 Number of participants with more than one adenoma (8 years) Show forest plot | 1 | Risk Ratio (M‐H, Fixed, 95% CI) | Subtotals only | |
| 4.1 Completers only | 1 | 1932 | Risk Ratio (M‐H, Fixed, 95% CI) | 0.91 [0.66, 1.27] |
| 4.2 Best case scenario | 1 | 2079 | Risk Ratio (M‐H, Fixed, 95% CI) | 0.38 [0.29, 0.50] |
| 4.3 Worst case scenario | 1 | 2079 | Risk Ratio (M‐H, Fixed, 95% CI) | 2.05 [1.56, 2.70] |
| 5 Number of participants with at least one adenoma 1 cm or greater Show forest plot | 1 | Risk Ratio (M‐H, Fixed, 95% CI) | Subtotals only | |
| 5.1 Completers only | 1 | 1905 | Risk Ratio (M‐H, Fixed, 95% CI) | 0.88 [0.60, 1.28] |
| 5.2 Best case scenario | 1 | 2079 | Risk Ratio (M‐H, Fixed, 95% CI) | 0.32 [0.23, 0.44] |
| 5.3 Worst case scenario | 1 | 2079 | Risk Ratio (M‐H, Fixed, 95% CI) | 2.39 [1.75, 3.25] |
| Outcome or subgroup title | No. of studies | No. of participants | Statistical method | Effect size |
| 1 Number of participants with at least one recurrent adenoma Show forest plot | 1 | Risk Ratio (M‐H, Fixed, 95% CI) | Subtotals only | |
| 1.1 Completers only | 1 | 376 | Risk Ratio (M‐H, Fixed, 95% CI) | 1.45 [1.01, 2.08] |
| 1.2 Best case scenario | 1 | 437 | Risk Ratio (M‐H, Fixed, 95% CI) | 0.78 [0.58, 1.05] |
| 1.3 Worst case scenario | 1 | 437 | Risk Ratio (M‐H, Fixed, 95% CI) | 2.23 [1.59, 3.14] |
| 2 Number of participants with at least one adenoma 1 cm or greater Show forest plot | 1 | Risk Ratio (M‐H, Fixed, 95% CI) | Subtotals only | |
| 2.1 Completers only | 1 | 376 | Risk Ratio (M‐H, Fixed, 95% CI) | 1.80 [0.55, 5.87] |
| 2.2 Best case scenario | 1 | 437 | Risk Ratio (M‐H, Fixed, 95% CI) | 0.20 [0.10, 0.42] |
| 2.3 Worst case scenario | 1 | 437 | Risk Ratio (M‐H, Fixed, 95% CI) | 8.40 [3.04, 23.20] |
| 3 Number of participants with at least one adverse effect Show forest plot | 1 | Risk Ratio (M‐H, Fixed, 95% CI) | Subtotals only | |
| 3.1 Completers only | 1 | 376 | Risk Ratio (M‐H, Fixed, 95% CI) | 0.90 [0.18, 4.40] |
| 3.2 Best case scenario | 1 | 437 | Risk Ratio (M‐H, Fixed, 95% CI) | 0.08 [0.02, 0.25] |
| 3.3 Worst case scenario | 1 | 437 | Risk Ratio (M‐H, Fixed, 95% CI) | 9.65 [2.99, 31.09] |