نقش رژیمهای درمانی چرخهای برای انتقال جنین منجمد شده‐ذوب شده
Referencias
منابع مطالعات واردشده در این مرور
منابع مطالعات خارجشده از این مرور
منابع مطالعات در حال انجام
منابع اضافی
منابع دیگر نسخههای منتشرشده این مرور
Characteristics of studies
Characteristics of included studies [ordered by study ID]
| Methods | 2‐arm, parallel RCT 2 ART centres | |
| Participants | 176 women undergoing FET Inclusion criteria: infertile women (male factor) aged 20‐37 years who had regular menstrual cycles and had previously undergone IVF or ICSI with the same induction protocol with embryo cryopreservation. Exclusion criteria: not reported Baseline characteristics were similar in the 2 groups | |
| Interventions | HT (83 women) Women received oral estradiol valerate 4 mg/d from day 2‐day 5 and 6 mg/d from day 6 to the day of the pregnancy test. In day 13 of cycle, an US examination was performed. After US confirmation of endometrial thickness (8 mm) and no ovarian activity, progesterone suppository 800 mg/d was added. The dose of estradiol was increased to 8 mg/d if endometrial thickness was < 8 mm. 2 or 3 embryos were transferred via transcervical route 48 h after the beginning of progesterone administration. In addition to HT, steroid supplementation was commenced without prior pituitary suppression. HT plus GnRHa (93 women) In addition to HT, triptorelin 3.75 mg IM, as a depot GnRHa was administered in the mid‐luteal phase (day 21) of previous cycle. | |
| Outcomes | Miscarriage rate per woman Clinical pregnancy rate per woman | |
| Notes | ||
| Risk of bias | ||
| Bias | Authors' judgement | Support for judgement |
| Random sequence generation (selection bias) | Low risk | Computer‐generated random sequence |
| Allocation concealment (selection bias) | Unclear risk | Not reported |
| Blinding (performance bias and detection bias) | Unclear risk | Not reported but non‐blinding of outcome assessors may not have affected some of the outcome measures as they were objectively assessed |
| Incomplete outcome data (attrition bias) | Low risk | All women randomized were included in data analysis |
| Selective reporting (reporting bias) | Unclear risk | Insufficient information to make a conclusive judgement |
| Other bias | Low risk | Baseline characteristics were similar in the 2 groups |
| Methods | Single‐centre parallel RCT | |
| Participants | 100 women Inclusion criteria: women who had cryopreservation of embryos following IVF treatment Exclusion criteria: not stated Mean number of transferred embryos per woman: similar, HT group 2.7 ± 0.0 (1‐4 embryos), natural cycle group 2.8 ± 0.8 (1‐5 embryos) | |
| Interventions | FET HT cycle (56 women (64 cycles)) Natural cycle FET (44 women (50 cycles)) | |
| Outcomes | Clinical pregnancy rate per woman Multiple pregnancy rate per pregnancy | |
| Notes | This was an abstract. The review authors contacted the first author requesting more data but as this study was not published and was presented in 1994, the study author could not supply any more data. | |
| Risk of bias | ||
| Bias | Authors' judgement | Support for judgement |
| Random sequence generation (selection bias) | Unclear risk | Process involved in random sequence generation not reported |
| Allocation concealment (selection bias) | Unclear risk | Methods used in allocation concealment not reported |
| Blinding (performance bias and detection bias) | Unclear risk | No information provided on the blinding of participants and personnel |
| Incomplete outcome data (attrition bias) | Unclear risk | No reports on number of missing outcome data and reasons for drop out or exclusion from study |
| Selective reporting (reporting bias) | Unclear risk | Insufficient information reported to arrive at a judgement |
| Other bias | Unclear risk | Insufficient information reported to arrive at a judgement |
| Methods | Single‐centre parallel RCT | |
| Participants | 296 women Inclusion criteria: women with functioning ovaries who had surplus embryos frozen following fresh ET in a cycle of IVF or ICSI Exclusion criteria: women with only 1 frozen embryo or women who had all their embryos cryopreserved because of OHSS Number of transferred embryos per woman: similar, 2.1 ± 0.7 in HT group and 2.1 ± 0.6 in HT plus GnRHa group % embryos that survived freezing‐thawing: similar, 76.6% in HT group and 77.1% in HT plus GnRHa Baseline characteristics were similar in the 2 groups Infertility aetiology: similar (tubal, idiopathic and male factors) | |
| Interventions | HT plus GnRHa group (146 women) Long‐acting triptorelin, 3.75 mg IM starting on mid‐luteal phase of the cycle. E2 transdermal patches 100 μg was started from day 1‐day 7 of menstrual cycle, 200 μg from day 8‐day 10, and 300 μg from day 11 onwards. Patches were replaced every 84 h. In women with endometrium of < 8 mm thickness, E2 dose was increased to 400 μg. If endometrial thickness was ≥ 8 mm with no evidence of preovulatory follicles, corpus luteum or hyperechoic endometrium, progesterone in oil was administered IM at a dose of 100 mg E2 and progesterone treatment was at least continued until pregnancy test was done at 15 days after ET HT group (150 women) E2 patches were started from day 1 of cycle as 200 μg then increased to 300 μg on day 8 Progesterone: as in HT plus GnRHa group Cycle monitoring: by US aiming for endometrial thickness of ≥ 8 mm prior to FET | |
| Outcomes | Clinical pregnancy rate per woman Miscarriage rate per pregnancy Cycle cancellation rate per woman Endometrial thickness on day of starting progesterone | |
| Notes | ||
| Risk of bias | ||
| Bias | Authors' judgement | Support for judgement |
| Random sequence generation (selection bias) | Unclear risk | Stated that randomization performed using sealed envelopes but the process involved in generating the sequence not reported |
| Allocation concealment (selection bias) | Unclear risk | Allocation was said to have been concealed in sealed envelopes which were sequentially numbered. Not stated whether the envelopes were opaque |
| Blinding (performance bias and detection bias) | Unclear risk | Stated that contents of envelopes were known only to medical staff who were not involved with the trial. Not reported whether the outcome assessor was blinded; however non‐blinding was likely to influence some of the outcome measures |
| Incomplete outcome data (attrition bias) | Unclear risk | Stated that statistical analysis performed on an ITT basis which included all randomized women who started progesterone therapy, but this was not the case from the results tables. Nevertheless, the review authors applied ITT to study data |
| Selective reporting (reporting bias) | Low risk | Although the trial protocol was not available for review, data were reported on the prespecified outcomes in the methods section. |
| Other bias | Low risk | No other potential source of within‐study bias found. |
| Methods | Single‐centre, 2‐arm, parallel RCT | |
| Participants | 60 women undergoing FET cycle Inclusion: women < 30 years, had previously undergone IVF or ICSI with embryo cryopreservation, had regular menstrual cycles Exclusion criteria: not explicitly stated Baseline characteristics were similar in both groups. | |
| Interventions | HT (30 women) Estradiol valerate orally at 2 mg/d from day 1‐day 4; 4 mg/d from day 5‐day 9; and 6 mg/d from day 10 onwards up to the day of pregnancy test. If the endometrial thickness was > 8 mm, progesterone 100 mg/d IM in oil and transfer of 2 frozen‐thawed embryos was performed on day 2 after progesterone administration HT plus GnRHa (30 women) As for HT alone. In addition to HT, buserelin acetate (a GnRHa) 0.5 mg SC was administered in the mid‐luteal phase (day 21) of the menstrual cycle and was continued until day 11 of cycle | |
| Outcomes | Clinical pregnancy rate per woman randomized Miscarriage rate per woman randomized | |
| Notes | ||
| Risk of bias | ||
| Bias | Authors' judgement | Support for judgement |
| Random sequence generation (selection bias) | Low risk | Computer‐generated random sequence |
| Allocation concealment (selection bias) | Unclear risk | Not reported |
| Blinding (performance bias and detection bias) | Unclear risk | Not reported but non‐blinding of outcome assessors may not have affected some of the outcome measures as they were objectively assessed. |
| Incomplete outcome data (attrition bias) | Low risk | Number of participants analyzed was same as the number of participants randomized |
| Selective reporting (reporting bias) | Low risk | Outcomes measured were prespecified in methods section |
| Other bias | Low risk | Baseline characteristics similar in both groups |
| Methods | Single‐centre, 2‐arm, parallel RCT | |
| Participants | 130 infertile women who were candidates for FET Inclusion criteria: women who had undergone IVF or ICSI with cryopreservation of excess embryos and fresh cycles with implantation failure. Exclusion criteria: aged > 38 years, BMI > 30 kg/m2, history of endocrine disorders and severe endometriosis Baseline characteristics similar in both groups | |
| Interventions | HT (65 women) All women received estradiol valerate 6 mg/d orally from day 2 of menstrual cycle and progesterone in oil 100 mg IM when the endometrial thickness reached 8 mm ET was performed 3 days after the beginning of progesterone administration. Estradiol and progesterone were continued until the 10th week of gestation HT plus HCG (65 women) As for HT and in addition, women received an HCG 5000 IU injection on the first day of progesterone administration and the day of ET. Embryo thawing was performed 2 days after the first progesterone injection. Embryos were transferred 1 day after thawing using a Labotect catheter (Labotect, Gotting, Germany). | |
| Outcomes | Miscarriage Ongoing pregnancy Clinical pregnancy | |
| Notes | No outcome data available | |
| Risk of bias | ||
| Bias | Authors' judgement | Support for judgement |
| Random sequence generation (selection bias) | Low risk | Computer‐generated random sequence |
| Allocation concealment (selection bias) | Unclear risk | No information reported on allocation concealment |
| Blinding (performance bias and detection bias) | Unclear risk | No information reported but non‐blinding of outcome assessors may not have affected some of the outcome measures as they were objectively assessed. |
| Incomplete outcome data (attrition bias) | Unclear risk | No information reported on withdrawals or losses to follow‐up, or both |
| Selective reporting (reporting bias) | Low risk | Outcome measures were prespecified in the methods section |
| Other bias | Low risk | Baseline characteristics similar in both group |
| Methods | Single‐centre parallel RCT | |
| Participants | 234 women Inclusion criteria: women with functioning ovaries and regular menstrual cycles who had surplus embryos frozen following fresh ET in a cycle of IVF or ICSI Exclusion criteria: FET originating from donated oocytes and women with irregular cycles. Number of transferred embryos per woman: HT group 2.2 ± 0.6, HT plus GnRHa group 2.3 ± 0.6 Baseline characteristics were similar in the 2 groups Infertility cause: similar (variety of causes) | |
| Interventions | HT group (117 women) Estradiol valerate 6 mg/d/tablet started on day 1 of menstruation HT plus GnRHa group (117 women) Buserelin nasal spray was started in mid‐luteal phase (day 21) of cycle. On day 1 of subsequent cycle, oral E2 initiated as 6 mg/d in 2 divided doses In both groups, E2 dose continued for 12‐14 days then endometrial thickness was assessed by US. If endometrial thickness was < 8 mm, E2 dose was increased to 8 mg/d for further 7‐12 days Once 8 mm endometrial thickness had been confirmed, micronised progesterone pessaries 400 mg twice daily were commenced. GnRHa was stopped at this stage. Embryos were transferred on day 3 of progesterone initiation. Progesterone use was for 2 weeks following FET. Pregnant women were advised to continue E2 and progesterone supplement up to 12th gestational week. | |
| Outcomes | Clinical pregnancy rate per woman Miscarriage rate per clinical pregnancy Live birth rate per woman Cycle cancellation rate per woman Endometrial thickness prior to FET | |
| Notes | Miscarriage rate per clinical pregnancy was used to calculate miscarriage rate per woman. | |
| Risk of bias | ||
| Bias | Authors' judgement | Support for judgement |
| Random sequence generation (selection bias) | Low risk | Computer‐generated random list |
| Allocation concealment (selection bias) | Unclear risk | Methods used in concealing the allocation not reported |
| Blinding (performance bias and detection bias) | Unclear risk | No reports on blinding of participants and personnel, although blinding of outcome assessor could not have influenced some of the reported outcome measures |
| Incomplete outcome data (attrition bias) | Low risk | Analysis reported to have been performed on an ITT basis. ITT was not fully defined but it was apparent from 1 of the result tables that all participants randomized were included in data analysis (other aspects of ITT could not be verified) |
| Selective reporting (reporting bias) | Low risk | Data reported on all the outcomes prespecified in the methods section. |
| Other bias | Low risk | No other potential source of bias found. |
| Methods | Single‐centre, parallel RCT Computer‐generated, not concealed randomization Undertaken 1 October 2007‐30 November 2008 Power calculation performed | |
| Participants | 168 women Inclusion criteria: maternal age ≤ 36 years, regular menstrual cycles (25‐34 days), previous conventional IVF or ICSI Exclusion criteria: use of testicular sperm for ICSI, early (day 3) FSH levels ≤ 12 IU/L, American Society for Reproductive Medicine grades ≥ 3 for endometriosis and BMI ≥ 29 kg/m2 Women allowed to participate in the study only once | |
| Interventions | HCG‐induced natural cycle FET (63 women) Spontaneous LH surge natural cycle FET (61 women) | |
| Outcomes | Ongoing pregnancy rate per woman Biochemical pregnancy rate per woman Miscarriage rate per woman Number of visits to clinic | |
| Notes | ||
| Risk of bias | ||
| Bias | Authors' judgement | Support for judgement |
| Random sequence generation (selection bias) | Low risk | Computer‐generated random list |
| Allocation concealment (selection bias) | High risk | Reported that allocation was not concealed |
| Blinding (performance bias and detection bias) | Unclear risk | Some of the personnel were blinded (pre‐ET US examination); no information on blinding of either participants or outcome assessor and non‐binding of outcome assessor could influence some of the outcome measures |
| Incomplete outcome data (attrition bias) | Unclear risk | Reason for attrition stated and similar between groups; however, number of missing outcome data differed between groups |
| Selective reporting (reporting bias) | Low risk | Outcome prespecified in the methods section was reported |
| Other bias | Unclear risk | Although it was reported that participants' characteristics and number of embryos transferred were similar in both groups, the groups differed in terms of embryo quality, participants' number of visits and number of days until LH‐HCG surge |
| Methods | Single‐centre, 2‐arm, parallel RCT Computer‐generated random sequence, unclear method of allocation concealment | |
| Participants | 236 women Inclusion criteria: maternal age < 42 years, regular menstrual cycle, normal intrauterine cavity, the presence of at least one vitrified euploid blastocyst obtained after ICSI followed by preimplantation genetic diagnosis by aCGH, and a consent to undergo a frozen‐thawed single transfer in a modified‐natural cycle (NC) or after hormonal endometrium preparation (AC_FET) Exclusion criteria: ovulation disorders, BMI > 29 kg/m2, endometriosis grade ≥ III according to the American Fertility Society criteria, and the use of testicular sperm for ICSI | |
| Interventions | Modified natural cycle FET (natural cycle with HCG trigger) Modified natural cycle: natural cycle was modified by triggering of ovulation using HCG injection then supporting luteal phase by progesterone injections Artificial cycle FET (HT + GnRHa suppression) GnRH agonist injection was started in preceding cycle to prevent follicular development Then estrogen tablets accompanied by progesterone injections were used | |
| Outcomes | Live birth rate per woman Miscarriage rate per woman Clinical pregnancy rate per woman Endometrial thickness | |
| Notes | ||
| Risk of bias | ||
| Bias | Authors' judgement | Support for judgement |
| Random sequence generation (selection bias) | Low risk | Described as, "Computer‐generated, not cancelled simple randomization" |
| Allocation concealment (selection bias) | Unclear risk | Not reported |
| Blinding (performance bias and detection bias) | Unclear risk | Blinding was not used due to the nature of the interventions; no information on outcome assessment; however, non‐blinding of outcome assessors may not have affected some of the outcome measures as they were objectively assessed. |
| Incomplete outcome data (attrition bias) | Low risk | Proportions of withdrawals and reasons for withdrawals or exclusion were fairly balanced between the two groups. |
| Selective reporting (reporting bias) | Unclear risk | There were discrepancies in the outcomes between pre‐specified and reported outcomes |
| Other bias | Unclear risk | Insuficient information to make a conclusive judgement |
| Methods | Multi‐centre, 2‐arm, parallel RCT (17 fertility clinics) Computer‐generated random sequence, unclear method of allocation concealment | |
| Participants | 959 women Inclusion criteria: women aged 18‐40 years, ovulatory cycle of 26‐35 days' duration and transferred frozen embryos originated from participant’s first three IVF or ICSI cycles Exclusion criteria: contraindications to estrogen or progesterone supplementation and anatomical uterine anomalies. Participants undergoing a gamete donor procedure (except those with a genetic disease) | |
| Interventions | Modified natural FET cycle (natural cycle, HCG triggered) Serial US scan from day 10‐12 of cycle. Once dominant follicle reached 16‐20 mm, HCG injection was given SC then FET day was decided Artificial FET cycle (HT FET) 2 mg oral estrogen was used from day 1 or 2 of cycle, scan was done after 12‐14 days Once endometrial thickness reached ≥ 8 mm and in the absence of a dominant follicle, FET was decided | |
| Outcomes | Live birth rate per woman Ongoing pregnancy rate per woman Clinical pregnancy rate per woman Cycle cancellation rate per woman Endometrial thickness | |
| Notes | ||
| Risk of bias | ||
| Bias | Authors' judgement | Support for judgement |
| Random sequence generation (selection bias) | Low risk | Authors described randomization as, "a web‐based randomization module using a computerized list was used" |
| Allocation concealment (selection bias) | Unclear risk | Not explicitly reported |
| Blinding (performance bias and detection bias) | Unclear risk | It was reported that "The nature of the treatment interventions precluded blinding of patients and treating physicians." No information on outcome assessment. However, non‐blinding of outcome assessors may not have affected some of the outcome measures as they were objectively assessed. |
| Incomplete outcome data (attrition bias) | High risk | Proportions of withdrawals were high and not balanced between the two groups (20% vs 27%). Data were not analyzed on true ITT basis for all outcomes |
| Selective reporting (reporting bias) | Low risk | All outcome measures were pre‐specified in the methods section |
| Other bias | Low risk | No other potential source of bias found |
| Methods | Single‐centre, 2‐arm, parallel RCT | |
| Participants | 70 women undergoing FET Inclusion criteria: not stated Exclusion criteria: not stated Baseline demographic and infertility characteristics similar in both groups | |
| Interventions | Natural cycle (36 women) Women did not receive any HT. When mature follicle reached a mean diameter of 18 mm and endometrial thickness > 8 mm, HCG 10,000 IU administrated and FET was done 4 days after HCG injection HT (34 women) Women received oral estradiol valerate 6 mg/d from day 2 of menstrual cycle and progesterone 100 mg IM in oil. When endometrial thickness reached > 8 mm, FET was done 72 hours after beginning of progesterone administration, and estradiol and progesterone were continued until the 12th gestational week | |
| Outcomes | Miscarriage per ET Ongoing pregnancy per ET Clinical pregnancy per ET | |
| Notes | Data reported as per 'embryo transfer' and number of embryos transferred was not equivalent to the number of women randomized | |
| Risk of bias | ||
| Bias | Authors' judgement | Support for judgement |
| Random sequence generation (selection bias) | Unclear risk | Not reported |
| Allocation concealment (selection bias) | Unclear risk | Not reported |
| Blinding (performance bias and detection bias) | Unclear risk | Not reported but non‐blinding of outcome assessors may not have affected some of the outcome measures as they were objectively assessed. |
| Incomplete outcome data (attrition bias) | Unclear risk | Proportions of withdrawals/losses to follow‐up and reasons for withdrawal not reported; analysis was per ET |
| Selective reporting (reporting bias) | Unclear risk | Insufficient information to make a conclusive judgement |
| Other bias | Low risk | Baseline demographic and infertility characteristics similar in both groups |
| Methods | Single‐centre, 3‐arm, parallel RCT | |
| Participants | 130 women (156 FET cycles) Baseline characteristics were similar in the 2 groups Infertility cause: variety of causes | |
| Interventions | HT group (44 women (52 cycles)) E2 was used in graduated dose (2 mg‐8 mg) until endometrial thickness was ≥ 8 mm Progesterone pessaries for 2 days before FET. E2 and progesterone continued until day 17 post FET Clomiphene group (55 women (67 cycles)) Low‐dose clomiphene HT plus GnRHa group (31 women (37 cycles)) GnRHa then E2 and progesterone (as per HT group) | |
| Outcomes | Clinical pregnancy rate per cycle Endometrial thickness | |
| Notes | The study was an abstract; however, the first author provided some study details but it was still not possible to obtain the pregnancy rate per woman; there were multiple cycles per woman and total number of cycles were not equivalent to number of women randomized. | |
| Risk of bias | ||
| Bias | Authors' judgement | Support for judgement |
| Random sequence generation (selection bias) | Unclear risk | Method used in generating sequence not reported |
| Allocation concealment (selection bias) | Low risk | Allocation was said to have been concealed using sequentially‐numbered, sealed, opaque envelopes |
| Blinding (performance bias and detection bias) | Unclear risk | Reported that intervention providers were blinded to endometrial preparation; however, participants and outcome assessors were not blinded. Non‐blinding of outcome assessors could affect some of the outcome measures |
| Incomplete outcome data (attrition bias) | Unclear risk | There were no reports on attrition or reasons for withdrawal |
| Selective reporting (reporting bias) | Unclear risk | There was insufficient information to determine whether outcomes were selectively reported |
| Other bias | Unclear risk | Insufficient information provided to assess possible sources of other bias |
| Methods | Single‐centre, 2‐arm, parallel, open‐label RCT | |
| Participants | 159 women undergoing FET cycle Inclusion criteria: women were eligible to participate if they were aged < 40 years at the time their embryos were frozen, had at least 1 blastocyst or 2 cleavage‐stage embryos in storage, had regular ovulatory cycles and ≤ 2 previous FET cycles Exclusion criteria: not reported Baseline demographic and infertility characteristics similar between the 2 groups | |
| Interventions | Natural cycle (80 women) Women had a US assessment between day 10 and day 13 of their cycle to confirm follicular growth and endometrial thickness, followed by additional US monitoring in subsequent days if necessary. On detection of LH surge, unit was informed and ET scheduled for up to 1 week later, depending on the stage of embryo development at freezing (i.e. day‐2 cleavage embryos, day‐3 cleavage embryos or day‐5 blastocysts). HT plus GnRHa (79 women) Women commenced daily nasal administration of the GnRHa nafarelin 400 mg twice daily on day 21 of their menstrual cycle until advised to stop, depending on stage of embryo, before the ET procedure. Once down‐regulation was confirmed, women started oral administration of E2 2 mg/d for endometrial preparation, which was increased by a step‐up protocol to 6 mg/d. Women commenced luteal support via vaginal administration of progesterone pessaries 400 mg twice daily according to the proposed day of FET; women with embryos cryopreserved at the cleavage day‐2 stage started pessaries 2 days before the transfer day; women with cryopreserved day‐3 embryos started pessaries 3 days before; and women with cryopreserved blastocysts started their pessaries 5 days before. ET was correspondingly scheduled for up to 1 week after the scan, depending on embryo stage | |
| Outcomes | Live birth per woman Clinical pregnancy rate per woman Multiple pregnancy rate per woman | |
| Notes | ||
| Risk of bias | ||
| Bias | Authors' judgement | Support for judgement |
| Random sequence generation (selection bias) | Low risk | Randomisation carried out using a minimisation algorithm |
| Allocation concealment (selection bias) | Unclear risk | No information reported on allocation concealment |
| Blinding (performance bias and detection bias) | Unclear risk | Open‐label RCT but non‐blinding of outcome assessors may not have affected some of the outcome measures as they were objectively assessed. |
| Incomplete outcome data (attrition bias) | Low risk | Data were analyzed on the basis of ITT, i.e. all women randomized were included in data analysis. |
| Selective reporting (reporting bias) | Low risk | Outcome measures were prespecified in the methods section. |
| Other bias | Low risk | Baseline demographic and infertility characteristics were similar between the 2 groups. |
| Methods | Single‐centre, 2‐arm parallel, open‐label RCT | |
| Participants | 472 women undergoing FET Inclusion criteria: women undergoing FET were eligible for the study when they had a regular cycle (between 21 and 35 days) and were aged 21‐45 years Exclusion criterion: FET after PGD Participants were similar in demographic and infertility characteristics at baseline | |
| Interventions | Natural cycle (235 women) Women underwent a first pelvic US and blood analysis around day 10‐day 12 of the menstrual cycle. HCG administered when the leading follicle had a mean diameter of ≥ 17 mm and endometrial thickness ≥ 7 mm with serum estradiol levels preferably 150 ng/L. HMG cycle (237 women) Women started SC injections of gonadotrophins (follitropin plus LH) on day 2 of the menstrual cycle. Starting dose of gonadotrophins (37 or 75 IU) determined by the treating clinician, based on woman's age, BMI, basal serum FSH (days 2‐5) and (if applicable) response to previous ovarian stimulation. On day 6 or 7 of the menstrual cycle, a first US and serum hormonal analysis (E2, progesterone, LH, FSH) performed. Based on these results, dose of gonadotrophins could be adjusted if needed. In both natural cycle FET and HMG FET cycle groups, the follicular response was monitored by regular vaginal US and serum hormonal analysis. ET was performed the same way in both groups. | |
| Outcomes | Live birth per ET Ongoing pregnancy per ET Clinical pregnancy per ET Endometrial thickness | |
| Notes | Outcome data reported as per 'embryo transfer cycle' (dichotomous data) or not clearly stated and there were multiple transfers per woman | |
| Risk of bias | ||
| Bias | Authors' judgement | Support for judgement |
| Random sequence generation (selection bias) | Unclear risk | Process of randomization not sufficiently explained. |
| Allocation concealment (selection bias) | Low risk | Allocations concealed in opaque sealed envelope. |
| Blinding (performance bias and detection bias) | Unclear risk | Described as an open‐label trial, thus both participants and personnel were aware of the treatment protocols. However, non‐blinding of outcome assessors may not have affected some of the outcome measures as they were objectively assessed. |
| Incomplete outcome data (attrition bias) | Unclear risk | Analysis was based on per cycle transferred. |
| Selective reporting (reporting bias) | Low risk | Outcome measures were prespecified in the methods section. |
| Other bias | Low risk | Participants similar in demographic and infertility characteristics at baseline. |
| Methods | 2‐arm RCT Undertaken January 2006‐March 2007 IVI Sevilla in Seville, Spain | |
| Participants | 119 women with functioning ovaries who were having FET in artificially prepared cycles | |
| Interventions | HT cycle (53 women) Endometrial preparation achieved using estradiol transdermal patches started on 2nd day of menstruation and used every other day with an initial dose of 100 mg/d and after 2 days increased to 200 mg/d. Progesterone 800 mg/d vaginally, starting after at least 11 days of transdermal estradiol HT plus GnRHa (66 women) In addition to HT, women received triptorelin depot 3.75 mg IM, 1 ampoule | |
| Outcomes | Miscarriage per woman | |
| Notes | Published as an abstract in the abstract book of the annual meeting of the American Society for Reproductive Medicine Emailed and wrote to the authors requesting study data. However, no reply received | |
| Risk of bias | ||
| Bias | Authors' judgement | Support for judgement |
| Random sequence generation (selection bias) | Unclear risk | Process used in random sequence generation not reported |
| Allocation concealment (selection bias) | Unclear risk | Not reported |
| Blinding (performance bias and detection bias) | Unclear risk | Not reported |
| Incomplete outcome data (attrition bias) | Unclear risk | No information reported on withdrawals/losses to follow‐up as well as reasons for withdrawals; not clear whether data were analyzed on the basis of ITT |
| Selective reporting (reporting bias) | Unclear risk | Insufficient information to make a conclusive judgement |
| Other bias | Unclear risk | Insufficient information to make a conclusive judgement |
| Methods | Single‐centre parallel RCT | |
| Participants | 106 women Inclusion criteria: women with functioning ovaries who had embryos originating from IVF or ICSI using their own oocytes Indication to freeze the embryos: not stated Number of transferred embryos per woman: HT group 3.3 ± 1.0, HT plus GnRHa group 3.4 ± 1.2 Baseline comparison: only women's ages were compared and were similar | |
| Interventions | HT plus GnRHa group (53 women) Long‐acting, triptorelin 3.75 mg IM (starting on cycle day 21 in regularly menstruating or starting on day 1 in oligomenorrhoeic women) E2: started ≥ 14 days of GnRHa once E2 level was < 100 pmol/L. Oral micronised E2 4 mg/d in 2 doses for about 17 days. On the day of E2 intake: if serum E2 was < 800 pmol/L or endometrial thickness < 8 mm, E2 dose was increased to 6 mg/d or 8 mg/d for 5‐10 days Progesterone: started once endometrial thickness was ≥ 8 mm. Vaginal micronised progesterone tablets, 300 mg, 3 times a day until 12th gestational week Cycle monitoring: by US scan aiming for endometrial thickness of ≥ 8 mm prior to FET HT group (53 women) E2: started in 1st day of menstrual cycle. Oral micronised E2 6 mg/d for 7 days then E2 dose was adjusted as in HT plus GnRHa group | |
| Outcomes | Clinical pregnancy rate per woman Ongoing pregnancy rate per woman Miscarriage rate per woman Cycle cancellation rate per woman Endometrial thickness on day of progesterone initiation | |
| Notes | ||
| Risk of bias | ||
| Bias | Authors' judgement | Support for judgement |
| Random sequence generation (selection bias) | Unclear risk | Procedure used for generating sequence was not reported |
| Allocation concealment (selection bias) | Unclear risk | Not reported whether allocation was concealed |
| Blinding (performance bias and detection bias) | Unclear risk | No information as to whether participants or personnel (or both) were blinded; non‐blinding of outcome assessor could have affected the validity of some of the outcomes measured. |
| Incomplete outcome data (attrition bias) | Low risk | Reason for attrition stated and was similar between the 2 groups, number of missing outcome data fairly balanced between the 2 groups (1 versus 0) |
| Selective reporting (reporting bias) | Low risk | Data reported on all the outcomes prespecified in the methods section |
| Other bias | Low risk | No other potential source of bias found |
| Methods | Single‐centre parallel RCT | |
| Participants | 209 women Baseline comparison: similar Infertility cause: endometriosis, tubal, male factor, mixed or unexplained Inclusion criteria: women with functioning ovaries who had embryos originating from IVF using their own oocytes Exclusion criteria: none Number of transferred embryos: in clomiphene group 1.8 ± 0.1, in HMG group 2.0 ± 0.1 | |
| Interventions | Clomiphene plus HMG (107 women) Oral clomiphene 100 mg started in days 2‐6 and HMG 150 μg/d IM from day 6 HMG (102 women) HMG 150 μg/d IM from day 2 In both groups from day 7 onwards, OI was done on individual basis Monitoring: by US and plasma E2 measurements Once leading follicle was ≥ 18 mm and E2 > 500 pg/mL, ovulation was induced using HCG 10,000 IU Day of HCG administration: in clomiphene plus HMG group 11.7 ± 0.2, in HMG group 10.8 ± 0.2 (P < 0.01) FET was performed 64 h post HCG administration or 48 h after LH surge. Luteal phase support: HCG 1500 IU IM on days 4, 7 and 10 post FET and progesterone vaginal suppositories 100 mg/d | |
| Outcomes | Live birth rate per woman Miscarriage rate per woman Multiple pregnancy rate per woman | |
| Notes | ||
| Risk of bias | ||
| Bias | Authors' judgement | Support for judgement |
| Random sequence generation (selection bias) | Unclear risk | Procedure used in random sequence generation not reported |
| Allocation concealment (selection bias) | Unclear risk | No report on allocation concealment |
| Blinding (performance bias and detection bias) | Unclear risk | Not reported whether participants or personnel (or both) were blinded |
| Incomplete outcome data (attrition bias) | Unclear risk | Insufficient information on attrition although tabular data were presented in a way that suggested possible inclusion of all randomized women in data analysis |
| Selective reporting (reporting bias) | Unclear risk | Data reported on outcomes prespecified in the methods section |
| Other bias | Unclear risk | Both groups were similar with respect to participants' characteristics, and number and quality of embryos transferred but HCG was administered on different days, although this was said not to have affected the outcome of the trial |
| Methods | Single‐centre, non‐blinded, open‐label RCT Undertaken April 2006‐December 2008 Power calculation: not stated | |
| Participants | 60 women undertaken FET following IVF or ICSI Inclusion criteria: women aged ≤ 38 years at embryo freezing time Exclusion criteria: use of testicular spermatozoa for ICSI, basal FSH ≥ 12 IU/L Women could participate in the study only once | |
| Interventions | HCG‐induced natural cycle FET (30 women) Spontaneous LH surge natural cycle FET (30 women) | |
| Outcomes | Number of monitoring visits at the clinic per cycle Implantation rate Clinical pregnancy rate Live birth rate | |
| Notes | ||
| Risk of bias | ||
| Bias | Authors' judgement | Support for judgement |
| Random sequence generation (selection bias) | Low risk | Quote: "Patients were randomized into two groups before entering the treatment cycle according to a computer‐generated list by using opaque sealed envelopes." |
| Allocation concealment (selection bias) | Low risk | Allocation was said to have been concealed in sealed, opaque envelopes. |
| Blinding (performance bias and detection bias) | Unclear risk | Reported that study was a non‐blinded open trial and this could have affected the validity of the entire processes leading to outcome measures; however, non‐blinding may not have affected some of the outcome measures as they were objectively assessed. |
| Incomplete outcome data (attrition bias) | High risk | Reasons for attrition stated and were found to be different between the 2 groups. Numbers of missing outcome data were not balanced between the groups. |
| Selective reporting (reporting bias) | Low risk | Data were reported on all outcome measures prespecified in the methods section. |
| Other bias | High risk | Women in both groups differed significantly in terms of age. |
| Methods | Single‐centre parallel RCT | |
| Participants | 175 women (194 FET cycles) Inclusion criteria: women with functioning ovaries either normo‐ovulatory or oligo‐ovulatory who had surplus embryos frozen following IVF or ICSI and women who had elective freezing of all embryos following OHSS Exclusion criteria: oocytes recipients Number of transferred embryos: HT group 1.77 ± 0.57, FSH group 1.66 ± 0.56 Baseline comparison: similar including age, day 3 FSH and % of ICSI cycles | |
| Interventions | HT group (88 women (94 cycles)) Oral E2 2 mg twice daily from day 1 of cycle. On day 9 or 10 of cycle started US and hormonal assay. Once endometrial thickness was > 7 mm started vaginal micronised progesterone (100 mg in morning and 200 mg in evening) and continued oral E2. If endometrial thickness was < 7 mm switched to vaginal E2 2 mg/d then as above. E2 and progesterone continued on same dose after FET and in pregnant women it was stopped at 8th gestational week FSH group (87 women (100 cycles)) Recombinant FSH 150 U on days 6, 8 and 10 of cycle. US and hormonal assay started on day 9 or 10 and until the endometrium was > 7 mm with a follicle of 16 mm‐20 mm then recombinant HCG was given Vaginal progesterone 100 mg in morning and 200 mg in evening was started in the day following HCG. FET was performed 48 h post progesterone initiation in embryos frozen on day 2 and 72 h in embryos frozen in day 3. Progesterone was continued till 8th gestational week | |
| Outcomes | Clinical pregnancy per cycle Cycle cancellation rate per woman Endometrial thickness | |
| Notes | Contacted first author but she was unable to provide more data, particularly the pregnancy rate per woman | |
| Risk of bias | ||
| Bias | Authors' judgement | Support for judgement |
| Random sequence generation (selection bias) | Unclear risk | Process involved in random sequence generation not reported |
| Allocation concealment (selection bias) | Unclear risk | Methods used in concealing the allocation not reported |
| Blinding (performance bias and detection bias) | Unclear risk | Not reported whether participants or personnel (or both) were blinded; non‐blinding of outcome assessors could have influenced some of the outcome measures. |
| Incomplete outcome data (attrition bias) | Unclear risk | Although reasons for missing data were the same in both groups, numbers of missing outcome data were not balanced between groups. |
| Selective reporting (reporting bias) | Low risk | All the prespecified outcome measures in the methods section were reported. |
| Other bias | Low risk | No other potential source of within‐study bias found |
ART: assisted reproductive technology; BMI: body mass index; E2: 17 β‐estradiol; ET: embryo transfer; FET: frozen‐thawed embryo transfer; FSH: follicle‐stimulating hormone; GnRHa: gonadotrophin releasing hormone agonist; HCG: human chorionic gonadotrophin; HT: hormone therapy; ICSI: intracytoplasmic sperm injection; IM: intramuscular; ITT: intention to treat; IU: international unit; IVF: in vitro fertilisation; LH: luteinising hormone; OHSS: ovarian hyperstimulation syndrome; OI: ovulation induction; PGD: preimplantation genetic diagnosis; RCT: randomized controlled trial; SC: subcutaneous; US: ultrasound.
Characteristics of excluded studies [ordered by study ID]
| Study | Reason for exclusion |
| Retrospective study Comparing natural cycle FET versus GnRHa plus E2 plus progesterone No difference between the 2 interventions | |
| Allocation to each intervention was not random but based on woman's choice. Comparing FET results following elective embryo cryopreservation in OHSS. FET done in natural cycle or in GnRHa plus oestrogen plus progesterone cycles. | |
| Uncontrolled study Case series of FET following E2 plus progesterone cycles | |
| Retrospective study Comparison of natural cycle FET, HMG ovulation induction FET and E2 plus progesterone FET | |
| Allocation to each intervention was not random Comparing results of natural cycle FET with GnRHa plus E2 plus progesterone FET No difference in outcomes between the 2 interventions | |
| Retrospective study Comparison of natural cycle FET, GnRHa plus oestrogen plus progesterone FET, HMG FET and natural cycle plus HCG FET No difference in outcomes between the 4 interventions | |
| Interventions not relevant: luteal phase support | |
| Allocation to each intervention was not random Comparing FET results in women who had IVF with women having FET using donated oocytes. IVF women with regular cycles were randomly assigned to natural cycle FET or GnRHa plus E2 plus progesterone FET cycles. IVF women with oligo‐ovulation were arbitrarily attributed to GnRHa plus E2 plus progesterone FET cycles. Women using embryos originating from donated oocytes had E2 plus progesterone FET cycles. | |
| Retrospective study Comparing natural cycle FET versus oestrogen plus progesterone FET No difference in outcomes between the 2 interventions | |
| Allocation to each intervention was not random Comparing natural cycle FET (in the first 6 months of the study) versus HMG FET (in the second 6 months) versus oestrogen plus progesterone FET (in the last 7 months) No difference in outcomes between the 3 interventions | |
| Interventions not relevant | |
| Interventions did not meet inclusion criteria: compared success rate of fresh IVF cycle with success rate of thawed‐frozen embryos both in a natural cycle regimen | |
| Retrospective study Assessing natural cycle FET versus GnRHa plus oestrogen plus progesterone FET No difference in outcomes between the 2 interventions | |
| A retrospective study Comparison of natural cycle FET versus oestrogen plus progesterone FET No difference in outcomes between the 2 interventions | |
| Retrospective study. Comparison of natural cycle FET versus oestrogen plus progesterone FET A trend of higher pregnancy rate in natural cycle FET was observed | |
| Interventions not reported | |
| A quasi‐randomised study: allocation of intervention was based on presence or absence of spontaneous ovulation Natural cycle FET was allocated to women with a history of regular cycles while ovulation induction FET was allocated to women with anovulation history. Ovulation induction method was GnRHa followed by HMG. A trend towards fewer cancelled cycles was seen in the HMG FET group. | |
| Uncontrolled study Case series of FET following E2 plus progesterone cycles | |
| Retrospective study Comparison of oestrogen plus progesterone FET versus natural cycle FET No difference in outcomes between the 2 interventions | |
| Number of women randomized at baseline to each treatment group or number of women analyzed in each treatment group not reported | |
| Uncontrolled study Case series of FET following E2 plus progesterone cycles | |
| Uncontrolled study Case series of FET following E2 plus progesterone cycles | |
| Non‐randomised study as allocation of intervention was based on presence or absence of spontaneous ovulation Ovulatory women had natural cycle FET while anovulatory women had oestrogen plus progesterone FET A significant higher live birth rate and a trend for higher clinical pregnancy rate in the natural cycle FET | |
| Retrospective study Comparison of natural cycle FET versus HCG‐induced ovulation cycle FET No difference in outcomes between the 2 interventions | |
| Uncontrolled study Case series of FET following GnRHa plus E2 plus progesterone cycles | |
| Retrospective study Comparison of natural cycle FET with oestrogen plus progesterone FET Significantly higher pregnancy rates in natural cycle FET | |
| Non‐randomised study as allocation of intervention was based on presence or absence of spontaneous ovulation Ovulatory women had natural cycle FET while anovulatory women had E2 plus progesterone FET No difference in outcomes between the 2 interventions | |
| Interventions not relevant. Natural cycle versus FSH/HCG/progesterone | |
| Non‐randomised study as women were given the choice of which type of FET cycle regimen to have Comparison of natural cycles FET with E2 plus progesterone FET No difference in outcomes between the 2 interventions | |
| Retrospective study Comparing natural cycle FET versus GnRHa plus E2 plus progesterone FET No difference in outcomes between the 2 interventions | |
| Uncontrolled retrospective study Analysing results of E2 plus progesterone FET | |
| Semi‐randomised study (quasi‐randomised) as women with irregular cycles, who had inadequate luteal function, women with amenorrhoea or oligo‐menorrhoea and women who were not pregnant in previous natural cycle FET were allocated to the GnRHa plus E2 plus progesterone intervention without randomization. Women having FET for first time and who had regular cycles were alternately allocated to either of the 2 interventions. Comparing GnRHa plus E2 plus progesterone FET with natural cycle FET No difference in outcomes between the 2 interventions except in women with oligomenorrhoea | |
| Non‐randomised study as allocation of intervention was based on past history of ovulation disorder. Prospective comparison of oestrogen plus progesterone FET versus natural cycle FET A trend towards higher pregnancy rate was noted in oestrogen plus progesterone FET. | |
| Not an RCT | |
| Case series FET following E2 plus progesterone preparation | |
| Not an RCT | |
| Non‐randomised study as allocation of each type of intervention was based on presence or absence of regular ovulation. Women experiencing oligo‐ovulation were alternately offered ovulation induction or E2 plus progesterone endometrial preparation cycle. Prospectively comparing natural cycle FET versus GnRHa plus E2 plus progesterone FET versus GnRHa plus HMG FET No difference in outcomes among the 3 interventions | |
| Interventions not relevant | |
| Non‐randomised controlled study as intervention allocation was based on couple's choice Comparison of natural cycle FET with GnRHa plus oestrogen plus progesterone FET No difference in outcomes between the 2 interventions | |
| Retrospective study Comparing of GnRHa plus transdermal oestrogen plus progesterone FET versus GnRHa plus oral oestrogen plus progesterone FET versus oral oestrogen plus progesterone FET | |
| Retrospective controlled study Comparison of natural cycle FET with E2 plus progesterone FET No difference in outcomes between the 2 interventions | |
| Interventions not relevant: administered different interventions within each treatment groups |
E2: 17 β‐estradiol; FET: frozen‐thawed embryo transfer; GnRHa: gonadotrophin releasing hormone agonist; HCH: human chorionic gonadotrophin; HMG: human menopausal gonadotrophin; IVF: in vitro fertilisation; OHSS: ovarian hyperstimulation syndrome; RCT: randomized controlled trial
Characteristics of ongoing studies [ordered by study ID]
| Trial name or title | The effects of two endometrium preparation protocols in frozen‐thawed embryo transfer in women with irregular cycles |
| Methods | Randomised Parallel assignment Single‐blind (participant) |
| Participants | 670 women 18‐40 years with irregular menstruation and > 3 frozen embryos |
| Interventions | Letrozole and HCG vs estradiol and progesterone |
| Outcomes | Primary: ongoing pregnancy rate |
| Starting date | January 2012, last data collection date January 2015 |
| Contact information | Zhang Qingxue, Doctor: tel 13602797433, Memorial Hospital of Sun Yat‐Sen University |
| Notes |
| Trial name or title | A randomized controlled comparison of spontaneous natural cycles and human chorionic gonadotrophin‐induced natural cycles in frozen‐thawed embryos transfer |
| Methods | Randomised Parallel assignment Single‐blind (outcomes assessor) |
| Participants | 300 women aged 19‐43 years Regular menstrual cycles ranging from 21‐35 days with not more than 4 days variation between cycles Undergoing FET in natural cycles Normal uterine cavity as shown on saline sonogram performed before the IVF cycle or normal uterine cavity shown on pelvic scanning during the stimulated IVF cycle Endometrial thickness ≥ 8 mm in both stimulated IVF and FET cycles |
| Interventions | Daily monitoring of LH and E2 vs HCG‐induced natural cycle |
| Outcomes | Primary: ongoing pregnancy rate (defined as the number of viable pregnancies beyond 10‐12 weeks' gestation per transfer cycle) |
| Starting date | October 2014, last data collection date December 2015 |
| Contact information | Vivian CY Lee, University of Hong Kong |
| Notes | No email address provided |
| Trial name or title | Frozen embryo transfer in natural and hormonal replacement cycles |
| Methods | Randomised, open‐label |
| Participants | 460 women 20‐37 years with regular menstruation cycles; undergoing long protocol; BMI ≤ 30 kg/m2; undergoing frozen embryo transfer for the first time |
| Interventions | Natural cycle (with or without HCG for ovulation induction) or hormonal cycle (with or without administration of GnRHa) or injection of GnRHa (Superfact) at a SC daily dose of 0.5 mg or hormonal group without GnRHa, endometrial preparation with daily administration of 6 mg estradiol valerate |
| Outcomes | Primary: clinical pregnancy rate |
| Starting date | September 2012, completion date November 2015 |
| Contact information | Dr Nasser Aghdami [email protected] |
| Notes |
| Trial name or title | Evaluation the effect of intrauterine injection of human chorionic gonadotrophin injection (HCG) before frozen embryo transfer on implantation and clinical pregnancy rates per cycle, phase 3 randomized double blinded clinical trial |
| Methods | Randomised, participant and investigator blinded |
| Participants | 150 women 19‐39 years, with history of one fresh embryo transfer failure, primary infertility, and at least 1 embryo with excellent quality |
| Interventions | ET ET + intra uterine injection of tissue culture medium containing HCG ET + intra uterine injection of tissue culture medium without HCG |
| Outcomes | Primary: implantation rate Secondary: pregnancy loss; early miscarriage rate; late miscarriage rate |
| Starting date | January 2015, completion date July 2017 |
| Contact information | Dr Nasser Aghdami, [email protected] |
| Notes |
| Trial name or title | Comparison of the number of visits and the quality of life versus natural cycle in stimulated cycle before frozen embryo transfer |
| Methods | Randomised, open‐label |
| Participants | 124 women with regular cycles 26‐35 days, support in IVF or ICSI |
| Interventions | Natural cycle vs moderate ovarian stimulation |
| Outcomes | Primary: number of visits for clinical examination, ultrasound and hormonal dosage required to monitor ovulation in both groups |
| Starting date | May 2015, completion date March 2018 |
| Contact information | Maxime Brussieux, [email protected] |
| Notes |
E2: 17 β‐estradio; ET: embryo transfer; FET: frozen‐thawed embryo transfer; GnRHa: gonadotrophin releasing hormone agonist; HCG: human chorionic gonadotrophin; ICSI: intracytoplasmic sperm injection; IVF: in vitro fertilisation; LH: luteinising hormone;
Data and analyses
| Outcome or subgroup title | No. of studies | No. of participants | Statistical method | Effect size |
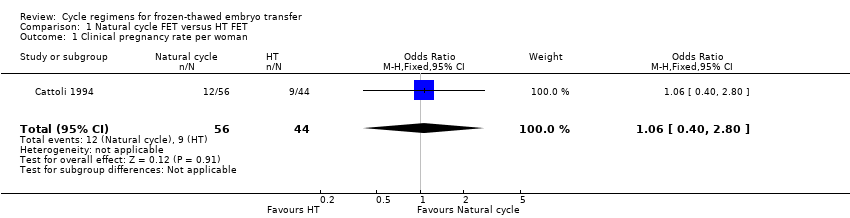
| 1 Clinical pregnancy rate per woman Show forest plot | 1 | 100 | Odds Ratio (M‐H, Fixed, 95% CI) | 1.06 [0.40, 2.80] |
| Analysis 1.1  Comparison 1 Natural cycle FET versus HT FET, Outcome 1 Clinical pregnancy rate per woman. | ||||
| 2 Multiple pregnancy rate per woman Show forest plot | 1 | 21 | Odds Ratio (M‐H, Fixed, 95% CI) | 2.48 [0.09, 68.14] |
| Analysis 1.2 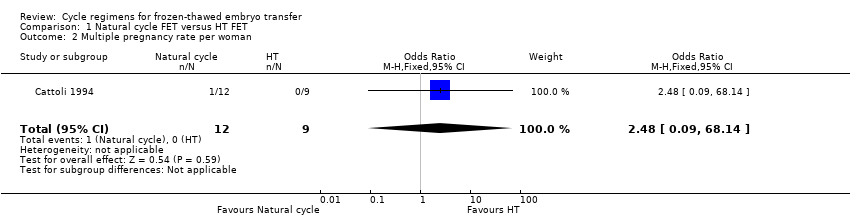 Comparison 1 Natural cycle FET versus HT FET, Outcome 2 Multiple pregnancy rate per woman. | ||||
| Outcome or subgroup title | No. of studies | No. of participants | Statistical method | Effect size |
| 1 Live birth rate per woman Show forest plot | 1 | 159 | Odds Ratio (M‐H, Fixed, 95% CI) | 0.77 [0.39, 1.53] |
| Analysis 2.1  Comparison 2 Natural cycle FET versus HT + GnRHa FET, Outcome 1 Live birth rate per woman. | ||||
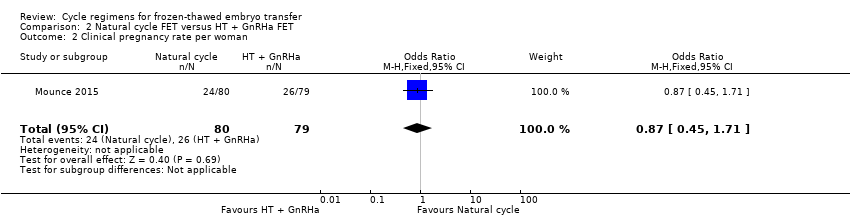
| 2 Clinical pregnancy rate per woman Show forest plot | 1 | 159 | Odds Ratio (M‐H, Fixed, 95% CI) | 0.87 [0.45, 1.71] |
| Analysis 2.2  Comparison 2 Natural cycle FET versus HT + GnRHa FET, Outcome 2 Clinical pregnancy rate per woman. | ||||
| 3 Multiple pregnancy rate per woman Show forest plot | 1 | 159 | Odds Ratio (M‐H, Fixed, 95% CI) | 0.58 [0.13, 2.50] |
| Analysis 2.3 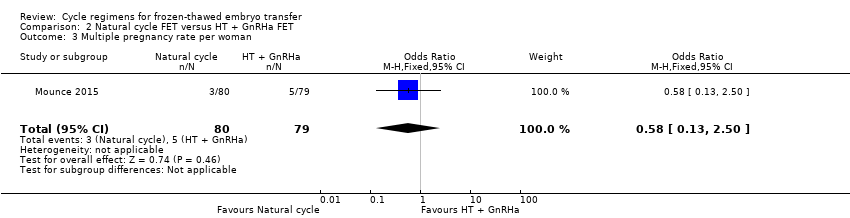 Comparison 2 Natural cycle FET versus HT + GnRHa FET, Outcome 3 Multiple pregnancy rate per woman. | ||||
| Outcome or subgroup title | No. of studies | No. of participants | Statistical method | Effect size |
| 1 Live birth rate per woman Show forest plot | 1 | 60 | Odds Ratio (M‐H, Fixed, 95% CI) | 0.55 [0.16, 1.93] |
| Analysis 3.1  Comparison 3 Natural cycle FET versus modified natural cycle FET (HCG trigger), Outcome 1 Live birth rate per woman. | ||||
| 2 Miscarriage rate per woman Show forest plot | 1 | 168 | Odds Ratio (M‐H, Fixed, 95% CI) | 0.20 [0.01, 4.13] |
| Analysis 3.2  Comparison 3 Natural cycle FET versus modified natural cycle FET (HCG trigger), Outcome 2 Miscarriage rate per woman. | ||||
| 3 Ongoing pregnancy rate per woman Show forest plot | 1 | 168 | Odds Ratio (M‐H, Fixed, 95% CI) | 2.44 [1.03, 5.76] |
| Analysis 3.3  Comparison 3 Natural cycle FET versus modified natural cycle FET (HCG trigger), Outcome 3 Ongoing pregnancy rate per woman. | ||||
| 4 Clinical pregnancy rate per woman Show forest plot | 1 | 60 | Odds Ratio (M‐H, Fixed, 95% CI) | 1.0 [0.32, 3.14] |
| Analysis 3.4  Comparison 3 Natural cycle FET versus modified natural cycle FET (HCG trigger), Outcome 4 Clinical pregnancy rate per woman. | ||||
| Outcome or subgroup title | No. of studies | No. of participants | Statistical method | Effect size |
| 1 Live birth rate per woman Show forest plot | 1 | 959 | Odds Ratio (M‐H, Fixed, 95% CI) | 1.34 [0.88, 2.05] |
| Analysis 4.1  Comparison 4 Modified natural cycle FET (HCG trigger) versus HT FET, Outcome 1 Live birth rate per woman. | ||||
| 2 Ongoing pregnancy rate per woman Show forest plot | 1 | 959 | Odds Ratio (M‐H, Fixed, 95% CI) | 1.21 [0.80, 1.83] |
| Analysis 4.2  Comparison 4 Modified natural cycle FET (HCG trigger) versus HT FET, Outcome 2 Ongoing pregnancy rate per woman. | ||||
| 3 Clinical pregnancy rate per woman Show forest plot | 1 | 959 | Odds Ratio (M‐H, Fixed, 95% CI) | 1.22 [0.87, 1.70] |
| Analysis 4.3 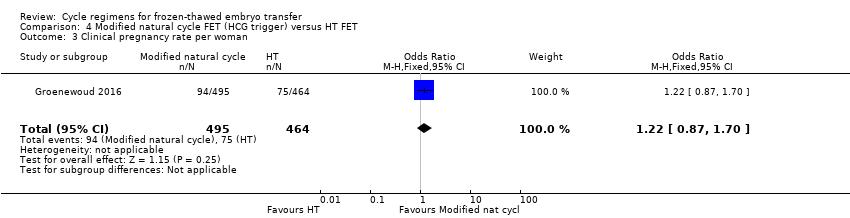 Comparison 4 Modified natural cycle FET (HCG trigger) versus HT FET, Outcome 3 Clinical pregnancy rate per woman. | ||||
| 4 Cycle cancellation rate per woman Show forest plot | 1 | 959 | Odds Ratio (M‐H, Fixed, 95% CI) | 0.70 [0.52, 0.95] |
| Analysis 4.4  Comparison 4 Modified natural cycle FET (HCG trigger) versus HT FET, Outcome 4 Cycle cancellation rate per woman. | ||||
| 5 Endometrial thickness Show forest plot | 1 | 959 | Mean Difference (IV, Fixed, 95% CI) | 0.10 [‐0.13, 0.33] |
| Analysis 4.5  Comparison 4 Modified natural cycle FET (HCG trigger) versus HT FET, Outcome 5 Endometrial thickness. | ||||
| Outcome or subgroup title | No. of studies | No. of participants | Statistical method | Effect size |
| 1 Live birth rate per woman Show forest plot | 1 | 236 | Odds Ratio (M‐H, Fixed, 95% CI) | 1.11 [0.66, 1.87] |
| Analysis 5.1 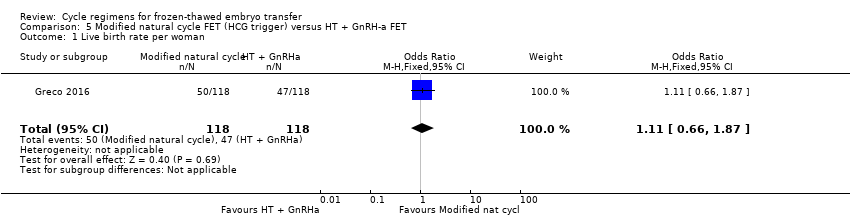 Comparison 5 Modified natural cycle FET (HCG trigger) versus HT + GnRH‐a FET, Outcome 1 Live birth rate per woman. | ||||
| 2 Miscarriage rate per woman Show forest plot | 1 | 236 | Odds Ratio (M‐H, Fixed, 95% CI) | 0.74 [0.25, 2.19] |
| Analysis 5.2  Comparison 5 Modified natural cycle FET (HCG trigger) versus HT + GnRH‐a FET, Outcome 2 Miscarriage rate per woman. | ||||
| 3 Clinical pregnancy rate per woman Show forest plot | 1 | 236 | Odds Ratio (M‐H, Fixed, 95% CI) | 1.07 [0.64, 1.78] |
| Analysis 5.3 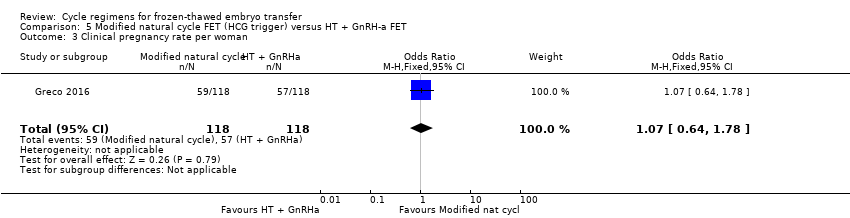 Comparison 5 Modified natural cycle FET (HCG trigger) versus HT + GnRH‐a FET, Outcome 3 Clinical pregnancy rate per woman. | ||||
| 4 Endometrial thickness Show forest plot | 1 | 236 | Mean Difference (IV, Fixed, 95% CI) | ‐0.20 [‐0.54, 0.14] |
| Analysis 5.4 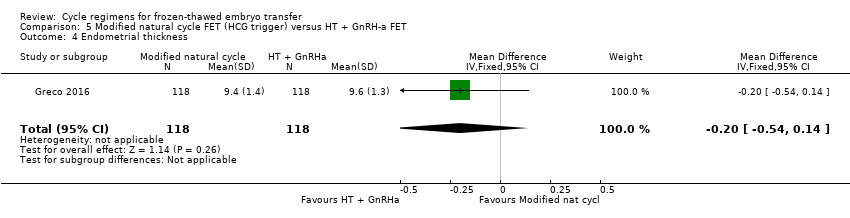 Comparison 5 Modified natural cycle FET (HCG trigger) versus HT + GnRH‐a FET, Outcome 4 Endometrial thickness. | ||||
| Outcome or subgroup title | No. of studies | No. of participants | Statistical method | Effect size |
| 1 Live birth rate per woman Show forest plot | 1 | 75 | Odds Ratio (M‐H, Fixed, 95% CI) | 0.10 [0.04, 0.30] |
| Analysis 6.1  Comparison 6 HT FET versus HT + GnRH‐a, Outcome 1 Live birth rate per woman. | ||||
| 2 Miscarriage rate per woman Show forest plot | 6 | 991 | Odds Ratio (M‐H, Fixed, 95% CI) | 0.64 [0.37, 1.12] |
| Analysis 6.2  Comparison 6 HT FET versus HT + GnRH‐a, Outcome 2 Miscarriage rate per woman. | ||||
| 3 Ongoing pregnancy rate per woman Show forest plot | 1 | 106 | Odds Ratio (M‐H, Fixed, 95% CI) | 1.72 [0.61, 4.85] |
| Analysis 6.3  Comparison 6 HT FET versus HT + GnRH‐a, Outcome 3 Ongoing pregnancy rate per woman. | ||||
| 4 Clinical pregnancy rate per woman Show forest plot | 5 | 872 | Odds Ratio (M‐H, Fixed, 95% CI) | 0.90 [0.65, 1.25] |
| Analysis 6.4  Comparison 6 HT FET versus HT + GnRH‐a, Outcome 4 Clinical pregnancy rate per woman. | ||||
| 5 Cycle cancellation rate per woman Show forest plot | 3 | 636 | Odds Ratio (M‐H, Fixed, 95% CI) | 2.73 [0.79, 9.38] |
| Analysis 6.5  Comparison 6 HT FET versus HT + GnRH‐a, Outcome 5 Cycle cancellation rate per woman. | ||||
| 6 Endometrial thickness Show forest plot | 3 | 625 | Mean Difference (IV, Fixed, 95% CI) | ‐0.16 [‐0.41, 0.09] |
| Analysis 6.6  Comparison 6 HT FET versus HT + GnRH‐a, Outcome 6 Endometrial thickness. | ||||
| Outcome or subgroup title | No. of studies | No. of participants | Statistical method | Effect size |
| 1 Clinical pregnancy rate per woman Show forest plot | 1 | 175 | Odds Ratio (M‐H, Fixed, 95% CI) | 1.09 [0.45, 2.62] |
| Analysis 7.1  Comparison 7 HT FET versus FSH FET, Outcome 1 Clinical pregnancy rate per woman. | ||||
| 2 Cycle cancellation rate per woman Show forest plot | 1 | 175 | Odds Ratio (M‐H, Fixed, 95% CI) | 0.99 [0.49, 2.00] |
| Analysis 7.2 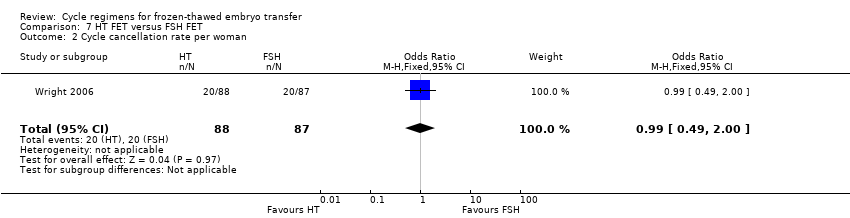 Comparison 7 HT FET versus FSH FET, Outcome 2 Cycle cancellation rate per woman. | ||||
| 3 Endometrial thickness Show forest plot | 1 | 175 | Mean Difference (IV, Fixed, 95% CI) | 0.0 [‐0.31, 0.31] |
| Analysis 7.3 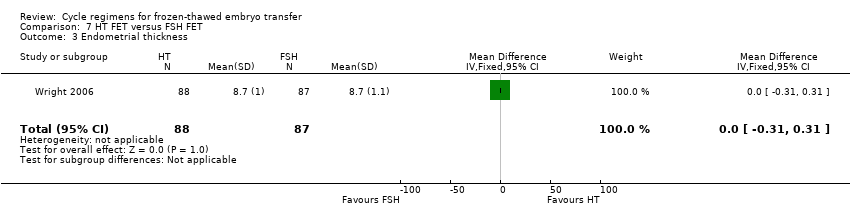 Comparison 7 HT FET versus FSH FET, Outcome 3 Endometrial thickness. | ||||
| Outcome or subgroup title | No. of studies | No. of participants | Statistical method | Effect size |
| 1 Live birth rate per woman Show forest plot | 1 | 209 | Odds Ratio (M‐H, Fixed, 95% CI) | 2.49 [1.07, 5.80] |
| Analysis 8.1 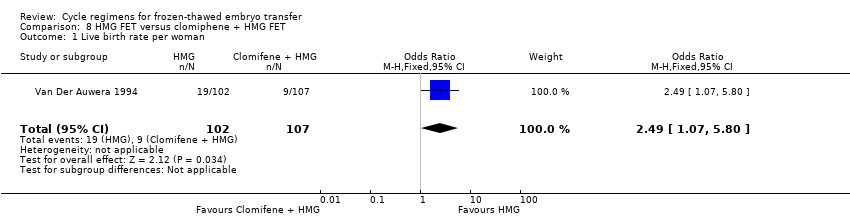 Comparison 8 HMG FET versus clomiphene + HMG FET, Outcome 1 Live birth rate per woman. | ||||
| 2 Miscarriage rate per woman Show forest plot | 1 | 209 | Odds Ratio (M‐H, Fixed, 95% CI) | 1.33 [0.35, 5.09] |
| Analysis 8.2 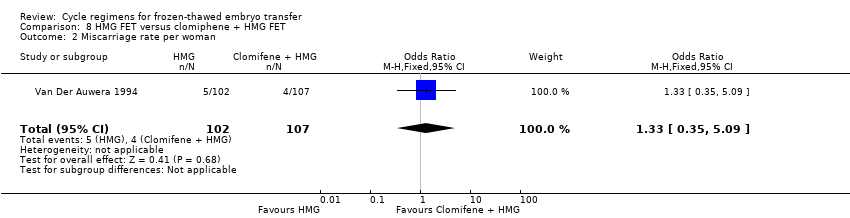 Comparison 8 HMG FET versus clomiphene + HMG FET, Outcome 2 Miscarriage rate per woman. | ||||
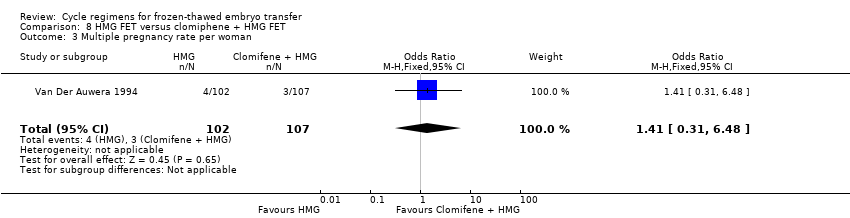
| 3 Multiple pregnancy rate per woman Show forest plot | 1 | 209 | Odds Ratio (M‐H, Fixed, 95% CI) | 1.41 [0.31, 6.48] |
| Analysis 8.3  Comparison 8 HMG FET versus clomiphene + HMG FET, Outcome 3 Multiple pregnancy rate per woman. | ||||

Study flow diagram

Risk of bias graph: review authors' judgements about each risk of bias item presented as percentages across all included studies

Risk of bias summary: review authors' judgements about each risk of bias item for each included study
Comparison 1 Natural cycle FET versus HT FET, Outcome 1 Clinical pregnancy rate per woman.

Comparison 1 Natural cycle FET versus HT FET, Outcome 2 Multiple pregnancy rate per woman.

Comparison 2 Natural cycle FET versus HT + GnRHa FET, Outcome 1 Live birth rate per woman.
Comparison 2 Natural cycle FET versus HT + GnRHa FET, Outcome 2 Clinical pregnancy rate per woman.

Comparison 2 Natural cycle FET versus HT + GnRHa FET, Outcome 3 Multiple pregnancy rate per woman.

Comparison 3 Natural cycle FET versus modified natural cycle FET (HCG trigger), Outcome 1 Live birth rate per woman.

Comparison 3 Natural cycle FET versus modified natural cycle FET (HCG trigger), Outcome 2 Miscarriage rate per woman.

Comparison 3 Natural cycle FET versus modified natural cycle FET (HCG trigger), Outcome 3 Ongoing pregnancy rate per woman.

Comparison 3 Natural cycle FET versus modified natural cycle FET (HCG trigger), Outcome 4 Clinical pregnancy rate per woman.
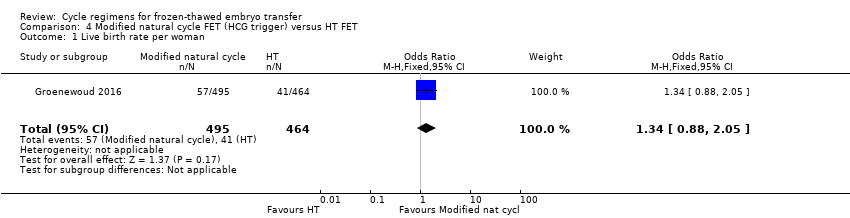
Comparison 4 Modified natural cycle FET (HCG trigger) versus HT FET, Outcome 1 Live birth rate per woman.

Comparison 4 Modified natural cycle FET (HCG trigger) versus HT FET, Outcome 2 Ongoing pregnancy rate per woman.

Comparison 4 Modified natural cycle FET (HCG trigger) versus HT FET, Outcome 3 Clinical pregnancy rate per woman.

Comparison 4 Modified natural cycle FET (HCG trigger) versus HT FET, Outcome 4 Cycle cancellation rate per woman.
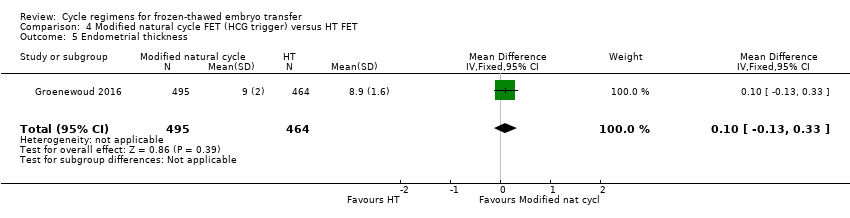
Comparison 4 Modified natural cycle FET (HCG trigger) versus HT FET, Outcome 5 Endometrial thickness.

Comparison 5 Modified natural cycle FET (HCG trigger) versus HT + GnRH‐a FET, Outcome 1 Live birth rate per woman.

Comparison 5 Modified natural cycle FET (HCG trigger) versus HT + GnRH‐a FET, Outcome 2 Miscarriage rate per woman.

Comparison 5 Modified natural cycle FET (HCG trigger) versus HT + GnRH‐a FET, Outcome 3 Clinical pregnancy rate per woman.

Comparison 5 Modified natural cycle FET (HCG trigger) versus HT + GnRH‐a FET, Outcome 4 Endometrial thickness.

Comparison 6 HT FET versus HT + GnRH‐a, Outcome 1 Live birth rate per woman.
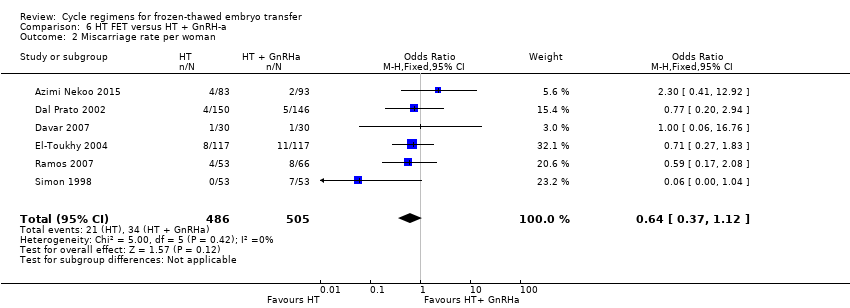
Comparison 6 HT FET versus HT + GnRH‐a, Outcome 2 Miscarriage rate per woman.
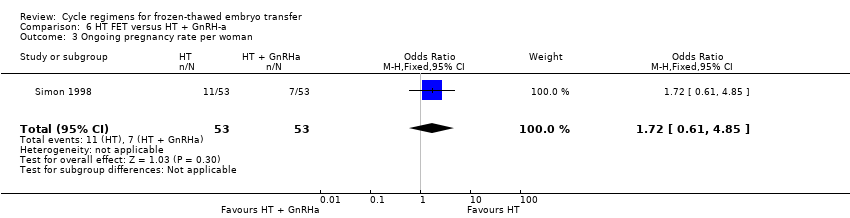
Comparison 6 HT FET versus HT + GnRH‐a, Outcome 3 Ongoing pregnancy rate per woman.
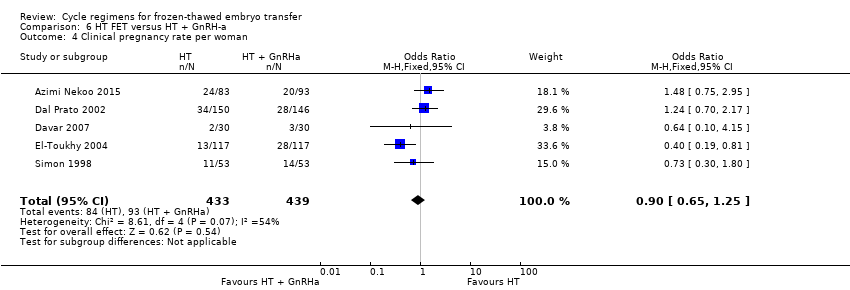
Comparison 6 HT FET versus HT + GnRH‐a, Outcome 4 Clinical pregnancy rate per woman.

Comparison 6 HT FET versus HT + GnRH‐a, Outcome 5 Cycle cancellation rate per woman.
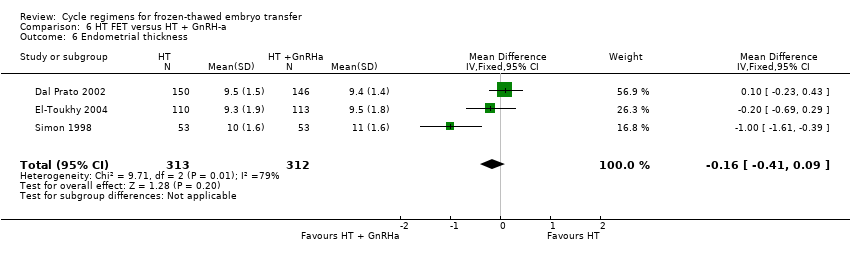
Comparison 6 HT FET versus HT + GnRH‐a, Outcome 6 Endometrial thickness.

Comparison 7 HT FET versus FSH FET, Outcome 1 Clinical pregnancy rate per woman.

Comparison 7 HT FET versus FSH FET, Outcome 2 Cycle cancellation rate per woman.

Comparison 7 HT FET versus FSH FET, Outcome 3 Endometrial thickness.

Comparison 8 HMG FET versus clomiphene + HMG FET, Outcome 1 Live birth rate per woman.

Comparison 8 HMG FET versus clomiphene + HMG FET, Outcome 2 Miscarriage rate per woman.
Comparison 8 HMG FET versus clomiphene + HMG FET, Outcome 3 Multiple pregnancy rate per woman.
| Natural cycle FET versus HT FET | ||||||
| Population: subfertile women | ||||||
| Outcomes | Illustrative comparative risks* (95% CI) | Relative effect | No of participants | Quality of the evidence | Comments | |
| Assumed risk | Corresponding risk | |||||
| HT FET | Natural cycle FET | |||||
| Live birth rate per woman | No data available | Not estimable | ‐ | |||
| Miscarriage rate per woman | No data available | Not estimable | ‐ | |||
| Ongoing pregnancy rate per woman | No data available | Not estimable | ‐ | |||
| Multiple pregnancy rate per woman | See comment | OR 2.48 | 21 | ⊕⊝⊝⊝ | No events in the control group | |
| *The basis for the assumed risk (e.g. the median control group risk across studies) is provided in footnotes. The corresponding risk (and its 95% confidence interval) is based on the assumed risk in the comparison group and the relative effect of the intervention (and its 95% CI). | ||||||
| GRADE Working Group grades of evidence | ||||||
| 1Downgraded one level for serious risk of bias: study at unclear risk of bias in all domains. | ||||||
| Natural cycle FET versus HT + GnRHa suppression FET | ||||||
| Population: subfertile women | ||||||
| Outcomes | Illustrative comparative risks* (95% CI) | Relative effect | No of participants | Quality of the evidence | Comments | |
| Assumed risk | Corresponding risk | |||||
| HT + GnRHa FET | Natural cycle FET | |||||
| Live birth rate per woman | 316 per 1000 | 262 per 1000 | OR 0.77 | 159 | ⊕⊕⊝⊝ | Only 46 events |
| Miscarriage rate per woman | No data available | Not estimable | ‐ | |||
| Ongoing pregnancy rate per woman | No data available | Not estimable | ‐ | |||
| Multiple pregnancy rate per woman | 63 per 1000 | 38 per 1000 | OR 0.58 | 159 | ⊕⊕⊝⊝ | Only 8 events |
| *The basis for the assumed risk (e.g. the median control group risk across studies) is provided in footnotes. The corresponding risk (and its 95% confidence interval) is based on the assumed risk in the comparison group and the relative effect of the intervention (and its 95% CI). | ||||||
| GRADE Working Group grades of evidence | ||||||
| 1Downgraded two levels due to very serious imprecision: single study, few events, confidence interval compatible with benefit in either group or with no effect. | ||||||
| Natural cycle FET versus other regimens for primary or secondary subfertility | ||||||
| Population: subfertile women | ||||||
| Outcomes | Illustrative comparative risks* (95% CI) | Relative effect | No of participants | Quality of the evidence | Comments | |
| Assumed risk | Corresponding risk | |||||
| Modified natural cycle FET (HCG trigger) | Natural cycle FET | |||||
| Live birth rate per woman | 267 per 1000 | 167 per 1000 | OR 0.55 | 60 | ⊕⊝⊝⊝ | Only 13 events |
| Miscarriage rate per woman | 24 per 1000 | 5 per 1000 | OR 0.20 | 168 | ⊕⊝⊝⊝ | Only 2 events |
| Ongoing pregnancy rate per woman | 107 per 1000 | 226 per 1000 | OR 2.44 | 168 | ⊕⊝⊝⊝ | Only 28 events |
| Multiple pregnancy per woman | No data available | |||||
| *The basis for the assumed risk is the mean control group risk across studies. The corresponding risk (and its 95% confidence interval) is based on the assumed risk in the comparison group and the relative effect of the intervention (and its 95% CI). | ||||||
| GRADE Working Group grades of evidence | ||||||
| 1One other study compared natural cycle FET versus natural cycle plus human menopausal gonadotrophin, but did not report any per‐woman data. | ||||||
| Modified natural cycle FET (HCG trigger) versus HT FET | ||||||
| Population: subfertile women | ||||||
| Outcomes | Illustrative comparative risks* (95% CI) | Relative effect | No of participants | Quality of the evidence | Comments | |
| Assumed risk | Corresponding risk | |||||
| HT FET | Modified natural cycle FET (HCG trigger) | |||||
| Live birth rate per woman | 88 per 1000 | 114 per 1000 | OR 1.34 | 959 | ⊕⊕⊝⊝ | |
| Miscarriage rate per woman | No data available | Not estimable | ‐ | |||
| Ongoing pregnancy rate per woman | 97 per 1000 | 115 per 1000 | OR 1.21 | 959 | ⊕⊕⊝⊝ | |
| Multiple pregnancy rate per woman | No data available | Not estimable | ‐ | |||
| *The basis for the assumed risk (e.g. the median control group risk across studies) is provided in footnotes. The corresponding risk (and its 95% confidence interval) is based on the assumed risk in the comparison group and the relative effect of the intervention (and its 95% CI). | ||||||
| GRADE Working Group grades of evidence | ||||||
| 1Downgraded one level due to serious risk of bias: high attrition rate, unclear risk of allocation concealment | ||||||
| Modified natural cycle FET (HCG trigger) versus HT + GnRHa FET | ||||||
| Population: subfertile women | ||||||
| Outcomes | Illustrative comparative risks* (95% CI) | Relative effect | No of participants | Quality of the evidence | Comments | |
| Assumed risk | Corresponding risk | |||||
| HT + GnRHa FET | Modified natural cycle FET (HCG trigger) | |||||
| Live birth rate per woman | 398 per 1000 | 423 per 1000 | OR 1.11 | 236 | ⊕⊕⊝⊝ | |
| Miscarriage rate per woman | 68 per 1000 | 51 per 1000 | OR 0.74 | 236 | ⊕⊕⊝⊝ | |
| Ongoing pregnancy rate | No data available | Not estimable | ‐ | |||
| Multiple pregnancy rate per woman | No data available | Not estimable | ‐ | |||
| *The basis for the assumed risk is the mean control group risk across studies. The corresponding risk (and its 95% confidence interval) is based on the assumed risk in the comparison group and the relative effect of the intervention (and its 95% CI). | ||||||
| GRADE Working Group grades of evidence | ||||||
| 1Downgraded one level due to serious risk of bias: study at unclear risk of in most domains of bias (allocation concealment, blinding, selective reporting and other sources of bias). | ||||||
| HT FET versus other regimens for primary or secondary subfertility | ||||||
| Population: women with primary or secondary subfertility | ||||||
| Outcomes | Illustrative comparative risks* (95% CI) | Relative effect | No of participants | Quality of the evidence | Comments | |
| Assumed risk | Corresponding risk | |||||
| HT + GnRHa FET | HT FET | |||||
| Live birth rate per woman | 742 per 1000 | 223 per 1000 | OR 0.10 | 75 | ⊕⊕⊝⊝ | Only 33 events |
| Miscarriage rate per woman | 48 per 1000 | 31 per 1000 | OR 0.64 | 991 | ⊕⊕⊝⊝ | ‐ |
| Ongoing pregnancy rate per woman | 132 per 1000 | 207 per 1000 | OR 1.72 | 106 | ⊕⊝⊝⊝ | Only 18 events |
| Multiple pregnancy rate per woman | No data available | |||||
| *The basis for the assumed risk is the mean control group risk across studies. The corresponding risk (and its 95% confidence interval) is based on the assumed risk in the comparison group and the relative effect of the intervention (and its 95% CI). | ||||||
| GRADE Working Group grades of evidence | ||||||
| 1Downgraded one level due to serious imprecision: single study, few events. | ||||||
| HMG FET versus clomiphene + HMG FET | ||||||
| Population: subfertile women | ||||||
| Outcomes | Illustrative comparative risks* (95% CI) | Relative effect | No of participants | Quality of the evidence | Comments | |
| Assumed risk | Corresponding risk | |||||
| Clomiphene+ HMG FET | HMG FET | |||||
| Live birth rate per woman | 84 per 1000 | 186 per 1000 | OR 2.49 | 209 | ⊕⊝⊝⊝ | Only 26 events |
| Miscarriage rate per woman | 37 per 1000 | 49 per 1000 | OR 1.33 | 209 | ⊕⊝⊝⊝ | Only 9 events |
| Ongoing pregnancy rate per woman | No data available | Not estimable | ‐ | |||
| Multiple pregnancy rate per woman | 28 per 1000 | 39 per 1000 | OR 1.41 | 209 | ⊕⊝⊝⊝ | Only 7 events |
| *The basis for the assumed risk (e.g. the median control group risk across studies) is provided in footnotes. The corresponding risk (and its 95% confidence interval) is based on the assumed risk in the comparison group and the relative effect of the intervention (and its 95% CI). | ||||||
| GRADE Working Group grades of evidence | ||||||
| 1Downgraded one level for serious risk of bias: study at unclear risk of bias in all domains. | ||||||
| Study | Intervention (number of embryo transfer) | Control (number of embryo transfer) | Live birth rate | P value |
| Natural cycle FET (n = 332) | HMG FET (n = 340) | 32/332 vs 45/340 | n/s | |
| FET: frozen‐thawed embryo transfer; HMG: human menopausal gonadotrophin; n/s: not significant. | ||||
| Study | Intervention (number of embryo transfer) | Control (number of embryo transfer) | Miscarriage rate | P value |
| Natural cycle FET | HT FET | 41.7% vs 22.2% | n/s | |
| FET: frozen‐thawed embryo transfer; HT: hormone therapy; n/s: not significant. | ||||
| Study | Intervention (number of embryo transfer) | Control (number of embryo transfer) | Ongoing pregnancy rate | P value |
| Natural cycle FET | HT FET | 24.1% vs 21.9% | n/s | |
| FET: frozen‐thawed embryo transfer; HT: hormone therapy; n/s: not significant. | ||||
| Study | Intervention (number of cycles) | Control (number of cycles) | Clinical pregnancy rate | P value |
| Clomiphene‐induced ovulation (n = 35) | HT (n = 52) | 3/35 vs 5/52 | n/s | |
| Clomiphene‐induced ovulation (n = 32) | HT plus GnRHa trigger (n = 37) | 2/32 vs 6/37 | n/s | |
| GnRHa: gonadotrophin releasing hormone agonist; HT: hormone therapy; n/s: not significant. | ||||
| Study | Intervention (number of embryo transfer) | Control (number of embryo transfer) | Clinical pregnancy rate | P value |
| Natural cycle FET | HT FET | 27.6% vs 25% | n/s | |
| FET: frozen‐thawed embryo transfer; HT: hormone therapy; n/s: not significant. | ||||
| Study | Intervention (number of cycles/embryo transfer) | Control (number of cycles/embryo transfer) | Endometrial thickness | P value |
| Clomiphene‐induced ovulation (n = 67) | HT alone or HT plus GnRHa suppression (n = 37) | 9.7 vs 9.8 | n/s | |
| Natural cycle FET (n = 332) | HMG FET (n = 340) | 8.9 vs 8.9 | n/s | |
| FET: frozen‐thawed embryo transfer; GnRHa: gonadotrophin releasing hormone agonist; HMG: human menopausal gonadotrophin; HT: hormone therapy; n/s: not significant. | ||||
| Outcome or subgroup title | No. of studies | No. of participants | Statistical method | Effect size |
| 1 Clinical pregnancy rate per woman Show forest plot | 1 | 100 | Odds Ratio (M‐H, Fixed, 95% CI) | 1.06 [0.40, 2.80] |
| 2 Multiple pregnancy rate per woman Show forest plot | 1 | 21 | Odds Ratio (M‐H, Fixed, 95% CI) | 2.48 [0.09, 68.14] |
| Outcome or subgroup title | No. of studies | No. of participants | Statistical method | Effect size |
| 1 Live birth rate per woman Show forest plot | 1 | 159 | Odds Ratio (M‐H, Fixed, 95% CI) | 0.77 [0.39, 1.53] |
| 2 Clinical pregnancy rate per woman Show forest plot | 1 | 159 | Odds Ratio (M‐H, Fixed, 95% CI) | 0.87 [0.45, 1.71] |
| 3 Multiple pregnancy rate per woman Show forest plot | 1 | 159 | Odds Ratio (M‐H, Fixed, 95% CI) | 0.58 [0.13, 2.50] |
| Outcome or subgroup title | No. of studies | No. of participants | Statistical method | Effect size |
| 1 Live birth rate per woman Show forest plot | 1 | 60 | Odds Ratio (M‐H, Fixed, 95% CI) | 0.55 [0.16, 1.93] |
| 2 Miscarriage rate per woman Show forest plot | 1 | 168 | Odds Ratio (M‐H, Fixed, 95% CI) | 0.20 [0.01, 4.13] |
| 3 Ongoing pregnancy rate per woman Show forest plot | 1 | 168 | Odds Ratio (M‐H, Fixed, 95% CI) | 2.44 [1.03, 5.76] |
| 4 Clinical pregnancy rate per woman Show forest plot | 1 | 60 | Odds Ratio (M‐H, Fixed, 95% CI) | 1.0 [0.32, 3.14] |
| Outcome or subgroup title | No. of studies | No. of participants | Statistical method | Effect size |
| 1 Live birth rate per woman Show forest plot | 1 | 959 | Odds Ratio (M‐H, Fixed, 95% CI) | 1.34 [0.88, 2.05] |
| 2 Ongoing pregnancy rate per woman Show forest plot | 1 | 959 | Odds Ratio (M‐H, Fixed, 95% CI) | 1.21 [0.80, 1.83] |
| 3 Clinical pregnancy rate per woman Show forest plot | 1 | 959 | Odds Ratio (M‐H, Fixed, 95% CI) | 1.22 [0.87, 1.70] |
| 4 Cycle cancellation rate per woman Show forest plot | 1 | 959 | Odds Ratio (M‐H, Fixed, 95% CI) | 0.70 [0.52, 0.95] |
| 5 Endometrial thickness Show forest plot | 1 | 959 | Mean Difference (IV, Fixed, 95% CI) | 0.10 [‐0.13, 0.33] |
| Outcome or subgroup title | No. of studies | No. of participants | Statistical method | Effect size |
| 1 Live birth rate per woman Show forest plot | 1 | 236 | Odds Ratio (M‐H, Fixed, 95% CI) | 1.11 [0.66, 1.87] |
| 2 Miscarriage rate per woman Show forest plot | 1 | 236 | Odds Ratio (M‐H, Fixed, 95% CI) | 0.74 [0.25, 2.19] |
| 3 Clinical pregnancy rate per woman Show forest plot | 1 | 236 | Odds Ratio (M‐H, Fixed, 95% CI) | 1.07 [0.64, 1.78] |
| 4 Endometrial thickness Show forest plot | 1 | 236 | Mean Difference (IV, Fixed, 95% CI) | ‐0.20 [‐0.54, 0.14] |
| Outcome or subgroup title | No. of studies | No. of participants | Statistical method | Effect size |
| 1 Live birth rate per woman Show forest plot | 1 | 75 | Odds Ratio (M‐H, Fixed, 95% CI) | 0.10 [0.04, 0.30] |
| 2 Miscarriage rate per woman Show forest plot | 6 | 991 | Odds Ratio (M‐H, Fixed, 95% CI) | 0.64 [0.37, 1.12] |
| 3 Ongoing pregnancy rate per woman Show forest plot | 1 | 106 | Odds Ratio (M‐H, Fixed, 95% CI) | 1.72 [0.61, 4.85] |
| 4 Clinical pregnancy rate per woman Show forest plot | 5 | 872 | Odds Ratio (M‐H, Fixed, 95% CI) | 0.90 [0.65, 1.25] |
| 5 Cycle cancellation rate per woman Show forest plot | 3 | 636 | Odds Ratio (M‐H, Fixed, 95% CI) | 2.73 [0.79, 9.38] |
| 6 Endometrial thickness Show forest plot | 3 | 625 | Mean Difference (IV, Fixed, 95% CI) | ‐0.16 [‐0.41, 0.09] |
| Outcome or subgroup title | No. of studies | No. of participants | Statistical method | Effect size |
| 1 Clinical pregnancy rate per woman Show forest plot | 1 | 175 | Odds Ratio (M‐H, Fixed, 95% CI) | 1.09 [0.45, 2.62] |
| 2 Cycle cancellation rate per woman Show forest plot | 1 | 175 | Odds Ratio (M‐H, Fixed, 95% CI) | 0.99 [0.49, 2.00] |
| 3 Endometrial thickness Show forest plot | 1 | 175 | Mean Difference (IV, Fixed, 95% CI) | 0.0 [‐0.31, 0.31] |
| Outcome or subgroup title | No. of studies | No. of participants | Statistical method | Effect size |
| 1 Live birth rate per woman Show forest plot | 1 | 209 | Odds Ratio (M‐H, Fixed, 95% CI) | 2.49 [1.07, 5.80] |
| 2 Miscarriage rate per woman Show forest plot | 1 | 209 | Odds Ratio (M‐H, Fixed, 95% CI) | 1.33 [0.35, 5.09] |
| 3 Multiple pregnancy rate per woman Show forest plot | 1 | 209 | Odds Ratio (M‐H, Fixed, 95% CI) | 1.41 [0.31, 6.48] |