Regímenes cíclicos para la transferencia de embriones congelados‐descongelados
Información
- DOI:
- https://doi.org/10.1002/14651858.CD003414.pub3Copiar DOI

- Base de datos:
-
- Cochrane Database of Systematic Reviews
- Versión publicada:
-
- 05 julio 2017see what's new
- Tipo:
-
- Intervention
- Etapa:
-
- Review
- Grupo Editorial Cochrane:
-
Grupo Cochrane de Ginecología y fertilidad
- Copyright:
-
- Copyright © 2017 The Cochrane Collaboration. Published by John Wiley & Sons, Ltd.
Cifras del artículo
Altmetric:
Citado por:
Autores
Contributions of authors
For the 2017 update:
TG: performed the updated search, selection of included studies, data extraction, and contributed to the writing and updating of the review.
TAG: contributed to the writing and updating of the review.
ROA: performed the updated search, selection of included studies and data extraction, created the 'Summary of findings' tables, and contributed to the writing and updating of the review.
For the previous update:
TG and Patrick Vanderkerchove (PV) shared the writing of the protocol, searching for and assessing the relevant studies and the writing up of the review. TG and PV shared the update of the review including search for relevant randomized controlled trials (RCTs), selection of included RCTs and writing up the updated review.
Sources of support
Internal sources
-
Gynaecology and Fertility Cochrane Subgroup, New Zealand.
External sources
-
None, Other.
Declarations of interest
Tarek Ghobara: no known conflict of interest
Tarek A Gelbaya: no known conflict of interest
Reuben Olugbenga Ayeleke: no known conflict of interest
Acknowledgements
The authors would like to thank the Cochrane Gynaecology and Fertility editorial staff for their advice and support through the review process. The authors of the 2017 update thank Patrick Vanderkerchove for his contributions to previous versions of this review.
Version history
| Published | Title | Stage | Authors | Version |
| 2017 Jul 05 | Cycle regimens for frozen‐thawed embryo transfer | Review | Tarek Ghobara, Tarek A Gelbaya, Reuben Olugbenga Ayeleke | |
| 2008 Jan 23 | Cycle regimens for frozen‐thawed embryo transfer | Review | Tarek Ghobara, Patrick Vanderkerchove | |
| 2002 Jan 21 | Cycle regimes for frozen‐thawed embryo transfer | Protocol | Tarek Ghobara, Patrick Vandekerckhove | |
Differences between protocol and review
We edited Objectives and 'Types of interventions' section to clarify that comparisons between types of modality are eligible: this was also the case in the previous version of the review but was not stated very clearly.
We rearranged outcomes, with 'Miscarriage rate per woman' now being the second primary outcome in the review and 'Clinical pregnancy rate' becoming a secondary outcome. We added one secondary outcome, 'Number of centre visits to monitor FET cycle'.
We amended the definition of the primary outcome 'Live birth' to be "delivery of a live fetus after 24 completed weeks of gestational age".
Keywords
MeSH
Medical Subject Headings (MeSH) Keywords
- *Estrogens;
- *Pregnancy Rate;
- *Progesterone;
- Clomiphene;
- Cryopreservation;
- Embryo Transfer [*methods];
- Endometrium [*drug effects, physiology];
- Fertility Agents, Female;
- Follicular Phase [drug effects, physiology];
- Gonadotropin‐Releasing Hormone [agonists];
- Ovulation Induction [*methods];
- Randomized Controlled Trials as Topic;
Medical Subject Headings Check Words
Female; Humans; Pregnancy;
PICO

Study flow diagram

Risk of bias graph: review authors' judgements about each risk of bias item presented as percentages across all included studies

Risk of bias summary: review authors' judgements about each risk of bias item for each included study
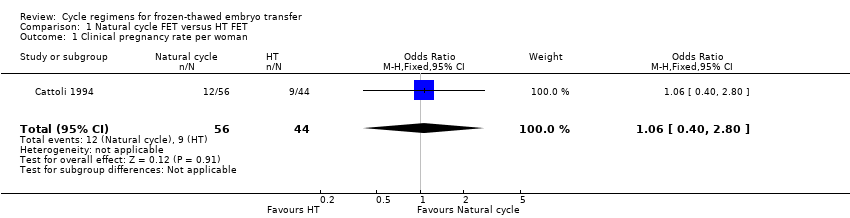
Comparison 1 Natural cycle FET versus HT FET, Outcome 1 Clinical pregnancy rate per woman.

Comparison 1 Natural cycle FET versus HT FET, Outcome 2 Multiple pregnancy rate per woman.

Comparison 2 Natural cycle FET versus HT + GnRHa FET, Outcome 1 Live birth rate per woman.
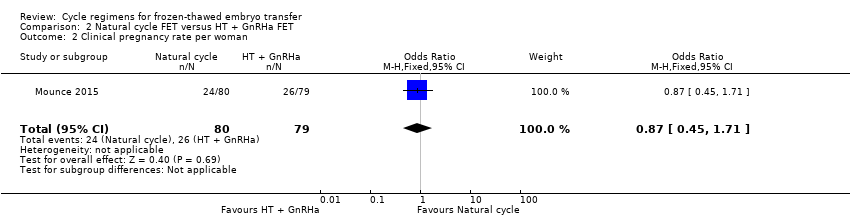
Comparison 2 Natural cycle FET versus HT + GnRHa FET, Outcome 2 Clinical pregnancy rate per woman.

Comparison 2 Natural cycle FET versus HT + GnRHa FET, Outcome 3 Multiple pregnancy rate per woman.

Comparison 3 Natural cycle FET versus modified natural cycle FET (HCG trigger), Outcome 1 Live birth rate per woman.

Comparison 3 Natural cycle FET versus modified natural cycle FET (HCG trigger), Outcome 2 Miscarriage rate per woman.

Comparison 3 Natural cycle FET versus modified natural cycle FET (HCG trigger), Outcome 3 Ongoing pregnancy rate per woman.

Comparison 3 Natural cycle FET versus modified natural cycle FET (HCG trigger), Outcome 4 Clinical pregnancy rate per woman.
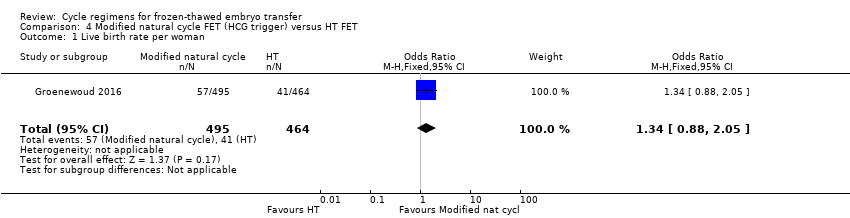
Comparison 4 Modified natural cycle FET (HCG trigger) versus HT FET, Outcome 1 Live birth rate per woman.

Comparison 4 Modified natural cycle FET (HCG trigger) versus HT FET, Outcome 2 Ongoing pregnancy rate per woman.
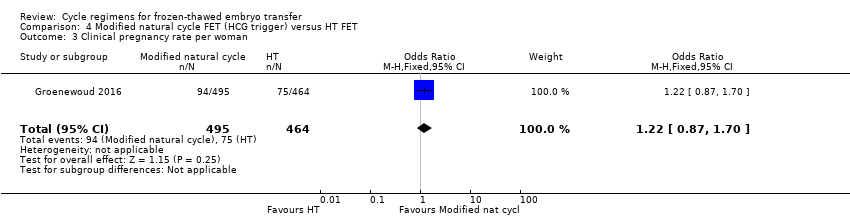
Comparison 4 Modified natural cycle FET (HCG trigger) versus HT FET, Outcome 3 Clinical pregnancy rate per woman.

Comparison 4 Modified natural cycle FET (HCG trigger) versus HT FET, Outcome 4 Cycle cancellation rate per woman.
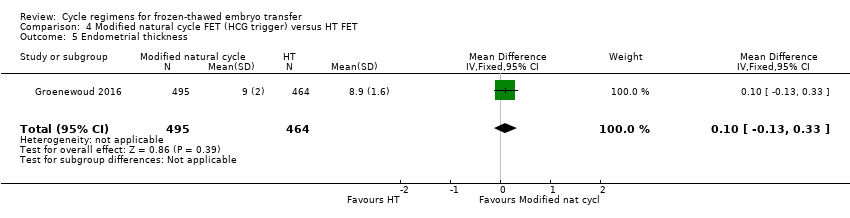
Comparison 4 Modified natural cycle FET (HCG trigger) versus HT FET, Outcome 5 Endometrial thickness.

Comparison 5 Modified natural cycle FET (HCG trigger) versus HT + GnRH‐a FET, Outcome 1 Live birth rate per woman.

Comparison 5 Modified natural cycle FET (HCG trigger) versus HT + GnRH‐a FET, Outcome 2 Miscarriage rate per woman.
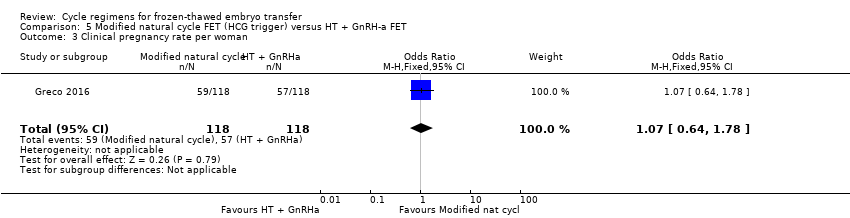
Comparison 5 Modified natural cycle FET (HCG trigger) versus HT + GnRH‐a FET, Outcome 3 Clinical pregnancy rate per woman.
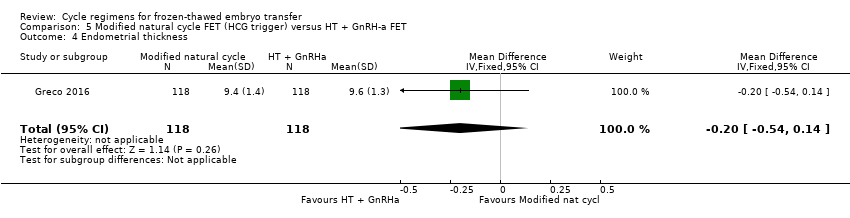
Comparison 5 Modified natural cycle FET (HCG trigger) versus HT + GnRH‐a FET, Outcome 4 Endometrial thickness.

Comparison 6 HT FET versus HT + GnRH‐a, Outcome 1 Live birth rate per woman.
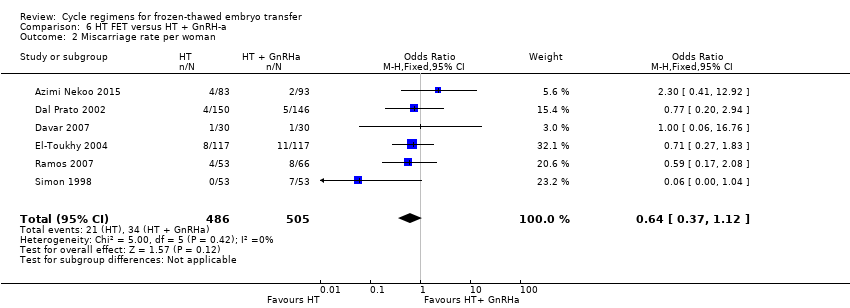
Comparison 6 HT FET versus HT + GnRH‐a, Outcome 2 Miscarriage rate per woman.
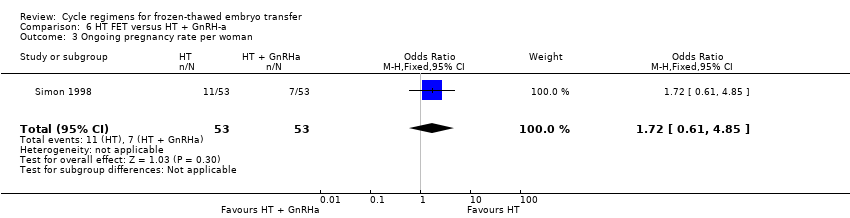
Comparison 6 HT FET versus HT + GnRH‐a, Outcome 3 Ongoing pregnancy rate per woman.
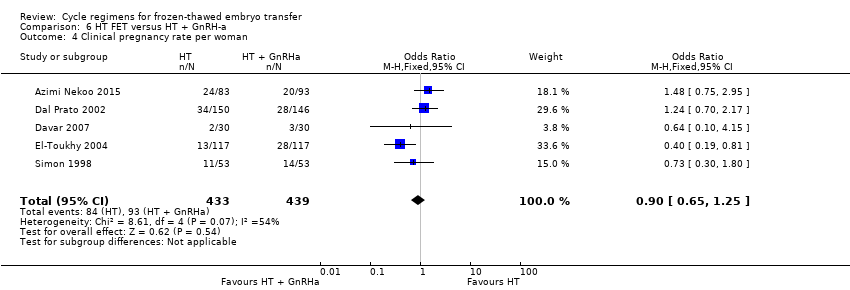
Comparison 6 HT FET versus HT + GnRH‐a, Outcome 4 Clinical pregnancy rate per woman.

Comparison 6 HT FET versus HT + GnRH‐a, Outcome 5 Cycle cancellation rate per woman.
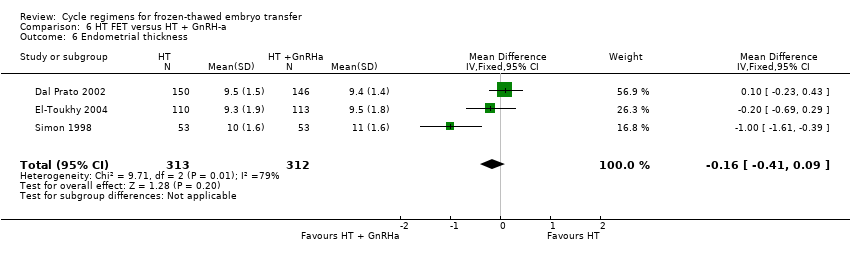
Comparison 6 HT FET versus HT + GnRH‐a, Outcome 6 Endometrial thickness.
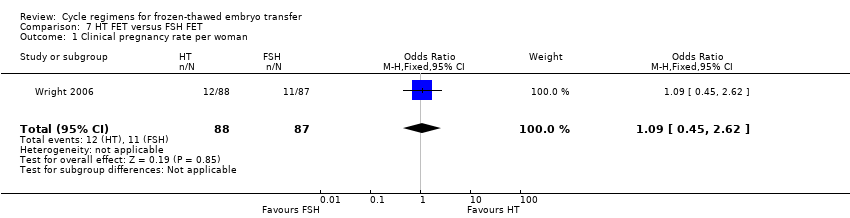
Comparison 7 HT FET versus FSH FET, Outcome 1 Clinical pregnancy rate per woman.

Comparison 7 HT FET versus FSH FET, Outcome 2 Cycle cancellation rate per woman.

Comparison 7 HT FET versus FSH FET, Outcome 3 Endometrial thickness.

Comparison 8 HMG FET versus clomiphene + HMG FET, Outcome 1 Live birth rate per woman.

Comparison 8 HMG FET versus clomiphene + HMG FET, Outcome 2 Miscarriage rate per woman.
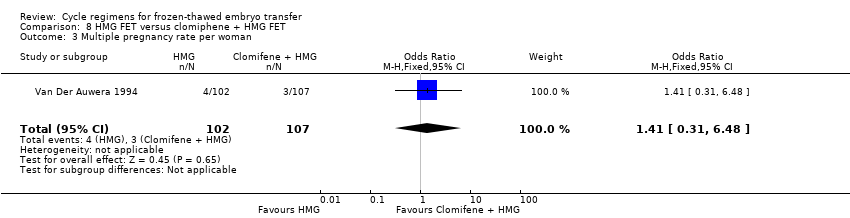
Comparison 8 HMG FET versus clomiphene + HMG FET, Outcome 3 Multiple pregnancy rate per woman.
| Natural cycle FET versus HT FET | ||||||
| Population: subfertile women | ||||||
| Outcomes | Illustrative comparative risks* (95% CI) | Relative effect | No of participants | Quality of the evidence | Comments | |
| Assumed risk | Corresponding risk | |||||
| HT FET | Natural cycle FET | |||||
| Live birth rate per woman | No data available | Not estimable | ‐ | |||
| Miscarriage rate per woman | No data available | Not estimable | ‐ | |||
| Ongoing pregnancy rate per woman | No data available | Not estimable | ‐ | |||
| Multiple pregnancy rate per woman | See comment | OR 2.48 | 21 | ⊕⊝⊝⊝ | No events in the control group | |
| *The basis for the assumed risk (e.g. the median control group risk across studies) is provided in footnotes. The corresponding risk (and its 95% confidence interval) is based on the assumed risk in the comparison group and the relative effect of the intervention (and its 95% CI). | ||||||
| GRADE Working Group grades of evidence | ||||||
| 1Downgraded one level for serious risk of bias: study at unclear risk of bias in all domains. | ||||||
| Natural cycle FET versus HT + GnRHa suppression FET | ||||||
| Population: subfertile women | ||||||
| Outcomes | Illustrative comparative risks* (95% CI) | Relative effect | No of participants | Quality of the evidence | Comments | |
| Assumed risk | Corresponding risk | |||||
| HT + GnRHa FET | Natural cycle FET | |||||
| Live birth rate per woman | 316 per 1000 | 262 per 1000 | OR 0.77 | 159 | ⊕⊕⊝⊝ | Only 46 events |
| Miscarriage rate per woman | No data available | Not estimable | ‐ | |||
| Ongoing pregnancy rate per woman | No data available | Not estimable | ‐ | |||
| Multiple pregnancy rate per woman | 63 per 1000 | 38 per 1000 | OR 0.58 | 159 | ⊕⊕⊝⊝ | Only 8 events |
| *The basis for the assumed risk (e.g. the median control group risk across studies) is provided in footnotes. The corresponding risk (and its 95% confidence interval) is based on the assumed risk in the comparison group and the relative effect of the intervention (and its 95% CI). | ||||||
| GRADE Working Group grades of evidence | ||||||
| 1Downgraded two levels due to very serious imprecision: single study, few events, confidence interval compatible with benefit in either group or with no effect. | ||||||
| Natural cycle FET versus other regimens for primary or secondary subfertility | ||||||
| Population: subfertile women | ||||||
| Outcomes | Illustrative comparative risks* (95% CI) | Relative effect | No of participants | Quality of the evidence | Comments | |
| Assumed risk | Corresponding risk | |||||
| Modified natural cycle FET (HCG trigger) | Natural cycle FET | |||||
| Live birth rate per woman | 267 per 1000 | 167 per 1000 | OR 0.55 | 60 | ⊕⊝⊝⊝ | Only 13 events |
| Miscarriage rate per woman | 24 per 1000 | 5 per 1000 | OR 0.20 | 168 | ⊕⊝⊝⊝ | Only 2 events |
| Ongoing pregnancy rate per woman | 107 per 1000 | 226 per 1000 | OR 2.44 | 168 | ⊕⊝⊝⊝ | Only 28 events |
| Multiple pregnancy per woman | No data available | |||||
| *The basis for the assumed risk is the mean control group risk across studies. The corresponding risk (and its 95% confidence interval) is based on the assumed risk in the comparison group and the relative effect of the intervention (and its 95% CI). | ||||||
| GRADE Working Group grades of evidence | ||||||
| 1One other study compared natural cycle FET versus natural cycle plus human menopausal gonadotrophin, but did not report any per‐woman data. | ||||||
| Modified natural cycle FET (HCG trigger) versus HT FET | ||||||
| Population: subfertile women | ||||||
| Outcomes | Illustrative comparative risks* (95% CI) | Relative effect | No of participants | Quality of the evidence | Comments | |
| Assumed risk | Corresponding risk | |||||
| HT FET | Modified natural cycle FET (HCG trigger) | |||||
| Live birth rate per woman | 88 per 1000 | 114 per 1000 | OR 1.34 | 959 | ⊕⊕⊝⊝ | |
| Miscarriage rate per woman | No data available | Not estimable | ‐ | |||
| Ongoing pregnancy rate per woman | 97 per 1000 | 115 per 1000 | OR 1.21 | 959 | ⊕⊕⊝⊝ | |
| Multiple pregnancy rate per woman | No data available | Not estimable | ‐ | |||
| *The basis for the assumed risk (e.g. the median control group risk across studies) is provided in footnotes. The corresponding risk (and its 95% confidence interval) is based on the assumed risk in the comparison group and the relative effect of the intervention (and its 95% CI). | ||||||
| GRADE Working Group grades of evidence | ||||||
| 1Downgraded one level due to serious risk of bias: high attrition rate, unclear risk of allocation concealment | ||||||
| Modified natural cycle FET (HCG trigger) versus HT + GnRHa FET | ||||||
| Population: subfertile women | ||||||
| Outcomes | Illustrative comparative risks* (95% CI) | Relative effect | No of participants | Quality of the evidence | Comments | |
| Assumed risk | Corresponding risk | |||||
| HT + GnRHa FET | Modified natural cycle FET (HCG trigger) | |||||
| Live birth rate per woman | 398 per 1000 | 423 per 1000 | OR 1.11 | 236 | ⊕⊕⊝⊝ | |
| Miscarriage rate per woman | 68 per 1000 | 51 per 1000 | OR 0.74 | 236 | ⊕⊕⊝⊝ | |
| Ongoing pregnancy rate | No data available | Not estimable | ‐ | |||
| Multiple pregnancy rate per woman | No data available | Not estimable | ‐ | |||
| *The basis for the assumed risk is the mean control group risk across studies. The corresponding risk (and its 95% confidence interval) is based on the assumed risk in the comparison group and the relative effect of the intervention (and its 95% CI). | ||||||
| GRADE Working Group grades of evidence | ||||||
| 1Downgraded one level due to serious risk of bias: study at unclear risk of in most domains of bias (allocation concealment, blinding, selective reporting and other sources of bias). | ||||||
| HT FET versus other regimens for primary or secondary subfertility | ||||||
| Population: women with primary or secondary subfertility | ||||||
| Outcomes | Illustrative comparative risks* (95% CI) | Relative effect | No of participants | Quality of the evidence | Comments | |
| Assumed risk | Corresponding risk | |||||
| HT + GnRHa FET | HT FET | |||||
| Live birth rate per woman | 742 per 1000 | 223 per 1000 | OR 0.10 | 75 | ⊕⊕⊝⊝ | Only 33 events |
| Miscarriage rate per woman | 48 per 1000 | 31 per 1000 | OR 0.64 | 991 | ⊕⊕⊝⊝ | ‐ |
| Ongoing pregnancy rate per woman | 132 per 1000 | 207 per 1000 | OR 1.72 | 106 | ⊕⊝⊝⊝ | Only 18 events |
| Multiple pregnancy rate per woman | No data available | |||||
| *The basis for the assumed risk is the mean control group risk across studies. The corresponding risk (and its 95% confidence interval) is based on the assumed risk in the comparison group and the relative effect of the intervention (and its 95% CI). | ||||||
| GRADE Working Group grades of evidence | ||||||
| 1Downgraded one level due to serious imprecision: single study, few events. | ||||||
| HMG FET versus clomiphene + HMG FET | ||||||
| Population: subfertile women | ||||||
| Outcomes | Illustrative comparative risks* (95% CI) | Relative effect | No of participants | Quality of the evidence | Comments | |
| Assumed risk | Corresponding risk | |||||
| Clomiphene+ HMG FET | HMG FET | |||||
| Live birth rate per woman | 84 per 1000 | 186 per 1000 | OR 2.49 | 209 | ⊕⊝⊝⊝ | Only 26 events |
| Miscarriage rate per woman | 37 per 1000 | 49 per 1000 | OR 1.33 | 209 | ⊕⊝⊝⊝ | Only 9 events |
| Ongoing pregnancy rate per woman | No data available | Not estimable | ‐ | |||
| Multiple pregnancy rate per woman | 28 per 1000 | 39 per 1000 | OR 1.41 | 209 | ⊕⊝⊝⊝ | Only 7 events |
| *The basis for the assumed risk (e.g. the median control group risk across studies) is provided in footnotes. The corresponding risk (and its 95% confidence interval) is based on the assumed risk in the comparison group and the relative effect of the intervention (and its 95% CI). | ||||||
| GRADE Working Group grades of evidence | ||||||
| 1Downgraded one level for serious risk of bias: study at unclear risk of bias in all domains. | ||||||
| Study | Intervention (number of embryo transfer) | Control (number of embryo transfer) | Live birth rate | P value |
| Natural cycle FET (n = 332) | HMG FET (n = 340) | 32/332 vs 45/340 | n/s | |
| FET: frozen‐thawed embryo transfer; HMG: human menopausal gonadotrophin; n/s: not significant. | ||||
| Study | Intervention (number of embryo transfer) | Control (number of embryo transfer) | Miscarriage rate | P value |
| Natural cycle FET | HT FET | 41.7% vs 22.2% | n/s | |
| FET: frozen‐thawed embryo transfer; HT: hormone therapy; n/s: not significant. | ||||
| Study | Intervention (number of embryo transfer) | Control (number of embryo transfer) | Ongoing pregnancy rate | P value |
| Natural cycle FET | HT FET | 24.1% vs 21.9% | n/s | |
| FET: frozen‐thawed embryo transfer; HT: hormone therapy; n/s: not significant. | ||||
| Study | Intervention (number of cycles) | Control (number of cycles) | Clinical pregnancy rate | P value |
| Clomiphene‐induced ovulation (n = 35) | HT (n = 52) | 3/35 vs 5/52 | n/s | |
| Clomiphene‐induced ovulation (n = 32) | HT plus GnRHa trigger (n = 37) | 2/32 vs 6/37 | n/s | |
| GnRHa: gonadotrophin releasing hormone agonist; HT: hormone therapy; n/s: not significant. | ||||
| Study | Intervention (number of embryo transfer) | Control (number of embryo transfer) | Clinical pregnancy rate | P value |
| Natural cycle FET | HT FET | 27.6% vs 25% | n/s | |
| FET: frozen‐thawed embryo transfer; HT: hormone therapy; n/s: not significant. | ||||
| Study | Intervention (number of cycles/embryo transfer) | Control (number of cycles/embryo transfer) | Endometrial thickness | P value |
| Clomiphene‐induced ovulation (n = 67) | HT alone or HT plus GnRHa suppression (n = 37) | 9.7 vs 9.8 | n/s | |
| Natural cycle FET (n = 332) | HMG FET (n = 340) | 8.9 vs 8.9 | n/s | |
| FET: frozen‐thawed embryo transfer; GnRHa: gonadotrophin releasing hormone agonist; HMG: human menopausal gonadotrophin; HT: hormone therapy; n/s: not significant. | ||||
| Outcome or subgroup title | No. of studies | No. of participants | Statistical method | Effect size |
| 1 Clinical pregnancy rate per woman Show forest plot | 1 | 100 | Odds Ratio (M‐H, Fixed, 95% CI) | 1.06 [0.40, 2.80] |
| 2 Multiple pregnancy rate per woman Show forest plot | 1 | 21 | Odds Ratio (M‐H, Fixed, 95% CI) | 2.48 [0.09, 68.14] |
| Outcome or subgroup title | No. of studies | No. of participants | Statistical method | Effect size |
| 1 Live birth rate per woman Show forest plot | 1 | 159 | Odds Ratio (M‐H, Fixed, 95% CI) | 0.77 [0.39, 1.53] |
| 2 Clinical pregnancy rate per woman Show forest plot | 1 | 159 | Odds Ratio (M‐H, Fixed, 95% CI) | 0.87 [0.45, 1.71] |
| 3 Multiple pregnancy rate per woman Show forest plot | 1 | 159 | Odds Ratio (M‐H, Fixed, 95% CI) | 0.58 [0.13, 2.50] |
| Outcome or subgroup title | No. of studies | No. of participants | Statistical method | Effect size |
| 1 Live birth rate per woman Show forest plot | 1 | 60 | Odds Ratio (M‐H, Fixed, 95% CI) | 0.55 [0.16, 1.93] |
| 2 Miscarriage rate per woman Show forest plot | 1 | 168 | Odds Ratio (M‐H, Fixed, 95% CI) | 0.20 [0.01, 4.13] |
| 3 Ongoing pregnancy rate per woman Show forest plot | 1 | 168 | Odds Ratio (M‐H, Fixed, 95% CI) | 2.44 [1.03, 5.76] |
| 4 Clinical pregnancy rate per woman Show forest plot | 1 | 60 | Odds Ratio (M‐H, Fixed, 95% CI) | 1.0 [0.32, 3.14] |
| Outcome or subgroup title | No. of studies | No. of participants | Statistical method | Effect size |
| 1 Live birth rate per woman Show forest plot | 1 | 959 | Odds Ratio (M‐H, Fixed, 95% CI) | 1.34 [0.88, 2.05] |
| 2 Ongoing pregnancy rate per woman Show forest plot | 1 | 959 | Odds Ratio (M‐H, Fixed, 95% CI) | 1.21 [0.80, 1.83] |
| 3 Clinical pregnancy rate per woman Show forest plot | 1 | 959 | Odds Ratio (M‐H, Fixed, 95% CI) | 1.22 [0.87, 1.70] |
| 4 Cycle cancellation rate per woman Show forest plot | 1 | 959 | Odds Ratio (M‐H, Fixed, 95% CI) | 0.70 [0.52, 0.95] |
| 5 Endometrial thickness Show forest plot | 1 | 959 | Mean Difference (IV, Fixed, 95% CI) | 0.10 [‐0.13, 0.33] |
| Outcome or subgroup title | No. of studies | No. of participants | Statistical method | Effect size |
| 1 Live birth rate per woman Show forest plot | 1 | 236 | Odds Ratio (M‐H, Fixed, 95% CI) | 1.11 [0.66, 1.87] |
| 2 Miscarriage rate per woman Show forest plot | 1 | 236 | Odds Ratio (M‐H, Fixed, 95% CI) | 0.74 [0.25, 2.19] |
| 3 Clinical pregnancy rate per woman Show forest plot | 1 | 236 | Odds Ratio (M‐H, Fixed, 95% CI) | 1.07 [0.64, 1.78] |
| 4 Endometrial thickness Show forest plot | 1 | 236 | Mean Difference (IV, Fixed, 95% CI) | ‐0.20 [‐0.54, 0.14] |
| Outcome or subgroup title | No. of studies | No. of participants | Statistical method | Effect size |
| 1 Live birth rate per woman Show forest plot | 1 | 75 | Odds Ratio (M‐H, Fixed, 95% CI) | 0.10 [0.04, 0.30] |
| 2 Miscarriage rate per woman Show forest plot | 6 | 991 | Odds Ratio (M‐H, Fixed, 95% CI) | 0.64 [0.37, 1.12] |
| 3 Ongoing pregnancy rate per woman Show forest plot | 1 | 106 | Odds Ratio (M‐H, Fixed, 95% CI) | 1.72 [0.61, 4.85] |
| 4 Clinical pregnancy rate per woman Show forest plot | 5 | 872 | Odds Ratio (M‐H, Fixed, 95% CI) | 0.90 [0.65, 1.25] |
| 5 Cycle cancellation rate per woman Show forest plot | 3 | 636 | Odds Ratio (M‐H, Fixed, 95% CI) | 2.73 [0.79, 9.38] |
| 6 Endometrial thickness Show forest plot | 3 | 625 | Mean Difference (IV, Fixed, 95% CI) | ‐0.16 [‐0.41, 0.09] |
| Outcome or subgroup title | No. of studies | No. of participants | Statistical method | Effect size |
| 1 Clinical pregnancy rate per woman Show forest plot | 1 | 175 | Odds Ratio (M‐H, Fixed, 95% CI) | 1.09 [0.45, 2.62] |
| 2 Cycle cancellation rate per woman Show forest plot | 1 | 175 | Odds Ratio (M‐H, Fixed, 95% CI) | 0.99 [0.49, 2.00] |
| 3 Endometrial thickness Show forest plot | 1 | 175 | Mean Difference (IV, Fixed, 95% CI) | 0.0 [‐0.31, 0.31] |
| Outcome or subgroup title | No. of studies | No. of participants | Statistical method | Effect size |
| 1 Live birth rate per woman Show forest plot | 1 | 209 | Odds Ratio (M‐H, Fixed, 95% CI) | 2.49 [1.07, 5.80] |
| 2 Miscarriage rate per woman Show forest plot | 1 | 209 | Odds Ratio (M‐H, Fixed, 95% CI) | 1.33 [0.35, 5.09] |
| 3 Multiple pregnancy rate per woman Show forest plot | 1 | 209 | Odds Ratio (M‐H, Fixed, 95% CI) | 1.41 [0.31, 6.48] |