Ácidos grasos omega 3 durante el embarazo
Referencias
Referencias de los estudios incluidos en esta revisión
Referencias de los estudios excluidos de esta revisión
Referencias de los estudios en espera de evaluación
Referencias de los estudios en curso
Referencias adicionales
Referencias de otras versiones publicadas de esta revisión
Characteristics of studies
Characteristics of included studies [ordered by study ID]
| Methods | RCT: NCT02696577 | |
| Participants | 80 women randomised Inclusion criteria: 20–35 years; 28‐30 weeks' gestation; pregnancy complicated with asymmetrical IUGR (diagnosed by 2D trans‐abdominal US when the abdominal circumference was reduced out of proportion to other fetal biometric parameters and was below the 10th percentile so there was an increased HC:AC ratio); with normal Doppler indices in uterine and umbilical arteries at time of recruitment (the normal value of S/D ratio was from 2.5 to 3.5; RI was from 0.60 to 0.75 and PI was from 0.96 to 1.270, respectively). Exclusion criteria: ≤ 20 and ≥ 35 years; any hypertensive disorder; diabetes mellitus; smokers; multiple gestations, low amniotic fluid volume; premature prelabour rupture of membranes; antepartum haemorrhage and fetal congenital anomalies; women with abnormal Doppler indices, absent diastolic flow or reversed flow. Setting: Assiut Woman’s Health Hospital, Egypt | |
| Interventions | SUPPLEMENTATION + OTHER AGENT: DHA + EPA + wheat‐germ oil + aspirin versus aspirin Group 1: fish oil (1000 mg = DHA 9%, EPA 13%) plus 100 mg wheat‐germ oil (LA 52%‐59%) as a source of vitamin E, and aspirin 81 once daily: n = 40 Group 2: aspirin 81 once daily: n = 40 Timing of supplementation: 6 weeks (from ˜28‐30 weeks GA) DHA + EPA dose/day: low: 90 mg DHA + 130 mg EPA | |
| Outcomes | Women/birth: gestational length; caesarean section; Doppler blood flow in uterine and umbilical arteries Babies/infants/children: birthweight; perinatal mortality; admission to NICU | |
| Notes | Funding: not reported Declarations of interest: none declared | |
| Risk of bias | ||
| Bias | Authors' judgement | Support for judgement |
| Random sequence generation (selection bias) | Low risk | Computer‐generated random number table |
| Allocation concealment (selection bias) | Low risk | Quote: "Allocation concealment was done using serially numbered closed opaque envelopes. Each envelope was labelled with a serial number and had a card noting the intervention type. Allocation never changed after opening the closed envelopes" |
| Blinding of participants and personnel (performance bias) | Unclear risk | Not reported |
| Blinding of outcome assessment (detection bias) | Unclear risk | Not reported |
| Incomplete outcome data (attrition bias) | Unclear risk | 12/80 (15%) participants lost to follow‐up (6/40 in both intervention (2 failure of treatment and 4 lost to follow‐up) and control group (3 failure of treatment and 3 lost to follow‐up). |
| Selective reporting (reporting bias) | Unclear risk | With no access to a trial protocol it was not possible to assess selective reporting confidently. |
| Other bias | Low risk | Baseline characteristics appeared similar, no obvious source of other bias identified. |
| Methods | RCT (3 arms) | |
| Participants | 144 women randomised Inclusion criteria: healthy pregnant Caucasian women at least 18 years of age and willing to breast feed for at least 3 months Exclusion criteria: increased risk of preterm birth or multiple pregnancy, allergy to cow milk protein, lactose intolerance, smoking, diabetes, consumption of alcohol > 20 g/week, or participation in another study Exclusions: infants born < 37 weeks GA, had major malformations or were hospitalised for > 1 week Setting: Virchow‐Klinikum of the Charité and other gynaecological practices in Berlin, Germany | |
| Interventions | SUPPLEMENTATION + OTHER AGENT: omega‐3 + prebiotic versus vitamin/mineral + prebiotic versus vitamin/mineral Group 1: 600 mg fish oil (with 200 mg DHA and low EPA) plus prebiotic (fructo‐oligosaccharide (4.5 g)) daily; delivered in a tetrabox containing 200 mL milk‐based supplement: n = 48 (40) Group 2: control/comparison intervention: vitamin and mineral supplementation with or without additional prebiotic (fructo‐oligosaccharide); delivered in a tetrabox containing 200 mL milk‐based supplement: n = 96 (48 in each group) (74) Timing of supplementation: supplementation from 22 weeks GA to 37 weeks GA, resuming at 2 weeks postpartum until 3 months DHA + EPA dose/day: low: 200 mg DHA; low EPA | |
| Outcomes | Women/birth: maternal weight gain (from 22 weeks GA to birth); GA; caesarean birth; breast milk composition; DHA RBC concentrations; preterm birth < 37 weeks; Babies/infants/children: birthweight, birth length and head circumference at birth, 1, 3 and 21 months; Apgar score at 5 minutes; cord blood pH; chemokines; vaccine antibody responses 6‐year follow‐up: child weight, height, head circumference, skinfold thickness | |
| Notes | Funding: Nestec Ltd, Switzerland; Charité University Hospitals. Supplements were prepared and donated by Nestlé Declarations of interest: none declared | |
| Risk of bias | ||
| Bias | Authors' judgement | Support for judgement |
| Random sequence generation (selection bias) | Low risk | Quote: “randomized by a computer program” |
| Allocation concealment (selection bias) | Unclear risk | Quote: “allocated to one of three groups”; no further detail reported |
| Blinding of participants and personnel (performance bias) | Low risk | Quote: “The identity of supplements was blinded to the subjects, support staff and investigators” |
| Blinding of outcome assessment (detection bias) | Low risk | Not reported but probably done |
| Incomplete outcome data (attrition bias) | Unclear risk |
|
| Selective reporting (reporting bias) | Low risk | No apparent selective outcome reporting (although reasons for exclusions differed between different follow‐up periods) |
| Other bias | Low risk | Baseline characteristics similar between groups |
| Methods | RCT: NCT00798226 Children of the mothers enrolled in this RCT formed the Copenhagen Prospective Studies on Asthma in Childhood (COPSAC). | |
| Participants | 736 women randomised Inclusion criteria: pregnant women, at least 18 years, between 22 and 26 weeks' gestation. Exclusion criteria: women taking more than 600 IU of vitamin D per day, and women with any endocrine, heart or kidney disorder. Setting: Copenhagen, Denmark (women recruited between November 2008 and November 2010). | |
| Interventions | SUPPLEMENTATION: EPA + DHA versus placebo Group 1: 2.4 g per day of omega‐3 LCPUFA (55% EPA and 37% DHA) in triacylglycerol form (Incromega TG33/22, Croda Health Care). The omega‐3 LCPUFA was administered in 4 identical 1 g capsules; n = 365 Group 2: placebo: olive oil, containing 72% omega‐9 oleic acid and 12% omega‐6 LA (Pharma‐Tech A/S), administered in 4 identical 1 g capsules; n = 371 Timing of supplementation: intervention was given to women during the last 3 months (third trimester) of pregnancy and continued for 1 week after giving birth. DHA + EPA dose/day: high: 890 mg DHA + 1320 mg EPA | |
| Outcomes | Women/birth: preterm birth (< 37 weeks); caesarean section; PE; death/serious maternal morbidity/mortality; length of maternal hospital stay Babies/infants/children: admission to NICU; neonatal death; growth, development (not yet reported) | |
| Notes | Allergy outcomes from this trial will be reported in another Cochrane Review when it is updated (Gunaratne 2015). Funding: “No funding agency played any role in the design or conduct of the trial, the collection, management, or interpretation of the data, the preparation, review, or approval of the manuscript for publication, or the decision to submit the manuscript for publication. In addition, no pharmaceutical company that produces n‐3 [omega‐3] LCPUFA was involved in the trial. The intervention was funded solely by COPSAC” Declarations of interest: none reported | |
| Risk of bias | ||
| Bias | Authors' judgement | Support for judgement |
| Random sequence generation (selection bias) | Low risk | Quote: “The women were randomized using a computer‐generated list of random numbers”. |
| Allocation concealment (selection bias) | Low risk | Randomisation was “prepared by an external investigator with no other involvement in the trial”. |
| Blinding of participants and personnel (performance bias) | Low risk | For the outcomes reported and included in this review, the participants and personnel were blinded to intervention assignment. However, for the outcomes relating to the 5‐year data collection time point, only the investigators were blind to group allocations. Quote: “Neither the investigators nor the participants were aware of group assignments during follow‐up for the first 3 years of the children’s lives, after which there was a 2‐year follow‐up period during which only the investigators were unaware of group assignments”. |
| Blinding of outcome assessment (detection bias) | Low risk | Probably done |
| Incomplete outcome data (attrition bias) | Low risk | Intervention: 365 women allocated to intervention, 21 withdrew during pregnancy due to intrauterine death (n = 2), disabling disease (n = 2), emigration (n = 1) and 16 were lost to follow‐up; therefore, data from 344/365 intervention group women (94.2 %) were available for inclusion in the analyses for maternal outcomes reported. There were 3 pairs of twins born to the intervention group women; therefore, data from 347 intervention group infants were available for inclusion in the analysis for infant outcomes. Control: 371 women allocated to control, 22 withdrew during pregnancy due to intrauterine death (n = 2), disabling disease (n = 2), emigration (n = 2) and 16 were lost to follow‐up; therefore, data from 349/371 control group women (94%) were available for inclusion in the analyses for maternal outcomes reported. There were 2 pairs of twins born to the control group women; therefore, data from 351 control group infants were available for inclusion in the analyses for infant outcomes. Therefore, there were limited missing outcome data, and the missing data were balanced in numbers across intervention groups, with similar reasons for missing data across groups. |
| Selective reporting (reporting bias) | Low risk | No evidence of selective reporting; data for prespecified outcomes (according to published protocol, made available as supplementary material with the online paper), have been reported. Further, the protocol provides a detailed description of the planned analysis which is reflected in the reporting of results. |
| Other bias | Low risk | Baseline characteristics were similar between groups: Quotes: “The baseline characteristics of the pregnant women and their children showed that randomisation was not biased”. No indication of difference in intervention fidelity related to different levels of adherence between the 2 groups. |
| Methods | Further randomisation (4 arms) of Olsen 1992 (supplementation until birth versus supplementation until 30 days after giving birth) | |
| Participants | 44 women randomised Inclusion criteria: healthy pregnant women Exclusion criteria: not reported Setting: Aarhus, Denmark | |
| Interventions | SUPPLEMENTATION: omega‐3 (until birth) versus omega‐3 (continuing for 30 days after giving birth) versus olive oil versus no supplementation Group 1: omega‐3 (1.3 g EPA and 0.9 g DHA per day) as 4 x 1 g gelatine capsules with Pikasol (Lube A/S, Hadsund, Denmark) fish oil (32% EPA (20:5n‐3), 23% DHA, and 2 mg tocopherol/mL), stopping at birth: n = 11 Group 2: omega‐3 (1.3 g EPA and 0.9 g DHA per day) as 4 x 1 g gelatine capsules with Pikasol (Lube A/S, Hadsund, Denmark) fish oil (32% EPA (20:5n‐3), 23% DHA, and 2 mg tocopherol/mL), stopping 30 days after giving birth: n = 12 Group 3: 4 x 1 g capsules of olive oil per day (72% oleic acid (18:1n‐9) and 12% LA (18:2n‐6)), stopping at birth: n = 8 Group 4: no supplement, stopping 30 days after giving birth: n = 5 Timing of supplementation: from 30 weeks GA until birth or 30 days after giving birth DHA + EPA dose/day: high: 900 mg DHA + 1300 mg EPA | |
| Outcomes | Omega‐3 and lipid concentrations in breast milk | |
| Notes | Funding: The University of Aarhus (Aarhus, Denmark); Lube A/S ((Hadsund, Denmark), supplied Pikasol fish oil and olive oil capsules. Declarations of interest: not reported No outcomes able to be used in this review. | |
| Risk of bias | ||
| Bias | Authors' judgement | Support for judgement |
| Random sequence generation (selection bias) | Unclear risk | Quote: "randomly allocated" |
| Allocation concealment (selection bias) | Unclear risk | Quote: "randomly allocated" |
| Blinding of participants and personnel (performance bias) | Unclear risk | Partial (one group not supplemented; timing for omega‐3 groups not able to be blinded) |
| Blinding of outcome assessment (detection bias) | Unclear risk | Not reported |
| Incomplete outcome data (attrition bias) | High risk | 3/26 in the intervention groups and 6/18 in the control groups were lost to follow‐up (no reasons reported) |
| Selective reporting (reporting bias) | Unclear risk | Insufficient detail reported to determine confidently |
| Other bias | Low risk | Groups were similar for baseline characteristics with regard to maternal age at birth, and prepregnancy weight |
| Methods | RCT: PONCH (Pregnancy Obesity Nutrition and Child Health Study) | |
| Participants | 101 women randomised Inclusion criteria: pregnant women of normal weight (BMI 18.5 to 24.9), aged 20‐45 years Exclusion criteria: non‐European descent, self‐reported diabetes, use of neuroleptic drugs, and vegetarianism or veganism. Exclusion after study entry: women having a miscarriage, abortion, intrauterine fetal death, sudden infant death, twin pregnancy or giving birth before 34 weeks' gestation (n = 1 but not reported which group) Setting: Sahlgrenska University Hospital, Gothenburg, Sweden | |
| Interventions | DIETARY ADVICE: 3 fish meals a week versus control Group 1: dietary counselling (from registered dieticians): 3 sessions, 5 phone calls during pregnancy (from 8‐12 weeks GA). Participants were advised to eat 3 meals of fish a week, with advice on types of fish to consume to avoid pollutants, to generally lower sugar intake to reach < 10% energy; to eat 500 g of vegetables and fruits a day; to increase daily energy intake by 350 kcal in the second trimester and by 500 kcal in the third trimester: n = 49 Group 2: control group: study visit each trimester (not further described): n = 52 Timing of counselling: from 8‐12 weeks GA DHA + EPA dose/day: other: unable to determine | |
| Outcomes | Women/birth: fish intake; body composition; GWG; serum phospholipid fatty acids (in all 3 trimesters); fat mass (air‐displacement plethysmography); size, number and lipolytic activity of adipocytes; and adipokine release and density of immune cells and blood vessels in adipose tissue Babies/infants/children: birthweight (numerical results not reported) | |
| Notes | Funding: "Supported by grants from Novo Nordisk Foundation, the Swedish Research Council (No. 12206), the Swedish Research Council (Project No. 2013‐28632‐103061‐41), the Swedish Diabetes Association Research Foundation, the Swedish Federal Government under the LUA/ALF agreement, IngaBritt and Arne Lundbergs Foundation, Freemasonry Barnhus Board in Gothenburg, Olle Engkvist Building contractor Foundation (210/56) and Queen Silvia’s Jubilee Fund". Declarations of interest: none declared Women in the intervention group did not use supplements containing fish oil or omega‐3 fatty acids during pregnancy but in the control group, 1 woman in the first trimester, 2 in the second trimester and 4 women in the third trimester used these supplements. No outcomes could be used in this review. | |
| Risk of bias | ||
| Bias | Authors' judgement | Support for judgement |
| Random sequence generation (selection bias) | Low risk | Quote: “Randomization was done by a computerized program…matched for age, BMI and parity” |
| Allocation concealment (selection bias) | Unclear risk | Not reported |
| Blinding of participants and personnel (performance bias) | High risk | Not feasible to blind |
| Blinding of outcome assessment (detection bias) | Unclear risk | Not reported |
| Incomplete outcome data (attrition bias) | High risk | 66/101 (65%) attrition (complete measurements from all trimesters): 31/49 (63%) in the intervention group and 35/52 (67%) in the control group lost to follow‐up |
| Selective reporting (reporting bias) | Unclear risk | ‘Exclusions’ not always reported by intervention or control group; preterm < 37 weeks not reported; birthweight not fully reported |
| Other bias | Unclear risk | Baseline characteristics comparable except for women in the intervention reporting lower fish consumption and being shorter than women in the control group |
| Methods | RCT | |
| Participants | 68 women randomised Inclusion criteria: women 12‐14 weeks GA with a history of IUGR (birthweight < 10th centile), ± PIH* in the previous pregnancy; or chronic renal disease or placental abnormalities of an impaired uteroplacental circulation Exclusion criteria: women with diabetes, systemic lupus erythematosus or other connective tissue disease, or women who had already agreed to be treated with low dose aspirin because of their obstetric history Setting: University Hospital and regional hospitals in the north of the Netherlands *PIH defined as an increase in diastolic pressure of at least 25 mmHg during the course of pregnancy with a final diastolic pressure > 90 mmHg. | |
| Interventions | SUPPLEMENTATION: EPA + DHA versus placebo Group 1: EPA (n = 34 randomised; 32 analysed): 3 g/day, given as 12 capsules/day (each capsule contained 250 mg EPA); no information about the DHA content of the capsules Timing of supplementation: from 12‐14 weeks GA "onwards" ‐ until birth DHA + EPA content/day: high: DHA not stated + 3 g EPA | |
| Outcomes | Women/birth: PIH; preterm birth < 37 weeks; preterm birth < 34 weeks; antenatal hospitalisation; miscarriage; mode of birth; high uric acid; low platelets; 2nd trimester Hb decrease < 5%; duration of pregnancy; adverse effects Babies/infants/children: SGA (birthweight < 10th percentile); LGA (> 10th percentile); stillbirth; neonatal death; perinatal death | |
| Notes | Funding: not reported Declarations of interest: not reported Sample size estimate was based on the first randomised study of aspirin in high‐risk pregnancies. | |
| Risk of bias | ||
| Bias | Authors' judgement | Support for judgement |
| Random sequence generation (selection bias) | Unclear risk | Not reported |
| Allocation concealment (selection bias) | Low risk | Quote: "Randomisation was performed by the hospital pharmacy"; placebo capsules were identical to treatment capsules |
| Blinding of participants and personnel (performance bias) | Low risk | Identical placebos (not reported whether women could guess their treatment) |
| Blinding of outcome assessment (detection bias) | Low risk | Outcome assessments were blinded |
| Incomplete outcome data (attrition bias) | Unclear risk | 5/68 (7.3%) post‐randomisation exclusions: 2/34 in the EPA group due to non‐adherence and 3/34 in the placebo group (1 miscarriage and 2 due to non‐adherence). Non‐adherence was due to the perceived effects of nausea and vomiting. |
| Selective reporting (reporting bias) | Unclear risk | Most expected outcomes were reported, but GA was not reported as mean and SD. |
| Other bias | Unclear risk | Some baseline imbalance between groups: previous PIH in 24/32 women in the EPA group and 15/31 in the control group. |
| Methods | RCT: NCT00266825 (KUDOS) | |
| Participants | 350 women randomised Inclusion criteria: women who were English speaking, between 8 and 20 weeks of gestation, between 16 and 35.99 years of age, and planning to give birth at a hospital in the Kansas City metropolitan area Exclusion criteria: carrying more than 1 fetus, had pre‐existing diabetes mellitus or SBP ≥ 140 mmHg at enrolment, or had any serious health condition likely to affect the prenatal or postnatal growth and development of their offspring, including cancer, lupus, hepatitis, HIV/AIDS, or a diagnosed alcohol or chemical dependency, BMI ≥ 40 (self‐reported); taking DHA supplement 300 mg or more/day Characteristics: baseline DHA status mean 4.3 [1] g/100 g total fatty acids; 42% women enrolled in KUDOS were African‐American which is higher than the national average of 16% Setting: Kansas City metropolitan area, KS, USA. Study conducted from January 2006 and October 2011. | |
| Interventions | SUPPLEMENTATION: omega‐3 (DHA) versus placebo Group 1: 600 mg DHA/day: 3 capsules/day of a marine algae‐oil source of DHA (200 mg DHA/capsule) DHASCO; n = 178 Group 2: placebo: 3 capsules containing half soybean and half corn oil. The placebo capsules did not contain DHA but did contain a‐linolenic acid; n = 172. Timing of supplementation: < 20 weeks (˜14 weeks GA) until birth DHA + EPA dose/day: mid: 600 mg DHA + EPA negligible | |
| Outcomes | Women/birth: adherence; DHA concentrations (maternal and cord blood); DHA concentrations (by FADS genotypes in a subset of 250 women); length of gestation; miscarriage; severe PE; gestational diabetes; caesarean section; maternal adverse effects; PPH; placental abruption; preterm birth < 37 weeks; early preterm birth < 34 weeks; low birthweight; very low birthweight; antenatal hospital admission; PPROM; GWG, costs. Babies/infants/children: birthweight; birth length; head circumference at birth; ponderal index; NICU admissions, length of hospital stay; mortality; congenital anomalies; visual habituation at 4, 6 and 9 months; and at 5 years, fat mass; fat‐free mass; body fat; weight; height, BMI Z‐score | |
| Notes | Adherence: "Capsule compliance was similar for the 2 groups: placebo (76% consumed) and DHA (78% consumed)”. Funding: NIH (R01 HD047315) and the Office of Dietary Supplements; Kansas Intellectual and Developmental Disabilities Research Center (P30 HD02528). DSM Nutritional Products (formerly Martek Biosciences) donated the placebo and DHA capsules. Declarations of interest: "SEC has given talks for several companies, including Martek, Mead Johnson Nutrition, and Nestle on results from our studies and the results of others who study the effects of DHA on infant and child outcomes. She is the President of the International Society for the Study of Fatty Acids and Lipids, which has corporate members who produce sources of DHA. JC consults with several companies on developmental measures to assess cognitive development of infants and children. None of the other authors declared a potential conflict of interest.” | |
| Risk of bias | ||
| Bias | Authors' judgement | Support for judgement |
| Random sequence generation (selection bias) | Low risk | Quote: "The study biostatistician generated randomization schedules for 2 maternal age groups (16–25.99 and 26–35.99 y), and each sequence of 8 random numbers included 4 assignments per group to stratify by age and treatment” |
| Allocation concealment (selection bias) | Low risk | Quote: “The Investigational Pharmacy personnel assigned women to placebo or DHA based on the age shared by the study personnel” |
| Blinding of participants and personnel (performance bias) | Low risk | Quote: “Participants and data collectors were blinded to allocation, as were all investigators until children were 18 mo of age and had completed early cognitive and visual acuity development testing” |
| Blinding of outcome assessment (detection bias) | Low risk | Quote: “Participants and data collectors were blinded to allocation, as were all investigators until children were 18 mo of age and had completed early cognitive and visual acuity development testing” |
| Incomplete outcome data (attrition bias) | Unclear risk | 24/178 (13.5%) lost from DHA group:
25/172 (14.5%) lost from placebo group:
At 5‐year follow‐up, data were available for 88 children in the omega‐3 group and 83 children in the placebo group, equating to 179/350 (51%) lost to follow‐up. |
| Selective reporting (reporting bias) | Low risk | Most expected outcomes were reported. |
| Other bias | Low risk | No apparent source of other bias. |
| Methods | RCT (pilot): NCT00333554 | |
| Participants | 41 infants (randomised during pregnancy). A further 21 mothers (˜33%) received either DHA or placebo during their last trimester, but discontinued post birth. Inclusion criteria: women 18 years of age or older, from 24 weeks GA whose babies may be at higher risk for T1D based on family history (had T1D, or child’s father or a full or half sibling of the child had T1D) Exclusion criteria: any condition investigators believed would put the mother or her fetus at an unacceptable medical risk; known complication of pregnancy causing an increased risk for the mother of fetus prior to entry into the study; have previously had 2 or more preterm births (< 36 weeks); were diabetic and had a known HbA1c > 9% at any time during the pregnancy, plan to take DHA during the pregnancy Setting: 9 clinical sites across USA | |
| Interventions | SUPPLEMENTATION: DHA versus placebo Group 1: algal DHA daily while pregnant and lactating (if choosing to breastfeed); 800 mg DHA per day (4 capsules); infant received ˜ 150 mg/day from mother or from formula; then 400 mg/day as toddlers (1‐2 years of age): total number randomised: n = unclear (21 reported) Group 2: corn/soy oil (placebo): total number randomised: n = unclear (16 reported) Timing of supplementation: supplementation began immediately after randomisation (start of third trimester of pregnancy) and continued at least until the HLA type of the infant was known; if an infant entered the study antenatally, duration of supplementation would be a minimum of 36 months DHA + EPA dose/day: mid: 800 mg DHA + EPA negligible | |
| Outcomes | Women/birth: breastmilk DHA Babies/infants/children: RBC DHA, IL 1‐betaC, CRP and other inflammatory mediators; infant vitamin D | |
| Notes | Funding: NIDDK branch of the NIH, the ADA, and the Juvenile Diabetes Research Foundation (JDRF). Supplements from DHASCO‐S oil, Martek Biosciences Corporation, Columbia, MD Declarations of interest: not reported No outcomes could be used in this review | |
| Risk of bias | ||
| Bias | Authors' judgement | Support for judgement |
| Random sequence generation (selection bias) | Unclear risk | Not reported |
| Allocation concealment (selection bias) | Unclear risk | Quote: "randomly assigned" |
| Blinding of participants and personnel (performance bias) | Unclear risk | Quote: "double blinded" |
| Blinding of outcome assessment (detection bias) | Unclear risk | Not reported |
| Incomplete outcome data (attrition bias) | Unclear risk | Not fully reported |
| Selective reporting (reporting bias) | Unclear risk | Limited number of outcomes reported |
| Other bias | Unclear risk | Insufficient information to determine |
| Methods | RCT (3 arms) | |
| Participants | 100 women (from 2 of the 3 arms) Inclusion criteria: primiparous and multiparous women, aged 14‐40 years and ≤ 16 weeks' gestation. Exclusion criteria: none reported Characteristics: 76% had a recent history of malaria or fever of unknown origin, 34% had a history of sickle cell trait or disease, 37% had a history of anaemia, 21% had a history of pregnancy hypertension or other hypertension and 4% had a previous preterm birth. Setting: Luanda, Angola | |
| Interventions | SUPPLEMENTATION + OTHER AGENT: GLA + EPA + DHA (omega 6/omega 3) versus placebo Group 1: 8 capsules/day evening primrose oil + fish oil, providing a total of 296 mg GLA, 144 mg EPA and 80 mg DHA/day: total number randomised = 50 (The third arm (magnesium oxide: n = 50) was not considered for this review): Timing of supplementation: 6 months DHA + EPA dose/day: low: 80 mg DHA + 144 mg EPA | |
| Outcomes | Women: PIH, PE (hypertension (rise in SBP > 30 mmHg and/or a rise in DBP > 15 mmHg); oedema (visible fluid accumulation in the ankles and feet), and proteinuria (protein > 1 determined by test tape) any time during the pregnancy), eclampsia. | |
| Notes | Funding: GLA, EPA, DHA tablets and placebo tablets were prepared by Efamol Research Institute and Efamol Ltd Declarations of interest: not reported Reported dietary intake of women in all groups at study entry was poor. | |
| Risk of bias | ||
| Bias | Authors' judgement | Support for judgement |
| Random sequence generation (selection bias) | Low risk | Women "randomly assigned using a random number table" |
| Allocation concealment (selection bias) | Low risk | Quote: "the code of the capsules was not made known by the manufacturer, until the end of the treatment period" |
| Blinding of participants and personnel (performance bias) | Low risk | Olive oil and evening primrose oil + fish oil capsules identical (but both different to magnesium oxide), so fully blinded with regard to the fish oil/evening primrose and placebo comparison. |
| Blinding of outcome assessment (detection bias) | Low risk | Outcome assessments partially blinded ‐ olive oil and evening primrose oil + fish oil capsules identical (but both different to magnesium oxide), so fully blinded with regard to the fish oil/evening primrose and placebo comparison. |
| Incomplete outcome data (attrition bias) | Unclear risk | Not specifically reported |
| Selective reporting (reporting bias) | Unclear risk | Outcomes such as preterm birth and perinatal mortality were not reported |
| Other bias | Unclear risk | Baseline nutritional profiles (determined by dietary recall) differed (placebo group higher caloric intake; higher animal protein; higher total fat; higher “fish fat”; higher cholesterol; higher fibre; higher potassium) |
| Methods | RCT: parallel | |
| Participants | 79 women randomised Inclusion criteria: white origin, GA < 14 weeks, normal health (not suffering from any hypertensive, metabolic, cardiovascular, renal, psychiatric, or neurologic disorder), fish consumption < 2 times per week Exclusion criteria: DBP > 90 mmHg, multiple pregnancy, use of medications, use of (LC)PUFA rich supplements, origin other than Caucasian Setting: region around Maastricht, Heerlen and Sittard in the Netherlands | |
| Interventions | SUPPLEMENTATION/ENRICHMENT: ALA + LA versus LA (in margarine) Group 1: ALA: daily ≥ 25 g ALA‐enriched high‐LA margarine from week 14 of pregnancy until birth (with the requested intake of 25 g margarine/day women consumed 2.82 g ALA + 9.02 g LA per day) ‐ 40 women randomised; 29 analysed Group 2: No ALA: daily ≥ 25 g of high‐LA margarine without ALA from week 14 of pregnancy until birth (with the requested intake of 25 g of margarine/day women consumed 10.94 g LA and 0.03 g ALA per day) ‐ 39 women randomised; 29 analysed All women: every 3 weeks the volunteers received 3 tubs each containing 250 g margarine. Women were instructed to consume the margarine primarily on bread (if consumption was lower than required, they were advised to put it on top of potatoes or pasta; they were not allowed to use it for baking because of possible adverse effects on the polyunsaturated fatty acid content of the margarine). They were allowed to maintain their usual diets during the course of the study, with the exception of the use of butter/their usual margarine. Timing of supplementation: from 14 weeks GA to birth DHA + EPA dose/day: other (2.82 g ALA) | |
| Outcomes | Women/birth: maternal cognitive functioning; caesarean section; gestational diabetes; depression (postnatal); antenatal admission to hospital (long‐term hospitalisation); gestational length; fatty acid concentrations; breastfeeding Babies/infants/children: preterm birth < 36 weeks; stillbirth; birthweight; Apgar score | |
| Notes | Funding: grant from Unilever Research and Development (Vlaardingen, Netherlands), which also donated the margarines used in the study. Declarations of interest: none declared by authors of main reference, not reported in other references | |
| Risk of bias | ||
| Bias | Authors' judgement | Support for judgement |
| Random sequence generation (selection bias) | Unclear risk | Quote: "randomly allocated"; no further details reported |
| Allocation concealment (selection bias) | Unclear risk | Quote: "randomly allocated"; no further details reported |
| Blinding of participants and personnel (performance bias) | Unclear risk | Described as "double blind"; no further details reported |
| Blinding of outcome assessment (detection bias) | Unclear risk | Not reported |
| Incomplete outcome data (attrition bias) | High risk | 21/79 (27%) women were lost to follow‐up: 11 from the ALA group:
10 in the no ALA group:
After giving birth, a further 2 women were lost to follow‐up, both in the ALA group (1 moved away; 1 postnatal depression). |
| Selective reporting (reporting bias) | Unclear risk | Not all expected outcomes were reported; some outcomes treated as exclusions and therefore may be incompletely reported |
| Other bias | Unclear risk | More breastfeeding mothers in the ALA group |
| Methods | RCT: NCT02371343 (MaFOS‐GDM) | |
| Participants | 140 women randomised Inclusion criteria: pregnant women, 18‐40 years old, between 24‐28 weeks GA, residents of one of the study centres, planning to remain in the area for the next year, subsequently diagnosed with gestational diabetes mellitus Setting: three tertiary maternity and children's hospitals from different regions in Turkey (trial conducted from January 2015 to January 2017) | |
| Interventions | SUPPLEMENTATION: EPA + DHA versus placebo Group 1: omega‐3 LCPUFA 1200 mg/day: 384 mg EPA; 252 mg DHA (Ocean Plus): n = 70 Group 2: placebo (sunflower oil ‐ similar in appearance and taste to the fish oil capsules): n = 70 Timing of supplementation: from 26‐27 weeks till birth (˜ 9 weeks) DHA + EPA dose/day: mid: 252 mg DHA + 384 mg EPA | |
| Outcomes | Women/birth: GWG; caesarean; preterm birth < 37 weeks Babies/infants/children: cord Insulin‐like growth factor 1 (IGF)‐1 DNA methylation; birth weight; macrosomia (> 90th percentile for GA); head circumference at birth; hospitalisation (not further specified) | |
| Notes | Funding: Republic of Turkey Ministry of Health Central Directorate for Health Research Declaration of interest: authors declared no conflict of interest | |
| Risk of bias | ||
| Bias | Authors' judgement | Support for judgement |
| Random sequence generation (selection bias) | Unclear risk | Quote: "balanced blocks" |
| Allocation concealment (selection bias) | Unclear risk | Quote: "sealed envelopes" |
| Blinding of participants and personnel (performance bias) | Low risk | Quote: placebo‐controlled |
| Blinding of outcome assessment (detection bias) | Unclear risk | Not reported |
| Incomplete outcome data (attrition bias) | High risk | Omega‐3 LCPUFA: 18/70 lost to follow‐up or refused to continue Placebo: 2/70 refused to continue Judged to be at high risk due to differential rates of losses between omega‐3 and placebo groups (also see other bias text). |
| Selective reporting (reporting bias) | Unclear risk | Limited number of pregnancy outcomes reported |
| Other bias | Unclear risk | No apparent evidence of other bias, though GDM was more often managed by diet only in the omega‐3 group than in the ‐placebo group |
| Methods | RCT: ACTRN12611000041954 | |
| Participants | 98 women randomised Inclusion criteria: all women had a history of physician‐diagnosed allergic rhinitis and/or asthma and 1 or more positive skin prick test to common allergens, but who were otherwise healthy, with healthy full‐term infants; and recruited < 20 weeks GA. Exclusion criteria: normal consumption of fish meals exceeding 2 per week, women who smoked, had other medical problems, complicated pregnancies, seafood allergy Setting: antenatal clinic, St John of God Hospital, Perth, Western Australia | |
| Interventions | SUPPLEMENTATION: DHA + EPA versus olive oil Group 1: omega‐3 LCPUFA: 3300 mg/day (DHA 2200 mg/day): 4 (x 1 g) omega‐3 LCPUFA capsules comprising 2.07 g DHA and 1.03 g EPA per day (total number randomised = 52) Group 2: control: 4 (x 1 g) capsules of olive oil per day containing 66.6% omega‐9 oleic acid and < 1% omega‐3 LCPUFAs (total number randomised = 46) Timing of supplementation: 20 weeks GA to birth DHA + EPA dose/day: high: 2.07 g DHA + 1.03 g EPA | |
| Outcomes | Women/birth: food frequency questionnaire (20 and 30 weeks GA); adherence; allergen‐specific T‐cell responses in cord blood, neonatal cord blood CD4+ T‐cell DNA methylation; fatty acid composition (including in breast milk), length of gestation, elective caesarean, spontaneous labour, induction; maternal BP; pregnancy weight gain (subsample in Keelan 2015); Beck Depression Inventory (depressed mood = score ≥ 10) (not reported by randomised groups) Babies/infants/children:
| |
| Notes | Funding: National Health and Medical Research Council of Australia (APP139025 and APP1010495); National Heart Foundation of Australia (G 09P 4280); Raine Medical Research Foundation; Ada Bartholomew Trust; and McMaster University. Dr Janet Dunstan was supported by the Child Health Research Foundation of Western Australia Women and Infants Research Foundation. | |
| Risk of bias | ||
| Bias | Authors' judgement | Support for judgement |
| Random sequence generation (selection bias) | Unclear risk | Not reported |
| Allocation concealment (selection bias) | Low risk | Quote: "Randomization and allocation of capsules occurred at a different centre separate from the recruitment of participants. Capsules were administered to the participants by someone separate from those doing the allocation"; and, “staff dispensing the capsules were blinded to the allocation”. |
| Blinding of participants and personnel (performance bias) | Low risk | Participants, research scientists and paediatrician remained blinded to group allocations for the duration of the study. |
| Blinding of outcome assessment (detection bias) | Low risk | Not reported but probably done |
| Incomplete outcome data (attrition bias) | Unclear risk | Birth: 15/98 (15%) excluded or lost to follow‐up: From the omega‐3 group 12/52 (23%):
From the placebo group 3/46 (7%):
Child follow‐up at 2.5 years: 26/98 (27%) lost to follow‐up: From the omega‐3 group 12 (plus a further 7 = 19/52 (37%)):
From the placebo group 3 (plus a further 4 = 7/52 (13%)):
|
| Selective reporting (reporting bias) | Unclear risk | Some outcomes (e.g. preterm births) treated as exclusions. |
| Other bias | Unclear risk | Possible baseline imbalance with 52 and 46 randomised. |
| Methods | RCT: parallel | |
| Participants | 40 women randomised Inclusion criteria: women with severe gestational proteinuric hypertension (BP > 140/90; proteinuria > 0.3 g/24 hour) Exclusion criteria: not reported Setting: University of Witwatersrand and the South African Institute for Medical Research, Johannesburg, South Africa | |
| Interventions | SUPPLEMENTATION: EPA versus placebo Group 1: EPA 3 g/day: total number randomised = 20* Group 2: placebo (not further described): total number randomised = 20* Timing of supplementation: not reported DHA + EPA dose/day: high: 3 g EPA; DHA not stated *assumed, not specifically stated. | |
| Outcomes | Women/birth: requirement for pregnancy to be terminated; mean time to termination of pregnancy; amount of proteinuria; platelet and serum membrane EPA in first 2 weeks of treatment; amount hypertensive therapy required; Babies/infants/children: birthweight | |
| Notes | Funding: not reported Declarations of interest: not reported | |
| Risk of bias | ||
| Bias | Authors' judgement | Support for judgement |
| Random sequence generation (selection bias) | Unclear risk | Not reported |
| Allocation concealment (selection bias) | Unclear risk | Quote: "prospective randomized double blind trial” |
| Blinding of participants and personnel (performance bias) | Unclear risk | Quote: "prospective randomized double blind trial”; no details about the placebo were reported. |
| Blinding of outcome assessment (detection bias) | Unclear risk | Not reported |
| Incomplete outcome data (attrition bias) | Unclear risk | 3/20 women in the EPA arm and 2/20 in the placebo arm required termination of pregnancy due to fulminating hypertension in the first week and were subsequently excluded from analysis. |
| Selective reporting (reporting bias) | Unclear risk | Only a few outcomes reported fully. |
| Other bias | Low risk | The 2 groups were similar in terms of maternal age, GA, level of hypertension and amount of proteinuria at baseline. |
| Methods | RCT: parallel | |
| Participants | 59 women randomised (25 were pregnant and thus only these women were eligible for this review) Inclusion criteria: perinatal women (pregnant (n = 25) and postpartum (n = 34) with major depressive disorder, 12‐32 weeks GA or postpartum (within 6 months of childbirth); 18‐45 years of age; scored ≥ 9 on EPDS, outpatient status Exclusion criteria: previous intolerance to omega‐3 fatty acids, current use of antidepressants or anticoagulants, psychosis, diagnosis of bipolar disorder, active substance use, or active suicidal ideation. Setting: University of Arizona, USA | |
| Interventions | SUPPLEMENTATION: EPA + DHA versus placebo Group 1: EPA + DHA: 1.9 g/day (1.1 g EPA and 0.8 g DHA, total 4 capsules/day) for 8 weeks: total 12 pregnant women randomised Group 2: placebo: corn oil with a small amount of fish oil for 8 weeks: total 13 pregnant women randomised (9 completed study) Timing of supplementation: pregnant women: from 12‐32 weeks GA All women: were provided with manualised supportive psychotherapy DHA + EPA dose/day: high: 0.8 g DHA + 1.1 g EPA | |
| Outcomes | Women/birth: Hamilton Rating Scale Depression (HAM‐D) biweekly; Edinburgh Postnatal Depression Scale (EPDS) biweekly; Clinical Global Impression; tolerability of omega‐3 | |
| Notes | Funding: NIMH K23MH066265; Pronova/EPAX provided study drug and placebo at no cost. Declarations of interest: Dr Marlene Freeman: Research support: NIMH, U.S. FDA, Institute for Mental Health Research (Arizona), Forest, Reliant, Lilly; honorarium from AstraZeneca; Dr Katherine Wisner: Research support: NIMH, Stanley Medical Research Foundation, New York‐Mid Atlantic Consortium for Genetics and Newborn Screening Services (NYMAC), State of Pennsylvania, American Society for Bariatric Surgery, Pfizer, Wyeth (pending) Dr Alan Gelenberg: Consultantships: Eli Lilly, Pfizer, Best Practice, Astra/Zeneca, Wyeth, Cyberonics, Novartis, Forest, GlaxoSmithKline; Stock Options: Vela Pharmaceuticals; Speakers Bureau: Pfizer Pharmaceuticals, GlaxoSmithKline Dr Joseph Hibbeln, Dr. Priti Sinha, Dr Melinda Davis: nothing to disclose | |
| Risk of bias | ||
| Bias | Authors' judgement | Support for judgement |
| Random sequence generation (selection bias) | Unclear risk | Described as randomised; no further details reported |
| Allocation concealment (selection bias) | Unclear risk | Described as randomised; no further details reported |
| Blinding of participants and personnel (performance bias) | Low risk | Placebo‐controlled |
| Blinding of outcome assessment (detection bias) | Low risk | Not reported, but probably done. |
| Incomplete outcome data (attrition bias) | High risk | 7/59 women dropped out after the baseline visit; a further woman was diagnosed with hyperthyroidism after randomisation and was then excluded as being ineligible (leaving 51 women who completed at least 2 assessments) – 21 of these women were pregnant meaning 4/25 (16%) pregnant women were lost to follow‐up (all 4 were from the placebo group). |
| Selective reporting (reporting bias) | High risk | Few outcomes were reported |
| Other bias | Unclear risk | Some baseline differences – omega‐3 group more likely to be Caucasian; and to enrol earlier in their pregnancy and more likely to take antidepressants |
| Methods | RCT: NCT00892684 | |
| Participants | 145 women randomised Inclusion criteria: women affected by allergies themselves, or having a husband or an older child with current or previous allergic symptoms, i.e. bronchial asthma diagnosed by a doctor, atopic eczema, allergic food reactions, itching and running eyes and nose on exposure to pollen, pets or other known allergens. Exclusion criteria: mothers with an allergy to soy or fish or undergoing treatment with anticoagulants or commercial omega‐3 fatty acid supplements Characteristics: 73% of women in the omega‐3 group and 63% in the placebo group had allergic symptoms; average registered dietary intake of DHA and EPA at inclusion was 0.2 g/day and 0.1 g/day, respectively, thus the daily dose of omega‐3 LCPUFA was increased 8–10 times by the supplementation (this corresponds to a meal of approximately 100 g salmon daily). Setting: Linköping and Jönköping, Sweden | |
| Interventions | SUPPLEMENTATION: EPA + DHA versus placebo (soy oil) Group 1: EPA/DHA: 9 x 500 mg capsules a day containing 35% EPA, and 25% DHA, to provide 1.6 g of EPA and 1.1 g of DHA; plus 28 mg alphatocopherol: total number randomised = 70 Group 2: placebo: 9 soy oil capsules a day, containing 58% LA to provide 2.5 g LA/day and 6% ALA to provide 0.28 g ALA/day, plus 36 mg alphatocopherol: total number randomised = 75 Timing of supplementation: 25 weeks GA to birth, and encouraged to continue during lactation (average 3‐4 months). DHA + EPA dose/day: high: 1.1 g DHA + 1.6 g EPA | |
| Outcomes | Women/birth: GA at birth; maternal BMI at end of gestation; breastfeeding duration; diet at 6 months postpartum Babies/infants/children: birthweight; Apgar scores at 10 minutes; medically diagnosed allergy outcomes at 3, 6, 12 months and 2 years of age including: IgE antibody analysis, food allergy and eczema | |
| Notes | Funding: Medical Research Council of Southeast Sweden (FORSS), The Östergötland County Council, The Ekhaga Foundation, Swedish Asthma and Allergy Association, The Swedish Research Council for Environment, Agricultural Sciences and Spatial Planning (FORMAS), The Swedish Society of Medicine and Glaxo Smith Kline, Sweden; Bio Marin capsules were supplied at a reduced price from Pharma Nord, Denmark. Declarations of interest: none declared | |
| Risk of bias | ||
| Bias | Authors' judgement | Support for judgement |
| Random sequence generation (selection bias) | Unclear risk | Quote: "block randomization" |
| Allocation concealment (selection bias) | Unclear risk | Quote: "randomly allocated" |
| Blinding of participants and personnel (performance bias) | Low risk | Placebo‐controlled; however women may have been able to detect if they were in the omega‐3 group through fishy burps. |
| Blinding of outcome assessment (detection bias) | Low risk | Outcome assessors were blinded. |
| Incomplete outcome data (attrition bias) | Unclear risk | Total 28/145 (19%) women not included in analysis: 25 women did not complete the requested 15 week intervention period (16, 23% omega‐3 and 9, 12% placebo) and were excluded from the analysis, 1 withdrew postpartum, 2 not followed as moved (group not stated). 2 year follow‐up: 17/70 omega‐3 group (24%) and 12/75 (16%) placebo group were lost to follow‐up |
| Selective reporting (reporting bias) | Unclear risk | Mostly allergy outcomes; some child development outcomes not fully reported |
| Other bias | Low risk | Maternal LA and AA levels at study entry inclusion were not equal in the 2 groups |
| Methods | RCT: ISRCTN39268609 | |
| Participants | 43 women randomised Inclusion criteria: women at high risk of preterm birth (history of previous IUGR, fetal demise or PE) with 1 or more previous preterm birth and/or ultrasonographic findings of cervical incompetence Exclusion criteria: a non‐viable fetus (before or after randomisation), a history of placental abruption, bleeding episode in the present pregnancy, use of (or used) PG inhibitors, multiple pregnancy, allergy to fish, regular intake of fish oil, a positive cervical swab for chlamydia, mycoplasma/ureaplasma and bacterial vaginosis infections, major fetal abnormalities. Setting: Artemisia Medical Centre, Rome, Italy | |
| Interventions | VAGINAL APPLICATION: DHA versus placebo Group 1: DHA (1 g/day) vaginally: n = 22 Group 2: placebo vaginally: n = 21 Timing: from 21 weeks to 37 weeks 0 days DHA + EPA dose/day: high: 1 g DHA | |
| Outcomes | Women/birth: GA at birth Babies/infants/children: birthweight | |
| Notes | Funding: Pharmarte Srl (Italy) and sponsors Italian Society of Prenatal Diagnosis and Fetal Maternal Medicine (S.I.Di.P.) (Italy) and the Artemisia Foundation in Fetal‐Maternal Medical Research. The authors report that the funders had no role in data collection, data analysis, data interpretation or writing of the report. | |
| Risk of bias | ||
| Bias | Authors' judgement | Support for judgement |
| Random sequence generation (selection bias) | Low risk | Quote: "customised randomisation programme that generated a random number for each participant, with equal ratio of selection" |
| Allocation concealment (selection bias) | Unclear risk | Not reported |
| Blinding of participants and personnel (performance bias) | Low risk | Physicians and women were blinded to treatment. |
| Blinding of outcome assessment (detection bias) | Low risk | Not reported, but probably done. |
| Incomplete outcome data (attrition bias) | Unclear risk | 1 woman in the omega‐3 group was lost to follow‐up (1/22); and women whose condition worsened were taken off treatment (1/22 in the omega‐3 group and 7/21 in the placebo group). |
| Selective reporting (reporting bias) | Unclear risk | Birthweight was only reported for women who gave birth at 37 weeks' gestation or later (and was therefore not included in the meta‐analysis). |
| Other bias | Low risk | No apparent risk of other bias. |
| Methods | RCT: NCT01007110 (HOPE) | |
| Participants | 67 women randomised Inclusion criteria: women 16 to < 40 years old with a singleton pregnancy, 12‐20 weeks GA Exclusion criteria: any serious health condition likely to affect the growth and development of the fetus or the health of the mother including cancer, lupus, hepatitis, diabetes mellitus (type 1, 2 or gestational) or HIV/AIDS at baseline. Women who self‐reported illicit drug use or alcohol use during pregnancy and those with hypertension or BMI ≥ 40 were excluded. Women who were taking more than 200 mg/day DHA in prenatal vitamins or over‐the‐counter supplements were excluded from participation. Setting: Kansas City, Kansas, USA | |
| Interventions | SUPPLEMENTATION: DHA versus placebo Group 1: DHA 600 mg/day: contained 500 mg of oil: algal oil as a source of DHA (200 mg of DHA per capsule; 3 capsules a day): total number randomised = 35 Group 2: placebo (3 placebo capsules a day containing 50% soy and 50% corn oil): total number randomised = 32 Timing of supplementation: 14.4 weeks GA ± 4 weeks; women were advised to stop taking capsules once they had given birth DHA + EPA dose/day: mid: 600 mg DHA + EPA negligible | |
| Outcomes | Women/birth: DHA RBC concentrations; GA at birth Babies/infants/children: fetal heart rate, heart rate variability (at 24, 32 and 36 weeks GA); birthweight; birth length; DHA RBC concentrations; NBAS at 1‐14 days postpartum | |
| Notes | Funding: Eunice Kennedy Shriver National Institute of Child Health and Development, Kansas Intellectual Development and Disabilities Research Center; study product donated by DSM Nutritional Products (P30NICHDHD002528). Declarations of interest: not reported | |
| Risk of bias | ||
| Bias | Authors' judgement | Support for judgement |
| Random sequence generation (selection bias) | Low risk | Computer‐generated random sequence |
| Allocation concealment (selection bias) | Low risk | Quote: “only members of the investigational pharmacy knew the subject allocation” |
| Blinding of participants and personnel (performance bias) | Low risk | Participants and all members of the investigational team were blinded to the intervention assignment. |
| Blinding of outcome assessment (detection bias) | Unclear risk | Not reported ‐ insufficient information to make any judgement. |
| Incomplete outcome data (attrition bias) | Unclear risk | 33% loss to follow‐up overall: to birth (23/69): In the control group, 8/32 (25%):
In the DHA group: 13/35 (37%):
NBAS: a further 12 from the control group and a further 7 from the DHA group did not have NBAS assessments |
| Selective reporting (reporting bias) | High risk | Few maternal and birth outcomes reported |
| Other bias | Low risk | Maternal characteristics at trial entry were similar, no other sources of bias were apparent. |
| Methods | RCT: NCT00957476 | |
| Participants | 72 women randomised Inclusion criteria: overweight/obese pregnant women (BMI ≥ 25 at first antenatal visit); singleton pregnancy and GA between 8 weeks and 16 weeks Exclusion criteria: known fetal anomaly, regular intake of fish oil supplements (> 500 mg per week in the previous 4 weeks), daily use of NSAIDs; pre‐existing metabolic disorder such as hypertension, diabetes or hyperthyroidism; allergy to fish or fish products; gluten intolerance; women who are vegetarians and do not eat any fish; planned termination of pregnancy or birth at another hospital; known HIV‐positive, illicit drug or alcohol use during current pregnancy Setting: MetroHealth Medical Center, Ohio, USA (participants recruited September 2009 to August 2011) | |
| Interventions | SUPPLEMENTATION: DHA + EPA versus placebo Group 1: DHA plus EPA (total 2 g/day): 800 mg DHA (22:6n‐3) and 1200 mg EPA (20:5n‐3): 4 capsules (2 x twice a day). Total number randomised: n = 36 (25) Group 2: placebo (2 capsules twice a day); contains wheat germ oil. Total number randomised: n = 36 (25) Timing of supplementation: weeks 10‐16 to term DHA + EPA dose/day: high: 800 mg DHA + 1200 mg EPA | |
| Outcomes | Women/birth: length of gestation; maternal plasma omega‐3 and omega‐6 concentrations; CRP; TLR4, IL6, IL8 (in adipose and placental tissue); glucose concentrations; insulin sensitivity (narrative report only); adiponectin; leptin; spontaneous abortions; stillbirth; gestational diabetes; placental gene expression; placental triglycerides Babies/infants/children: birthweight; neonatal lean mass; fat mass; body fat; pea pod lean mass; pea pod fat mass; pea pod body fat | |
| Notes | Notes relating to intervention: adherence run‐in: consenting eligible women were given 1 week’s supply of placebo capsules; they were not allowed to participate in the trial if they did not return or if they had taken < 50% of the placebo capsules. Funding: NIH RHD057236. Emiment supplied the study supplements. Declarations of interest: "The authors declared that they have no conflicts of interest". | |
| Risk of bias | ||
| Bias | Authors' judgement | Support for judgement |
| Random sequence generation (selection bias) | Low risk | Computerised random number generation |
| Allocation concealment (selection bias) | Low risk | Quote: "Randomization and treatment assignment were carried out by the research coordinators" Probably done |
| Blinding of participants and personnel (performance bias) | Low risk | Quote: "Study group assignment was not known by study participants, their health care providers, or the research staff" |
| Blinding of outcome assessment (detection bias) | Low risk | Not reported but probably done |
| Incomplete outcome data (attrition bias) | High risk | 21/72 (29%) attrition: Omega‐3 group, lost 10:
Control group, lost 11:
|
| Selective reporting (reporting bias) | Unclear risk | Few maternal, birth and neonatal outcomes reported |
| Other bias | Unclear risk | Baseline characteristics were similar except for higher average weight (but not BMI) in the omega‐3 group. |
| Methods | RCT: NCT00135902 | |
| Participants | 852 women randomised Inclusion criteria: women with at least 1 prior spontaneous preterm birth; singleton pregnancies; GA at randomisation between 16 and 22 (21 6/7) weeks. An US examination was required between 14 weeks GA and enrolment to screen for major anomalies. Exclusion criteria: major fetal anomaly or demise; regular intake of fish oil supplements (> 500 mg per week at any time during the preceding month); daily use of NSAIDs; allergy to fish or fish products; gluten intolerant; heparin use or known thrombophilia; haemophilia; planned termination; current hypertension or current use of antihypertensive medications; uncontrolled thyroid disease; type D, F or R diabetes; maternal medical complications; current or planned cerclage; illicit drug or alcohol abuse during current pregnancy; plan to, or give birth at a non‐network hospital; participation in another pregnancy intervention study; participation in this trial in a previous pregnancy; seizure disorder. Characteristics: 30% women never consumed fish or consumed fish < once per month; 9% consumed fish > 3 times a week. Setting: antenatal clinics in 13 network centres, USA: recruitment between January 2005 and October 2006 | |
| Interventions | SUPPLEMENTATION: DHA + EPA + PG versus placebo + PG Group 1: 1200 mg EPA; 800 mg DHA for a total of 2000 mg of omega‐3 long‐chain polyunsaturated acids, divided into 4 capsules per day: total number randomised: n = 434 (Source of omega‐3 LCPUFA was deep ocean fish; each capsule contained 10 IU of vitamin E as a preservative.) Group 2: matching placebo (4 capsules containing a minute amount of inert mineral oil per day). Total number randomised: n = 418 Timing of supplementation: 16‐22 weeks GA (mean 19.6 weeks) to 36 weeks GA All women: received 17α‐hydroxyprogesterone caproate (weekly intramuscular injections: 250 mg); participants received no dietary advice as part of the study and otherwise received usual clinical care. DHA + EPA dose/day: high: 800 mg DHA + 1200 mg EPA | |
| Outcomes | Women/birth: fatty acid status; diet (fish intake); DNA; PE; PPH; adverse events; gestational diabetes; preterm birth < 37 weeks; spontaneous preterm birth < 37 weeks; preterm birth < 34 weeks; birth > 40 weeks; low birthweight < 2500 g; SGA; LGA; GA reported as IQR Babies/infants/children: birthweight (median); NEC; RDS (clinical diagnosis of RDS and oxygen therapy (FiO2 > 0.40); neonatal sepsis; BPD; ROP, IVH, perinatal mortality (pregnancy loss and neonatal death); NICU/intermediate care nursery admission; neonatal morbidity composite (ROP, grade III or IV IVH, Patent ductus arteriosus, NEC, culture‐proven sepsis, respiratory morbidity, and perinatal death) | |
| Notes | Compliance run‐in: consenting women received an injection of 250 mg 17α‐hydroxyprogesterone caproate (17P) and a 7‐day supply of placebo capsules. Those who did not return after 5 days and before 21 6/7 weeks GA or had taken < half of the placebo capsules were not allowed to participate. Women passing the compliance run‐in were randomly assigned to EPA/DHA or placebo. Funding: The Eunice Kennedy Shriver National Institute of Child Health and Human Development Grants (HD27860, HD27917, HD40560, HD34208, HD40485, HD21410, HD27915, HD40500, HD40512, HD40544; MO1‐RR‐000080; HD34136; HD27869; HD40545; HD36801 and HD19897). Declarations of interest: "Dr Esplin serves on the scientific advisory board and holds stock in Sera Prognostics, a private company that was established to create a commercial test to predict preterm birth and other obstetric complications. Dr Manuck is also on the scientific advisory board for Sera Prognostics". None of the other authors reported any conflicts of interest. | |
| Risk of bias | ||
| Bias | Authors' judgement | Support for judgement |
| Random sequence generation (selection bias) | Low risk | Quote: “randomly assigned”; “simple urn method of randomization with stratification according to clinical center to create a randomization sequence for each center” |
| Allocation concealment (selection bias) | Low risk | Quote: “randomly assigned”; “simple urn method of randomization with stratification according to clinical center to create a randomization sequence for each center” |
| Blinding of participants and personnel (performance bias) | Low risk | Quote: “double‐masked”; "Study group assignment was not known by study participants, their health care providers or the research personnel”; placebo control |
| Blinding of outcome assessment (detection bias) | Low risk | After giving birth, “records of the participants and their newborns were reviewed by study personnel, unaware of treatment assignments, who abstracted delivery date, birth weight, occurrence of maternal or neonatal complications and interventions” |
| Incomplete outcome data (attrition bias) | Low risk | No losses to follow‐up (for primary outcome) Denominators for liveborns = 427 and 410 (2 neonates in the omega‐3 group and 7 in the placebo group died before admission to NICU and were not included in liveborn neonate outcomes). |
| Selective reporting (reporting bias) | Low risk | Large number of relevant outcomes reported (some as medians). |
| Other bias | Low risk | Baseline demographics, risk factors for recurrent preterm birth and dietary fish intake were similar between omega‐3 and placebo groups. |
| Methods | RCT: 3 arms (and a non‐randomised 4th arm): NCT02219399 | |
| Participants | 843 pregnant women randomised (634 to the 3 supplement arms and 209 to the single nutrition arm) Inclusion criteria: women recruited at 16‐20 weeks of gestation or at WIC intake visits with singleton pregnancies; 18 to 40 years of age, able to sign informed consent and Health Insurance Portability and Accountability Act forms in English or Spanish Exclusion criteria: women presenting with known medical or obstetrical complications associated with increased risk for preterm birth including cervical incompetence, presence of cervical cerclage, placenta praevia, intrauterine infection, known substance abuse, multiple fetuses, current PE, pre‐existing diabetes, or a history of gestational diabetes in a prior pregnancy. Women were also excluded if they were taking NSAIDS or if they consumed salmon, mackerel, rainbow trout, or sardines at least once weekly or if they had known allergies to fish or any constituent of the nutritional supplement. Characteristics: low‐income population, but at lower risk of preterm birth with predominantly Hispanic women included Setting: antenatal clinics, Denver Health Hospitals (Denver, Colorado, USA) | |
| Interventions | SUPPLEMENTATION: DHA, 300 mg versus 600 mg, as bars) versus placebo Group 1: supplementation: 300 mg algae‐derived DHA (200 women randomised) – provided in the form of 300 Kcal supplement bars containing DHASCO‐S oil (DHA single‐cell oil) Group 2: supplementation: 600 mg of algae‐derived DHA (221 women randomised) – provided in the form of 300 Kcal supplement bars containing DHASCO‐S oil (DHA single‐cell oil) Group 3: placebo: olive oil (213 women randomised) – provided in the form of 300 Kcal supplement bars All women: gel capsules containing the test oil or olive oil were available for those who refused the bars (51 women opted for gel capsules ‐ groups not reported). Timing of supplementation: from 20 weeks GA to birth DHA + EPA dose/day: low and mid: 300 mg and 600 mg DHA/day + negligible EPA | |
| Outcomes | Women/birth: adherence; DHA concentrations at birth; dietary intake of DHA‐rich foods; adverse events (including vaginal infection, vaginal bleeding during pregnancy and preterm labour); GA at birth; preterm birth < 34 weeks (preterm birth < 280 days was reported but not by group); post‐term birth; mode of birth; type of rupture of membranes; type of labour onset; estimated blood loss; birth complications. Babies/infants/children: birthweight; birth length; head circumference | |
| Notes |
Funding: United States Department of Agriculture. Bars and gel capsules were supplied by Martek Biosciences, Columbia, MD, USA. Declarations of interest: none reported | |
| Risk of bias | ||
| Bias | Authors' judgement | Support for judgement |
| Random sequence generation (selection bias) | Low risk | Quote: “stratified block randomization schedule, generated using a randomization table by staff at Martek Biosciences, to insure equal group assignment from each of three clinics participating in the supplement trial” |
| Allocation concealment (selection bias) | Low risk | As above; probably adequate allocation concealment (third party) |
| Blinding of participants and personnel (performance bias) | Low risk | Both participants and all study personnel were blinded. |
| Blinding of outcome assessment (detection bias) | Low risk | Not reported, but probably done. |
| Incomplete outcome data (attrition bias) | High risk | 53.5% and 52.9% were lost to follow‐up from the 2 intervention arms (leaving 107/200 in the 300 mg DHA arm and 117/221 in the 600 mg DHA arm: 56.8% (121/213) were lost to follow‐up from control arm. Reasons were not given. |
| Selective reporting (reporting bias) | Unclear risk | Insufficient information to make judgement; preterm birth not fully reported |
| Other bias | Low risk | Comparable baseline characteristics for total fatty acids, maternal BMI and maternal age, parity and previous preterm birth (and for completers and withdrawals) |
| Methods | RCT: NCT00362089 (INFAT ‐ The Impact of Nutritional Fatty acids during pregnancy and lactation for early human Adipose Tissue development) | |
| Participants | 208 women randomised Inclusion criteria: healthy pregnant women < 15 weeks GA, aged 18‐43 years, BMI at conception between 18 and 30, sufficient German language; for infants at follow‐up, GA at birth between 37‐42 weeks, appropriate size for GA, and Apgar score > 7 at 5 minutes Exclusion criteria: high‐risk pregnancy (multiple pregnancy, hepatitis B or C infection, parity > 4), hypertension, chronic diseases such as diabetes or gastrointestinal disorders, psychiatric disorders, supplementation with omega‐3 fatty acids before randomisation, alcohol abuse, hyperemesis gravidarum, smoking; known metabolic defects Characteristics: mean baseline BMI of 22; women were relatively well educated Setting: University Hospital Klinikum rechts der Isar, Technische Universität München, Germany (women recruited between 2006 and 2009) | |
| Interventions | SUPPLEMENTATION + DIET ADVICE: DHA + EPA + diet advice versus diet advice Group 1: omega‐3 LCPUFA (180 mg EPA and 1020 mg DHA (= 1200 mg omega‐3) and 9 mg vitamin E), taken as 3 capsules per day and requested to restrict consumption of AA‐rich foods (e.g. meat (500 g a week = 2‐3 portions), meat products and eggs); n = 104 Group 2: brief semi‐structured counselling on a healthy diet according to the guidelines of the German Nutrition Society for a healthy balanced diet; women in the control group were specifically asked to refrain from taking fish oil or DHA supplements: n = 104 All women: participants of both groups were also offered individual nutrition counselling based on the 7‐day dietary record. Timing of supplementation: women were randomised and began the study at 15 weeks GA and continued supplementation until 4 months lactating (or time when ceased breastfeeding if earlier) DHA + EPA dose/day: high: 1020 mg DHA + 180 mg EPA | |
| Outcomes | Women: adherence; preterm birth; post‐term birth; induction (all at term); GWG; blood loss at birth; gestational diabetes; pathological cardiotocography; cessation of labour; retained placenta; mode of birth (spontaneous birth, caesarean section, vacuum extraction); breastfeeding; blood lipid concentrations (triglycerides, total cholesterol, high‐ and low‐density lipoproteins) at baseline, 32 weeks GA, birth, 6 weeks and 4 months postpartum in pregnant and lactating women; leptin; fatty acid pattern in erythrocytes and plasma in maternal blood as well as umbilical cord blood samples and adipokines in maternal plasma, as well as umbilical cord plasma samples and breastmilk samples at 6 weeks and 4 months; maternal 7‐day dietary questionnaire (energy, protein, carbohydrates, lipids, AA); maternal plasma levels of DHA, EPA and AA reported as per cent weight of total fatty acids; maternal RBC fatty acid baseline (16‐21 weeks GA) – before study drug was dispensed (reported in Hauner 2009 only by fish consumption), insulin resistance; maternal leptin; cord blood insulin concentrations Babies/infant/children: Apgar score; LGA > 90th percentile; adipose tissue mass (skinfold thickness) 3‐5 days after birth, 6 weeks, 4 and 12 months postpartum; subgroup: subcutaneous and visceral fat mass ultrasonography at 6 weeks, 4 and 12 months postpartum and MRI at 6 weeks and 4 months postpartum; birthweight; birth length; head circumference; upper arm circumference); body weight and length, head circumference and upper arm circumference, BMI (kg/m²) ‐ all at birth/3‐5 days after birth, 6 weeks, 4 and 12 months postpartum; weight/length (g/cm) at birth; ponderal index (kg/m³) at birth; fetal leptin; annual body‐composition measurements including skinfold thickness measurements (primary outcome) ‐ up to 5 years, a sonographic assessment of abdominal subcutaneous and preperitoneal fat, and child growth at 2, 3, 4 and 5 years (weight, height, head circumference, BMI percentile, waist circumference); abdominal MRI was performed in a subgroup of 5‐year‐old children; dietary intake at 3, 4 and 5 years; physical activity at 3, 4 and 5 years; Child Development Inventory at 4 and 5 years; hand movement test at 5 years (mirror movements reported as medians). | |
| Notes | Funding: Else Krӧner‐Fresenius Foundation, Bad Hamburg, the International Unilever Fund, EU‐funded EARNEST Consortium (subcontractor Numico, Frankfurt), and the German Ministry of Education and Research via the Competence Network on Adiposity; Danone Research‐Centre for Specialised Nutrition, Friedrichsdorf, Germany. The analysis of fatty acids was performed by the laboratory of Lipid Research, Danone Research–Centre for Specialised Nutrition by using coded samples. "There was no intervention from any sponsor with any of the research aspects of the study including study design, intervention, data collection, data analysis and interpretation as well as writing of the manuscript." "Danone as a Funding source and cooperation partner in fatty acid analysis was recruited after the study design was fully established." Declarations of interest: "HH has received grants from Riemser and Weight Watchers for clinical trials and payment for lectures from Novartis, Roche Germany, and Sanofi‐Aventis". The other authors reported no conflicts of interest related to the study. | |
| Risk of bias | ||
| Bias | Authors' judgement | Support for judgement |
| Random sequence generation (selection bias) | Low risk | Computerised randomisation |
| Allocation concealment (selection bias) | Unclear risk | Quote: “randomly assigned” |
| Blinding of participants and personnel (performance bias) | High risk | Not blinded; “open label” |
| Blinding of outcome assessment (detection bias) | High risk | No (except for US measurements, e.g. for fat mass measurements) |
| Incomplete outcome data (attrition bias) | High risk | Omega 3: 17/104 (16%) lost at 12 months postpartum:
Control: 21/104 (20%) lost at 12 months:
2 years and longer:
Unclear why 3/4 preterm births in the control group were treated as exclusions, whereas none of the 3 preterm births in the omega‐3 group were. |
| Selective reporting (reporting bias) | Unclear risk | Focus on biochemical and skinfold measurements rather than clinical outcomes |
| Other bias | Unclear risk | Baseline demographics and characteristics were comparable, except for higher rates of smoking and alcohol use during pregnancy in the control group. |
| Methods | RCT | |
| Participants | 590 women Inclusion criteria: healthy women 19‐35 years of age with singleton pregnancies, nulliparous or primiparous, intending to breastfeed, no omega‐3 supplementation earlier in the pregnancy, 17‐19 weeks' gestation Exclusion criteria: already taking DHA, preterm births, birth asphyxia, general infections, anomalies in infants requiring special attention Setting: attendance at routine US scans, Rikshospitalet University Hospital and Baerum Central Hospital, Oslo, Norway; women recruited between December 1994 to October 1996. | |
| Interventions | SUPPLEMENTATION: DHA + EPA (cod‐liver oil) versus placebo (corn oil) Group 1: cod‐liver oil (10 mL = 1183 mg DHA, 803 mg EPA (total omega‐3 LCPUFA 2494 mg); total number randomised: n = 301 Group 2: liquid oil (corn oil); (10 mL = 4747 mg LnA, 92 mg ALA); total number randomised: n = 289 Fat‐soluble vitamin content was identical for both groups (117 µg/mL vitamin A; 1 µg/mL vitamin D; 1.4 mg/mL dl‐α); cod‐liver oil added 42 mg cholesterol per 10 mL. Timing of supplementation: 18 weeks GA to 3 months infant age DHA + EPA dose/day: high: 1183 mg DHA + 803 mg DHA | |
| Outcomes | Women: length of gestation; maternal and infant diet (food frequency questionnaires); placental weight; fatty acids in breast milk; breastfeeding; BMI at birth Babies/infants/children: birthweight; birth length; head circumference at birth; fatty acids (cord blood and infants at 4 weeks and 3 months); electroencephalography (2 days and 3 months); Fagan (infant intelligence) (6 and 9 months); K‐ABC (IQ) (4 and 7 years) | |
| Notes | Funding: Peter Möller (Oslo, Norway) provided both oils; Orkla ASA; Eckbos Legater; Aktieselskabet Freia Chocolade‐fabriks Medicinske Fond Declarations of interest: Dr Helland's scholarship during the study period was funded by the Peter Möller Department of Orkla ASA, and Dr Saarem was working at the Peter Möller Department of Orkla ASA during the study period and Dr Drevon has been a consultant for the Peter Möller Department of Orkla ASA; Drs Smith, Saugstad, and Ms Blomén indicated they had no financial relationships relevant to disclose. | |
| Risk of bias | ||
| Bias | Authors' judgement | Support for judgement |
| Random sequence generation (selection bias) | Low risk | Quote: "randomization was performed by a computer program" |
| Allocation concealment (selection bias) | Unclear risk | Quote: "randomization was performed by a computer program" |
| Blinding of participants and personnel (performance bias) | Low risk | Quote: "double‐blinded" |
| Blinding of outcome assessment (detection bias) | Low risk | Not specifically stated, but probably done. |
| Incomplete outcome data (attrition bias) | High risk | 249/590 (42%) lost to follow‐up by time of birth: 126/301 (42%) in the cod‐liver oil group and 123/289 (43%) in the corn oil group. There were 27 exclusions and 222 withdrawals (mostly due to "feeling discomfort taking the oil"). K‐ABC at 4 years of age: 51 of the 135 children invited (38%) were lost to follow‐up: 90 came for assessment (84 children completed the assessment). K‐ABC at 7 years: 119 of the 262 children tested on Fagan intelligence scale during their first year of life were invited were lost to follow‐up (45%). |
| Selective reporting (reporting bias) | Unclear risk | Individual K‐ABC scales not fully reported; did not have SDs reported at 4 years; no SDs reported at 7 years. |
| Other bias | Unclear risk | Women in the omega‐3 group were on average 1 year older than women in the corn oil group. |
| Methods | RCT | |
| Participants | 109 women Inclusion criteria: pregnant women with T1D mellitus (not further specified) Exclusion criteria: not reported (post‐randomisation exclusions: fetal loss, preterm birth) Setting: Referral Center for Diabetes in Pregnancy Ministry of Health Republic of Croatia, Department of Obstetrics and Gynecology, Zagreb University of Hospital Center, Zagreb, Croatia, conducted 1 January 2014 to 30 September 2016 | |
| Interventions | SUPPLEMENTATION: DHA + EPA + standard diabetic diet versus placebo (corn oil) + standard diabetic diet Group 1: EPA and DHA capsules twice daily (each capsule contained EPA 60 mg and DHA 308 mg, therefore 120 mg EPA and 616 mg DHA daily); total number randomised: n = 56 (47 included in main analysis) Group 2: placebo capsules (corn oil; total number randomised: n = 53 (43 included in main analysis) Timing of supplementation: from 9 weeks GA DHA + EPA dose/day: mid: 616 mg DHA + 120 mg EPA | |
| Outcomes | Women/birth: adherence; preterm birth (< 37 weeks); early preterm birth (< 34 weeks); length of gestation; PE (and hypertension); GWG Babies/infants/children: miscarriage; stillbirth; perinatal mortality; birthweight > 4.5 kg (macrosomia); birthweight; birth length; head circumference | |
| Notes | Funding: not reported Declarations of interest: none declared | |
| Risk of bias | ||
| Bias | Authors' judgement | Support for judgement |
| Random sequence generation (selection bias) | Unclear risk | Method used to generate a random sequence not reported. |
| Allocation concealment (selection bias) | Unclear risk | Quote: "It was randomly decided which pregnancy women with type‐1 diabetes would take EPA and DHA or which placebo". |
| Blinding of participants and personnel (performance bias) | Low risk | Placebo‐controlled |
| Blinding of outcome assessment (detection bias) | Unclear risk | Not reported |
| Incomplete outcome data (attrition bias) | High risk | 90/109 (81%) women included in the study remained at the birth time point (n = 47 in intervention group and n = 43 in control group). The number of women randomised to the intervention and control groups was not reported. From flow chart (Figure 1) we might assume (though not with 100% certainty) that 56 women were assigned to the intervention, and 43 to the control groups respectively. Before the end of pregnancy/birth pregnancy (main) data collection point: Intervention group lost 9/56 (16%):
Control group lost 10/53 (19%):
|
| Selective reporting (reporting bias) | High risk | Outcomes of trial poorly defined and no protocol available. Additionally, number of participants randomised to each group not reported in text (inferred from flowchart of participants in the trial). |
| Other bias | Unclear risk | Data provided on participant characteristics at baseline insufficient to confidently assess similarity of baseline characteristics. |
| Methods | RCT: NCT01947426 (NUGELA) | |
| Participants | 110 women randomised Inclusion criteria: healthy term infants with no presence of diseases that may affect the normal development of pregnancy or lactation, singleton gestation, normal course of pregnancy, BMI of 18 to 30 kg/m² at the start of pregnancy, weight gain of 8 kg to 12 kg since pregnancy onset, no intake of DHA supplements during pregnancy, term birth, spontaneous vaginal birth, appropriate weight for GA, Apgar index ≥ 7 at 1st and fifth minute of life, normal monitoring results, and breast‐feeding of the neonate Exclusion criteria: see above Setting: 2 hospitals, Hospital Materno‐Infantil (Granada, Spain) and Hospital Universitario Materno‐Infantil (Las Palmas de Gran Canaria, Spain), between June 2009 and August 2010 | |
| Interventions | SUPPLEMENTATION + FOOD: DHA + EPA versus placebo (in the form of a dairy product) Group 1: Fish oil enriched dairy drink (400 mL enriched with omega‐3 (total 392 mg – 72 mg EPA and 320 mg DHA/day; fish oil from tuna)): total number randomised = 56 Group 2: dairy drink with no fish oil: 400 mL: total number randomised = 54 Timing of supplementation: from 28 weeks GA to 4th month of lactation Both groups of women received dietary advice DHA + EPA dose/day: low: 320 mg DHA + 72 mg EPA | |
| Outcomes | Women/birth: fatty acid profiles were determined in the mother’s (at enrolment, at birth, and at 2.5 and 4 months) and newborn (at birth, and at 2.5 months) placenta and breast milk (colostrum and at 1, 2, and 4 months); maternal diet (enrolment, 1 month after enrolment and first month of lactation); GWG; GA; placenta DMT1, FPN1, TfR1 and Hamp1 mRNA and protein expression; hepcidin expression; oxidative damage biomarkers (enrolment, birth, 2.5 and 4 months postpartum); inflammatory markers (birth and 2.5 months); cytokines Babies/infants/children: hepcidin expression; oxidative damage biomarkers (birth; 2.5 months); Apgar at 1 and 5 minutes; birthweight; birth length; head circumference at birth; pattern reversal visual evoked potentials (VEPs) (at 2.5 and 7.5 months) and Bayley test (at 12 months) – BSID II MDI; PDI | |
| Notes | Funding: Excellence grant (mP‐BS‐9) from the Campus de Excelencia Internacional GREIB (Granada Research of Excellence Initiative on BioHealth) Declarations of interest: “F.L.‐V is an employee of Lactalis Puleva”. No other conflicts declared. | |
| Risk of bias | ||
| Bias | Authors' judgement | Support for judgement |
| Random sequence generation (selection bias) | Low risk | Quote: "unpredictable sequence computer‐generated" |
| Allocation concealment (selection bias) | Unclear risk | Quote: "randomly assigned" |
| Blinding of participants and personnel (performance bias) | Low risk | Identical white packaging used; trial investigators and participants were unaware of the treatment allocation. |
| Blinding of outcome assessment (detection bias) | Low risk | Not reported, but probably done. |
| Incomplete outcome data (attrition bias) | High risk | 34/110 (31%) lost to follow‐up by the end of the intervention. In the omega‐3 group 18/56:
In the control group 16/54:
Likely to have been post randomisation exclusions (e.g. preterm) but none were mentioned. At 12 months: 24/56 (43%) in the DHA group and 25/54 (46%) in the placebo group were lost to follow‐up. |
| Selective reporting (reporting bias) | Unclear risk | Inadequate information to assess confidently. |
| Other bias | Low risk | Similar baseline characteristics |
| Methods | RCT: NCT01990690 | |
| Participants | 140 women randomised Inclusion criteria: pregnant women with singleton pregnancy (30‐34 weeks' gestation) with an ultrasonographic diagnosis of oligohydramnios (amniotic fluid index ≤ 5 cm); women aged 20‐35 years with normal Doppler indices in uterine and umbilical arteries at the time of recruitment (the normal value of S/D ratio is from 2.5 to 3.5; RI is from 0.60 to 0.75; and PI is from 0.96 to 1.27) Exclusion criteria: women with evidence of IUGR, history of premature rupture of membranes, impaired liver or kidney function, PE or long‐term diabetes and any placental abnormalities; women with non‐reactive non‐stress test or women using NSAIDs or who had any congenital fetal malformation; and women who had abnormal Doppler indices at the time of recruitment Setting: Department of Obstetric and Gynecology, Woman's Health Hospital, Assiut University, Assiut, Egypt (conducted between 1 January 2015 and 1 August 2015) | |
| Interventions | SUPPLEMENTATION: EPA + DHA versus placebo Group 1: omega‐3 capsules: 1000 mg fish oil (containing 13% EPA and 9% DHA plus 100 mg wheat‐germ oil (LA 52% to 59%) as a natural source of vitamin E once daily for 4 weeks: n = 70 Group 2: placebo: once daily empty soft gelatin capsules of the same shape, size, colour and weight for the same duration: Total number randomised: n = 70 Timing of supplementation: from 30‐34 weeks' gestation for 4 weeks DHA + EPA dose/day: low: 90 mg DHA + 130 mg EPA | |
| Outcomes | Women: improvement in amniotic fluid volume 4 weeks after start of treatment; Doppler blood flow changes in the uterine artery after 4 weeks of treatment; uterine artery Doppler indices | |
| Notes | No outcomes could be used in this review. Funding: not reported Declarations of interest: none declared | |
| Risk of bias | ||
| Bias | Authors' judgement | Support for judgement |
| Random sequence generation (selection bias) | Low risk | Computer‐generated random table |
| Allocation concealment (selection bias) | Low risk | Allocation concealment was carried out using serially numbered closed opaque envelopes. Each envelope was labelled with a serial number and had a card noting the intervention type inside. Allocation was never changed after opening the envelopes. Preparation and sorting of the serially numbered envelopes was carried out by an investigator who did not participate in the evaluation of patients. |
| Blinding of participants and personnel (performance bias) | Low risk | Placebo controlled |
| Blinding of outcome assessment (detection bias) | Low risk | Not specifically reported, but probably done. |
| Incomplete outcome data (attrition bias) | Unclear risk | 14.3% (20/140) lost to follow‐up: 10/70 in omega‐3 group and 10/70 in the placebo group. |
| Selective reporting (reporting bias) | Unclear risk | No perinatal health outcomes reported. |
| Other bias | Low risk | Similar baseline characteristics |
| Methods | RCT: IRCT201406305623N20 | |
| Participants | 54 women randomised Inclusion criteria: women with GDM not on oral hypoglycaemic agents (diagnosed by 1‐step 2‐hour 75 g OGTT at 24‐28 weeks GA ‐ ADA criteria) and singleton pregnancy Exclusion criteria: pre‐existing diabetes, required complex diets, chronic medical conditions (e.g. valvular heart disease), significant psychiatric disease, smokers, kidney or liver diseases, chronic hypertension or hypothyroidism, those needing to commence insulin therapy during the intervention Setting: Arak, Iran | |
| Interventions | SUPPLEMENTATION: omega‐3 (EPA + DHA) versus placebo Group 1: omega‐3 (1000 mg omega‐3 pearl (containing 180 mg EPA and 120 mg DHA) per day): total number randomised: n = 27 Group 2: placebo 1 per day (appearance, colour, shape size, and packaging identical to omega‐3 capsules): total number randomised: n = 27 Timing of supplementation: from 24‐28 weeks GA for 6 weeks All women were asked to maintain their usual diet and physical activity levels throughout the study period. All women were also consuming both 400 mg/day folic acid from the beginning of pregnancy and 60 mg/day ferrous sulphate from the second trimester. DHA + EPA dose/day: low: 120 mg DHA + 180 mg DHA | |
| Outcomes | Women/birth: diet and physical activity at weeks 2, 4 and 6 of intervention; weight at end of intervention; BMI at end of intervention; maternal polyhydramnios; PE; GA; caesarean section; birthweight; birth length; birth head circumference; inflammatory factors, biomarkers of oxidative stress and metabolic biomarkers; need for insulin therapy after intervention; antenatal hospitalisation Babies/infants/children: Apgar score; hyperbilirubinaemia; intrauterine fetal death; macrosomia (> 4000 g); ponderal index; 1 and 5 minute Apgar; newborn hyperbilirubinaemia; newborn hospitalisation | |
| Notes | Adherence was 100% Funding: Arak University of Medical Sciences (grant no. 93‐165‐20) Declarations of interest: none declared | |
| Risk of bias | ||
| Bias | Authors' judgement | Support for judgement |
| Random sequence generation (selection bias) | Low risk | Quote: “computer‐generated random numbers" |
| Allocation concealment (selection bias) | Low risk | Quote: "Random assignment was done by the use of computer‐generated random numbers ... randomization and allocation were concealed from the researchers and participants...A trained midwife at the maternity clinic did the randomized allocation sequence, enrolled participants, and assigned participants to intervention" |
| Blinding of participants and personnel (performance bias) | Low risk | Placebo‐controlled |
| Blinding of outcome assessment (detection bias) | Low risk | Not reported, but probably done. |
| Incomplete outcome data (attrition bias) | Unclear risk | 3/27 women in the omega‐3 group withdrew, and 2/27 women in the placebo group withdrew, all 5 for personal reasons. Data for all 54 women were analysed, using Last Observation Carried Forward for missing data. |
| Selective reporting (reporting bias) | Low risk | Most expected perinatal outcomes were reported. |
| Other bias | Low risk | Baseline characteristics were similar |
| Methods | RCT (4 arms, see below) | |
| Participants | 140 women randomised Inclusion criteria: women 18‐40 years; without prior diabetes; diagnosed with GDM by 1‐step 2‐hour 75‐g OGTT at 24‐28 weeks’ gestation referred to Kosar Clinic in Arak, Iran. GDM was diagnosed according to the ADA guidelines: those whose plasma glucose met 1 of the following criteria were considered as having GDM: FPG ≥ 92 mg/dL, 1‐hour OGTT ≥ 180 mg/dL, and 2‐hour OGTT ≥ 153 mg/dL. Exclusion criteria: taking vitamin D and/or omega‐3 fatty acid supplements; taking insulin; placental abruption; PE; hypothryroidism and hyperthyroidism; smokers; those with kidney or liver disease Setting: Kosar Clinic, Arak, Iran; women were recruited from March 2016 to July 2016 | |
| Interventions | SUPPLEMENTATION + OTHER AGENT: omega‐3 versus omega‐3 + vitamin D versus vitamin D versus placebo Group 1: omega‐3 fatty acids (2000 mg; 720 mg EPA and 480 mg DHA per day) as 2 capsules (produced by Zahravi Pharmaceutical Company, Tabriz, Iran): n = 35 randomised (n = 32 completed study) Group 2: omega‐3 fatty acids (2000 mg; 720 mg EPA and 480 mg DHA per day) as 2 capsules plus vitamin D (50,000 IU every 2 weeks): n = 35 randomised (and completed study) Group 3: vitamin D (50,000 IU every 2 weeks) plus omega‐3 placebo capsules: n = 35 randomised (and completed study) Group 4: no supplement (placebo) as 2 capsules that were indistinguishable in colour, shape, size, and packaging, smell, and taste from the vitamin D and omega‐3 fatty acids capsules: n = 35 randomised (32 completed study) Timing of supplementation: 6 weeks (start 24‐28 weeks' gestation) DHA + EPA dose/day: high: 480 mg DHA + 720 mg EPA | |
| Outcomes | Women/birth: insulin metabolism (primary); lipid concentrations (secondary) | |
| Notes | No outcomes could be included in this review. Funding: grant from the Vice‐Chancellor for Research, AUMS (no.1394.373) Declarations of interest: none declared | |
| Risk of bias | ||
| Bias | Authors' judgement | Support for judgement |
| Random sequence generation (selection bias) | Low risk | Random sequence generation was ensured using a computer‐generated random numbers table. |
| Allocation concealment (selection bias) | Unclear risk | Not reported |
| Blinding of participants and personnel (performance bias) | Low risk | Quote: "appearance of placebo capsule was indistinguishable in color, shape, size, and packaging, smell, and taste from Vitamin D and omega‐3 fatty acids capsules"; considering the nature of intervention and placebo, participants and personnel could have been effectively blind to group assignments throughout the trial. |
| Blinding of outcome assessment (detection bias) | Unclear risk | Not reported |
| Incomplete outcome data (attrition bias) | Low risk | 140 women were randomised, 35 each to: placebo; vitamin D; omega‐3; and vitamin D + omega‐3. A total of 6 women (3 placebo group, 3 omega‐3), were lost to follow‐up, leaving 134/140 (97%) women randomised in the data collection. The difference in the proportions of randomised women included in the data collection was marginal: 100% of women in the vitamin D and vitamin D + omega 3 groups; and 91% of the women in the remaining 2 groups. |
| Selective reporting (reporting bias) | Unclear risk | Insufficient information for confident assessment |
| Other bias | Low risk | Baseline characteristics similar; no obvious other bias identified |
| Methods | RCT | |
| Participants | 73 women randomised Inclusion criteria: women aged 18‐35 years, primiparous or not been pregnant for the past 2 years, with no pregnancy complications Exclusion criteria: women with a history of drug or alcohol addiction; hypertension, smoking, hyperlipidaemia, renal disease, liver disease, diabetes, or psychiatric disorder, parity > 5, history of chronic hypertension, heart disease, thyroid disorder, multiple gestations or pregnancy‐induced complications including hypertension, PE or preterm labour; treated during labour with analgesics such as Stadol (butorphanol tartrate) that may cause infant respiratory distress. Infants born preterm and infants with less than 4 hours of crib time in the first and second days postpartum were excluded from the analyses. Setting: Hartford Hospital, Connecticut, USA | |
| Interventions | SUPPLEMENTATION: DHA versus placebo (cereal bars) Group 1: DHA‐containing cereal‐based bars (300 mg DHA/92 kcal bar, with 8:1 ratio of DHA to EPA); average consumption of 5 bars a week = average 214 mg/day (1.7 g of micro‐encapsulated fish oil in each 23 g bar). Total number randomised: n = 37 Group 2: cereal‐based placebo bars: 1.7 g of corn oil in each 23 g bar (same total macronutrient content as intervention with respect to carbohydrate, protein and fat). Total number randomised: n = 36 Timing of supplementation: 24 weeks GA to birth (38‐40 weeks GA) DHA + EPA dose/day: low: 191 mg DHA + 23 mg EPA | |
| Outcomes | Women/birth: GWG; GA; birthweight; head circumference; length; sexually transmitted infections; maternal depression; mode of birth; maternal dietary intake; DHA status Infant/child: Apgar score at 1 and 5 minutes; Infant Planning test (total intention scores over 5 trials and intentional solutions – retrieving a toy) at age 9 months; Fagan Test of Infant Intelligence (recognition memory) at age 9 months; mode of feeding; infant sleep; ponderal index; visual acuity. (Developmental assessments were only conducted on healthy infants.) | |
| Notes | Funding: US Department of Agriculture Initiative for Future Agriculture and Food Systems; NESTEC; US Department of Agriculture Agricultural Research Service; University of Connecticut Research Foundation; National Fisheries Institute; American Dietetic Association Foundation Declarations of interest: not reported | |
| Risk of bias | ||
| Bias | Authors' judgement | Support for judgement |
| Random sequence generation (selection bias) | Unclear risk | Quote: "randomly assigned"; no further details reported |
| Allocation concealment (selection bias) | Unclear risk | Quote: "randomly assigned"; no further details reported |
| Blinding of participants and personnel (performance bias) | Low risk | Quote: “double‐blind, placebo‐controlled” |
| Blinding of outcome assessment (detection bias) | Unclear risk | Problem solving trials were administered and scored by a single tester who was blinded to test groups (one‐third of videos were scored by an additional rater). |
| Incomplete outcome data (attrition bias) | High risk | Apparently large and differential losses to follow‐up. |
| Selective reporting (reporting bias) | Unclear risk | Some outcomes not fully reported. |
| Other bias | Unclear risk | Baseline characteristics were mostly similar between groups; more women in the placebo group had higher BMI and received WIC support compared with the omega‐3 group. |
| Methods | RCT | |
| Participants | 73 women randomised Inclusion criteria: no other births in previous 2 years; ≤ 20 weeks' gestation; aged 18‐35 years Exclusion criteria: women with a self‐reported significant medical history (e.g. currently being treated for depression/psychiatric illness, addiction problems, hyperlipidaemia, hypertension, renal disease, liver disease or diabetes) Setting: several WIC’s offices and hospitals in New England, USA | |
| Interventions | SUPPLEMENTATION: DHA versus placebo Group 1: DHA (1 fish oil capsule 300 mg DHA 5 days per week): total number randomised: n = 37 (20) Group 2: placebo (1 corn oil capsule, no DHA 5 days per week): total number randomised: n = 36 (22) Timing of supplementation: 24 weeks GA to 40 weeks GA (or to birth) DHA + EPA dose/day: low: 215 mg DHA; EPA not stated | |
| Outcomes | Women/birth: maternal postpartum depressive symptomatology at 2 and 6 weeks; and 3 and 6 months postpartum; repeated measures over 6 months (assessed with the PDSS and CES‐D; RBC DHA (weight%) | |
| Notes | Funding: Patrick and Catherine Weldon Donaghue Medical Research Foundation, Hartford CT; LodersCroklaan (supplied capsules), University of Connecticut School of Nursing and Agricultural Center and Pennington Biomedical Research Center, Louisana State University Declarations of interest: none declared | |
| Risk of bias | ||
| Bias | Authors' judgement | Support for judgement |
| Random sequence generation (selection bias) | Unclear risk | Quote: “randomized utilizing a coded marble system” |
| Allocation concealment (selection bias) | Low risk | Quote: “randomized utilizing a coded marble system and assigned to groups by a trained individual who was not a research team member. Packages containing capsules were labeled identically and listed only sequential study identification numbers.” |
| Blinding of participants and personnel (performance bias) | Low risk | Quote: “A record linking participant names with group assignments was maintained in a secure location away from the researchers to ensure adequate blinding throughout the investigation from recruitment to the completion of data analysis. Identical numbered packages were assembled in advance for use by the research team in enrolling participants. Participants were blinded to group allocation through identical dose and packaging.” |
| Blinding of outcome assessment (detection bias) | Low risk | Not specifically stated, but probably done. |
| Incomplete outcome data (attrition bias) | High risk | Intervention group lost 17/37 (46%) to follow‐up:
Control group lost 14/36 (39%) to follow‐up:
|
| Selective reporting (reporting bias) | High risk | Only 2 outcomes reported (depression and DHA concentrations) |
| Other bias | Unclear risk | Baseline depressive symptoms (CES‐D) were similar; however baseline RBC DHA concentrations were higher in the intervention group. |
| Methods | RCT: IRCT201212101011717 | |
| Participants | 80 women randomised Inclusion criteria: primiparous women > 20 weeks' gestation, with mild depression BDI score between 14 to 19, > 18 years of age, not consuming fish more than twice a week#, not suffering from schizophrenia, bipolar disorders, blood disorders, such as Von Willebrand, hypertension, hyperlipidaemia, renal and thyroid diseases, not taking anticoagulants or antidepressants, not smoking or using narcotics, or not participating in activities such as yoga, relaxation, and psychological consultations. #those consuming fish more than twice a week were replaced by the next individual Exclusion criteria: allergic or digestive reactions to study medications Setting: 2 randomly selected health centres in Shiraz, Iran | |
| Interventions | SUPPLEMENTATION: omega‐3 versus placebo Group 1: omega‐3 LCPUFA: 1 g/day*: total number randomised = 40 Group 2: placebo (olive oil): total number randomised = 40 Timing of supplementation: women in the omega‐3 group were supplemented for 6 weeks** DHA + EPA dose/day: unclear *not further specified **gestational ages not specified apart from being > 20 weeks' gestation | |
| Outcomes | Women/birth: depression during pregnancy (Beck Depression Inventory) | |
| Notes | Funding: not reported | |
| Risk of bias | ||
| Bias | Authors' judgement | Support for judgement |
| Random sequence generation (selection bias) | Unclear risk | Quote: “permuted block randomisation” |
| Allocation concealment (selection bias) | Unclear risk | Quote: “permuted block randomisation” |
| Blinding of participants and personnel (performance bias) | Low risk | Quote: “Both mothers and researchers were blinded to drug and placebo” |
| Blinding of outcome assessment (detection bias) | Unclear risk | Not reported |
| Incomplete outcome data (attrition bias) | Unclear risk | No losses to follow‐up reported; however women consuming fish more than twice a week were replaced by the next individual (number of instances not reported). |
| Selective reporting (reporting bias) | High risk | Only 1 outcome was reported. |
| Other bias | Unclear risk | Similar baseline characteristics except that all participants in placebo group were employed, compared with only 5% of participants in the intervention group. |
| Methods | RCT: NCT01158976: Nutrition and Pregnancy Study (NAPS) | |
| Participants | 64 women randomised (2:1 ratio) Inclusion criteria: pregnant women living in urban low‐income environments, enrolled at 16‐21 weeks' gestation and 'demographically eligible' (Medicaid insured or eligible, African American, and aged 20‐30 years) Exclusion criteria: 2 or more servings of sea fish per week, known medical complications (gestational diabetes, PE, subchorionic haematoma), regular use of steroid medications, regular alcohol use, cigarettes or use of illegal substances (by maternal report), use of blood thinners or anticoagulants, use of psychotropic medications, BMI > 40, allergy to iodine or soy Setting: Pittsburgh, USA: University of Pittsburgh Medical Center obstetric clinics (from 2010‐2012). The clinics are located in urban areas, and provide health services to women living in low‐income households. | |
| Interventions | SUPPLEMENTATION: DHA + EPA + DPA + ETA versus placebo Group 1: omega‐3 LCPUFA (2 gel capsules providing 450 mg DHA, 40 mg DPA and ETA, 90 mg EPA and 10 mg vitamin E): n = 43 Group 2: placebo capsules ‐ matched in size, colour and smell to the study drug (900 mg soybean oil, 16.5 mg vitamin E, 10 mg EPA/DHA): n = 21 Timing of supplementation: 16‐21 weeks GA to birth To support adherence with the intervention, research assistants contacted participants by phone 3 times per week to ask the time of day that the supplement was taken, and gathered data on perception of taste and possible gastrointestinal side effects. DHA + EPA dose/day: mid: 450 mg DHA + 90 mg EPA | |
| Outcomes | Women/birth: Perceived Stress Scale (self report) at 24 and 30 weeks' gestation; Trier Social Stress Test (cortisol response ‐ saliva samples before and after test completion; baseline, 24 and 30 weeks' gestation); symptoms of depression (Edinburgh Postnatal Depression Scale (EPNS)) at 24 and 30 weeks; Difficult Life Circumstances Scale; length of gestation Babies/infants/children: birthweight; 1‐minute Apgar score; cortisol concentrations; BSID‐III at 4 months; Face‐to‐Face Still Face at 4 months | |
| Notes | Funding: capsules provided by Nordic Naturals; supported by NIH grant. “This study was supported by NIH grants R21 HD058269 and RO1HD084586 to Dr Keenan, with additional support from the University of Chicago Institute for Translational Medicine (UL1TR000430). DHA supplement and placebo were supplied by Nordic Naturals”. Declarations of interest: none reported | |
| Risk of bias | ||
| Bias | Authors' judgement | Support for judgement |
| Random sequence generation (selection bias) | Low risk | Computer‐generated random assignment Quote: “The pharmacist at the University of Pittsburgh used computer‐generated random assignment of identification numbers to active supplement or placebo in blocks of nine" |
| Allocation concealment (selection bias) | Low risk | Pharmacist (third party) |
| Blinding of participants and personnel (performance bias) | Low risk | Placebo controlled |
| Blinding of outcome assessment (detection bias) | Low risk | Placebo capsules matched in size, colour and smell to the study drug; probably done |
| Incomplete outcome data (attrition bias) | Unclear risk | 13/64 (20%) women were lost to follow‐up: 21% in the omega‐3 group and 19% in the placebo group. 2 participants in the placebo group withdrew due to miscarriage and mood changes; 2 also withdrew in the omega‐3 group ‐ 1 with headaches and 1 with an upset stomach. Data for 15/64 (23%) infants were not available at the 4 months postpartum assessment. End of pregnancy/birth mother and infant outcomes, including length of gestation and birthweight: at the 36‐week gestation data collection point (last before birth), data were collected from 36/43 (84%) and 17/21 (81%) of mothers randomised to the intervention and control groups respectively. Number of mothers and infants from whom data were collected at the end of pregnancy/birth time point was not reported. 3‐month postpartum outcomes, including infant neurological/neurosensory and developmental outcomes and maternal stress: data were collected from 34/43 (79%) and 15/21 (71%) of infants born to mothers randomised to the intervention and control groups respectively. |
| Selective reporting (reporting bias) | Unclear risk | Not all expected outcomes were reported (e.g. preterm birth). |
| Other bias | Unclear risk | Only baseline comparisons for maternal mental health characteristics were reported (baseline groups wrong way round in Table 1 of 2014 paper). |
| Methods | RCT: IRCT2013100914957N1 | |
| Participants | 150 women randomised Inclusion criteria: women aged 18‐35 years; 1st to 5th pregnancy, with a household health record in the participating health centres, ability to read and write, singleton pregnancy, stable phone access Exclusion criteria: bleeding during pregnancy, placenta praevia, abruption or cerclage in the present pregnancy, history of allergy to fish oil or other fish products, allergy to gelatin, history of previous underlying diseases such as heart disease, kidney disease, hyperlipidaemia, taking medication for 1 of these, consuming fish more than twice a week, smoking or drug addiction, bleeding disorders or taking anticoagulants, BMI > 30, participating in another interventional study Characteristics: very low baseline omega‐3 concentrations Setting: 27 health care centres, Tabriz, Iran | |
| Interventions | SUPPLEMENTATION: DHA + EPA versus placebo Group 1: 1000 mg fish oil supplements (120 mg DHA and 180 mg EPA). Total number randomised: n = 75 Group 2: placebo (similar shape, size and weight); liquid paraffin. Total number randomised: n = 75 Timing of supplementation: from 20 weeks GA to 30 days after birth (women were recruited between 16‐20 weeks GA) DHA + EPA dose/day: low: 120 mg DHA + 180 mg EPA | |
| Outcomes | Women/birth: maternal serum fatty acid profiles at 35‐37 weeks GA; adherence; adverse events (nausea, unpleasant taste, vomiting diarrhoea, stomach pain); caesarean section Babies/infants/children: neonatal death; perinatal death; birthweight; low birthweight; birth length; head circumference at birth; growth at 4 and 6 months; ASQ (2nd edition) at 4 and 6 months (scores and thresholds) | |
| Notes | Funding: Tabriz University of Medical Sciences. follow‐up study supported by Tabriz Health Services Management Research Centre (Grant No. 5/77/5241) Declarations of interest: none declared | |
| Risk of bias | ||
| Bias | Authors' judgement | Support for judgement |
| Random sequence generation (selection bias) | Low risk | Computerised random number table generator |
| Allocation concealment (selection bias) | Low risk | Quote: “randomly assigned … by a staff member not involved in the research” |
| Blinding of participants and personnel (performance bias) | Low risk | Placebo controlled (although smell or taste of paraffin may have been able to be detected) |
| Blinding of outcome assessment (detection bias) | Low risk | Not reported, but probably done. |
| Incomplete outcome data (attrition bias) | Unclear risk | 8/75 women in the omega‐3 group and 7/75 did not have blood samples at 35‐37 weeks GA (omega‐3 group: 5 not interested in sampling; 2 preterm labour: placebo group: 6 not interested in sampling; 2 preterm labour); 1 women in the placebo group stopped capsules due to nausea. For other health outcomes, 0/75 in the omega‐3 group and 4/75 in the placebo group were lost to follow‐up. |
| Selective reporting (reporting bias) | Low risk | No apparent evidence of selective reporting (though stillbirth not explicitly reported). |
| Other bias | Low risk | Baseline characteristics appeared similar. |
| Methods | RCT: parallel with 7 groups (6 treatment and 1 control group in 1:1:1:1:1:1:2 ratio) | |
| Participants | 3098 women randomised; a letter was mailed to women in the 6 treatment groups, with a 56% take‐up rate overall (1291/2324) Inclusion criteria: women at gestation week 17 to 27, with limited fish intake, no use of fish oil capsules in pregnancy; only liveborn singleton pregnancies were analysed Exclusion criteria: none stated Characteristics: about 86% women consumed some fish at baseline. Setting: subgroup of the National Danish Birth Cohort, Denmark | |
| Interventions | SUPPLEMENTATION: omega‐3 (5 different doses DHA/EPA; ALA (flax oil)) versus no treatment Group 1: 0.1 g/day EPA + DHA: total number randomised = 389 (234 participated: 229 analysed) Group 2: 0.3 g/day EPA + DHA: n = 385 (231 participated: 224 analysed) Group 3: 0.7 g/day EPA + DHA: n = 385 (228 participated: 222 analysed) Group 4: 1.4 g/day EPA + DHA: n = 383 (223 participated: 212 analysed) Group 5: 2.8 g/day EPA + DHA: n = 393 (195 participated: 187 analysed) Group 6: 2.2 g/day ALA: n = 389 (180 participated: 176 analysed) – 4 x 1 g flax oil Group 7: no treatment: (774 randomised:748 analysed) (not contacted at all) Timing of supplementation: women were asked to stop taking capsules on the date of expected birth. On average, women stopped taking the capsules 12 days before giving birth; with a mean baseline supplementation commencement of 22‐23 weeks' gestation (approximate estimate of 16 weeks mean supplementation length). DHA + EPA dose/day: different doses ‐ see above | |
| Outcomes | Women/birth: GA at birth | |
| Notes | Unclear how recruitment by mail may have influenced results. Funding: Danish National Research Foundation, Pharmacy Foundation, Egmont Foundation, Augustinus Foundation, Health Foundation, March of Dimes Birth Defects Foundation, EU, Heart Foundation. Dansk Droge and Biooriginal Food Science Corp donated the fish oil and flax oil capsules respectively Declarations of interest: not reported | |
| Risk of bias | ||
| Bias | Authors' judgement | Support for judgement |
| Random sequence generation (selection bias) | Unclear risk | Quote: “block‐wise stratified randomisation”; no further details reported. |
| Allocation concealment (selection bias) | Unclear risk | Quote: “block‐wise stratified randomisation”; no further details reported. |
| Blinding of participants and personnel (performance bias) | Unclear risk | Not clearly stated, but we assume that women in the 6 treatment groups did not know the dosage (or type) of omega‐3 they were taking. |
| Blinding of outcome assessment (detection bias) | Unclear risk | Not explicitly reported; "date of birth was extracted from the Danish Civil Registration System". |
| Incomplete outcome data (attrition bias) | High risk | Between 40% and 54% of women failed to participate in the 6 treatment groups. |
| Selective reporting (reporting bias) | High risk | Only gestational length reported. |
| Other bias | Low risk | Similar baseline characteristics |
| Methods | RCT: NCT01180933 (NUHEAL Nutraceuticals for a Healthier Life); 2 x 2 factorial | |
| Participants | 315 women randomised (4 groups ‐ see below) Inclusion criteria: apparently healthy women < 20 weeks GA; singleton pregnancy, intention to give birth in 1 of the obstetric centres listed below; body weight from > 50 kg to 92 kg and > 18–41 years old Exclusion criteria: women with serious chronic illness (e.g. diabetes, hepatitis, or chronic enteric disease) or who used fish oil supplements since the beginning of pregnancy or folate or vitamin B‐12 supplements after gestation week 16 Setting: Departments of Obstetrics at Ludwig Maximilians University, Munich, Germany; the University of Granada, Granada, Spain; and the University of Pecs, Pecs, Hungary | |
| Interventions | SUPPLEMENTATION + OTHER AGENTS: DHA + EPA versus DHA + EPA + folate versus folate versus placebo ‐ all in a milk base Group 1: DHA/EPA: 15 g milk‐based supplement with 500 mg DHA and 150 mg EPA daily: total number randomised: n = 77 Group 2: DHA/EPA/folate:15 g milk‐based supplement with 500 mg DHA and 150 mg EPA, 400 µg 5‐MTHF daily: total number randomised: n = 77 Group 3: folate:15 g of a milk‐based supplement with 400 µg 5‐MTHF daily: total number randomised: n = 80 Group 4: control: 15 g of a milk‐based supplement placebo: total number randomised: n = 81 Timing of supplementation: 20 weeks GA to birth (infant formula (see below) until 6 months of age if child not breastfed) All women: all sachets contained vitamins and minerals in amounts that met the recommended intakes during the second half of pregnancy for European women (minerals: 300 mg Ca, 240 mg P, 93 mg Mg, 3 mg Zn, 66 µg I; vitamins: 330 µg vitamin A, 1.5 µg vitamin D, 3 mg vitamin E, 0.36 mg thiamine, 1.5 mg riboflavin, 4.5 mg vitamin B‐3, 1.9 mg vitamin B‐6, 3.5 µg vitamin B‐12, 270 mg vitamin C). All women were encouraged to breastfeed. For infants who were not fully breastfed: if the newborns were born to fish oil‐supplemented women, they received an infant formula containing 0.5% of total fatty acids as DHA and 0.4% as AA, whereas children born to mothers in the placebo or 5‐MTHF groups received a formula virtually free of DHA and AA during the first 6 months of postnatal life. DHA + EPA dose/day: mid: 500 mg DHA + 150 mg EPA | |
| Outcomes | Women/birth: length of gestation; maternal and cord plasma DHA and EPA; dietary data at gestation weeks 20 and 30 and at birth; indicators of pregnancy outcome, and fetal development; placental samples; proliferation cell nuclear antigen; mRNA expression of placental proteins; TLR2, TLR4 and CD14 mRNA (maternal blood, placenta, cord blood); GWG, mode of birth; preterm birth < 35 weeks; postnatal depression 8 weeks after birth (EPDS); proteinuria, BP, and eclampsia for gestation weeks 22 and 30 and at birth; blood loss at birth; birthweight, birth length; head circumference at birth (the previous 3 measurements reported for only a sample of babies); MTHFR C677T polymorphism; fatty acids. Babies/infants/children: Apgar score; umbilical pH; visually evoked potentials at 8 weeks (Germany and Spain); Bayley Mental Development Test at 6 months old (Spain); skin‐prick test at 6 months old (Spain); paediatric symptoms and illness questionnaire at birth, 8 and 24 weeks; Hempel examination at 4 years; Touwen examination at 5.5 years; minor neurological dysfunction, NOS; fluency score; cognitive development (Kaufman Assessment Battery) at 6.5 years; response conflict‐resolution ability; alerting, and spatial orienting of attention (Attention Network Test), ERPs, and sLORETA at 8.5 years; MTHFR C677T polymorphism | |
| Notes | DHA and EPA provided by Pronova Biocare, Lysaker, Norway: Folate from BASF, Ludwigshafen, Germany Adherence: 89.5% of the women in the second trimester gestation and 87.4% in the 3rd trimester missed < 5 days of supplementation Funding: Commission of the European Research and Technological Development Programme “Quality of Life and Management of Living Resources” within the 5th Framework Programme (contract QLK1‐CT‐1999‐00888 (NUHEAL “Nutraceuticals for a Healthier Life”)) and the European Community’s 7th Framework Programme (FP7/2008‐2013) under grant agreement 212652 (NUTRIMENTHE Project “The Effect of Diet on the Mental Performance of Children”); the University Science Program of Ludwig Maximilians University; a Freedom to Discover Award from the Bristol Myers Squibb Foundation; Spanish Ministry of Economy and Competitiveness grant (State Secretariat for Research, Development, and Innovation; PSI2012‐39292); European Research Council advanced grant ERC‐2012‐AdG (no.322605 META‐GROWTH). Declarations of interest: "Disclosure of potential conflict of interest: The authors have received grant support from the Commission of the European Communities and the Danone Institute of Nutrition". No other potential or actual conflicts of interest declared. | |
| Risk of bias | ||
| Bias | Authors' judgement | Support for judgement |
| Random sequence generation (selection bias) | Unclear risk | Quote: “blockwise randomization” |
| Allocation concealment (selection bias) | Unclear risk | Quote: “envelopes containing cards with 1 of 4 numbers (1, 2, 3, or 4) according to the 4 intervention groups were mixed and put into a closed box. By drawing envelopes, intervention group numbers were consecutively assigned to subject identity numbers.” |
| Blinding of participants and personnel (performance bias) | Low risk | Quote: "Neither the participating women nor the study personnel knew the content of the sachets" |
| Blinding of outcome assessment (detection bias) | Low risk | Not specifically reported, but probably done. |
| Incomplete outcome data (attrition bias) | High risk | 45/315 (14.3%) did not complete the study at first follow‐up: Group 1: DHA/EPA 8/77 (10.4%) Group 2: DHA/EPA + folate 13/77 (16.9%) Group 3: folate 15/80 (18.8%) Group 4: placebo 9/81 (11.1%) There were 4 post randomisation exclusions: 2 women weighed > 92 kg, 1 of whom used commercial fish oil preparations; and 2 women regularly consumed fish oil preparations. Reasons for dropping out (n = 41) were noncompliance (n = 2), relocation (n = 1), aversion to or bad taste of the supplement (n = 9), and loss of contact (n = 2). In the remaining 17* cases, the reasons for dropping out were not known. Reasons were not reported by group and there were differential rates of loss between groups. *could be 27 Later follow‐up (4 and 5.5 years) 270 mother‐infant pairs were invited for neurological assessment; 175 complied with the request at the age of 4 years and 157 complied at 5.5 years of age. Dropout rates were a further 35.18% at the age of 4 years and 41.9% at the age of 5.5 years, with no differences in the dropout rates between groups. Main reasons for dropping out were relocation (n = 3), loss of contact (n = 65, n = 76), and unwillingness to continue in the study (n = 27, n = 34). 4 of the children examined at the age of 4 years and 5 of those examined at 5.5 years were born prematurely before week 35 of pregnancy and were therefore excluded from the analyses. Except for 1 child who was born with a congenital left side anophthalmus, no other serious congenital disorder was observed. In the health screening questionnaire at 4 years of age, 1 child was reported to have left side deafness, another had developed craniosynostosis and had surgery at the age of 6 months, and 1 child suffered from a developmental retardation of unknown etiology. These children were also excluded from the analyses, which left 167 and 148 children at the age of 4 and 5.5 years, respectively. 6.5 year follow‐up 161 children participated (exclusions: 4 children born < 35 weeks, 1 child was born with a congenital left‐side anophthalmus, 1 child developed craniosynostosis, and another was reported to have left‐side deafness). Dropout rates were similar between groups. Main reasons for dropping out were relocation (n = 3), loss of contact (n = 74), and unwillingness to continue (n = 30). There was a higher attrition of children whose fathers had a high educational level in the placebo and FO + 5‐MTHF groups, as well as differences in several outcomes (e.g. length of gestation, birth length) between children followed up and those lost to follow‐up. 8.5 year follow‐up 130 children participated; 37 FO, 27 folate; 32 placebo and 34 FO/folate (32 from Germany, 96 from Spain and 8 from Hungary; (exclusions: 4 children born < 35 weeks, 1 child was born with a congenital left‐side anophthalmus, 1 child developed craniosynostosis, and another was reported to have left‐side deafness). Dropout rates were similar between groups and had similar sociodemographic profiles. Main reasons for dropping out were relocation (n = 7), loss of contact (n = 75), and unwillingness to continue (n = 45). |
| Selective reporting (reporting bias) | Unclear risk | Preterm births treated as exclusions and not reported by group. |
| Other bias | Low risk | Similar baseline characteristics |
| Methods | RCT: NCT00865683: The Omega‐3 pregnancy study | |
| Participants | 91 women randomised Inclusion criteria: women with prepregnancy BMI ≥ 25 kg/m², ˜ 26 weeks' gestation, 18‐40 years of age, and a singleton pregnancy (stated as BMI ≥ 30 kg/m² in Foster 2017). Exclusion criteria: diseases affecting study outcomes (e.g. gestational or other diabetes mellitus, hypertension, or concurrent inflammatory, vascular or metabolic disease); high unusual intake of DHA (more than 1 fish meal per week, use of DHA‐fortified foods or supplements); current or previous use of tobacco, illicit drugs, or medications such as corticosteroids that affect inflammatory markers; inability to travel to the research centre for study visits. Setting: General Clinical Research Center, Cincinnati, Ohio, USA (December 2009 to June 2013) | |
| Interventions | SUPPLEMENTATION: DHA versus placebo Group 1: DHA (800 mg/day) for 10 weeks, in capsule form; number randomised not reported Group 2: placebo: corn/soy oil daily for 10 weeks, in capsule form: number randomised not reported Timing of supplementation: from 26 to 36 weeks' gestation DHA + EPA dose/day: mid: 800 mg DHA; EPA not stated | |
| Outcomes | Women/birth: maternal adverse effects; gestational diabetes; birthweight, length and adiposity (BMI Z score); length of gestation; DHA concentrations (erythrocyte and placenta); fasting blood glucose; cytokines; metabolic hormones; lipids Babies/infants/children: child growth (including adiposity, weight, height, arm circumference and arm skinfold); child neurological/neurosensory and developmental outcomes (as measured by the Bayley Scales of Infant and Toddler Development) | |
| Notes | Funding: “Research reported in this publication was supported by National Institutes of Health grant R21HL093532, 8UL1TR000149 and the Mike Hogg Fund (T.L.P). The two‐year follow‐up was supported by the Rita and William Head endowment for studies on environmental influences on Prematurity (R.R.). B.A.F.was supported by a grant from the National Institute of Diabetes and Digestive and Kidney Diseases of the National Institutes of Health under Award Number K23DK109199." Declarations of interest: none declared | |
| Risk of bias | ||
| Bias | Authors' judgement | Support for judgement |
| Random sequence generation (selection bias) | Low risk | Quote: “The randomization scheme was prepared prior to start of the trial by the study pharmacist using a tested system utilizing a random‐number generator. Each study subject was assigned to study group on a consecutive basis” |
| Allocation concealment (selection bias) | Low risk | Pharmacy‐controlled randomisation |
| Blinding of participants and personnel (performance bias) | Low risk | Quotes: “Study staff, subjects, and investigators were blinded to the group assignment. At the end of the study, pharmacy staff mailed the study group assignment to the subject and investigators”; and “the gelcaps were identical in size, appearance, taste, and smell (orange flavoured)” |
| Blinding of outcome assessment (detection bias) | Low risk | Quotes: “Study staff, subjects, and investigators were blinded to the group assignment. At the end of the study, pharmacy staff mailed the study group assignment to the subject and investigators”; and “the gelcaps were identical in size, appearance, taste, and smell (orange flavoured)” |
| Incomplete outcome data (attrition bias) | High risk | The 2 papers reported different numbers of participants remaining in the trial at the 36‐week and birth data collection points (end of main study). Of the 91 women, initially randomised, 31 (34%) or 28 (30%) were not included the analysis. It was unclear which groups the excluded women had been randomised to, and therefore it was not possible to assess potential systematic differences between groups in withdrawals from the study confidently. No further losses to follow‐up (in the follow‐up study) were reported. |
| Selective reporting (reporting bias) | Unclear risk | Some mismatches with the outcomes reported in the trial registration entry; outcomes such as GDM and BSID III incompletely reported in results; unclear whether some standard errors were SDs |
| Other bias | Unclear risk | Higher BMIs and body weight in the placebo group |
| Methods | RCT (3‐arms) | |
| Participants | 18 women randomised Inclusion criteria: women with PE (admitted to hospital between 26 and 37 weeks' gestation because of BP consistently exceeding 140/100 mmHg; 8 women also had proteinuria) Exclusion criteria: none reported Setting: Helsinki, Finland | |
| Interventions | SUPPLEMENTATION: omega‐3 versus LA + GLA (Primrose oil) versus placebo Group 1: fish oil: 10 MaxEPA capsules (180 mg EPA, 120 mg DHA per capsule): total number randomised: n = 5 (3) Group 2: primrose oil: 10 Preglandin capsules (375 mg linolenic acid and 45 mg gammalinolenic acid per capsule): total number randomised: n = 7 (4) Group 3: placebo (10 capsules each containing 500 mg of maize oil and 500 mg olive oil); total number randomised: n = 6 (5) All women: intervention between 31‐36 weeks' gestation; bed rest in hospital for 2 days before randomisation Median duration and range of supplementation was:
Women were advised to follow their normal diets. DHA + EPA dose/day: daily dose unclear | |
| Outcomes | Women/birth: prostanoids (urine); clinical signs of PE; birthweight (reported as median and range); BP (reported as % of pretreatment levels) | |
| Notes | 2 women used betablockers (metoprolol 100 mg/day) and 1 used dihydrazaline 50 mg/day. No aspirin‐like drugs were allowed. No outcomes could be meta‐analysed Funding: Preglandin capsules (Suomen Rohdos, Turku, Finland); MaxEpa and placebo capsules (Orion OY, Kuopio, Finland) Declarations of interest: not reported | |
| Risk of bias | ||
| Bias | Authors' judgement | Support for judgement |
| Random sequence generation (selection bias) | Unclear risk | Reported as “in randomized order” |
| Allocation concealment (selection bias) | Unclear risk | Sealed envelopes |
| Blinding of participants and personnel (performance bias) | Low risk | Capsules of identical appearance |
| Blinding of outcome assessment (detection bias) | Low risk | Not reported, but probably done. |
| Incomplete outcome data (attrition bias) | High risk | 6/18 (33%) women excluded: 3 women gave birth before samples could be collected and 3 additional women failed to collect adequate urine samples. |
| Selective reporting (reporting bias) | Unclear risk | Limited number of outcomes reported. |
| Other bias | High risk | Median length of supplementation differed substantially between the 3 groups. |
| Methods | RCT: ACTRN012605000569606 (DOMInO main trial); allergy follow‐up: ACTRN12610000735055; 3‐ and 5‐year follow‐ups: ACTRN12611001127998; 4‐year follow‐up: ACTRN12611001125910; 7‐year follow‐up: ACTRN12614000770662 | |
| Participants | 2399 women randomised Inclusion criteria: singleton pregnancy < 21 weeks GA, no known fetal abnormality, and not taking medication where tuna oil was contraindicated Exclusion criteria: women already taking a DHA supplement, with a bleeding disorder in which tuna oil was contraindicated, taking anticoagulant therapy, had a documented history of drug or alcohol abuse, were participating in another fatty acid trial, fetus had a known major abnormality, or were unable to give written informed consent or if English was not the main language spoken at home Setting: 5 Australian perinatal centres, recruiting from October 2005 to January 2008 Pregnant women were approached to enter the allergy follow‐up, Palmer 2012, after randomisation into the DOMInO trial. Only Adelaide‐based women were eligible for the allergy follow‐up. Women were eligible if the unborn baby had a mother, father, or sibling with a history of any medically diagnosed allergic disease (asthma, allergic rhinitis, eczema) (n = 706). | |
| Interventions | SUPPLEMENTATION: DHA + EPA versus placebo Group 1: DHA‐rich fish oil capsules: 3 x 500 mg/day (providing 800 mg DHA + 100 mg EPA per day): n = 1197 Group 2: matching placebo vegetable oil blend of 3 non‐genetically modified oils (rapeseed, sunflower, palm) in equal proportions: n = 1202 Timing of supplementation: from trial entry (˜20 weeks) to birth DHA + EPA dose/day: mid: 800 mg DHA + 100 mg EPA | |
| Outcomes | Women/birth: length of gestation; adherence (28 weeks); PPH; log blood loss at birth; preterm birth < 37 weeks; early preterm birth < 34 weeks; PIH; PE; PE (clinical diagnosis in medical records); caesarean section; post‐term induction or post‐term prelabour caesarean; post‐term induction; serious morbidity composite; renal failure; liver failure; death; eructations (28 and 36 weeks); diarrhoea; gestational diabetes (based on glucose tolerance test); gestational diabetes (based on clinical diagnosis in medical record); postnatal depression (all women: EPDS > 12 at 6 weeks, 6 months postpartum); postnatal depression (women with previous or current depression at trial entry: EPDS > 12 at 6 weeks, 6 months postpartum); new diagnosis of depression in study period; new or existing diagnosis of depression during study period; antenatal admission to hospital; maternal admission to intensive care unit (level III antenatal hospitalisation); vitamin D concentrations (cord blood) Babies/infants/children: perinatal death; birthweight; birth length; head circumference at birth; birthweight z score; birth length z score; head circumference at birth z score; low birthweight < 2.5 kg); SGA (weight < 10th percentile), length, head circumference); LGA (weight (> 90th percentile), length, head circumference); birthweight > 4 kg; any serious adverse event; IVH (and grade); NEC; sepsis; convulsion; BPD (oxygen required for treatment of chronic lung disease); neonatal hypoglycaemia; resuscitation at birth; bone fracture; NICU admission; breastfeeding; morbidities up to 5 years; BSID at 18 months in 600 randomly selected infants; visual development outcomes at 4 months; attention and working memory and inhibitory control at 27 months; general cognitive function (DAS II), executive function, language, behaviour at 4 years; BMI z‐scores; body fat; BP; and insulin sensitivity at 3 and 5 years (HOMA‐IR); BMI z‐score and percentage body fat at 3 and 5 years of age (Allergy outcomes are reported in another Cochrane review (Gunaratne 2015)). | |
| Notes | Funding: supported by grants from the Australian National Health and Medical Research Council and Australian Egg Corporation Limited. Treatment and placebo capsules were donated by Efamol, UK and Croda Chemicals. Declarations of interest: Professor Makrides reported serving on scientific advisory boards for Nestle, Fonterra, True Origins and Nutricia. Professor Gibson reported serving on scientific advisory boards for Nestle and Fonterra. Associated honoraria for Professors Makrides and Gibson were paid to their institutions to support conference travel and continuing education for postgraduate students and early career researchers. Dr Makrides reported receiving non financial support from Clover Corporation and Nestle Nutrition. Dr Makrides, through the Women's & Children's Health Research Institute, has a patent pending: "Methods and compositions for promoting the neurological development of an infant". Dr Gould reports honoraria paid to her institution from the Nestle Nutrition Institute. Dr John Colombo served on the advisory boards for Nestle, Fonterra and Nutricia. Dr Muhlhausler had given lectures on maternal nutrition for Aspen Nutrition and Danone Nutritia. Linda Tapsell served on the Science Advisory Committees of the California Walnut Commission and the McCormicks Science Institute. Dr Palmer had consulted for and received payment for lectures from Nestle Nutrition. Dr Prescott reported receiving honorariums from the Nestle Nutrition Institute and Fonterra and being paid for lectures by the World Allergy Association and the American Academy of Asthma, Allergy and Immunology. Dr Heddle reported being paid for expert testimony from Analysis Plus and Rodika Research Services, and receiving grants from Commonwealth Serum Laboratories, Vaxine, GLaxoSmithKline, and Healthed. Dr Beverley Muhlhausler had given lectures on maternal nutrition for Aspen Nutrition and Danone Nutricia. No other author declarations. | |
| Risk of bias | ||
| Bias | Authors' judgement | Support for judgement |
| Random sequence generation (selection bias) | Low risk | Quote: "Women were randomly assigned a unique study number and treatment group allocation through a computer‐driven telephone randomization service according to an independently generated randomization schedule" |
| Allocation concealment (selection bias) | Low risk | As above |
| Blinding of participants and personnel (performance bias) | Low risk | Quote: "All capsules were similar in size, shape and color", and, "trial investigators, staff and participants were unaware of the treatment allocation"; however more women in the treatment group guessed that they were taking fish oil capsules (67% in the treatment group compared with 13% in the control group) |
| Blinding of outcome assessment (detection bias) | Low risk | Described as "double blind"; Zhou 2012* describes a "blinded audit of medical records"; Smithers 2011* describes "a blinded assessment of a subset of healthy full‐term infants; Makrides 2014* specifies "with a psychologist who was blinded to group allocation" *These references are listed under Makrides 2010. |
| Incomplete outcome data (attrition bias) | Low risk | 1179/1197 (98%) women in the omega‐3 group and 1166/1202 (97%) in the placebo group completed 6‐month postpartum follow‐up (though all women were included in the primary analyses): "adequate data for the analysis of the primary outcome were available for 2320 women (97.3% in the DHA group and 96.1% in the control group)".
|
| Selective reporting (reporting bias) | Low risk | No indication of selective reporting bias. |
| Other bias | Low risk | The demographic and clinical characteristics of the women at randomisation were comparable between the 2 groups, though some divergence was seen over time in the follow‐ups, particularly with regard to sociodemographic characteristics. |
| Methods | RCT | |
| Participants | 100 women randomised Inclusion criteria: women who were expected to deliver their infants at term and planned to feed them on breast and/or formula milk Exclusion criteria: women with diabetes, twin pregnancies, PE/toxaemia, a past history of abruption or PPH, allergy to fish products, a thrombophilic tendency, or who were receiving drugs that affect thrombocyte function; pregnancies concluded prematurely before 36 weeks, in which the neonate had an Apgar score < 7 at 5 minutes, had weight below the 3rd centile for GA, or had medical or developmental problems were not included in the final analysis of results. Setting: antenatal clinic (elective); Yorkhill NHS Trust, Stirling, Scotland | |
| Interventions | SUPPLEMENTATION: DHA versus placebo Group 1: fish oil; blended, Marinol D40 (200 mg DHA/day, 100 mg per capsule); 2 capsules per day; n = 50 randomised Group 2: placebo capsules containing high‐oleic acid sunflower oil, with 810 mg oleic acid/g (200 mg per capsule), devoid of any omega‐3 fatty acid; 2 capsules per day; n = 50 randomised Timing of supplementation: 15 weeks GA to birth All women: advised to follow their normal diet during pregnancy DHA + EPA dose/day: low: 200 mg DHA | |
| Outcomes | Women/birth: DHA and other fatty acid status (RBC and plasma); length of gestation; birthweight; length at birth; head circumference at birth; preterm birth Babies/infants/children: longer‐term growth at 50 and 66 weeks post‐conceptional age; visual development; DHA and other fatty acid status (cord blood) | |
| Notes | Funding: University of Glasgow and the Chief Scientist Office, Scotland. RP Scherer Ltd UK donated the capsules. Declarations of interest: none declared | |
| Risk of bias | ||
| Bias | Authors' judgement | Support for judgement |
| Random sequence generation (selection bias) | Unclear risk | Quotes: “double blind, prospective, randomised, and controlled in design”; “The women were then randomised” |
| Allocation concealment (selection bias) | Unclear risk | As above, no further detail provided. |
| Blinding of participants and personnel (performance bias) | Low risk | Quote: "The study supplements were identical in appearance and could not be identified on the basis of scent or taste" and "The capsules were identical in appearance, taste and odour." |
| Blinding of outcome assessment (detection bias) | Unclear risk | Not specifically detailed |
| Incomplete outcome data (attrition bias) | High risk | Of 100 women recruited to the study, 29 (29%) (15 in DHA group; 14 in placebo group) withdrew before 28 weeks, and a further 7 (4 in DHA group; 3 in placebo group) withdrew before birth (total n = 36). Common reasons for withdrawing were poor adherence (n = 16); frequent nausea/vomiting (n = 13); loss of contact (n = 3); anxiousness (n = 2); unspecified (n = 3). A further 3 infants (all from the placebo group) were excluded from the postnatal portion of the study after birth: born before 36 weeks (n = 1); Apgar score < 7 at 5 minutes (n = 2). A further infant was discharged before testing. Therefore birth outcomes were available for 60/100 women; birth vision tests were performed on 59 infants. ERG studies (retina) were performed on 56 infants. (Other paper reports 2 excluded from placebo group due to prematurity, and SGA) |
| Selective reporting (reporting bias) | Unclear risk | Unclear; no access to trial protocol |
| Other bias | Unclear risk | Insufficient detail to determine risk of other bias |
| Methods | RCT | |
| Participants | 1173 women Inclusion criteria: women age 18 years and over, parity 0‐5, up to 20 weeks’ gestation (confirmed by US), non‐consumers of drugs and alcohol, and underweight (BMI ≤ 21.2 at 10 weeks' gestation, as defined by Chilean charts for pregnant women) Exclusion criteria: multiple pregnancies; suffering from chronic diseases that could affect fetal growth; smokers; and disease diagnosed during pregnancy Setting: 19 urban health clinics belonging to the Servico de Salud Metropolitano Sur‐Oriente (Southeast Metropolitan Public Health Services), Santiago, Chile (study dates not reported). Mainly low‐income, ethnically diverse families (Ameri‐Indian and Hispanic). | |
| Interventions | SUPPLEMENTATION + OTHER AGENT: omega‐3 + omega‐6 + multiple micronutrients + milk versus milk only Group 1: milk product fortified with omega‐3 LCPUFA (0.6 g/day) omega‐6 LCPUFA (3 g/day), multiple micronutrients: total number randomised: n = 589 Group 2: regular powdered milk; total number randomised: n = 552 Timing of supplementation: < 20 weeks to birth (presumed) DHA + EPA dose/day: mid: 600 mg DHA; EPA not stated | |
| Outcomes | Women/birth: preterm birth (< 37 weeks); preterm birth (< 34 weeks); miscarriage; PE; length of gestation; caesarean section; GWG; stillbirth; neonatal death; perinatal death Babies/infants/children: birthweight; infant growth (crown‐heel length, head circumference) | |
| Notes | Funding: Parmalat SpA, Italy, the company that provided the Maman (intervention) product. Declarations of interest: none declared | |
| Risk of bias | ||
| Bias | Authors' judgement | Support for judgement |
| Random sequence generation (selection bias) | High risk | Quote: "Midwives in charge assigned the women in their initial pregnancy visit using the order of arrival: odd numbers to the experimental group and even numbers to the control group". |
| Allocation concealment (selection bias) | High risk | Quote: "Midwives in charge assigned the women in their initial pregnancy visit using the order of arrival: odd numbers to the experimental group and even numbers to the control group". |
| Blinding of participants and personnel (performance bias) | Unclear risk | Authors reported that: "the study could not be blinded because Chilean regulations do not allow delivery of food without information on its composition". However, lack of blinding of participants and personnel is unlikely to have introduced bias due to the objective nature of the outcomes measured and reported. |
| Blinding of outcome assessment (detection bias) | Unclear risk | Quote: “For those co‐authors who performed the calculations, groups were simply labelled 1 or 2, and the coding was not known by them either. These measurements should suffice to minimise the possible effects of non‐blinding”. No information was provided on blinding of the individuals who performed the assessments. |
| Incomplete outcome data (attrition bias) | High risk | There were 32/1173 post randomisation exclusions. Data were available for 333/552 (60%) and 365/589 (62%) of women assigned to the control and intervention group respectively. |
| Selective reporting (reporting bias) | Unclear risk | insufficient information to permit confident assessment. |
| Other bias | Unclear risk | Among women who discontinued the trial, GA at recruitment was lower in the intervention group. |
| Methods | RCT | |
| Participants | 60 women Inclusion criteria: not reported Exclusion criteria: not reported Setting: Virgen de las Nieves Hospital, Granada, Spain | |
| Interventions | SUPPLEMENTATION + FOOD: DHA versus placebo (in the form of a dairy product) Group 1: dairy product (2 glasses a day) supplemented with DHA (400 mg/day): total number randomised: n = 30 Group 2: dairy product (2 glasses a day) with no DHA supplement: total number randomised: n = 30 Timing of supplementation: from 28 weeks' gestation to when breastfeeding stopped DHA + EPA dose/day: low: 400 mg DHA | |
| Outcomes | Women: plasma antioxidant capacity; adipokines Babies/infants/children: antioxidant capacity (umbilical cord; newborn); peroxides; superoxide dismutase activity; adipokines (birth; 2.5 months) | |
| Notes | Abstracts only available No outcomes could be included in this review Funding: not reported Declarations of interest: not reported | |
| Risk of bias | ||
| Bias | Authors' judgement | Support for judgement |
| Random sequence generation (selection bias) | Unclear risk | Not reported |
| Allocation concealment (selection bias) | Unclear risk | Not reported |
| Blinding of participants and personnel (performance bias) | Unclear risk | Quote: "double‐blind"; not further described |
| Blinding of outcome assessment (detection bias) | Unclear risk | Not reported |
| Incomplete outcome data (attrition bias) | Unclear risk | Not reported |
| Selective reporting (reporting bias) | Unclear risk | Insufficient detail |
| Other bias | Unclear risk | Insufficient detail |
| Methods | RCT: NCT02219399 | |
| Participants | 115 women randomised Inclusion criteria: women aged 18‐42 years, singleton pregnancies and willingness to breastfeed exclusively for first 3 months Exclusion criteria: maternal age < 18 years, multiple pregnancies, diabetes, HIV‐positive, chronic illnesses or other conditions which could preclude breastfeeding, and any known allergies to seafood or fish oils Setting: private practice gynaecology and obstetrics clinics, Fort Collins, Colorado, USA | |
| Interventions | SUPPLEMENTATION: omega‐3 (DHA + EPA) versus placebo Group 1: tuna fish oil (300 mg DHA and 67 mg EPA); hard capsule: n = 60 Group 2: placebo: identical Sunola hard capsule (high oleic acid sunflower oil placebo): n = 55 Timing of supplementation: from the last trimester of pregnancy through to the first 3 months of breastfeeding DHA + EPA dose/day: low: 300 mg DHA + 67 mg EPA | |
| Outcomes | Women/birth: maternal FFQ; lipids (blood, breastmilk); Home Screening Questionnaire at 9 months; abbreviated Wechsler Adult Intelligence Scale (at baseline); gestational length (last menstrual period method); preterm birth < 37 weeks; later term birth > 40 weeks; caesarean birth; breastfeeding Babies/infants/children: BSID‐III, MDI at 4 months and 12 months (cognitive, language, social‐emotional and general adaptive behaviour scales) | |
| Notes | Same NCT # allocated to Harris 2015 (but author has confirmed this is a separate trial) Funding: not reported Declarations of interest: not reported | |
| Risk of bias | ||
| Bias | Authors' judgement | Support for judgement |
| Random sequence generation (selection bias) | Low risk | Computer‐generated block randomisation |
| Allocation concealment (selection bias) | Unclear risk | Method of allocation not reported |
| Blinding of participants and personnel (performance bias) | Low risk | Quote: “Participating women, all data collectors and investigators were blinded to supplement allocation until all study children were 12 months of age and had completed the cognitive testing. After all study data was collected, the study was un‐blinded only to study investigators for analysis”. |
| Blinding of outcome assessment (detection bias) | Low risk | Quote: “Participating women, all data collectors and investigators were blinded to supplement allocation until all study children were 12 months of age and had completed the cognitive testing. After all study data was collected, the study was un‐blinded only to study investigators for analysis”. |
| Incomplete outcome data (attrition bias) | Unclear risk | In omega‐3 group 12/60 (20%) loss to follow‐up for BSID:
In placebo group 20/55 (36%) lost to follow‐up:
|
| Selective reporting (reporting bias) | Unclear risk | Secondary outcomes (including infant birth length, infant growth velocity, infant birthweight or infant head circumference at birth) prespecified in the trial registration were not reported. |
| Other bias | Unclear risk | Baseline characteristics similar; however all women were allowed to take voluntary fish oil supplements (63% in the DHA group and 71% in the placebo group did so). Additionally women in the placebo group took higher amounts than the DHA group. |
| Methods | RCT: ISRCTN68997518: FOSIP | |
| Participants | 173 women randomised (88 healthy women and 85 women with pre‐existing type 2 diabetes) Inclusion criteria: women 17–45 years old with singleton pregnancies with either pre‐existing type 2 diabetes; or without any known medical condition (uncomplicated pregnancy group). Exclusion criteria: multiple pregnancy; known major fetal anomaly; current or planned corticosteroid therapy; asthma requiring medication; current or planned beta‐adrenergic therapy; chronic medical conditions such as HIV/AIDS, kidney disease, or congenital heart disease; haematologic or autoimmune disease such as sickle cell disease, other haemoglobinopathies, lupus, or antiphospholipid syndrome; previous or planned tocolytic therapy to induce labour or increase contraction strength Characteristics: high proportion of South Asian and African/Caribbean women Setting: antenatal clinic, Newham University Hospital, London, UK (women were recruited during their first visit to the antenatal clinic between January 2008 and December 2011) | |
| Interventions | SUPPLEMENTATION: DHA + EPA versus placebo Group 1: fish oil: 2 capsules per day (600 mg DHA): n = 86 (41 women with type 2 diabetes; 45 healthy women) Group 2: placebo: 2 capsules per day; 82.6% oleic acid (sunflower oil): n = 87 (47 women with type 2 diabetes; 40 healthy women) Timing of supplementation: recruited between 10‐12 weeks' gestation, with supplementation continuing until birth All women: both supplements contained vitamin E DHA + EPA dose/day: mid: 600 mg DHA; EPA not stated | |
| Outcomes | Women/birth: caesarean section; miscarriage (< 24 weeks); GA (reported only as median and range) Babies/infants/children: preterm birth < 37 weeks; preterm birth < 34 weeks; shoulder dystocia; stillbirth; birthweight; low birthweight (< 2500 g); anthropometric measures at birth: head circumference; length; femur length; humerus length; biparietal diameter; occipito‐frontal diameter; arm and thigh lean and fat mass; abdominal circumference; abdominal fat mass; shoulder circumference, mid‐arm circumference | |
| Notes | Funding: FP6 Marie Curie Actions‐Transfer of Knowledge, The Foyle Foundation, Newham University Hospital NHS Trust, Diabetes Research Network (North East London Diabetes Local Research Network), Equazen/Vifor Pharma Ltd., London Metropolitan University, The Letten Foundation, The Mother and Child Foundation, Sir Hally Stewart Trust, Emeritus Professor Clara Lowy Declarations of interest; none declared | |
| Risk of bias | ||
| Bias | Authors' judgement | Support for judgement |
| Random sequence generation (selection bias) | Low risk | Randomisation was carried out using a random code generated by the supplement provider. |
| Allocation concealment (selection bias) | Low risk | Randomisation was carried out using a random code generated by the supplement provider (third party). |
| Blinding of participants and personnel (performance bias) | Low risk | Participants, midwives and all investigators were blinded to allocation until all the analysis was completed and the data recorded. |
| Blinding of outcome assessment (detection bias) | Low risk | Participants, midwives and all investigators were blinded to allocation until all the analysis was completed and the data recorded; probably done. |
| Incomplete outcome data (attrition bias) | High risk | 30% (26/86) in the fish oil arm and 35% (30/87) in the placebo arm were excluded or lost to follow‐up at birth. Diabetic women: Fish oil: 13/41 (32%); 4 dropouts, 7 miscarriages, 2 stillbirths Placebo: 17/47 (36%); 11 dropouts, 6 miscarriages Healthy women Fish oil: 13/45 (29%); 6 dropouts, 2 moved, 1 termination, 4 miscarriages, 3 developed GDM Placebo: 13/40 (33%); 8 dropouts, 2 moved, 3 miscarriages |
| Selective reporting (reporting bias) | Unclear risk | Some protocol changes after trial registration Under the same registry number as FOSIP ((Min 2014; Min 2016); not entirely clear whether these trials were conducted jointly or in tandem). |
| Other bias | Unclear risk | Possibly some baseline imbalance: more smokers and more planned pregnancies in the omega‐3 group. |
| Methods | See Min 2014 above | |
| Participants | Subset of women with type 2 diabetes (41 from fish oil group: 47 from placebo group) | |
| Interventions | ||
| Outcomes | ||
| Notes | ||
| Methods | RCT: ISRCTN68997518: FOSIP | |
| Participants | 138 women randomised Inclusion criteria: women 17–45 years old with singleton pregnancies diagnosed with GDM (some were tested early in pregnancy) Exclusion criteria: planning to receive tocolytic or corticosteroid therapy or taking fish oil supplements Characteristics: high proportion of South Asian and African/Caribbean women Setting: antenatal clinic, Newham University Hospital, inner‐city London, UK | |
| Interventions | SUPPLEMENTATION: omega‐3 + AA versus placebo (oleic acid) Group 1: omega‐3: 2 capsules of fish oil = 600 mg of DHA; 84 mg EPA; 16.8 mg AA (plus vitamin E): total number randomised = 67 Group 2: placebo: 1442 mg high oleic acid sunflower oil/day: total number randomised = 71 Timing of supplementation: GA at recruitment: median 28 weeks (range 17 to 33) Duration of supplementation: median 10 weeks (range 4 to 20) All women: both supplements contained vitamin E DHA + EPA dose/day: mid: 600 mg DHA + 84 mg EPA | |
| Outcomes | Women/birth: RBC membrane phospholipid DHA levels in the women and their neonates at birth; GA (median and range); caesarean; miscarriage; stillbirth; congenital anomaly; preterm birth < 37 weeks; preterm birth < 34 weeks; late preterm birth, low birthweight; birthweight > 4 kg; birthweight, birth length; birth head circumference; shoulder, mid arm and abdominal circumferences at birth Babies/infants/children: neonatal hyperglycaemia | |
| Notes | Funding: grants from FP6 Marie Curie Actions‐Transfer of Knowledge (MTKD‐CT‐2005‐029914), Foyle Foundation, Newham University Hospital NHS Trust, Diabetes Research Network (North East London Diabetes Local Research Network), Equazen/Vifor Pharma Ltd., London Metropolitan University, Sir Halley Stewart Trust, The Mother and Child Foundation, Letten Foundation and personal donation from Emeritus Professor Clara Lowy. The supplements (Mumomega and placebo) used in this study were prepared and provided by Equazen/Vifor Pharma Ltd free of charge. Declarations of interest: none declared Trial registration is the same as for Min 2014. | |
| Risk of bias | ||
| Bias | Authors' judgement | Support for judgement |
| Random sequence generation (selection bias) | Low risk | Randomisation was carried out using a random code generated by the supplement provider. |
| Allocation concealment (selection bias) | Low risk | Randomisation was carried out using a random code generated by the supplement provider (third party). |
| Blinding of participants and personnel (performance bias) | Low risk | Participants, midwives and all investigators were blinded to allocation until all the analysis was done. |
| Blinding of outcome assessment (detection bias) | Low risk | Participants, midwives and all investigators were blinded to allocation until all the analysis was done. |
| Incomplete outcome data (attrition bias) | Unclear risk | The omega‐3 + AA arm lost 9/67 (13%) to follow‐up:
The placebo arm lost 13/71 (18%) to follow‐up:
|
| Selective reporting (reporting bias) | Unclear risk | Some protocol changes after trial registration. Under the same registry number as FOSIP ((Min 2014; Min 2016); not clear whether these trials were conducted jointly or in tandem). |
| Other bias | Unclear risk | Possible imbalance: most women with a preterm birth in the omega‐3 group had a history of preterm birth in contrast to 1 woman in the placebo group. |
| Methods | RCT: NCT00711971: Mothers, Omega‐3, and Mental Health Study 3 arms | |
| Participants | 126 women randomised (2 omega‐3 groups and 1 control group) Inclusion criteria: a past history of depression (EPDS score 9‐19), singleton gestation, a maternal age of ≥18 years, and a GA of 12‐20 weeks Exclusion criteria: women with history of a bleeding disorder, thrombophilia requiring anticoagulation, multiple gestation, bipolar disorder, current major depressive disorder, current substance abuse, lifetime substance dependence or schizophrenia. Women were also ineligible if they were taking omega‐3 fatty acid supplements or antidepressant medications or eating more than 2 fish meals per week. The Mini‐International Neuropsychiatric Interview was also used to exclude current major depressive disorder, bipolar disorder, current substance abuse or dependence, suicidal ideation or schizophrenia. Setting: The University of Michigan Health System and St Joseph’s Mercy Hospital Health System, in southeastern Michigan, USA from October 2008 to May 2011 | |
| Interventions | SUPPLEMENTATION: EPA versus DHA versus placebo (soy oil) Group 1: EPA‐rich fish oil supplementation (1060 mg EPA plus 274 mg DHA): 2 large EPA‐rich fish oil capsules and 4 small placebo capsules (double‐dummy design); total number randomised: n = 42 (39) Group 2: DHA‐rich fish oil supplementation (900 mg DHA plus 180 mg EPA): 2 large placebo capsules and 4 small DHA‐rich fish oil capsules; total number randomised: n = 42 (38) Group 3: soy oil placebo (98% soybean oil and 1% each of lemon and fish oil): 2 large and 4 small placebo capsules; total number randomised: n = 42 (41) Timing of supplementation: from 12‐20 weeks GA to 6‐8 weeks postpartum DHA + EPA dose/day: Group 1: high: 274 mg DHA + 1060 mg EPA Group 2: high: 900 mg DHA + 80 mg EPA | |
| Outcomes | Women/birth: PE/hypertension; caesarean section; induction of labour; PPH (blood loss); adverse effects; cessation of the intervention; gestational diabetes; postnatal depression; length of gestation; spontaneous vaginal birth; operative vaginal birth; birthweight; cytokines Babies/infants/children: admission to NICU; cytokines (cord blood) (Allergy (childhood eczema at 36 months) was reported, but is covered by another Cochrane review, Gunaratne 2015) | |
| Notes | Funding: NIH grant R21 AT004166‐03S1 (National Center for Complementary and Alternative Medicine) and a University of Michigan Clinical Research Initiatives grant and by the University of Michigan General Clinical Research Center, now the Michigan Clinical Research Unit. This study was also supported (in part) by the NIH through the University of Michigan’s Cancer Center Support Grant (P30 CA046592), and by the National Center for Research Resources and the National Center for Advancing Translational Sciences, NIH, through grant 8UL1TR000041, for the Clinical and Translational Science Center, University of New Mexico. The Nordic Naturals Corporation donated both active supplements and placebos to the trial. Declarations of interest: “E.L.M. was an invited speaker at the Nutracon 2012 Conference, sponsored by the Global Organization for EPA and DHA Omega‐3s (GOED), Anaheim, CA, March 7–8, 2012, and received reimbursement for travel expenses. The remaining authors report no conflict of interest” | |
| Risk of bias | ||
| Bias | Authors' judgement | Support for judgement |
| Random sequence generation (selection bias) | Low risk | Quote: “Randomization was carried out using a random number table maintained in the University of Michigan Investigational Drug Service.” |
| Allocation concealment (selection bias) | Low risk | Quote: “Randomization was carried out using a random number table maintained in the University of Michigan Investigational Drug Service.” (central randomisation) |
| Blinding of participants and personnel (performance bias) | Low risk | Quote: “The placebos were formulated to be identical in appearance to both the EPA‐ and DHA‐rich supplements … Because the EPA and DHA capsules were not identical in appearance, we used a double‐dummy design to maintain blinding.” |
| Blinding of outcome assessment (detection bias) | Unclear risk | Not specifically detailed |
| Incomplete outcome data (attrition bias) | Low risk | Loss to follow‐up (and exclusion from analyses):
(7/8 women were lost to follow‐up; 1 woman in the DHA group had a second‐trimester pregnancy loss attributed to cervical insufficiency). |
| Selective reporting (reporting bias) | Low risk | Trial protocol available; no evidence of selective reporting (though data on adverse effects reported in text only). |
| Other bias | Low risk | Baseline characteristics reported were well balanced across the 3 groups. |
| Methods | RCT: NCT00620672 | |
| Participants | 270 women randomised Inclusion criteria: women at 16 weeks' gestation or less, not taking any lipid or fatty acid supplement, who were expected to deliver 1 infant at full‐term gestation, with no maternal or fetal complications Exclusion criteria: diabetes, cardiac disease, renal disease, tuberculosis, HIV/AIDS, hepatitis, previous pregnancy complications, substance abuse Setting: Vancouver, Canada: 2004 to 2008 | |
| Interventions | SUPPLEMENTATION: DHA versus placebo Group 1: DHA: 400 mg/day (given as algal oil triglycerides). The supplements were provided in identical capsules in bottles with more than sufficient supplements to cover the study interval: total number randomised = 132 Group 2: placebo: equivalent amount of corn and soybean oil blended to reflect the dietary 18:2 omega‐6 and 18:3 omega‐3 ratio (but in amounts quantitatively insignificant compared to usual intakes): total number randomised n = 138 Timing of supplementation: from enrolment (˜16 weeks) to 36 weeks GA DHA + EPA dose/day: low: 400 mg DHA + EPA not stated | |
| Outcomes | Women/birth: RBC DHA; dietary intake at 16 and 36 weeks GA; GWG; breast milk DHA; breastfeeding monthly Babies/infants/children: birthweight; infant mortality; weight at 2, 6, 9, 12 and 18 months; length at 2, 6, 9, 12 and 18 months; weight for length at 18 months; weight for age at 18 months; visual acuity at 2 months, 12 months and 5.75 years; language at 14‐18 months and 5.75 years; problem‐solving; MacArthur Communicative Development Inventory; BSID‐III; all at 18 months at 5.75 years: PPVT, K‐ABC scores, lipids, attention (TOVA) | |
| Notes | Funding: Canadian Institutes for Health Research Declarations of interest: none declared | |
| Risk of bias | ||
| Bias | Authors' judgement | Support for judgement |
| Random sequence generation (selection bias) | Low risk | Computer‐generated, random codes |
| Allocation concealment (selection bias) | Unclear risk | Use of sealed, opaque envelopes |
| Blinding of participants and personnel (performance bias) | Low risk | The supplements were identical in appearance, and contained an orange flavour mask. |
| Blinding of outcome assessment (detection bias) | Low risk | As above; plus "testers blinded to the infant group” |
| Incomplete outcome data (attrition bias) | Unclear risk | Lost to follow‐up at 36 weeks from: DHA group: 27/132 (20%):
Placebo group: 23/138 (17%):
At 18 months losses to follow‐up were:
(with higher losses for some of the anthropometric assessments) At 5.75 years losses to follow‐up were:
|
| Selective reporting (reporting bias) | Unclear risk | Adverse birth outcomes treated as exclusions; not clearly reported. |
| Other bias | Unclear risk | There were more boys born in the placebo group than the DHA group; no other obvious sources of bias identified. |
| Methods | RCT: NCT00801502 (SiPs) | |
| Participants | 123 women randomised Inclusion criteria: women with a diet low in oily fish (excluding canned tuna) (intake ≤ twice per month); with a family history of atopy, allergy or asthma (1 or more of the first‐degree relatives of the infant affected by atopy, allergy or asthma by self‐report); age 18‐40 years; < 19 weeks GA; healthy uncomplicated singleton pregnancy; not using fish oil supplements currently or in the previous 3 months Exclusion criteria: participation in another research study; known diabetic; presence of any autoimmune disease, learning disability, terminal illness or mental health problems Setting: catchment area of the Princess Anne Hospital, Southampton University Hospitals NHS Trust, Southampton, UK (recruitment and study dates not reported) | |
| Interventions | FISH DIET versus USUAL DIET (low in oily fish) Group 1: farmed salmon: women were provided with 2 x 150 g portions of farmed salmon a week and a cookbook of salmon recipes). The salmon (see below) was delivered to the homes of these women in individual frozen and vacuum‐packed portions (150 g) on a monthly basis; sufficient portions were provided for each woman and her partner. Salmon for use in the SiPS were raised at Skretting Aquaculture Research Centre, Stavanger, Norway. Each 150‐g salmon portion contained (on average) 30.5 g protein, 16.4 g fat, 0.57 g EPA, 0.35 g DPA (22:5n23), 1.16 g DHA, 3.56 g total omega‐3 PUFA, 4.1 mg α‐tocopherol, 1.6 mg γ‐tocopherol, 6 μg vitamin A (sum of all retinols), 14 μg vitamin D3, and 43 μg selenium; variance in content of all nutrients among several analysed portions was: 5% for protein and fat; 10% for individual fatty acids, α‐tocopherol, and γ‐tocopherol; and 20% for vitamin A, vitamin D3, and selenium. Thus, 2 portions of salmon/wk would typically provide 3.45 g EPA +DHA, 28 μg vitamin D3, and 86 μg selenium. Total number randomised: n = 62 Group 2: usual diet: women were asked to continue their habitual diets; these women also received the information sheet that described the possible health benefits of consuming oily fish during pregnancy and the government recommendation that pregnant women consume 1 or 2 oily fish meals/week. In addition, they received a cookbook providing recipes for healthy eating during pregnancy. All women: received a diary in which to record any seafood consumed during the course of the study and the nature of its preparation and cooking. Total number randomised: n = 61 Timing of supplementation: 20 weeks GA to birth DHA + EPA dose/day: low: 330 mg DHA + 160 mg EPA | |
| Outcomes | Women/birth: adherence, caesarean section, adverse effects; length of gestation Babies/infants/children: birthweight; birth length; head circumference; ILs (cord blood); IgE (birth and at 6 months); incidence and severity of atopic eczema at 6 months, skin prick test positivity at 6 months | |
| Notes | Funding: supported by the European Commission under Framework 6: Sustainable aqua feeds to maximize the health benefits of farmed fish for consumers (Aquamax; FOOD‐CT‐2006‐16249). 2 researchers were supported by the Southampton NIHR Biomedical Research Unit in Nutrition, Diet & Lifestyle. Salmon was donated by the University of Bergen, Norway. Declarations of interest: Grethe Roselunf is employed by a company that produces feed for farmed salmon. None of the other authors had any personal or financial conflicts of interest. | |
| Risk of bias | ||
| Bias | Authors' judgement | Support for judgement |
| Random sequence generation (selection bias) | Low risk | Quote: “The women were allocated to 1 of 2 groups according to a previously generated random number table”. |
| Allocation concealment (selection bias) | Unclear risk | No details reported |
| Blinding of participants and personnel (performance bias) | Unclear risk | Quote: "single blind" |
| Blinding of outcome assessment (detection bias) | Low risk | Researchers responsible for assessing outcomes measures (both laboratory and clinical) remained blinded to the groups. |
| Incomplete outcome data (attrition bias) | Unclear risk | 123 enrolled at 19‐20 weeks (62 salmon, 61 control):
Therefore 53/62 (86%) remained in salmon group and 54/61 (89%) in control group at birth. |
| Selective reporting (reporting bias) | Unclear risk | Very few clinical outcomes have been reported; trial registration brief and no access to trial protocol. |
| Other bias | Low risk | Baseline characteristics were comparable between groups. |
| Methods | RCT: FOSS: ISRCTN24068733 | |
| Participants | 300 women randomised (normal healthy controls (n = 50), women identified at risk of having a low birthweight baby either spontaneously (n = 100) or because of developing PE (n = 100), and women at risk of gestational diabetes (n = 50). Inclusion criteria: healthy women and women at risk of developing pregnancy‐related complications PE, fetal growth restriction, gestational diabetes Exclusion criteria: women with known allergy to fish and fish oil, non‐English speakers who decline the use of an interpreter and those unable or unwilling to attend follow‐up appointments; women with chronic disease such as HIV, cirrhosis or other chronic liver disease, hepatitis B and C carriers; women previously on regular pre‐conceptual fish oil supplement or who, for different reasons, were not able to give competent, written consent Setting: Chelsea and Westminster Hospital, London, UK | |
| Interventions | SUPPLEMENTATION + OTHER AGENT: DHA + EPA + AA versus placebo Group 1: 2 capsules daily of DHA‐enriched formula (each capsule contained 300 mg of DHA, 42 mg of EPA and 8.4 mg of AA): total number randomised unclear Group 2: placebo: 2 capsules daily (high oleic acid sunflower seed oil – 721 mg oleic acid); total number randomised unclear Timing of supplementation: from 8‐12 weeks' gestation DHA + EPA dose/day: mid: 600 mg DHA + 84 g EPA | |
| Outcomes | Women/birth: maternal neurobehavioural outcomes (listed in trial registration entry), maternal lipid profile Babies/infants/children: MRI brain scan findings; infant developmental outcomes (no outcomes yet reported by intervention and control group ‐ Ogundipe 2016 reports overall GA, birthweight, birth length, head circumference at birth, low birthweight) | |
| Notes | No outcomes could be used in this review to date. Funding: The Mother and Child Foundation, Letten Foundation, Waterloo Foundation and Vifor Pharma, Switzerland. Declarations of interest: not reported | |
| Risk of bias | ||
| Bias | Authors' judgement | Support for judgement |
| Random sequence generation (selection bias) | Unclear risk | Not reported |
| Allocation concealment (selection bias) | Unclear risk | Not reported |
| Blinding of participants and personnel (performance bias) | Unclear risk | Not reported |
| Blinding of outcome assessment (detection bias) | Unclear risk | Not reported |
| Incomplete outcome data (attrition bias) | Unclear risk | Not reported |
| Selective reporting (reporting bias) | Unclear risk | Not reported |
| Other bias | Unclear risk | Not reported |
| Methods | 3‐arm trial; NCT01126762: 'Food for thought' (pilot study) | |
| Participants | 61 women randomised Inclusion criteria: women 12‐22 weeks GA, consuming ≤ 2 fish servings/month, ≥18 years of age, singleton pregnancy, planning to remain in Boston till the birth, women with no contraindications to fish consumption such as allergy, or self‐restrictions such as vegetarian diet Exclusion criteria: as indicated above Setting: Harvard Medical School or participant’s homes, greater Boston, USA (recruited April to October 2010) | |
| Interventions | DIETARY ADVICE: Advice to consume fish versus advice + vouchers versus generic advice Group 1: advice to consume low‐mercury/high‐DHA fish; 8‐page booklet and resources on safe fish consumption and health benefits; weekly emails; total number randomised: n = 20 (17) Group 2: advice and grocery store gift cards to purchase fish; 8‐page booklet on safe fish consumption and health benefits; weekly emails; USD 120 value in gift cards (USD 40 at baseline, first month and second month = USD 10 a week); total number randomised: n = 20 (18) Group 3: generic advice (control): 8‐page generic advice on pregnancy nutrition; weekly emails; total number randomised: n = 21 (20) All women: USD 25 gift card at baseline and completion DHA + EPA dose/day: unclear | |
| Outcomes | Women/birth: fish intake (using 1 month fish intake FFQ) and fruit, vegetables, dairy, nuts and meat; use of DHA supplements; women’s opinions and attitudes about fish consumption; DHA (plasma); mercury (blood and hair); preterm birth; maternal mortality; stillbirth; gestational diabetes; PE; gestational hypertension; induction of labour; caesarean birth; postpartum depressive symptoms | |
| Notes | Funding: NIH; HSPH‐NIEHS Center for Environmental Health, Harvard Clinical Nutrition Research Center; Harvard Pilgrim Health Care Institute Declarations of interest: none declared | |
| Risk of bias | ||
| Bias | Authors' judgement | Support for judgement |
| Random sequence generation (selection bias) | Low risk | Random number table |
| Allocation concealment (selection bias) | Low risk | Sealed opaque envelopes, sequentially opened |
| Blinding of participants and personnel (performance bias) | Low risk | Quote: “All study staff were blinded to group assignment before baseline measures were collected. To minimize bias introduced by non‐blinding of the single research assistant who both delivered the intervention and collected follow‐up data, self‐reported data were collected by self‐administered questionnaire rather than by interview. Laboratory staff, statistical analysts, and study investigators remained blinded to group assignment throughout data collection and analysis.” |
| Blinding of outcome assessment (detection bias) | Low risk | Quote: "Laboratory staff, statistical analysts, and study investigators remained blinded to group assignment throughout data collection and analysis.” |
| Incomplete outcome data (attrition bias) | Unclear risk | 6/61 (10%) women were lost to follow‐up (2 in the advice group discontinued intervention (1 died)); and 1 and 3 in the control and advice + gift card groups respectively Post birth outcomes were not available for 13/61 (21%) women – 9/40 in the 2 intervention arms and 4/21 in the control arm. |
| Selective reporting (reporting bias) | Unclear risk | Specific figures for most birth outcomes not reported (only direction of effect). |
| Other bias | Unclear risk | Baseline characteristics similar, except for a higher proportion of women working full time in the advice + gift card group. |
| Methods | NCT01353807 3‐arm RCT in a ratio of 2:1:1: for fish oil, olive oil, and no supplement | |
| Participants | 533 women randomised Inclusion criteria: healthy women, at approximately 30 weeks' gestation, aged 18‐44 years Exclusion criteria: history of placental abruption, a serious bleed in the current pregnancy, use of PG inhibitors, multiple pregnancy, fish allergy or regular intake of fish oil Setting: main midwifery clinic, Aarhus, Denmark | |
| Interventions | SUPPLEMENTATION: omega‐3 versus olive oil versus no supplement Group 1: fish oil (2.7 g omega‐3 fatty acids/day) given as 4 x 1 g capsules/day containing fish oil (Pikasol 32% EPA (20:5n‐3), 23% DHA (22:6n‐3)) and 2 mg tocopherol/mL: total number randomised = 266 Group 3: no supplement: total number randomised = 131 Timing of supplementation: from ˜30 weeks GA to birth DHA + EPA dose/day: high: 864 mg DHA + 621 mg EPA | |
| Outcomes | Women/birth: SBP and DBP, PIH, PE, food frequency questionnaire*, preterm birth < 37 weeks, caesarean, congenital anomalies, blood loss, maternal adverse effects At 16‐year follow‐up: asthma, atopic dermatitis, allergic rhinitis At 19‐year follow‐up: insulin, glucose, glycated Hb, leptin, adiponectin, insulin‐like growth factor 1, high sensitivity CRP, height, weight, BMI, waist circumference *enabled women to be classified into low, medium and high habitual intake of fish | |
| Notes | Sample size estimates were done but not reported in the papers because they were regarded as posthoc by authors (personal communication). Women completed baseline information regarding fish intake. Outcome assessment was blinded, but 85% of women in the fish oil group correctly identified their group allocation, whereas for olive oil 50% identified the correct oil. Funding: "This study was supported by the Danish Medical Research council (J No 12‐9052) and 12‐9144), Sygekassernes Helsefond, Weirnan's Legat and Michaelsen Fonden". Capsules were provided by Lube Ltd, Hadsund, Denmark. Follow‐up was supported by the EU FP5 consortium, Early Nutrition Programming Project, NIH, The Danish Strategic Research Council, The Danish Heart Foundation, The Novo Nordisk Foundation, The Danish Diabetes Foundation, The Aase and Ejnar Danielsens Foundation, and the National Center for Complementary and Alternative Medicine. Declarations of interest: JE Chavarro and Sjurdur F Olsen received research support from the NIH. The rest of the authors declared that they had no relevant conflicts of interest. | |
| Risk of bias | ||
| Bias | Authors' judgement | Support for judgement |
| Random sequence generation (selection bias) | Unclear risk | Stratified and block randomisation |
| Allocation concealment (selection bias) | Low risk | A sealed, opaque envelope containing a randomisation number which identified either a particular package of oil capsules or no treatment. |
| Blinding of participants and personnel (performance bias) | Unclear risk | Capsules and their boxes looked identical for fish oil and olive oil; however the no treatment group was unblinded. |
| Blinding of outcome assessment (detection bias) | Unclear risk | Not reported, apart from that at 19‐year follow‐up outcome assessors were blinded to group allocation. |
| Incomplete outcome data (attrition bias) | Low risk | No post‐randomisation exclusions and no losses to follow‐up; at 19‐year follow‐up: n = 243 completed physical examination (out of 517 mother/child dyads alive and still living in Denmark); 41% were from the fish oil group and 53% were from the olive oil/no oil group. |
| Selective reporting (reporting bias) | Low risk | Most expected outcomes were reported. |
| Other bias | Low risk | Similar baseline characteristics |
| Methods | Multicentre RCT: NCT02229526 (FOTIP) with 6 different subsets (A to F) of eligibility criteria. The 6 subsets had a standard protocol, and were mutually exclusive. Trials A‐D were prophylactic trials in women after 16 weeks' gestation, with uncomplicated pregnancies: A: previous preterm birth (before 259 days gestation); n = 232 B: IUGR (< 5th centile); n = 280 C: PIH (DBP > 100 mmHg); n = 386 D: current twin pregnancies: n = 579. Trials E and F were therapeutic trials, enrolling women around 33 weeks' gestation: E: signs or symptoms of PE in the current pregnancy (± IUGR): n = 79; or F: suspected IUGR (< 10th centile by ultrasonography) in current pregnancy: n = 63. | |
| Participants | 1647 women randomised (fish oil: 818, olive oil: 829) Inclusion criteria Prophylactic trials: women after 16 weeks' gestation with an uncomplicated pregnancy, who in an earlier pregnancy had experienced preterm birth (before 259 days gestation); IUGR (< 5th centile); PIH (DBP > 100 mmHg); or women with current twin pregnancies Therapeutic trials: women with threatening PE (women with signs or symptoms or PE) or suspected IUGR (< 10th centile). Exclusion criteria: diabetes mellitus in or before pregnancy, diagnosed severe fetal malformation or hydrops in current pregnancy, suspicion in current pregnancy or occurrence in an earlier pregnancy of placental abruption, drug or alcohol abuse, regular intake of fish oil or of NSAIDs or other drugs with an effect on thrombocyte function or eicosanoid metabolism, allergy to fish products. In the therapeutic trials, an additional exclusion criterion was: high probability of delivering soon after randomisation (within 1 week). Setting: 19 hospital centres in Denmark, Scotland, Sweden, England, Italy, the Netherlands, Norway, Belgium and Russia | |
| Interventions | SUPPLEMENTATION: omega‐3 (EPA/DHA) versus control (olive oil) Group 1: omega‐3 (2.7 g/day (1.3 g EPA and 0.9 g DHA)), given as 4 capsules/day in the prophylactic trials and 9 capsules per day in the therapeutic trials (6.1 g/day: 2.9 g EPA and 2.1 DHA): total n = 818 Timing of supplementation: prophylactic trials: ˜20 weeks' gestation to birth; therapeutic trials ˜33 weeks' gestation to birth DHA + EPA dose/day: prophylactic trials: high: 900 mg DHA + 1300 mg EPA DHA + EPA dose/day: therapeutic trials: high: 2100 mg DHA + 2900 EPA | |
| Outcomes | Subset A: preterm birth (< 37 weeks), early preterm birth (< 34 completed weeks), low birthweight, length of gestation, birthweight Threat‐PE trial: duration until birth Susp‐IUGR trial: weight for GA Elective births were defined as induced vaginal births or prelabour caesareans. | |
| Notes | Sample size estimates were modified during the course of the study: sample size determinations were undertaken twice in the study; after 4 years of enrolment, it was realised the original estimated sample sizes were unrealistically large, therefore a stopping strategy was developed (based on a number of primary hypotheses, defined a priori for the prophylactic trials). Funding: Concerted Action (ERB‐BMH1‐CT92‐1906) and PECO (ERB‐CIPD‐CT94‐0235) programmes of the European Commission, and the Danish National Research Foundation. Lube Ltd provided Pikasol fish oil and olive oil capsules. Declarations of interest: not reported | |
| Risk of bias | ||
| Bias | Authors' judgement | Support for judgement |
| Random sequence generation (selection bias) | Low risk | Restricted blockwise computer‐generated randomisation was used |
| Allocation concealment (selection bias) | Low risk | Quote: "Randomisation identified a package number at the relevant centre, where packages were ordered in a random way as to oil type". Placebo capsules were identical looking but contained olive oil. |
| Blinding of participants and personnel (performance bias) | Low risk | Quote: "Both oils were provided in 1 g identical looking gelatine capsules, which were not identical in taste; packages with capsules were identified by a cryptographed number, the code of which was known only by the data manager"; however a questionnaire completed by a subgroup of women indicated that 80% of women in the fish oil group could guess their allocation. |
| Blinding of outcome assessment (detection bias) | Low risk | Assessments were blinded (correspondence with Olsen). |
| Incomplete outcome data (attrition bias) | Low risk | Overall, 1647 women randomised (fish oil: 818, olive oil: 829), trial entry forms received for: 98% in both groups, follow‐up forms received for 97% in both groups (and compliance forms for 68% in both groups). |
| Selective reporting (reporting bias) | Unclear risk | Not all outcomes were measured in all groups. |
| Other bias | Low risk | Baseline characteristics were similar between groups except for women with suspected IUGR where GA at enrolment was higher in the olive oil group.. |
| Methods | Twins (see Olsen 2000) | |
| Participants | ||
| Interventions | ||
| Outcomes | ||
| Notes | ||
| Methods | RCT | |
| Participants | 232 women randomised (161 multigravida and 72 primigravida) Inclusion criteria: mean 24 weeks' gestation with high‐risk singleton pregnancy: history of 1 or more small babies (birthweight < 3rd percentile), history of pregnancy hypertension, history of unexplained stillbirth, or primigravida with abnormal uterine Doppler at 24 weeks' gestation Exclusion criteria: history of diabetes mellitus, chronic hypertension, asthma, use of anticoagulants, multiple pregnancy Setting: antenatal clinic, St James's University Hospital, Leeds, UK | |
| Interventions | SUPPLEMENTATION: EPA + DHA versus placebo Group 1: 2.7 g of MaxEPA/day (n = 113): 9 capsules/day provided 1.62 g EPA and 1.08 g DHA Timing of supplementation: from a mean of 24 weeks to 38 weeks' gestation EPA + DHA dose/day: high: 1080 mg DHA + 1620 mg EPA | |
| Outcomes | Women/birth: length of gestation; preterm birth < 37 weeks; preterm birth < 32 weeks; duration and mode of onset of labour; mode of birth; PIH, PE, adverse events (75 women only) | |
| Notes | Sample size estimate was given for proteinuric hypertension All women were asked to avoid NSAIDs Adherence: 50% of women in the fish oil group and 57% of women in the placebo group took < 70% of capsules. Protocol variations: 1 woman in the omega‐3 arm took aspirin and 1 women in the placebo arm purchased fish oil privately. Funding: Yorkshire Region Locally Organised Research; GLAXO (Leeds); Sevens Seas (Hull) Declarations of interest: not reported | |
| Risk of bias | ||
| Bias | Authors' judgement | Support for judgement |
| Random sequence generation (selection bias) | Low risk | Random numbers were generated by computer. |
| Allocation concealment (selection bias) | Low risk | Random numbers were kept in sealed, opaque, numbered envelopes in the hospital pharmacy and pharmacy staff allocated the trial treatments. |
| Blinding of participants and personnel (performance bias) | Low risk | Placebo capsules were identical to treatment capsules (44% of a subgroup of women identified that they were in the fish oil group). |
| Blinding of outcome assessment (detection bias) | Low risk | Outcome assessments were blinded. |
| Incomplete outcome data (attrition bias) | Low risk | 1/233 (0.4%) post‐randomisation exclusions (one woman with a multiple pregnancy was randomised in error) Adverse events were reported only for a small subsample; 76/233 (33%) women returned the questionnaires. |
| Selective reporting (reporting bias) | High risk | Limited range of outcomes reported; no SDs reported for continuous outcomes (length of gestation; birthweight). |
| Other bias | Low risk | Baseline characteristics were similar in supplement and placebo groups. |
| Methods | RCT | |
| Participants | 24 women randomised Inclusion criteria: healthy pregnant women in the second trimester, aged 20‐38 years, with singleton pregnancies Setting: Department of Obstetrics and Gynecology, University Hospital Maastricht; and midwifery practices in the Maastricht area, the Netherlands | |
| Interventions | SUPPLEMENTATION + OTHER AGENT: DHA + AA versus no treatment Group 1: DHA capsules (algal oil: 0.57 g DHA/day) and AA (fungal‐derived oil: 0.26 g/day) for 4 weeks: total number randomised = 12 Group 2: no supplements: total number randomised = 12 Timing of supplementation: from 17‐20 weeks' gestation DHA + EPA dose/day: mid: 570 mg DHA; negligible EPA | |
| Outcomes | Women: fish and seafood consumption at the end of the study; plasma phospholipid fatty acids after 4 weeks; adverse events | |
| Notes | 3 women in each group reported consuming fish once a week during the 4 week study period. Funding: Martek Corporation (donation of capsules); Numico BV, the Netherlands Declarations of interest: not reported | |
| Risk of bias | ||
| Bias | Authors' judgement | Support for judgement |
| Random sequence generation (selection bias) | Unclear risk | Quote: "randomly assigned" |
| Allocation concealment (selection bias) | Unclear risk | Quote: "randomly assigned" |
| Blinding of participants and personnel (performance bias) | High risk | Not blinded |
| Blinding of outcome assessment (detection bias) | Unclear risk | Not reported |
| Incomplete outcome data (attrition bias) | Low risk | All 12 women completed the study. |
| Selective reporting (reporting bias) | High risk | Limited number of outcomes reported. |
| Other bias | Low risk | Baseline characteristics were similar, apart from more primigravida in the supplement group (8/12 versus 5/12 in the control group). |
| Methods | RCT | |
| Participants | 300 women Inclusion criteria: < 8 weeks' gestation; Caucasian women aged 22‐35 years; singleton pregnancy; BMI ≥ 18.5 and ≤ 25; habitual fish consumption (at least twice a week); high school or university degree; average socioeconomic status; absence of uterine abnormalities (fibroids, cervical incompetence; uterine malformations etc.) Exclusion criteria: smoking, substance abuse including alcohol; allergy to fish or derivatives; diabetes, hypertension, metabolic, cardiovascular, renal, psychiatric, neurological, thrombophilic, thyroid or autoimmune disease; previous pregnancy complications (miscarriage, preterm or operative birth); previous uterine surgery (myomectomy, cervical conisation, trachelorraphy, caesarean etc.); recurrent genito‐urinary infections Setting: Department of Obstetrics and Gynaecology, San Camillo Forlanini Hospital, Rome, Italy | |
| Interventions | SUPPLEMENTATION + DIET: DHA + fish versus placebo + fish Group 1: omega‐3 (2 capsules of DHA (100 mg each) administered daily); total number randomised: n = unclear (129) Group 2: placebo (2 capsules of olive oil); total number randomised: n = unclear (126) All women: controlled diet (high protein ˜17%; low in carbohydrates ˜54%; fat ˜2%; omega‐3 (600 g fish/week); increased calorie requirements (+200 Kcal); food diary for a week a month Timing of supplementation: from 8 weeks GA until birth DHA + EPA dose/day: low: 200 mg DHA; EPA not stated | |
| Outcomes | Women: lipids; food diary; rupture of membranes | |
| Notes | Funding: Ministry of Health, Rome, Italy Declarations of interest: none declared | |
| Risk of bias | ||
| Bias | Authors' judgement | Support for judgement |
| Random sequence generation (selection bias) | Unclear risk | Not reported |
| Allocation concealment (selection bias) | Unclear risk | Not reported |
| Blinding of participants and personnel (performance bias) | Unclear risk | Not reported |
| Blinding of outcome assessment (detection bias) | Unclear risk | Not reported |
| Incomplete outcome data (attrition bias) | Unclear risk | Not clear, but if 300 women were randomised, then 45/300 (15%) were lost to follow‐up |
| Selective reporting (reporting bias) | High risk | Only rupture of membranes reported |
| Other bias | Low risk | Similar baseline characteristics |
| Methods | RCT: parallel; NCT00646360: POSGRAD (Prenatal Omega‐3 fatty acid Supplements, Growth, and Development) | |
| Participants | 1094 women randomised Inclusion criteria: women 18‐35 years old, at 18‐22 weeks' gestation, who planned to give birth at the Mexican Institute of Social Security General Hospital (IMSS) in Cuernavaca, exclusively or predominately breastfeeding for at least 3 months, and planned to live in the area for at least 2 years after giving birth Exclusion criteria: high‐risk pregnancy (history or prevalence of pregnancy complications: abruptio placenta, PE, PIH, any serious bleeding episode in current pregnancy, physician referral), lipid metabolism or abruption disorders, regular intake of fish oil or DHA supplements, or chronic use of certain medications (e.g. for epilepsy) Characteristics: medium‐low socioeconomic status; low baseline omega‐3; high omega 6:omega 3 ratio Primiparae and multipara results presented separately. Setting: Mexico: hospital (routine antenatal); IMMS, Cuernavaca, Mexico, and 3 small health clinics (study conducted between February 2005 and February 2007 | |
| Interventions | SUPPLEMENTATION: DHA versus placebo Group 1: DHA: 400 mg daily; capsules contained 200 mg DHA derived from an algal source. Women were instructed to take 2 capsules, together, at the same time each day: total number randomised: n = 547 Group 2: placebo: daily; placebo capsules contained olive oil or soy/corn mix and were similar in appearance and taste to the DHA capsules: total number randomised: n = 547 Timing of supplementation: 18‐22 weeks GA (mean 20.6 weeks) to birth DHA + EPA dose/day: low: 400 mg DHA; EPA not stated | |
| Outcomes | Women: nausea; vomiting; vaginal bleeding; GA; caesarean section; cessation of supplements; adherence Birth/infant/child:
| |
| Notes | Adherence: 88%; did not differ by treatment group Funding: NIH (HD‐043099) and the March of Dimes Foundation Declarations of interest: Y Gutierrez‐Gomez, AD Stein, U Ramakrishnan, A Barraza‐Villarreal, H Moreno‐Macias, C Aguilar‐Salinas, I Romieu, and JA Rivera declared no conflicts of interest | |
| Risk of bias | ||
| Bias | Authors' judgement | Support for judgement |
| Random sequence generation (selection bias) | Low risk | Quote: “We used block randomization to randomly create balanced replication of four treatments (two colors for DHA and two for control) using a block size of eight. The list was generated for a sample size of 1,104” ‐ probably done |
| Allocation concealment (selection bias) | Low risk | Quote: “The assignment codes were placed in sealed envelopes at the beginning of the study, and these envelopes were held in a sealed location by a faculty member … who was not involved in the study.” |
| Blinding of participants and personnel (performance bias) | Low risk | Quote: "All the study participants and members of the study team remained blinded to the treatment scheme throughout the intervention period of the study. Data were unblinded for the analytical study team after the last baby in the study was born and had reached 6 months of age, at which time the participants were no longer taking supplements. Since the study is ongoing for follow‐up of child development, the participants and fieldworkers in Mexico remain blinded to the treatment allocation” |
| Blinding of outcome assessment (detection bias) | Low risk | Quote: "All the study participants and members of the study team remained blinded to the treatment scheme throughout the intervention period of the study. Data were unblinded for the analytical study team after the last baby in the study was born and had reached 6 months of age, at which time the participants were no longer taking supplements. Since the study is ongoing for follow‐up of child development, the participants and fieldworkers in Mexico remain blinded to the treatment allocation” |
| Incomplete outcome data (attrition bias) | Unclear risk | 1094 randomised (547 to each group); birthweight analysed for 487/547 in the DHA group and 486/547 in the placebo group (and GA analysed for 486/547 and 484/547) = 11% loss to follow‐up in the DHA group and 11% in the placebo group. Reasons for loss to follow‐up similar among groups; though the women in the final sample with birth outcomes (973) were of higher socioeconomic status than randomised women for whom birth outcomes were not available (121). 18‐month follow‐up (growth): 739 children at 18 months (76.0% of birth cohort), loss to follow‐up did not differ by treatment assignment; children lost to follow‐up were lighter at birth, had smaller head circumferences at birth, and were more likely to have a low birthweight compared with those assessed at 18 months (and in the 18‐month sample, women who received DHA were shorter than those who received placebo). 18‐month follow‐up (development: 730 included in analyses (“Comparison of the final sample with outcome data (n = 730) to those randomised but lost to follow‐up (n = 364) showed that the offspring in the final sample were similar in terms of selected maternal and infant characteristics including treatment group”). 4‐year follow‐up: data available for DHA: 51% (276) children and placebo: 45% (248) children 5‐year follow‐up: 802 children (DHA 403: placebo 399) = 73% of those randomised. |
| Selective reporting (reporting bias) | Unclear risk | Trial registered retrospectively |
| Other bias | Low risk | No obvious sources of other bias; similar baseline characteristics |
| Methods | RCT: IRCT138706061113N1 | |
| Participants | 100 women Inclusion criteria: women with risk of PE (primiparous women, aged < 20 years and > 40 years, previous history of PE or a positive family history, twin pregnancy, BMI > 29, history of renal disease and hypertension), not using any anticoagulant or antihypertension drugs at the time of entering the study Exclusion criteria: none specified Setting: Qazvin city, Iran | |
| Interventions | SUPPLEMENTATION: omega‐3 (EPA + DHA) versus placebo Group 1: omega‐3 (EPA + DHA ‐ individual doses not specified), 1 g daily: n = 50 Group 2: placebo (starch): n = 50 Timing of supplementation: from 14‐18 weeks GA to end of pregnancy DHA + EPA dose/day: unclear | |
| Outcomes | Women/birth: BP (mmHg); PE, hypertension, caesarean birth; birthweight Babies/infants/children: Apgar score at 5 minutes | |
| Notes | Funding: not reported Declarations of interest: not reported | |
| Risk of bias | ||
| Bias | Authors' judgement | Support for judgement |
| Random sequence generation (selection bias) | Unclear risk | Quote: “randomly divided” |
| Allocation concealment (selection bias) | Unclear risk | Quote: “randomly divided” |
| Blinding of participants and personnel (performance bias) | Low risk | Described both as single‐ and double‐blind; placebo‐controlled so probably done. |
| Blinding of outcome assessment (detection bias) | Unclear risk | Not reported |
| Incomplete outcome data (attrition bias) | Low risk | No losses to follow‐up reported. |
| Selective reporting (reporting bias) | Unclear risk | Some outcomes not fully reported. |
| Other bias | Low risk | Baseline characteristics were similar. |
| Methods | RCT (4 arms, see below) | |
| Participants | 120 women randomised Inclusion criteria: 18‐40 years; without prior diabetes; diagnosed with GDM at 24‐28 weeks’ gestation Exclusion criteria: taking omega‐3 fatty acid supplements; insulin therapy; placental abruption; PE; eclampsia; hypo‐ and hyperthyroidism; smokers Setting: Ardabil, Iran (conducted from September 2016 to March 2017) | |
| Interventions | SUPPLEMENTATION: omega‐3 versus omega‐3 + vitamin D versus vitamin D versus placebo Group 1: omega‐3 fatty acids (2000 mg size of capsules containing 360 mg EPA and 240 mg DHA per day) as 2 capsules plus placebo vitamin D capsules; n = 30 randomised (all completed) Group 2: omega‐3 fatty acids (2000 mg size of capsules containing 360 mg EPA and 240 mg DHA per day) as 2 capsules, plus vitamin D (50 000 IU every 2 weeks): n = 30 randomised (all completed) Group 3: vitamin D (50 000 IU every 2 weeks) plus placebo omega‐3 capsules: n = 30 randomised (all completed) Group 4: no supplement (2 placebo capsules, each containing 500 mg of liquid paraffin): n = 30 randomised (all completed) Timing of supplementation: from 24‐28 weeks' gestation (for 6 weeks) All women: requested not to change their routine physical activity or usual dietary intakes throughout study and not to consume any supplements other than the one provided to them by the investigators, as well as not to take any medications that might affect findings during the 6‐week intervention DHA + EPA dose/day: mid: 240 mg DHA + 360 mg EPA | |
| Outcomes | Women/birth: inflammatory biomarkers; biomarkers of oxidative stress; caesarean section; preterm birth < 37 weeks; polyhydramnios; PE; length of gestation | |
| Notes | Funding: research grant from Research Deputy of Ardabil University of Medical Sciences (AUMS) Declarations of interest: none declared | |
| Risk of bias | ||
| Bias | Authors' judgement | Support for judgement |
| Random sequence generation (selection bias) | Low risk | Assignment was conducted using computer‐generated random numbers. |
| Allocation concealment (selection bias) | Low risk | Computer based randomisation; and "a person who was not involved in the trial and not aware of random sequences, assigned the subjects to the numbered bottles of capsules" |
| Blinding of participants and personnel (performance bias) | Low risk | Quote: "Randomisation and allocation were concealed from the researchers and participants until the final analyses were completed" |
| Blinding of outcome assessment (detection bias) | Low risk | Not reported; however outcomes probably assessed by the researchers (who were blind to group assignments), and all outcomes included for analysis objective. |
| Incomplete outcome data (attrition bias) | Low risk | All 120 participants randomised included for analysis. |
| Selective reporting (reporting bias) | Unclear risk | Outcomes specified in published protocol reported; no obvious sign of selective reporting, however limited range of outcomes for babies/infants/children reported. |
| Other bias | Low risk | No clear baseline differences between the 4 groups of participants. |
| Methods | With Vitamin D (see Razavi 2017) | |
| Participants | ||
| Interventions | ||
| Outcomes | ||
| Notes | ||
| Methods | RCT | |
| Participants | 26 women randomised Inclusion criteria: current episode of major depression or dysthymia, according to DSM‐IV criteria, confirmed by both CIDI‐structured interview criteria and clinical assessment by a psychiatrist; at least 21 years of age; from the third trimester of pregnancy to 6 months postnatal; baseline score ≥ 13 on the EPDS and either > 14 on the HDRS or > 25 on MADRS. Exclusion criteria: bipolar disorder, psychosis, drug and alcohol abuse, obsessive‐compulsive disorder, eating disorder or personality disorder, an unstable medical condition, diabetes, receipt of anticoagulants or having a fish allergy; those already receiving an antidepressant or any psychological therapy, as well as those taking fish oil supplements or eating more than 3 oily fish portions per week. Those with comorbid anxiety disorders were not excluded. Setting: perinatal depression clinic and midwives' antenatal clinic at Royal Hospital for Women, Sydney, Australia | |
| Interventions | SUPPLEMENTATION: DHA + EPA versus placebo Group 1: fish oil (soft gelatin capsules, DHA 0.77 g/day, EPA 0.23 g/day); vitamin E (80 mg) was added to prevent oxidation of the oil: n = 13 randomised Group 2: placebo (sunola oil (85% monounsaturated fats, 7% saturated fats)): n = 13 randomised All women: peppermint oil was added to all capsules to disguise any fish taste and may have minimised any gastrointestinal effects. Timing of supplementation: either from 28‐33 weeks' gestation; or from 11‐19 weeks postnatal for 6 weeks intervention DHA + EPA dose/day: mid: 770 mg DHA + 230 mg EPA | |
| Outcomes | Women/birth: depression scores at 6 weeks (EPDS, HDRS, MADRS); adherence; omega‐3 plasma concentrations; adverse events | |
| Notes | Funding: NSW Institute of Psychiatry; Pfizer Neuroscience Research Grant, NHMRC Program Grant 222708, NSW Department of Health Infrastructure Grant; Numega Ingredients and Clover Corporation for supply of fish oil and placebo capsules Declarations of interest: none reported | |
| Risk of bias | ||
| Bias | Authors' judgement | Support for judgement |
| Random sequence generation (selection bias) | Low risk | Quote: “computer‐based random number generation” |
| Allocation concealment (selection bias) | Low risk | Quote: “dispensed by the hospital pharmacy” |
| Blinding of participants and personnel (performance bias) | Low risk | Quote: “dispensed by the hospital pharmacy … to ensure blinding of the investigators and raters”; in “identical plastic containers”; "peppermint used to mask fish oil taste" |
| Blinding of outcome assessment (detection bias) | Low risk | Quote: "Subjects were interviewed by the first author, who remained blind to treatment assignment and assessed weekly by her. The blind was not broken until the study had been completed" |
| Incomplete outcome data (attrition bias) | High risk | Fish oil: 1/13 (8%) discontinued (possibly hypomanic) Placebo: 4/13 (31%) discontinued (nausea (1); suicidal (1); non‐adherent (1); other treatment (1)) Results for all 26 women were analysed; with depression scores extrapolated using the last‐observation‐carried‐forward method. |
| Selective reporting (reporting bias) | High risk | The only clinical outcomes reported were depression and adverse events. |
| Other bias | High risk | Women in the placebo group were more likely to have a co‐morbid anxiety disorder (9/13 vs 3/13). |
| Methods | RCT | |
| Participants | 11 women randomised Inclusion criteria: age 20‐30 years; in 30th week of pregnancy; not using any form of medication; not showing any signs of intolerance or allergy to fish; not using any dietary supplements containing omega‐3 and omega‐6 PUFA; and not feeding the baby exclusively on their own milk Exclusion criteria: unable to attend all the scheduled study sessions; non‐authorisation by the gynaecologist responsible; embarking on a medication treatment after the study had begun; or deciding not to participate after consenting for the study Setting: Sao Francisco University Hospital, Brazil (participants were selected from May 2009 to February 2010) | |
| Interventions | SUPPLEMENTATION: omega‐3 (fish oil) versus primrose oil Group 1: fish oil capsules containing 0.72 g omega‐3 PUFA/day; total number randomised = 7 Group 2: primrose oil capsules containing 1.46 g omega‐6 PUFA/day; total number randomised = 4 Timing of supplementation: for 15 days (no further details) All women: instructed to maintain their usual diet for 7 days, and then to include the capsules during the period of the study intervention (15 days) DHA + EPA dose/day: mid? ‐ (unclear) | |
| Outcomes | Women/birth: dietary intake; fatty acid composition of the erythrocyte membranes and breastmilk | |
| Notes | No outcomes could be used in this review. Funding: not reported Declarations of interest: none declared | |
| Risk of bias | ||
| Bias | Authors' judgement | Support for judgement |
| Random sequence generation (selection bias) | Unclear risk | Method used to generate a random sequence not reported. |
| Allocation concealment (selection bias) | Unclear risk | Allocation concealment method not reported. |
| Blinding of participants and personnel (performance bias) | Unclear risk | Method used to blind participants and personnel not reported. |
| Blinding of outcome assessment (detection bias) | Unclear risk | Not reported |
| Incomplete outcome data (attrition bias) | Unclear risk | Post randomisation dropouts and exclusions not reported. |
| Selective reporting (reporting bias) | Unclear risk | Few outcomes reported, and without access to a published protocol it was not possible to assess risk of reporting bias confidently. |
| Other bias | Unclear risk | Inadequate reporting of methods made confident assessment of risk of other bias impossible. |
| Methods | RCT | |
| Participants | 127 women randomised Inclusion criteria: pregnant women < 29 weeks' gestation at high risk of PE, nulliparity, previous PE, obesity, hypertension, < 20 years old, diabetes, nephropathy, mean arterial pressure < 85 mmHg, positive roll‐over test, “black race”, family history of hypertension or PE, twin pregnancy, poor socioeconomic conditions Exclusion criteria: none reported Setting: Mérida, Venezuela | |
| Interventions | SUPPLEMENTATION + OTHER AGENTS: omega‐3 ( + aspirin, vitamins C and E) versus placebo Group 1: fish oil capsules 3 times a day (omega‐3 content not reported); aspirin 100 mg 3 times a week, vitamin C 500 mg 3 times a day, vitamin E 400 IU a day; total number randomised = 63 Group 2: placebo (not further described); total number randomised = 64 Timing of supplementation: not reported DHA + EPA dose/day: unclear | |
| Outcomes | Women/birth: PE; “no serious maternal or neonatal side effects of treatment occurred in either group” | |
| Notes | Funding: none reported Conflicts of interest: none reported | |
| Risk of bias | ||
| Bias | Authors' judgement | Support for judgement |
| Random sequence generation (selection bias) | Unclear risk | Quote: “randomly divided” |
| Allocation concealment (selection bias) | Unclear risk | Quote: “randomly divided” |
| Blinding of participants and personnel (performance bias) | Low risk | Quote: “triple‐blind”; probably done |
| Blinding of outcome assessment (detection bias) | Unclear risk | Not reported |
| Incomplete outcome data (attrition bias) | Unclear risk | Not reported |
| Selective reporting (reporting bias) | High risk | Only 1 outcome fully reported. |
| Other bias | Unclear risk | Not sufficient reporting to determine risk of other bias. |
| Methods | RCT: IRCT20131226562N16 | |
| Participants | 56 women randomised Inclusion criteria: pregnant women 18‐40 years, diagnosed with GDM (1 step 2‐hour 75 g OGTT at 24‐28 weeks GA using ADA 2014 criteria, i.e. fasting glucose ≥ 92 mg/dL,1‐hour ≥ 180 mg/dL and 2‐hour ≥ 153 mg/dL) Exclusion criteria: women requiring insulin therapy, women with PPROM, placental abruption, PE, eclampsia, chronic hypertension, hypothyroidism, urinary tract infection, smokers and those with kidney or liver diseases or those taking oestrogen therapy Characteristics: women had high omega‐6 concentrations Setting: Kashan, Iran (January‐March 2014) | |
| Interventions | SUPPLEMENTATION: EPA + DHA + other omega‐3 versus placebo Group 1: 1000 mg omega‐3 fatty acid (1 ‘pearl’ per day for 6 weeks; the pearl contained 70% LCPUFA (180 mg EPA, 120 mg DHA and 400 mg of other omega‐3 fatty acids)); total number randomised: n = 28 Group 2: placebo (1 ‘pearl’ per day for 6 weeks; the pearl contained 500 mg liquid paraffin); total number randomised: n = 28 Timing of supplementation: 6 weeks from 24‐28 weeks GA All women: asked not to alter their routine physical activity or usual dietary intakes throughout the study and not to consume any supplements other than the 1 provided to them by the investigators DHA + EPA dose/day: low: 120 mg DHA + 120 mg EPA | |
| Outcomes | Women: insulin resistance (HOMA‐IR); HOMA‐B; plasma glucose; QUICKI; lipid profile; dietary records; adherence, CRP (ng/mL) Babies/infants/children: nil | |
| Notes | Funding: Kashan University of Medical Sciences Declarations of interest: none reported | |
| Risk of bias | ||
| Bias | Authors' judgement | Support for judgement |
| Random sequence generation (selection bias) | Low risk | Computer‐generated random numbers |
| Allocation concealment (selection bias) | Low risk | Quote: "Randomization and allocation were concealed from the researchers and participants until the main analyses were completed. A trained midwife at maternity clinic did the randomized allocation sequence, enrolled participants and assigned participants to intervention" |
| Blinding of participants and personnel (performance bias) | Low risk | Quote: "The appearance of placebo ... color, shape, size, and packaging, were identical to omega‐3 fatty acid capsule" |
| Blinding of outcome assessment (detection bias) | Low risk | Not reported, but probably done. |
| Incomplete outcome data (attrition bias) | Low risk | 3/28 women in each group were lost to follow‐up (omega‐3: 1 insulin therapy and 2 hospitalised); placebo (2 insulin therapy and 1 placental abruption). However results for all 56 women were analysed. |
| Selective reporting (reporting bias) | Unclear risk | No baby or child outcomes reported. |
| Other bias | Low risk | No clear baseline differences. |
| Methods | RCT | |
| Participants | 20 women randomised Inclusion criteria: normal pregnant women without risk of systemic diseases or the existence of malnutrition Exclusion criteria: multiple pregnancies; IUGR; diabetes or hypertension Setting: Baracaldo, Spain | |
| Interventions | SUPPLEMENTATION: DHA + EPA versus placebo Group 1: DHA: 200 mg DHA/day and 40 mg EPA in a supplement containing 2 g fat; n = 10 randomised, 8 analysed Group 2: placebo: n = 10 randomised, 8 analysed Timing of supplementation: 26‐27 weeks GA to birth DHA + EPA dose/day: low: 200 mg DHA + 40 mg EPA | |
| Outcomes | Women/birth: plasma AA; plasma DHA; GA Babies/infants/children: DHA; birthweight | |
| Notes | Funding: supported in part by grants from Novartis op Declarations of interest: not reported | |
| Risk of bias | ||
| Bias | Authors' judgement | Support for judgement |
| Random sequence generation (selection bias) | Low risk | Computer‐generated random number table |
| Allocation concealment (selection bias) | Unclear risk | Not reported |
| Blinding of participants and personnel (performance bias) | Low risk | Quote: "the women were given either 200 mg/day of DHA (group A) on a blind basis (through a dietary formula for pregnant women containing 2 g of fat, of which 200 mg are DHA and 40 mg EPA) or placebo" |
| Blinding of outcome assessment (detection bias) | Unclear risk | Not reported |
| Incomplete outcome data (attrition bias) | Unclear risk | Quote: "the number of biochemical samples obtained and maternal‐fetal studies completed was 16 (eight from group A and eight from group B)" |
| Selective reporting (reporting bias) | Unclear risk | Without access to a published protocol it was not possible to assess selective reporting confidently. |
| Other bias | Unclear risk | Information on methods insufficient to assess this domain confidently. |
| Methods | RCT | |
| Participants | 350 women randomised Inclusion criteria: singleton pregnancies, women aged 16‐36 years; 24‐28 weeks' gestation at enrolment; able and willing to consume eggs; access to refrigeration Exclusion criteria: weight > 109 kg at baseline; serious illness such as cancer, lupus, hepatitis; known to have any untreated serious infectious disease; diabetes or gestational diabetes at baseline; elevated BP attributed to any cause Characteristics: most women were socially disadvantaged, and most were African‐American (73%). Setting: Department of Dietetics and Nutrition, University of Kansas Medical Center, Kansas City, Kansas, USA | |
| Interventions | OMEGA‐3‐ENRICHED FOOD: DHA‐enriched eggs versus CONTROL (ordinary eggs) Group 1: DHA‐enriched eggs: each egg had 133 mg DHA. Women were asked to eat 12 eggs per week but reported eating 5.5 per week (731.5 mg DHA): n = 176 randomised (142 could be analysed) Timing of supplementation: 24‐28 weeks GA to birth DHA + EPA dose/day: low: 100 mg DHA/day; EPA not stated | |
| Outcomes | Women/birth: gestational diabetes; PE/eclampsia; duration of gestation, preterm birth (< 37 weeks); caesarean; maternal RBC phospholipid DHA concentration at enrolment and at birth Babies/infants/children: birthweight; birth length, head circumference; low birthweight; meconium staining; admissions to neonatal care; neonatal RBC phospholipid DHA concentration at birth; serious adverse events (life‐threatening event, inpatient hospitalisation, or prolonging of an existing hospitalisation, a persistent or significant disability/incapacity, or a congenital anomaly/birth defect | |
| Notes | Initial sample size was 285. Because there were no published data for low‐level DHA supplementation on which to base a power analysis, a blinded review of the data was undertaken after the first 100 births to refine power analysis. Sample size was increased to 350 after the blinded analysis. Funding: OmegaTech Inc, Colorado, USA Declarations of interest: not reported | |
| Risk of bias | ||
| Bias | Authors' judgement | Support for judgement |
| Random sequence generation (selection bias) | Low risk | Computer‐generated randomisation schedule |
| Allocation concealment (selection bias) | Unclear risk | Not reported |
| Blinding of participants and personnel (performance bias) | Low risk | Quote: "double blinded" |
| Blinding of outcome assessment (detection bias) | Low risk | Outcome assessments were blinded |
| Incomplete outcome data (attrition bias) | Unclear risk | Overall 59/350 (16.9%) lost to follow‐up: DHA‐enriched eggs group lost 34/176 (19.3%):
Ordinary eggs group lost 25/174 (14.4%):
|
| Selective reporting (reporting bias) | Low risk | Most expected outcomes were reported. |
| Other bias | Low risk | Baseline characteristics similar in each group. |
| Methods | RCT: parallel (feasibility study) | |
| Participants | 52 women randomised (52 randomised to the 2‐egg groups: 25 to the regular‐egg group and 27 to the high‐DHA egg group. (Another 21 women consented to the study but were not randomised and were not given eggs (low‐egg intake group).) Inclusion criteria: women 24‐28 weeks pregnant by obstetric assessments (either date of last menstrual period or US), aged 16‐35 years, were accessible by telephone, and planned to give birth at the Regional Medical Center (Memphis, TN) If women said they ate eggs, they were asked for informed consent to be randomised to ordinary or high‐DHA eggs. Exclusion criteria: any chronic illness, PIH, PE, or pregnancy‐induced diabetes at the time of enrolment. Women were excluded if they had > 4 prior pregnancies. Characteristics: women were mainly African‐African and rarely consumed fish; however they commonly consumed eggs. Setting: Regional Medical Center (Memphis, TN), USA (trial recruitment dates not reported) | |
| Interventions | OMEGA‐3‐ENRICHED FOOD: high‐DHA eggs versus ordinary eggs Group 1: high‐DHA eggs (135 mg DHA/egg): total number = 27 randomised (18 could be analysed) Group 2: ordinary eggs (18 mg DHA/egg): total number = 25 randomised (19 could be analysed) Timing of supplementation: egg consumption started at ˜27 weeks' gestation and continued for ˜13 weeks During the course of the study, women were sent 2 dozen eggs (i.e. 24 eggs) every 2 weeks by courier. After the first delivery, they were interviewed before each subsequent delivery and asked how many eggs they had consumed. In addition, the unused eggs were returned by the courier, counted, the number recorded, and the eggs destroyed. Women were asked to keep a written record of their egg intake on forms supplied to them and to return these with the uneaten eggs; however, few were compliant with this request. DHA + EPA dose/day: low: up to 135 mg DHA; EPA not stated | |
| Outcomes | Women/birth: GA, GWG, caesarean section, gestational diabetes, maternal plasma and RBC lipids just prior to birth, maternal antibiotics, preterm birth, low birthweight, placental weight, PE, birthweight, length at birth; head circumference at birth, birthweight < 37 weeks Babies/infants/children: newborn plasma and RBC lipids; admission to NICU/Special Care Unit; not routine hospital care, meconium | |
| Notes | Funding: OmegaTech, Inc (Boulder, CO) supplied both ordinary and high‐DHA eggs (Gold Circle Farms). Declarations of interest: not reported | |
| Risk of bias | ||
| Bias | Authors' judgement | Support for judgement |
| Random sequence generation (selection bias) | Unclear risk | Method of sequence generation not reported ‐ “using a randomization in blocks of 6 to ensure that the groups remained relatively balanced”. |
| Allocation concealment (selection bias) | Unclear risk | Quote: “women were randomized to the two egg groups”; no further information provided |
| Blinding of participants and personnel (performance bias) | Unclear risk | Quote: "The ordinary and high‐DHA eggs had white shells but came in cartons of different colors. Carton color remained the same throughout the study" indicating that study personnel and possibly women could deduce which group they were in. |
| Blinding of outcome assessment (detection bias) | Unclear risk | Not reported |
| Incomplete outcome data (attrition bias) | High risk | 9/27 in the high DHA and 7/25 in the control group lost to follow‐up; reasons for losses not clearly reported. |
| Selective reporting (reporting bias) | Unclear risk | No protocol or trial registration entry; unable to determine |
| Other bias | Unclear risk | Women assigned to consume ordinary eggs were significantly older than those in the high DHA egg group. |
| Methods | RCT: parallel: NCT00618865 | |
| Participants | 36 women randomised Inclusion criteria: pregnant women aged 18‐40 years, with major depressive disorder (DSM‐IV) with onset between 16 weeks and 32 weeks GA; and to not have taken psychotropic agents for at least 1 month, to have a score of at least 18 on the 21‐item HAM‐D at screening; and to have good physical health as determined by medical history, physical examination, blood laboratory results, electrocardiogram, chest radiography and urinalysis. No psychotropic agents were given during the study period. Exclusion criteria: DSM‐IV diagnosis of bipolar disorder, psychotic disorder, or substance abuse/dependence or any Axis II diagnosis of borderline or antisocial personality disorder. Setting: China Medical University Hospital, Taiwan (June 2004 to June 2006). | |
| Interventions | SUPPLEMENTATION: DHA + EPA versus placebo Group 1: omega‐3 LCPUFA (3.4 g/day; 2.2 g EPA and 1.2 g DHA) (produced from Menhaden fish body oil concentrate). Total number randomised: n = 18 (13 completed) Group 2: placebo: 5 identical gelatin capsules per day (olive‐oil ethyl‐esters). Total number randomised: n = 18 (11 completed) Timing of supplementation: 8 weeks to ˜30‐32 weeks GA Before random assignment, all consenting participants took part in a placebo trial for 1 week – those showing a decrease of 20% or more in HAM‐D scores (placebo responders) were not permitted to proceed to the randomisation stage. All capsules (fish oil and placebo) were vacuum deodorised, amended by blending with orange flavour and supplemented with tertiary butylhydroquinone (0.2 mg/g) and tocopherols (2 mg/g) as antioxidants DHA + EPA dose/day: high: 1.2 g DHA + 2.2 g EPA | |
| Outcomes | Women/birth: HAM‐D (every other week); EPDS (Taiwanese version); Beck Depression Inventory and brief adverse effect checklist at week ‐1 (lead‐in period), week 0 (baseline) and weeks 2, 4, 6 and 8; blood samples taken at week 1 and week 8 for omega‐3 PUFA analysis (EPA; DHA) “No obstetric complication was noted in any participant” Babies/infants/children: “all the newborns were normal in general physical and neurobehavioral examination at birth” | |
| Notes | Funding: National Science Council, Department of Health, and China Medical University and Hospital, Taiwan Declarations of interest: none reported | |
| Risk of bias | ||
| Bias | Authors' judgement | Support for judgement |
| Random sequence generation (selection bias) | Unclear risk | Not reported |
| Allocation concealment (selection bias) | Unclear risk | Not reported |
| Blinding of participants and personnel (performance bias) | Low risk | Placebo used |
| Blinding of outcome assessment (detection bias) | Low risk | Not reported, but probably done. |
| Incomplete outcome data (attrition bias) | High risk | The intention‐to‐treat population included all women who had a baseline and at least 1 post baseline observation. The per protocol population included all women who completed 8 weeks of treatment. 12/36 (33%) lost to follow‐up: Omega‐3: 5/18 (28%) lost to follow‐up:
Placebo: 7/18 (39%) lost to follow‐up:
|
| Selective reporting (reporting bias) | High risk | Only depressive symptoms, adverse events and omega‐3 status assessed, e.g. no birth outcomes reported numerically. |
| Other bias | Unclear risk | Baseline characteristics similar between study groups. Not clear what constituted “unsatisfactory response” (3 women in each group). |
| Methods | RCT: IRCT201506085623N43 (also IRCT201507035623N47 (Asemi 2015; Jamilian 2016) | |
| Participants | 60 women randomised Inclusion criteria: women with GDM (diagnosed with ‘one‐step’ 2‐hour 75 g OGTT at 24‐28 weeks' gestation using ADA 2014 criteria, i.e. plasma glucose meeting any of the following criteria: fasting plasma glucose ≥ 92 mg/dL, 1‐hour OGTT ≥ 180 mg/dL and 2‐hour OGTT ≥ 153 mg/dL), who were not taking oral hypoglycaemics, aged 18‐40 years, without prior diabetes. Exclusion criteria: premature preterm rupture of membranes, placental abruption, PE, eclampsia, hypo‐ and hyperthyroidism, urinary‐tract infection, smokers, women with kidney or liver diseases, and women commencing insulin therapy during intervention. Setting: Kosar Clinic, Kashan, Iran (study conducted May 2015 to July 2015) | |
| Interventions | SUPPLEMENTATION: omega‐3 (ALA) + vitamin E versus placebo Group 1: omega‐3 and vitamin E co‐supplementation (1000 mg omega‐3 fatty acids from flaxseed oil; 400 mg α‐linoleic acid, plus 400 IU vitamin E): total number randomised: n = 30 Group 2: placebo: colour, shape, size, and packaging identical to combined fatty acids and vitamin E pearl; total number randomised: n = 30 Timing of supplementation: 6 weeks from trial entry (24‐28 weeks GA) All women: 400 µg/day vitamin B9 from the beginning of pregnancy and 60 mg/day ferrous sulphate from the second trimester. Although the intervention was for 6 weeks only, all women were followed up to the time of the birth (mean follow‐up ˜13 weeks) DHA + EPA dose/day: not applicable | |
| Outcomes | Women/birth: fasting plasma glucose; serum insulin concentrations; homeostasis models of assessment‐estimated insulin resistance and beta cell function; quantitative insulin sensitivity checklist; serum triglycerides; VLDL‐cholesterol; low‐density lipoprotein; HDL‐cholesterol; total antioxidant capacity, nitric oxide, plasma malondialdehyde concentrations, plasma glutathione and serum high‐sensitivity CRP concentrations; maternal BMI; GWG, DBP and SBP, need of insulin therapy after intervention, maternal hospitalisation, GA, polyhydramnios, preterm birth, PE; 3 day dietary intakes (baseline, week 1, 3, 5 and end of trial); maternal adherence; birthweight; birth length and head circumference at birth Babies/infants/children: hyperbilirubinaemia; 1‐ and 5‐minute Apgar scores, newborn hospitalisation rates; hypoglycaemia | |
| Notes | Funding: supplements and placebos were supplied by Barij Essence Pharmaceutical Company, Kashan, Iran; grant from KUMS, Kashan, Iran. Declaration of interests: none declared | |
| Risk of bias | ||
| Bias | Authors' judgement | Support for judgement |
| Random sequence generation (selection bias) | Low risk | Computer‐generated random number sequence |
| Allocation concealment (selection bias) | Low risk | Quote: “randomly allocated into two groups”; a trained midwife assigned participants and “randomization and allocation were hidden from the researchers and patients until the main analyses were completed” |
| Blinding of participants and personnel (performance bias) | Low risk | Quote: “double‐blind placebo‐controlled” |
| Blinding of outcome assessment (detection bias) | Low risk | Not specifically reported, but probably done. |
| Incomplete outcome data (attrition bias) | Unclear risk | 3/30 women in each group withdrew due to personal reasons. |
| Selective reporting (reporting bias) | Low risk | No apparent selective outcome reporting bias. |
| Other bias | Low risk | Baseline characteristics similar |
| Methods | RCT (parallel) | |
| Participants | 400 women randomised Inclusion criteria: pregnant women at 25 weeks' gestation Exclusion criteria: not reported Characteristics: 28% of mothers were under‐nourished; 82% of babies predominantly breastfed Setting: Dhaka, Bangladesh (January to March 2000): participants from low‐income households (assessed via a household survey) | |
| Interventions | SUPPLEMENTATION: DHA + EPA versus soy oil Group 1: fish oil: 4 capsules (1 g in each) as a single daily dose. Total daily fish oil supplement contained 1.2 g of DHA and 1.8 g of EPA. Total number randomised: n = 200 Group 2: soy oil: 4 capsules (1 g in each) as a single daily dose. Soy oil supplement contained 2.25 g of LA, and 0.27 g of ALA. Total number randomised: n = 200 Timing of supplementation: 25 weeks GA to birth DHA + EPA dose/day: high: 1.2 g DHA + 1.8 g EPA | |
| Outcomes | Women/birth: length of gestation; birthweight; birth length; head circumference at birth; ponderal index; preterm birth; stillbirth; neonatal death; perinatal mortality; infant death; low birthweight Babies/infants/children: duration of exclusive breastfeeding; at 10 months: Bayley Mental developmental index; Bayley psychomotor developmental index; Behaviour (Wolke) (Approach; Activity; Co‐operation; Emotional tone; Vocalisation) using 0‐9 scales where higher scores are better; head circumference; weight‐for‐height z‐score; weight‐for‐age z‐score; height‐for‐age z‐score; HOME (modified for Bangladesh) | |
| Notes | Tofail 2012 was a follow‐up study but results were not reported by supplementation/no supplementation. Funding: World Bank Declarations of interest: not reported | |
| Risk of bias | ||
| Bias | Authors' judgement | Support for judgement |
| Random sequence generation (selection bias) | Unclear risk | Not described |
| Allocation concealment (selection bias) | Unclear risk | Not described |
| Blinding of participants and personnel (performance bias) | Low risk | Capsules were identical in appearance |
| Blinding of outcome assessment (detection bias) | Low risk | Quote: "Two female psychologists, unaware of the infant’s group assignment, tested all infants” |
| Incomplete outcome data (attrition bias) | High risk | 76/400 women were lost before birth due to out‐migration or refusal to take capsules (fish oil: 41/200, soy oil: 35/200). Of the mothers included at birth (159 fish oil; 165 soy oil), further losses occurred after birth (stillbirth: 8 and 6; early neonatal death: 4 and 5; outmigration: 19 and 26; infant death: 3 and 4); Therefore 249 infants (62%) were included in the 10‐month follow‐up (125/200 in the fish oil, and 124/200 in the soy oil group). |
| Selective reporting (reporting bias) | Low risk | No apparent risk of selective reporting. |
| Other bias | Unclear risk | Baseline characteristics: mothers in the fish oil group were younger and had fewer children. |
| Methods | RCT | |
| Participants | 40 women randomised Inclusion criteria: women aged 22–35 years; GA of at least 22‐25 weeks according to the date of the last menstrual period and confirmed by US; 1–4 children Exclusion criteria: women with a history of drug or alcohol consumption; a diet including polyunsaturated fatty acids (PUFA, ALA supplements) or LCPUFA (EPA and or DHA supplements); underweight as defined by the Chilean chart for pregnant women; history of twins or of suffering from chronic diseases such as diabetes, arterial hypertension, obesity, or other illness that could affect fetal growth Characteristics: recruited women were mostly of low‐ and middle‐socioeconomic status (according to the ESOMAR); all were of Hispanic origin. Setting: Obstetrical and Gynecology Health Service of the University of Chile Hospital, Chile (study conducted January 2012‐December 2013) | |
| Interventions | SUPPLEMENTATION: ALA versus soy oil Group 1: chia oil (provided in 240 mL bottles, 4500 mL in total). Women were requested to consume 16 mL/day (10.1 g ALA/day). Total number randomised: n = 19 Group 2: sunflower/soy oil (provided in 240 mL bottles, 4500 mL in total). Women were requested to consume 16 mL/day. Total number randomised: n = 21 Timing of supplementation: from the 6th month of pregnancy until the 6th month of nursing (total of 9 months) All women: received a complete nutritional interview including nutritional diagnosis and counselling according to the dietary guidelines for pregnant women, were given plastic teaspoons (4 mL) for measuring consumption of intervention/control oil; received a dietary record to register the daily consumption of oil; visited weekly to assess oil consumption DHA + EPA dose/day: not applicable | |
| Outcomes | Women/birth: maternal diet (energy and composition of diet ingested by mothers during pregnancy and nursing); fatty acid composition of erythrocyte phospholipids of mothers during pregnancy and nursing; fatty acid profile of breast milk; length of gestation Babies/infants/children: birthweight; head circumference at birth | |
| Notes | Funding: not reported Declarations of interest: none declared | |
| Risk of bias | ||
| Bias | Authors' judgement | Support for judgement |
| Random sequence generation (selection bias) | Unclear risk | Quote: “the pregnant women were randomly assigned to either the control group (n=21) or to the experimental group that received the dietary supplementation with chia oil” |
| Allocation concealment (selection bias) | Unclear risk | Quote: “the pregnant women were randomly assigned to either the control group (n=21) or to the experimental group that received the dietary supplementation with chia oil” |
| Blinding of participants and personnel (performance bias) | Unclear risk | Not reported |
| Blinding of outcome assessment (detection bias) | Unclear risk | Not reported |
| Incomplete outcome data (attrition bias) | Low risk | No missing outcome data: all women randomised (to intervention and control), and their infants, were included for analyses. |
| Selective reporting (reporting bias) | Unclear risk | Few outcomes reported; additionally, without access to a published protocol it is not possible to assess selective outcome reporting confidently. |
| Other bias | Low risk | Data reported on the characteristics of women (age; weight; BMI; socioeconomic status) suggests groups were similar at baseline. |
| Methods | RCT: ISRCTN58176213 | |
| Participants | 183 women randomised (3 groups ‐ see below) Inclusion criteria: apparently healthy women with a low‐risk first or second pregnancy Exclusion criteria: preterm births (< 37 weeks) or GA > 42 weeks and any maternal or neonatal complications; vegetarians or vegans Characteristics: low background DHA intake (fish intake once a week) Setting: Groningen, the Netherlands: assumed to be during antenatal care (recruited by midwives and obstetricians) | |
| Interventions | SUPPLEMENTATION: DHA + AA versus DHA versus placebo Group 1: DHA + AA (220 mg each/day): total number randomised: 58 (41) Group 2: DHA (220 mg/day) + 1 soy capsule/day: 63 (41) Group 3: placebo (2 soy capsules/day); equivalent to 535 mg LA/day: total number randomised: n = 62 (36) Timing of supplementation: mean 16.5 weeks GA (range 14‐20 weeks) till 12 weeks postpartum (formula not supplied if child not breast fed) DHA + EPA dose/day: low: 220 mg DHA | |
| Outcomes | Women/birth: preterm birth; GA; GDM; fatty acids in plasma (at 16 and 36 weeks GA); EPDS at 16 and 36 weeks GA and 6 weeks pp; blues questionnaire within 1 week pp; DHA and AA in breastmilk (2 and 12 weeks pp); sleep quality (36 weeks GA and 4 weeks pp); Obstetric Optimality Score (74 items covering socioeconomic status, non‐obstetric conditions during pregnancy, obstetric history, diagnostic and therapeutic measures, parturition and neonatal condition immediately after birth; food frequency questionnaires (16 and 36 weeks GA, 12 weeks pp); fatty acids (in umbilical cord); birthweight; duration of breastfeeding Babies/infants/children: general movement quality; NOS; Hempel neurological examination; BSID II (Dutch version); weight at 18 months; height at 18 months; head circumference at 18 months; cerebral palsy (EPDS and Hempel reported as median and ranges only) | |
| Notes | Funding: Friesland Foods, the Netherlands Declarations of interest: none declared | |
| Risk of bias | ||
| Bias | Authors' judgement | Support for judgement |
| Random sequence generation (selection bias) | Unclear risk | Block randomisation; not further reported |
| Allocation concealment (selection bias) | Unclear risk | Quote: “randomized into three groups” |
| Blinding of participants and personnel (performance bias) | Low risk | Double‐blind placebo‐controlled |
| Blinding of outcome assessment (detection bias) | Unclear risk | Not reported |
| Incomplete outcome data (attrition bias) | High risk | 58/183 (32%) “lost interest” (23 placebo; 20 DHA; 15 DHA/AA); 6 pregnancy complications (3 placebo, 1 DHA, 2 DHA/AA), leaving 119 for analysis |
| Selective reporting (reporting bias) | Low risk | Most expected outcomes were reported (although numbers per group were not reported for EPDS > 12 and blues score > 12) |
| Other bias | Low risk | Baseline characteristics similar |
| Methods | RCT (pilot study) | |
| Participants | 14 women randomised (2 groups, see below) Inclusion criteria: women with diet‐controlled GDM, between 24‐30 weeks' gestation Exclusion criteria: not reported in conference abstract Setting: not reported in conference abstract | |
| Interventions | SUPPLEMENTATION: DHA + EPA versus placebo Group 1: commercial fish oil (2200 mg/day; 1300 mg EPA and 900 mg DHA). Total number randomised: n = 7 (4 completed) Group 2: placebo, identical (no further details in conference abstract). Total number randomised: n = 7 (5 completed) Timing of supplementation: 6 weeks (start 24‐30 weeks' gestation) DHA + EPA dose/day: high: 900 mg DHA + 1300 mg EPA | |
| Outcomes | Women/birth: maternal adverse effects (narrative report only) | |
| Notes | No outcomes included that could be used in meta‐analysis Funding: not reported. Declaration of interests: none declared | |
| Risk of bias | ||
| Bias | Authors' judgement | Support for judgement |
| Random sequence generation (selection bias) | Unclear risk | Not reported |
| Allocation concealment (selection bias) | Unclear risk | Not reported |
| Blinding of participants and personnel (performance bias) | Low risk | Quote: "randomised in a prospective, double‐blind fashion to receive either 2200 mg daily of commercial fish oil ... or an identical placebo." |
| Blinding of outcome assessment (detection bias) | Unclear risk | Not reported |
| Incomplete outcome data (attrition bias) | High risk | 14 GDM patients randomised to treatment with fish oil (n = 7) or placebo (n = 7); 36% (3 in the treatment group, 2 in the placebo group) did not complete the treatment course due to intolerance. |
| Selective reporting (reporting bias) | Unclear risk | Confident assessment was not possible with conference abstract report only. |
| Other bias | Unclear risk | Information on methods insufficient to assess this domain confidently. |
| Methods | RCT: NCT01660165 | |
| Participants | 60 women randomised Inclusion criteria: women 5‐13 weeks' gestation; aged 20‐40 years at the time of enrolment; free from any known chronic diseases; residing in the study catchment area; intending to continue prenatal care in the public health centre; classified as at risk for postpartum depression (reported a past history of depression or presented a depressive symptom score at baseline ≥ 9 based on the EPDS). Exclusion criteria: depressed or presented with psychotic symptoms; past history of mania; or at suicidal risk; or taking any psychiatric medication (as anti‐depressives and anxiolytics); or being seen by a psychologist or psychiatrist. Women taking any oil supplementation (such as fish oil, flaxseed oil or cod liver oil), were also excluded. Setting: Rio de Janeiro, Brazil (enrolled November 2009‐October 2011 and the last follow‐up visit occurred in July 2012). | |
| Interventions | SUPPLEMENTATION: omega‐3 versus placebo Group 1: omega‐3: 6 capsules/day, 1 g each, for a total dose of 1.8 EPA and 0.72 g DHA (The capsules were deodorised, and contained 0.2 mg/g of vitamin E as antioxidant. Women were advised to take 3 capsules at lunch and 3 capsules at dinner): n = 32 Group 2: placebo: n = 28 Timimg of supplementation: second trimester to 16 weeks postpartum All women: 400 µg/day of folic acid from the beginning of pregnancy, and 60 mg/day ferrous sulphate from the 2nd trimester until birth, as provided during standard prenatal care in Brazil. Participants were asked to not alter their usual dietary habits and not consume any supplements other than the ones provided by the research team and antenatal care service. DHA + EPA dose/day: high: 720 mg DHA + 1.8 g EPA | |
| Outcomes | Women/birth: length of gestation; depression (at 30‐32 weeks' gestation and 4‐6 weeks postpartum); adverse effects (gastrointestinal and non‐gastrointestinal); EPA, DHA and omega‐6/omega‐3 concentrations Babies/infants/children: birthweight The EPDS was used to measure depression, and scored at 5‐13 weeks' gestation, 22‐24 weeks' gestation (baseline for RCT), 30‐32 weeks' gestation, and 4‐6 weeks postpartum. The Portuguese version of the scale was validated in a sample of mothers from Pelotas, southern Brazil. EPDS score of ≥ 11 was the cut off for depressive symptoms. | |
| Notes | The fish oil supplement was manufactured by Galena Nutrition Quίmica Industrial, São Paulo, Brazil. Funding: “The present study was supported by Carlos Chagas Filho Foundation for Research Support of Rio de Janeiro State (Grant No. E‐26/112.181/2012). The funding institution did not have any role in study design, data collection, analysis, and interpretation of results, writing the manuscript or in the decision to submit the manuscript for publication”. Declarations of interest: “The authors declare they have no competing interests”. | |
| Risk of bias | ||
| Bias | Authors' judgement | Support for judgement |
| Random sequence generation (selection bias) | Unclear risk | Quote: "The randomization was performed by a researcher not involved in the data collection using the participant identification (subject ID) after stratification for EPDS score and previous history of depression”. |
| Allocation concealment (selection bias) | Unclear risk | Quote: "The randomization was performed by a researcher not involved in the data collection using the participant identification (subject ID) after stratification for EPDS score and previous history of depression”. |
| Blinding of participants and personnel (performance bias) | Low risk | Quote: “Participants and all research assistants and technicians responsible for running both the cohort study and the RCT were blinded to the study allocation” |
| Blinding of outcome assessment (detection bias) | Unclear risk | No information provided by the authors on whether assessors were blinded, for any of the outcomes reported. |
| Incomplete outcome data (attrition bias) | High risk | Of the 32 women randomised to the intervention, 6 did not receive intervention (2 transferred antenatal care to another health centre; 3 exceeded 13 weeks of gestation at the baseline), and 7 dropped out before the end of pregnancy time‐point, leaving 17/32 women (53%) contributing data to the analysis for end of pregnancy/birth outcomes. A further 2 women were lost to follow‐up before the 4‐6‐week postpartum data collection time point (did not visit); therefore only 15/32 women (47%) of the women randomised to the intervention were included in the analysis for the postpartum outcomes. Of the 28 women randomised to the control, 4 did not receive intervention (1 transferred prenatal care to another health centre; 1 miscarriage; 2 missed 2nd trimester visit), and 5 dropped out before the end of pregnancy time‐point, leaving 17/28 women (60%) contributing data to the analysis for end of pregnancy/birth outcomes. |
| Selective reporting (reporting bias) | Unclear risk | Reporting of birthweight and GA incomplete (the total number of participants in the groups is not reported). |
| Other bias | Unclear risk | Baseline characteristics similar between except for ethnicity. |
Abbreviations:
2D: 2‐dimensional
AA: arachidonic acid; ALA: alpha‐linolenic acid; AIDS: acquired immune deficiency syndrome; ADA: American Diabetes Association;ASQ: Ages and Stages Questionnaire
BASC‐PRS: Behaviour Assessment for Children: Parent Rating Scale;BDI: Beck Depression Inventory;BMI: body‐mass index; BP: blood pressure; BPD: bronchopulmonary dysplasia; BSID: Bayley Scales of Infant Development
CES‐D: Center for Epidemiologic Studies Depression Scale; CRP: C‐reactive protein
DBP: diastolic blood pressure; DHA: docosahexaenoic acid; DNA: deoxyribonucleic acid; DPA: docosapentaenoic acid;DSM: Diagnostic and Statistical Manual;
EPA: eicosapentaenoic acid; EPDS: Edinburgh Postnatal Depression Scale; ERG: electroretinography;ERP: electroencephalography/event‐related potentials; ESOMAR: European Society for Opinion and Marketing Research; ETA: eicosatetranoic acid; EU: European Union
FADS: fatty acids desaturase; FDA: Food and Drug Administration; FFQ: food frequency questionnaire; FiO2: fraction of inspired oxygen; FPG: fasting plasma glucose
GA: gestational age; GDM: gestational diabetes mellitus; GLA: gamma linolenic acid; GWG: gestational weight gain
HAM‐D: Hamilton Rating Scale Depression; Hb: haemoglobin; HbA1c: glycated haemoglobin; HC:AC: head circumference/abdominal circumference; HDL‐cholesterol: high density lipoprotein‐cholesterol; HDRS: Hamilton Rating Scale for Depression; HLA: human leukocyte antigen; HIV: human immunodeficiency virus; HOMA‐B: Homeostatic Model Assessment of Beta cell function; HOMA‐IR: Homeostatic Model Assessment of Insulin Resistance;HOME: home observation measurement of the environment
IgE: immunoglobulin E; IGF: Insulin‐like growth factor; IL: interleukin;IQ: intelligence quotient; IQR: interquartile range;IU: international units; IUGR: intrauterine growth restriction; IVH: intraventricular haemorrhage
K‐ABC: Kaufman Assessment Battery for Children; K‐CPT: Conners Kiddie Continuous Performance Test
LA: linoleic acid; LC: long‐chain; LCPUFA: long‐chain polyunsaturated fatty acid; LGA: large‐for‐gestational age
MADRS: Montgomery–Åsberg Depression Rating Scale; MD: Maryland;MDI: mental development index (BSID);MRI: magnetic resonance imaging; mRNA: messenger ribonucleic acid; MTHF: methyltetrahydrofolic acid
n‐3: omega‐3; n‐6: omega‐6; n‐9: omega‐9; NBAS: Neonatal Behavioral Assessment Scale; NCT: ClinicalTrials.gov registry; NEC: necrotising enterocolitis; NICU: neonatal intensive care unit; NIDDK: National Institute of Diabetes and Digestive and Kidney Diseases; NIH: National Institutes of Health; NIMH: National Institute of Mental Health;NOS: neurological optimality score;NSAIDS: nonsteroidal anti‐inflammatory drugs
OGTT: oral glucose tolerance test
PDI: psychomotor development index (BSID); PDI: postnatal depression inventory; PDSS: Postpartum Depression Screening Scale;PE: pre‐eclampsia; PG: prostaglandin; PI: pulsatility index; PIH: pregnancy‐induced hypertension; PONCH: Pregnancy Obesity Nutrition and Child Health Study; PPH: postpartum haemorrhage; PPROM: preterm prelabour rupture of membranes
QUICKI: quantitative insulin sensitivity check index
RBC: red blood cell; RCT: randomised controlled trial; RDS: respiratory distress syndrome;RI: resistance index; ROP: retinopathy of prematurity
S/D: systolic/diastolic; SBP: systolic blood pressure;SD: standard deviation; SGA: small‐for‐gestational age; SiPS: Salmon in Pregnancy Study;sLORETA: standardised low‐resolution brain electromagnetic tomography
T1D: type 1 diabetes; TLR: toll‐like receptor; TOVA: Test of Variables of Attention
US: ultrasound; U.S. FDA: United States Food and Drug Administration
VLDL‐cholesterol: very low density lipoprotein‐cholesterol
WIC: Women, Infants and Children
Characteristics of excluded studies [ordered by study ID]
| Study | Reason for exclusion |
| Trial registered but no participants were recruited | |
| Intervention (evening primrose oil) is not an omega‐3 fatty acid | |
| Not randomised | |
| Intervention (linoleic acid) is an omega‐6 fatty acid | |
| Intervention (linoleic acid) is an omega‐6 fatty acid | |
| Intervention (linoleic acid) is an omega‐6 fatty acid | |
| Women supplemented with omega‐3 fatty acids only during lactation | |
| Non‐randomised pilot study | |
| Intervention (linoleic acid) is an omega‐6 fatty acid | |
| Trial does not appear to be randomised. | |
| Non‐randomised pilot study | |
| Not randomised: "divided into two groups" | |
| Lactating women only (human milk donor pilot study) | |
| Not randomised | |
| Methodological study across several trials |
Characteristics of studies awaiting assessment [ordered by study ID]
| Methods | RCT |
| Participants | 120 women randomised |
| Interventions | 1) salmon fish oil capsule (1000 mg/day) from 16 weeks GA to birth 2) standard prenatal care |
| Outcomes | Systolic and diastolic blood pressure |
| Notes | In Arabic |
| Methods | Comparison of 3 groups ‐ not clear if this was a randomised study |
| Participants | 900 pregnant women; low socioeconomic status, attending government antenatal centres in India |
| Interventions | 1) 900 mg alpha linolenic acid daily from 22 weeks GA + iron/folate supplementation from 20 weeks' gestation 2) iron/folate (100 mg/500 μg) daily from 20 weeks GA 3) control |
| Outcomes | Birthweight; low birthweight; preterm birth < 37 weeks |
| Notes | Abstract only ‐ no details of how groups were allocated |
| Methods | RCT: IRCT201610015623N90 |
| Participants | 40 women aged 18‐40 diagnosed with GDM, based on the American Diabetes Association guidelines, without prior history of diabetes |
| Interventions | 1) 1000 mg fish oil capsules, containing 180 mg EPA and 120 mg (DHA) (n = 20) ‐ twice a day for 6 weeks from ˜25 weeks gestation |
| Outcomes | PPAR‐ʏ gene expression, low‐density lipoprotein receptor (LDLR), interleukin‐1 (IL‐1), interleukin‐8 (IL‐8), |
| Notes | need to clarify if this is a separate study or an additional report |
| Methods | Abstract |
| Participants | |
| Interventions | |
| Outcomes | |
| Notes | Abstract only; no further information available |
| Methods | RCT (4 arms): NCT01922791 |
| Participants | Recruitment target: 440 women. Inclusion criteria: less than 17 gestational weeks; overweight; healthy. Exclusion criteria: diabetes (Type 1 or 2); coeliac disease; increased bleeding tendency. Setting: Turku University Hospital, Finland. |
| Interventions | Intervention groups 1) probiotic dietary supplements; 2) women will receive fish oil; and 3) probiotics and fish oil (from early pregnancy until 6 months after birth, no further information provided). Control group 4) placebo (from early pregnancy until 6 months after birth). |
| Outcomes | Primary outcomes: GDM (at 24‐28 weeks' gestation; fasting glucose levels (assessed at third trimester of pregnancy); prevalence of allergy in child (at 12 and 24 months of age). Other outcomes: need for medication for management of GDM (insulin or metformin); body composition of mother (during and after pregnancy); immunologic and metabolic markers (during and after pregnancy); and faecal microbiota (during and after intervention); body composition, growth, development and metabolic markers of child 9 (0‐12 months). |
| Notes | awaiting to see if there are further reports of other outcomes |
| Methods | RCT |
| Participants | 60 women with unexplained recurrent miscarriage |
| Interventions | 1) aspirin (20 women) 2) omega‐3 LCPUFA (20 women) 3) aspirin and omega‐3 LCPUFA (20 women) |
| Outcomes | Doppler uterine artery pulsatility index |
| Notes | awaiting to see if there are further reports of other outcomes |
| Methods | RCT |
| Participants | 35 healthy singleton nulliparous pregnant women (20‐22 weeks' gestation) |
| Interventions | Not reported |
| Outcomes | Not reported |
| Notes | Insufficient detail in abstract |
| Methods | RCT |
| Participants | 60 pregnant women at high risk of developing placental insufficiency |
| Interventions | 1) Picasol (omega‐3 fatty acid preparation) 2) placebo |
| Outcomes | Triglyceride and cholesterol concentrations |
| Notes | In Russian |
| Methods | "comparative trial"; "randomly allocated" |
| Participants | 20 women at high risk of gestational hypertension |
| Interventions | Omega‐3 fatty acids versus aspirin |
| Outcomes | Hypertension and other pregnancy outcomes |
| Notes | Results not reported numerically |
| Methods | "randomly allocated" |
| Participants | 48 women at high risk of gestational hypertension |
| Interventions | 1) aspirin (12 women) 2) fish oil (11 women) 3) no treatment (25 women) |
| Outcomes | Gestational hypertension |
| Notes | Not clear that this study is a RCT |
| Methods | RCT |
| Participants | 190 women with a previous preterm birth < 34 weeks GA |
| Interventions | Omega‐3 (2.7 g/day) versus olive oil |
| Outcomes | Preterm birth; GA |
| Notes | Abstract; states only that no differences were found and no numeric results were reported |
| Methods | "divided into 2 unequal groups" |
| Participants | 65 primigravid women at risk of hypertension |
| Interventions | 1) calcium, linoleic acid, mono and polyunsaturated fatty acids (40 women) 2) no treatment (25 women) |
| Outcomes | Gestational hypertension |
| Notes | not clear if this is a RCT |
| Methods | RCT (4‐arm trial) |
| Participants | 43 healthy women in first trimester of pregnancy, intending to breastfeed |
| Interventions | 4 different doses of DHA/EPA |
| Outcomes | Maternal RBC and milk DHA/EPA concentrations at 4 weeks postpartum |
| Notes | no maternal or birth outcomes yet reported |
| Methods | RCT |
| Participants | pregnant women |
| Interventions | 1) fish oil supplementation 2) control |
| Outcomes | maternal glucose concentrations, haemoglobin, haematocrit |
| Notes | not enough detail yet available |
| Methods | RCT |
| Participants | 100 women with a singleton pregnancy, aged between 18‐40, any acute or chronic diseases, antenatal care before 16 weeks' gestation, non‐smoking |
| Interventions | 1) omega 3 (1000 mg) from 16 weeks to 40 weeks' gestation 2) no treatment |
| Outcomes | Lipid peroxide, thiol group, and ferric reducing antioxidant plasma |
| Notes | Completed but no English translation is available |
| Methods | RCT |
| Participants | 90 pregnant women (19‐20 weeks GA); > 18 years; diagnosed with hypertension; without bleeding disorders, lupus, autoimmune diseases, or presence of infant congenital (trisomy 13, 18, 21, urethral, gastrointestinal and cardiac defects) |
| Interventions | 1) 200 mg DHA daily, from 18‐20 weeks GA to 6 weeks postpartum 2) 1000 mg DHA daily, from 18‐20 weeks GA to 6 weeks postpartum |
| Outcomes | Primary: endothelial health (measures not reported); secondary: maternal homoeostasis (blood and cord blood concentrations of pro‐inflammatory cytokines IL‐6, I L‐8, TNF a, and receptor sRAGE |
| Notes | May have been withdrawn/never commenced |
| Methods | abstract |
| Participants | |
| Interventions | |
| Outcomes | |
| Notes | not enough detail provided in the abstract |
GA: gestational age
RCT: randomised controlled trial
Characteristics of ongoing studies [ordered by study ID]
| Trial name or title | Fish oil in pregnancy for a healthy start to life for the children of overweight mothers |
| Methods | RCT: ACTRN12617001078347p |
| Participants | Recruitment target: 160 women. Inclusion criteria: age > 18 < 40 years; pregnant; BMI 30‐45; singleton pregnancy; between 12‐16 weeks of gestation. Exclusion criteria: current use of tobacco or nicotine; illicit drugs or medications that influence blood pressure; lipid metabolism or insulin sensitivity. Women were also excluded if they had diabetes mellitus or chronic illnesses such as autoimmune disease or malignancy. Setting: Auckland, New Zealand. |
| Interventions | Intervention group 3 g of omega‐3 PUFA rich fish oil taken in capsules on each day of pregnancy and for 3 months during the breastfeeding period. Note that if the mother chooses to stop breastfeeding then supplementation will stop early, this will be at birth if the mother decides not to breast feed at all. Compliance will be assessed by return of unused capsules, and secondarily by measurement of omega‐3 PUFA levels in maternal red blood cells. Note that the expected concentration of omega‐3 PUFAs in this oil is 33% EPA/22% DHA, but this will be independently verified. Control group 3 g of olive oil taken in capsules on each day of pregnancy and for 3 months during the breastfeeding period (if the mother chooses to breast feed) |
| Outcomes | Primary outcome: whole body percentage body fat, as measured by DXA scan (in the offspring). Other outcomes: peripheral quantitative computed tomography derived measures of bone strength from the lower Tibia (in the offspring, at 2 weeks of age); birthweight; whole body percentage body fat, measured by DXA scan (in the offspring, at 3 months of age); HOMA‐IR (in the offspring, at 3 months of age); weight in the offspring (at 12 months of age); HOMA‐IR (in the mother, at 30 weeks' gestation); Ponderal Index (in the offspring, at 12 months of age); Insulin sensitivity as determined by a modified IVGTT with minimal modelling (offspring, 4‐7 years of age). |
| Starting date | 2 October 2017 |
| Contact information | Dr Benjamin Albert, Liggins Institute, University of Auckland. E‐mail: [email protected] |
| Notes | Funding and collaborators: A Better Start National Science Challenge, Funded by the Ministry of Business, Innovation and Employment (government body, New Zealand); Cure Kids (charity, New Zealand); Health Research Council (charity, New Zealand); Liggins Institute, University of Auckland. |
| Trial name or title | ADORE |
| Methods | RCT (multi‐centre, adaptive design, 3 arms): NCT02626299 |
| Participants | Recruitment target: 1200 women. Inclusion criteria: women ≥ 18 years; 12–20 weeks of gestation; agree to consume study capsules and a typical prenatal supplement of 200 mg CHA; and available by telephone. Exclusion criteria: expecting multiple infants; gestational age at baseline < 12 weeks or > 20 weeks; unable or unwilling to agree to consume capsules until birth; unwilling to discontinue use of another prenatal supplement with DHA; and with allergy to any component of DHA product (including algae), soybean oil or corn oil. Setting: Kansas, USA. |
| Interventions | Intervention group DHA supplements (800 mg/day), administered in 2 400 mg capsules, plus 1 200 mg/capsule per day of DHA that is a common amount in prenatal vitamins. Control group Standard care (200 mg/day of DHA) administered in 2 capsules (masked) containing half soybean oil and half corn oil equalling 800 mg. the soybean and corn oil combination does not contain DHA. |
| Outcomes | Primary outcome: early preterm birth < 34 weeks (baseline to 34 weeks). Other outcomes: change in plasmal soluble(s) RAGE concentration (baseline to 34 weeks); and adverse events (34 weeks). |
| Starting date | 8 June 2016 |
| Contact information | Dr Susan Carlson, University of Kansas Medical Center, USA, E‐mail: [email protected] |
| Notes | Funding and collaborators: NICHD R01 HD083292, University of Kansas Medical Center, University of Cincinnati, Ohia State University, Nationwide Children's Hospital. |
| Trial name or title | Docosahexaenoic acid (DHA) supplementation during pregnancy to prevent deep placentation disorders: a randomized clinical trial and a study of the molecular pathways of abnormal placentation prevention |
| Methods | RCT |
| Participants | 2400 women 18 years or older; GA < 16 weeks Setting: Chile |
| Interventions | DHA (600 mg/day) from early pregnancy until the ed of pregnancy versus placebo |
| Outcomes | Composite of preterm birth < 34 weeks or pre‐eclampsia before 34 weeks or severe fetal growth restriction < 34 weeks GA |
| Starting date | May 2015 |
| Contact information | Jorge Carvajal, email: [email protected] |
| Notes |
| Trial name or title | Gestational obesity and interventions with probiotics or fish oil trial: GOPROFIT |
| Methods | RCT (4 arms) |
| Participants | 80 women at 13 weeks GA, aged between 19 to 40, pre‐pregnancy BMI > 29.9 Setting: Brazil |
| Interventions | 1) DHA (100 mg) + EPA (137 mg) a day 2) probiotic 1 3) probiotic 2 4) placebo |
| Outcomes | Inflammation |
| Starting date | March 2015 |
| Contact information | Fátima Lúcia C Sardinha, email: [email protected] |
| Notes |
| Trial name or title | Omega‐3 supplementation during pregnancy to prevent postpartum depressive symptoms and possible effect on breastfeeding, child growth and development |
| Methods | RCT |
| Participants | 80 women with postpartum depression score greater than or equal to 10 and need for medical treatment and/or medical follow‐up |
| Interventions | 1) fish oil (1000mg DHA and 400mg EPA per day) 2) placebo capsules (olive oil) Both groups will be instructed to ingest 2 x 1000mg capsules per day for 16 weeks. |
| Outcomes | Prevention of postpartum depressive symptoms (Edinburgh Postnatal Depression Scale) |
| Starting date | August 2018 |
| Contact information | Luana Caroline dos Santos, email: [email protected] |
| Notes | Universidade Federal de Minas Gerais |
| Trial name or title | The impact of EPA and DHA supplementation on the content of lipids in the pregnant women and the fetus |
| Methods | RCT |
| Participants | Recruitment target: 87 women. Inclusion criteria: healthy; with a singleton pregnancy; BMI < 25 kg/m2; willing to provide informed consent. Exclusion criteria: pregnancy terminated as preterm birth; with chronic illness; gestational diabetes mellitus or pre‐eclampsia. Setting: Bosnia, Herzegovina. |
| Interventions | Intervention group 360 mg EPA (eicosapentanoic fatty acid) and 240 mg DHA (docosahexanoic fatty acid) per day during pregnancy, from baseline (14th week of gestation) until birth. Control group No supplementation of omega‐3 fatty acids during pregnancy. |
| Outcomes | Primary outcomes: concentration of omega‐3 fatty acids in total serum lipids, measured using gas chromatography at the end of pregnancy; concentration of omega‐3 fatty acids in umbilical vein serum, measured using gas chromatography at time of birth; concentration of monounsaturated fatty acids in serum total lipids of umbilical vein serum, measured by gas chromatography at time of birth; concentration of monounsaturated fatty acids in serum total lipids of the mother's serum, measured by gas chromatography at the end of pregnancy; weight of mother, measured by weighing scale at recruitment, 20th week of gestation, 30th week of gestation and before birth. |
| Starting date | May 2013 |
| Contact information | Dr Soldo Dragon, Department of Obstetrics and Gynecology School of Medicine Mostar, Kralja Tvrtka, b.b. Mostar 88000, Bosnia, Herzegovina. E‐mail:[email protected] |
| Notes | Funding and collaborators: investigator initiated and funded. |
| Trial name or title | FOPCHIN |
| Methods | RCT (3 arms): NCT02770456 |
| Participants | Recruitment target: 5531 women Inclusion criteria: women 20 to 44 years and pregnant without known complications. Exclusion criteria: regular user of fish oil; regular user of NSAIDs; known twin pregnancy. Setting: China* |
| Interventions | Intervention group 1) High‐dose intervention group: 4 0.72‐g gelatine capsules daily with fish oil providing 2.0 g/d Ic‐n3FA, from 16‐24 weeks' gestation until they have completed the preterm period (i.e. at 37 full gestation weeks) or until they deliver. 2) Low‐dose intervention group will receive 4 0.72‐g gelatine capsules daily with a mixture of fish oil and olive oil providing 0.5 g/d Ic‐n3FA, from 16‐24 weeks' gestation until they have completed the preterm period (i.e. at 37 full gestation weeks) or until they deliver. Control group Placebo (4 x 0.72‐g gelatine capsules daily with olive oil providing 0 g/d Ic‐n3FA), from 16‐24 weeks' gestation until they have completed the preterm period (i.e. at 37 full gestation weeks) or until they deliver. |
| Outcomes | Primary outcome: preterm birth. No other outcomes specified. |
| Starting date | March 2008 |
| Contact information | Dr Sjurdur F Olsen, Statens Serum Institut. E‐mail: [email protected] |
| Notes | Funding and collaborators: Centre for Fetal Programming, Denmark; Shanghai Institute of Planned Parenthood Research. * assumed, not specifically stated |
| Trial name or title | Omega‐3 fish oil for the prevention of gestational diabetes |
| Methods | RCT: ACTRN12617000177358 |
| Participants | Recruitment target: 74 women Inclusion criteria: < 14 weeks pregnant; aged 18‐40; with any 1 of the following: Exclusion criteria: BMI greater than 45 kg/m2; any incidence of ongoing bleeding beyond 8 weeks' gestation in the current pregnancy; on anti‐coagulant therapy or known to have clotting disorders; known to be pregnant with multiples; lactating; established diabetes prior to pregnancy or currently taking anti‐diabetic medications; being diagnosed with gestational diabetes in this pregnancy prior to enrolment in the study; known allergies to seafood or corn; currently on medication with aspirin and warfarin; has significant current gastrointestinal disease; incapable of giving informed consent; history of new investigational drug 3 months prior to this trial; currently consuming more than 200 g oily fish per week or taking supplements delivering 150 mg or more of DHA/day; unable to fast for 10 hr before obtaining blood sample Setting: John Hunter Hospital, Newcastle, Australia |
| Interventions | Intervention group 2 x 1 g fish oil capsules each day (each capsule containing 60mg eicosapentaenoic acid and 430 mg DHA) from ˜ 14 weeks' gestation until 34 weeks' gestation Control group Placebo: 1 x 1 g corn oil capsules/day from ˜ 14 weeks' gestation until 34 weeks' gestation |
| Outcomes | Primary outcome: insulin resistance, as measured by HOMA‐IR fasting glucose X fasting insulin/22.5 (at 14, 20, 28 & 34 weeks' gestation). Other outcomes: plasma inflammatory markers (IL‐6, TNF‐alpha, CRP, IL‐1beta) and adipokines (adiponectin, leptin), measured using ELISA assays (at 14, 20 & 34 weeks' gestation); blood pressure (at 14, 20 & 34 weeks' gestation); newborn whole‐blood fatty acid composition (48‐72 hours after birth); Matsuda Index (calculated from 2 hour oral glucose tolerance test at 28 weeks' gestation); erythrocyte fatty acid composition, measured by gas chromatography from a fasting blood sample (at 14, 20 & 34 weeks' gestation) |
| Starting date | 1 March 2017 |
| Contact information | Prof Manohar Garg, University of Newcastle. E‐mail: [email protected] |
| Notes | Funding and collaborators: University of Newcastle, Australia and EPAX, Norway. |
| Trial name or title | Diet and physical activity counselling and n3‐long chain (PUFA) supplementation in obese pregnant women (MIGHT) |
| Methods | RCT (cluster, with 4 arms): NCT02574767 |
| Participants | Recruitment target: 1000 women. Inclusion criteria: ≤ 14 weeks' gestational age at first prenatal visit; BMI > 30 kg/m2 at first prenatal visit; singleton pregnancy; plan to deliver at Sotero del Rio Hospital. Exclusion criteria: pre‐existing diabetes (known or diagnosed at first control (fasting plasma glucose > 126 mg/dl or 2 h plasma glucose > 200 mg/dl during an OGTT; insulin or metformin use; known medical or obstetric complications which restrict physical activity; history of eating disorders; high risk of haemorrhagic bleeding; high‐risk pregnancy according to national guidelines. Setting: 12 primary healthcare centres (PHCC) and Sotero del Rio Hospital, Chile. |
| Interventions | Intervention groups 1) 'Lifestyle counselling + PUFA supplement group': home‐based diet & physical activity counselling (2 home visits of 1 hour duration consisting of individually tailored dietary educational and behaviour education plus PUFA supplementation (n3LC‐PUFAs oral supplementation based on Schizochytrium oil (S‐oil) containing 800 mg DHA acid/day, administered as capsular preparations containing 200 mg DHA/capsule (4 capsules/day). 2) 'PUFA supplementation" group': routine dietary and physical activity counselling plus n3LC‐PUFAs oral supplementation based on Schizochytrium oil (S‐oil) containing 800 mg DHA acid/day, administered as capsular preparations containing 200 mg DHA/capsule (4 capsules/day). Control groups 3) 'Llifestyle counselling + PUFA placebo group': home‐based diet & physical activity counselling (2 home visits of 1 hour duration consisting of individually tailored dietary educational and behaviour education plus capsular preparations containing 50 mg DHA capsule (4 capsules/day), delivered in the same way as the n3LC‐PUFA supplementation. 4) 'Routine diet & PA + PUFA placebo group': routine dietary and physical activity counselling plus capsulare preparations containing 50 mg DHA/capsule (4 capsules/day), delivered in the same way as the n3LC‐PUFA supplementation. |
| Outcomes | Primary outcomes: GDM (at 24‐28 weeks of gestation according to ADA 2011 guidelines); macrosomia (birthweight > 4000 g); prevalence of insulin resistance at birth. Other outcomes: low birthweight (below 2500 g); excess weight gain during pregnancy; pre‐eclampsia (at 24‐28 weeks of gestation); preterm birth (< 37 weeks); caesarean. |
| Starting date | August 2015 |
| Contact information | Dr Maria Luisa Garmendia. E‐mail: [email protected] |
| Notes | Funding and collaborators: University of Chile; Fondo Nacional de Desarrolo Cientificao y Technológico, Chile; DSM Nutritional Products, Inc; Corporación de Apoyo de la Investigatión Científica en Nutrición. |
| Trial name or title | DHA4PREG: DHA for PREGnant women: is the current recommendation appropriate for women with very low intake and status? |
| Methods | RCT (with 3 arms) |
| Participants | Recruitment target: 180 women Inclusion criteria: healthy pregnant women with a singleton pregnancy (with very low DHA intake and status) Exclusion criteria: pre‐existing chronic medical conditions such as diabetes, high blood pressure, congenital heart disease, kidney disease, very preterm birth; sickle cell disease or haemoglobinopathies; history of pre‐eclampsia, stillbirth, fetal death, major fetal abnormality; smoking or illegal substance use. Setting: Sudan |
| Interventions | Intervention group 1) Low‐dose intervention group: 575 mg omega‐3 (322.5 mg DHA and 47.2 mg EPA) 2) High‐does intervention group: 1725 mg omega‐3 (967.7 mg DHA and 141.5 mg EPA) Control group 3) placebo |
| Outcomes | Maternal DHA concentrations (blood and breast milk); fetal growth; preterm birth; gestational age at birth; birthweight; head circumference; length |
| Starting date | September 2014 |
| Contact information | Professor Kebreab Ghebremeskel: [email protected] |
| Notes | Funding and collaborators: Lipidomics and Nutrition Research Centre, London Metropolitan University, London (UK). |
| Trial name or title | STABIL: Fish oil for mood stabilization during pregnancy in women with bipolar disorder |
| Methods | RCT: ACTRN12612000405819 |
| Participants | Recruitment target: 200 women Inclusion criteria: pregnant women (up to 10 weeks of pregnancy, clinical diagnosis of bipolar disorder I or II, using MS medication with an intention to either continue or discontinue MS medication throughout pregnancy, no experience of a mood episode reaching DSM IV‐TR criteria within 4 weeks of recruitment, prepared to continue regular visits to personal treating medical professional/s throughout study period for ongoing psychiatric and antenatal care, able to give informed consent. Exclusion criteria: under 18 years of age, poor written and/or spoken English, diagnosed with schizophrenia or schizoaffective disorder, taking any daily supplement containing more than 120 mg EPA or more than 500 mg EPA + DHA, at high risk of suicide, participating in another clinical trial, current drug or alcohol problems, unstable medical condition or unstable thyroid dysfunction or lipid metabolism disorder, current use of anticoagulant therapy, have a bleeding disorder, fish/seafood allergy. Setting: Australia |
| Interventions | Intervention group 5 g concentrated omega‐3 triglycerides from fish, containing 1000 mg DHA and 1500 mg EPA daily, taken as an oral capsule once daily, from enrolment (up to 10 weeks of pregnancy) till 12 weeks postpartum Control group 1 g concentrated omega‐3 triglycerides from fish, containing 430 mg DHA and 90 mg EPA, plus 4 g medium chain fatty acids from coconut, taken as an oral capsule once daily, from enrolment (up to 10 weeks of pregnancy) till 12 weeks postpartum |
| Outcomes | Primary outcomes: number of mood episode recurrences (defined by DSM‐IV criteria for major depression, hypomania or mania, or the need for rescue medication to be provided by the treating clinician due to deteriorating mood) Other outcomes: time to onset of first mood episode recurrence; severity of depressive and manic symptoms (Montgomery Asberg Depression Rating Scale (MADRS) and Young Mania Rating Scale (YMRS) will be used to assess the severity of mood symptoms) |
| Starting date | 1 May 2012 |
| Contact information | B Hegarty. E‐mail: [email protected] |
| Notes | Funding and collaborators: Department of Health and Aging, Canberra; University of New South Wales, Black Dog Institute (Australia) |
| Trial name or title | The effect of alpha linolenic acid (ALA) supplementation during pregnancy |
| Methods | RCT (3 arm): NCT03040856 |
| Participants | 150 pregnant women aged 18 to 45 years attending the high‐risk clinic (GA 12‐16 weeks) |
| Interventions | ALA (1260 mg/day) versus DHA + EPA (480 mg DHA and 720 mg EPA/day) versus placebo (olive oil) |
| Outcomes | Omega‐3 fatty acid concentrations, expression of messenger RNAs |
| Starting date | May 2017 |
| Contact information | Aya Mohr Sasson, email: [email protected] |
| Notes | Sheba Medical Center, Israel |
| Trial name or title | Effect of Docosa‐Hexanoic Acid (DHA) Supplements During Pregnancy on Newborn Outcomes in India: (DHANI) |
| Methods | RCT: NCT 01580345. |
| Participants | Recruitment target: 600 women Inclusion criteria: 18 to 35 years or older; ≤ 20 weeks of gestation; willing to participate in the study and perform all measurements for self, husband and offspring; willing to provide signed and dated informed consent. Exclusion criteria: allergic (if aware) to any of the test products; at high risk for hemorrhagic bleeding, clotting (if aware); high‐risk pregnancy; consuming omega‐3 supplements or having used these in 3 months preceding the intervention period; reported participation in another biomedical trial 3 months before the start of the study or during the study. Setting: KLEUs Jawaharlal Nehru Medical College, Prabhakar Kore Charitable Hospital, Belgaum, Karnataka, India. |
| Interventions | Intervention group 400 mg of DHA daily, from ≤ 20 weeks' gestation until birth. Control group 400 mg/day of placebo (corn/soy oil), from ≤ 20 weeks' gestation until birth. |
| Outcomes | Primary outcomes: newborn anthropometry (birthweight, length, and head circumference). Other outcomes: gestational age; new born APGAR score (at 1 minute and 5 minutes); unfavourable pregnancy outcomes (stillbirth, low birthweight babies, and preterm babies) |
| Starting date | December 2015 |
| Contact information | Dr Shweta Khandelwal, Senior Public Health Nutritionist, Centre for Chronic Disease Control, India. E‐mail: [email protected] |
| Notes | Funding and collaborators: Centre for Chronic Disease Control, India; Department of Science and Technology, Government of India; Jawaharlal Nehru Medical College. |
| Trial name or title | Maternal DHA Supplementation and Offspring Neurodevelopement in India (DHANI‐2) |
| Methods | RCT: NCT03072277 |
| Participants | 957 participants Inclusion criteria: 18 to 35 year old pregnant women (singleton) at ≤ 20 weeks GA, willing to participate in study and perform all measurements for self, husband and offspring including anthropometry, dietary assessment, questionnaires and biological samples (blood and breast milk), willing to provide signed and dated informed consent Exclusion criteria: allergic (if aware) to any of the test products, at high risk for haemorrhagic bleeding or clotting (if aware), high‐risk pregnancies (history and prevalence of pregnancy complications, including abruptio placentae, pre‐eclampsia, pregnancy‐induced hypertension, any serious bleeding episode in the current pregnancy, and/or physician referral); and/or diagnosed chronic degenerative disease(s) such as diagnosed heart disease, cancer, stroke or diabetes (as omega‐3 could raise blood sugar and lower insulin promotion) Setting: KLEUs Jawaharlal Nehru Medical College, Prabhakar Kore Charitable Hospital, Belgaum, Karnataka, India. |
| Interventions | Intervention group DHA (400 mg/day) from ≤ 20 weeks of gestation through 6 months postpartum Control group Placebo (400 mg/day corn/soy oil) from ≤ 20 weeks of gestation through 6 months postpartum |
| Outcomes | Primary outcomes: infant neurodevelopment defined as measured by the mean difference in the average Developmental Quotient (DQ) scores of the 2 groups Other outcomes: DHA levels (fatty acid levels in maternal and infant blood) |
| Starting date | December 2015 |
| Contact information | Public Health Foundation of India cited as responsible party, no further details. |
| Notes | Funding and collaborators: Public Health Foundation of India, Jawaharlal Nehru Medical College, India Alliance Estimated study completion date: December 2020 (primary completion August 2019) |
| Trial name or title | Effect of omega‐3 fatty acids on insulin sensitivity in Chinese gestational diabetes patients |
| Methods | RCT: NCT01912170 |
| Participants | Recruitment target: 75 women. Inclusion criteria: 18‐40 years; with gestational diabetes; willing to participate in the trial. Exclusion criteria: type 1 diabetes mellitus or type 2 diabetes mellitus before pregnancy; not willing to provide informed consent; with a family history of hypertriglyceridaemia or fasting triglyceride > 4.56 mmol/L; diagnosed with severe liver disease, kidney disease or cancer; participating in another clinical trial within 30 days; other diseases or conditions for which the doctor does not agree to the participant's participation. Setting: Jiaxing Women's and Children's Hospital, China. |
| Interventions | Intervention group Fish oil 2 g a day (220 mg EPA and 170 mg DHA per 1 g capsule), from the third trimester of pregnancy until the 4th week after birth. Control group Flaxseed oil 2 g a day (550 mg ALA per 1 g capsule), from the third trimester of pregnancy until the 4th week after birth. |
| Outcomes | Primary outcomes: fasting glucose; fasting insulin. Secondary outcomes: birthweight; birth length; blood lipids. |
| Starting date | August 2013 |
| Contact information | Professor Duo Li (Principal Investigator) and Huijuan Liu (contact provided), Zhejiang University, China. E‐mails: not provided. |
| Notes | Funding and collaborators: Zhejiang University; National Natural Science Foundation of China. |
| Trial name or title | Omega‐3 fats to reduce the incidence of prematurity: the ORIP trial |
| Methods | RCT: ACTRN12613001142729 |
| Participants | Recruitment target: 5540 women. Inclusion criteria: < 20 weeks' gestation (singleton or multiple pregnancy). Exclusion criteria: known fetal abnormality; taking dietary supplements containing LCPUFA 150mg/day; taking dietary supplements containing LCPUFA 150 mg/day and not willing to stop; bleeding disorders where fish oil is contraindicated or on anticoagulant therapy; and history of drug or alcohol abuse. Setting: South Australia, Victoria and Queensland, Australia. |
| Interventions | Intervention group 3 capsules of fish oil containing a total dose of approximately 800 mg of DHA daily from enrolment (12 weeks ‐ 20 weeks' gestation) until 34 weeks of gestation or birth (whichever occurs first) Control group 3 placebo vegetable oil capsules with a trace of DHA to aid masking. |
| Outcomes | Primary outcome: early preterm birth (< 34 weeks). Other outcomes: post‐term induction; post‐term pre labour caesarean birth; preterm birth (< 37 weeks); safety and tolerability of DHA supplementation; low birthweight (< 2500 g); small‐for‐gestational age (< 10th centile for corresponding GA and sex); neonatal complications (up to 28 days post birth); admission to NICU. |
| Starting date | October 2013 |
| Contact information | Prof Maria Makrides, SAHMRI. E‐mail: [email protected] |
| Notes | Funding and collaborators: NHMRC; SAHMRI. Recruitment ended 27 April 2017. |
| Trial name or title | A randomised controlled trial for the optimization of the viability of stem cells derived from umbilical CORd blood after maternal supplementation with DHA during the second or third trimester of pregnancy (CORDHA) |
| Methods | RCT: ISRCTN58396079. |
| Participants | Recruitment target: 150 women. Inclusion criteria: Caucasian, non‐smoker, > 18 years of age, single pregnancy, absence of diabetes or hypertension or any other type of pathology requiring pharmacological therapy, absence of chromosome abnormalities and/or congenital malformations in the fetus, and HBV, HCV, HIV and CMV negative. Exclusion criteria: impossible to collect cord blood (for bureaucratic reasons or because of emergencies regarding the health of the mother or the baby), taken other supplements containing DHA or fish oil, temperature of 39C during birth, and UCB samples with a volume of less than 80 mL and/or less than 70% cell vitality. Setting: Rome, Italy. |
| Interventions | Intervention group DHA (250 mg/day), from the 20th or from the 28th week up to the 40th week of estimated gestational age. Control group Placebo (250 mg olive oil/day), from the 20th or from the 28th week up to the 40th week of estimated gestational age. |
| Outcomes | Primary outcome: measure of the viability (%) and the number of CD34+ cells collected from the umbilical cord blood at birth. No other outcomes specified. |
| Starting date | September 2010 |
| Contact information | Irene Martini, Via Vittorio Locchi 9 00197 Rome, Italy. E‐mail: [email protected] |
| Notes | Funding and collaborators: SmartBank SRL; Biovault and Avantgarde SAS. Recruitment ended September 2014. |
| Trial name or title | Improving Maternal and Child Health Through Prenatal Fatty Acid Supplementation (NAPS): A Randomized Controlled Study in African‐American Women Living in Low‐income Envrionments |
| Methods | RCT (NCT02647723) |
| Participants | Recruitment target: 162 women. Inclusion criteria: women 18 to 34 years of age, household recipient of public assistance (e.g. Medicaid insurance) due to low income, low levels of DHA consumption defined as less than 2 fish servings per week Exclusion criteria: reports of known medical complications, regular use of steroid medications or alcohol or cigarettes or illegal substances (by medical report), use of blood thinners or anti‐coagulants, use of psychotropic medications, BMI > 40, allergy to iodine and/or soy Setting: United States, Illinois |
| Interventions | Intervention group DHA (450 mg twice daily), by oral intake, for 24 weeks Control group Placebo (450 mg soybean oil twice daily, by oral intake, for 24 weeks) |
| Outcomes | Primary outcome: average change in perceived stress scale (PSS) score (time frame 16 months), assessed at baseline and at 24, 30 and 36 weeks of pregnancy, and at 1, 4 and 9 months after birth No other outcomes specified |
| Starting date | January 2016 |
| Contact information | Kimberley Mbayiwa. E‐mail: [email protected] |
| Notes | Funding and collaborations: University of Chicago, Eunice Kennedy Shriver National Institute of Child Health and Human Development (NICHD), University of Pittsburgh. |
| Trial name or title | Fish Oil to Reduce Tobacco Use iN Expectant Mothers (FORTUNE) |
| Methods | RCT: NCT03077724 |
| Participants | 40 pregnant women aged 18 to 45 years, between 6 and 36 weeks' gestation, who are active smokers Setting: Nashville, Tennessee, United States |
| Interventions | Omega‐3 (4.2 g/day) versus placebo (olive oil) |
| Outcomes | Reduction in total cigarettes smoked per day |
| Starting date | March 2017 |
| Contact information | Associate Professor Harvey Murff, Vanderbilt University Medical Center, USA. email: [email protected] |
| Notes | Pilot feasibility trial |
| Trial name or title | SYNCHRO |
| Methods | RCT (multi centre): NCT02166424 |
| Participants | Recruitment target: 108 women. Inclusion criteria: ≥ 20 years; 12‐24 weeks' gestation, Japanese conversational ability in Japan site, Mandarin conversational ability in Taiwan site, willing to take assessments after childbirth, with EPDS 9 or more and in good physical health (judged by obstetricians). Exclusion criteria: history and current suspicion of psychosis or bipolar disorder or substance‐related disorder or eating disorder or personality disorder, serious phychiatric symptoms such as self‐harm behaviour or in need of rapid psychiatric treatment, difficult to expect a normal birth, having a history of bleeding disorder such as von Willebrand's Disease, regular treatment with Asprin or warfarin within the last 3 months, a smoking habit of ≥ 40 cigarettes per day, regular treatment with ethyl icosapentate or regular consumption of omega‐3 PUFA supplements within the last 3 months, and a habit of eating fish as a main dish ≥ times per week. Setting: Japan and Taiwan. |
| Interventions | Intervention group Omega‐3 polyunsaturated fatty acids (1200 mg eicosapentaenoic acid EPA and 600 mg DHA daily). Control group Placebo (2880 mg olive oil daily). |
| Outcomes | Primary outcome: total score on HAMD (12 weeks). Other outcomes: total score on HAMD (4‐6 weeks after childbirth); MDD as determined by the depression module of MINI (4‐6 weeks after childbirth); total scores on EPDS (4‐6 weeks after childbirth); total score on BDI‐Ⅱ (4‐6 weeks after childbirth); omega‐3 fatty acids concentrations in erythrocytes (4‐6 weeks after childbirth); oestrogen in plasma (4‐6 weeks after childbirth); oxytocin in plasmal (4‐6 weeks after childbirth); progesterone in plasma (4‐6 weeks after childbirth), hCG in plasma (4‐6 weeks after childbirth), phospholipase A2 in plasma (4‐6 weeks after childbirth);gestational age (at childbirth); GDM (4‐6 weeks after childbirth); gestational hypertension or pre‐eclampsia (4‐6 weeks after childbirth); gestational hypertension or pre‐eclampsia (4‐6 weeks after childbirth); induced labour; blood loss at childbirth; caesarean section; operative vaginal birth; birthweight; Apgar score (at 1 minute and 5 minutes); NICU admission (4‐6 weeks after childbirth); and cholesterol (4‐6 weeks after childbirth). |
| Starting date | June 2014 |
| Contact information | Daisuke Nishi, Assistant Professor, Tokyo Medical University. E‐mail: d‐[email protected] |
| Notes | Funding and collaborators: Tokyo Medical University, China Medical University (Taiwan), University of Toyama, Chiba University, and National Center for Child Health and Development. A non‐randomised pilot for this study was registered as NCT01948596 (completed: Nishi 2016) |
| Trial name or title | Impact of DHA/Oat on metabolic health in gestational diabetes mellitus |
| Methods | RCT |
| Participants | 80 women with a singleton pregnancy without any evidence of malformation and with a de novo diagnosis of gestational diabetes at 22‐28 weeks gestation |
| Interventions | 1) DHA 2) oat 3) DHA + oat 4) placebo |
| Outcomes | neonatal leptin; maternal fasting plasma glucose concentration, |
| Starting date | August 2017 |
| Contact information | Wen_Juan Wang, Master email:[email protected] |
| Notes | Xinhua Hospital, Shanghai Jiao Tong University School of Medicine |
| Trial name or title | Effect of mother's supplementation omega‐3 in the dynamics of fetal ductus arteriosus: a randomized clinical trial |
| Methods | RCT: NCT02565290 |
| Participants | Recruitment target: 74 women. Inclusion criteria: at 28‐32 weeks' gestation; and willing to participate Exclusion criteria: hypertensive; diabetic; not using anti‐inflammatory drugs; not HIV positive; not using mate, black or green tea; no inflammation in past 5 days; and not allergic to fish or soy. Setting: Brazil |
| Interventions | Intervention group Omega 3 capsules (1g), 2 times a day, for 21 days. Control group Placebo soy oil capsules (1g), 2 times a day, for 21 days. |
| Outcomes | Primary outcome: pulsatility index of fetal ductus arteriosus Other outcomes: inflammatory biomarkers (interleukins, prostaglandins, cyclooxygenase); systolic and diastolic velocity of fetal ductus arteriosus; and biomarkers of oxidative stress. |
| Starting date | May 2015 |
| Contact information | Dr Paulo Zielinsky, Instituto de Cardiologia do Rio Grande do Sul. E‐mail: [email protected] |
| Notes | Funding and collaborators: Instituto de Cardiologia do Rio Grande do Sul. |
| Trial name or title | Dietary supplementation of Omega 3 and the participation in the placentary vascular resistance mechanism in pregnant people |
| Methods | RCT |
| Participants | 150 pregnant women ≥ 19 years; non‐smokers |
| Interventions | women without risk factors for pre‐eclampsia: 1) 400 mg omega from 12 weeks gestation to one week prior to birth 2) no omega women at risk of pre‐eclampsia 1) AAS + 400 mg omega 2) 400 mg omega women with thrombophilia 1) heparin + 400 mg omega 2) 400 mg omega |
| Outcomes | placental vascular resistance; pre‐eclampsia; oligohydramnios; intrauterine growth restriction |
| Starting date | August 2018 |
| Contact information | Juliana Barroso Zimmermann email: julianabz@uol,com,br |
| Notes | Faculdade de Medicina de Barbacena |
Abbreviations: ADA: American Diabetes Associaton; ADORE: Assessment of DHA on Reducing Early Preterm Birth; ADP: Air Displacement Plethsmography; BDI: Beck Depression Inventory; BIS: Bioelectical Independence Spectroscopy; BMI: Body Mass Index; CMV: cytomegalovirus; DHA4PREG: DHA for PREGnant women; DHA: docosahexaenoic acid; DXA: dual x‐ray absorptiometry; EPA: eicosapentaenoic acid; EPDS: Edinburgh Postnatal Depression Scale; FOPCHIN: Fish Oil Supplementation to Pregnant Women in China; GA: gestational age; GDM: gestational diabetes mellitus; HAMD: Hamilton Rating Scale for Depression; HBV: Hepatitis B virus; HCV: Hepatitis C virus; HIV: human immunodeficiency virus; HOMA‐IR: Homeostatic Model Assessment of Insulin Resistance; hCG: human chorionic gonadotropin; IVGTT: Intravenous Glucose Tolerance Test; LCPUFA: long‐chain polyunsaturated acids; MDD: major depressive disorder; MINI: Min‐International Neuropsychiatric Interview; NHMRC: National Health and Medical Research Institute; NICU: neonatal intensive care unit; NSAIDs: nonsteroidal anti‐inflammatory drugs; OGTT: oral glucose tolerance test; PUFA: polyunsaturated fatty acid; RCT: randomised controlled trial; SAHMRI: South Australian Health and Medical Resesarch Institute; SYNCHRO:The Synchronized Trial on Expectant Mothers with Depressive Symptoms by Omega‐3 PUFAs; UBC: umbilical cord blood
Data and analyses
| Outcome or subgroup title | No. of studies | No. of participants | Statistical method | Effect size |
| 1 Preterm birth (< 37 weeks) Show forest plot | 26 | 10304 | Risk Ratio (M‐H, Fixed, 95% CI) | 0.89 [0.81, 0.97] |
| Analysis 1.1  Comparison 1 Overall: omega‐3 versus no omega‐3, Outcome 1 Preterm birth (< 37 weeks). | ||||
| 2 Early preterm birth (< 34 weeks) Show forest plot | 9 | 5204 | Risk Ratio (M‐H, Fixed, 95% CI) | 0.58 [0.44, 0.77] |
| Analysis 1.2  Comparison 1 Overall: omega‐3 versus no omega‐3, Outcome 2 Early preterm birth (< 34 weeks). | ||||
| 3 Prolonged gestation (> 42 weeks) Show forest plot | 6 | 5141 | Risk Ratio (M‐H, Fixed, 95% CI) | 1.61 [1.11, 2.33] |
| Analysis 1.3  Comparison 1 Overall: omega‐3 versus no omega‐3, Outcome 3 Prolonged gestation (> 42 weeks). | ||||
| 4 Maternal death Show forest plot | 4 | 4830 | Risk Ratio (M‐H, Fixed, 95% CI) | 1.69 [0.07, 39.30] |
| Analysis 1.4  Comparison 1 Overall: omega‐3 versus no omega‐3, Outcome 4 Maternal death. | ||||
| 5 Pre‐eclampsia (hypertension with proteinuria) Show forest plot | 20 | 8306 | Risk Ratio (M‐H, Fixed, 95% CI) | 0.84 [0.69, 1.01] |
| Analysis 1.5  Comparison 1 Overall: omega‐3 versus no omega‐3, Outcome 5 Pre‐eclampsia (hypertension with proteinuria). | ||||
| 6 High blood pressure (without proteinuria) Show forest plot | 7 | 4531 | Risk Ratio (M‐H, Fixed, 95% CI) | 1.03 [0.89, 1.20] |
| Analysis 1.6  Comparison 1 Overall: omega‐3 versus no omega‐3, Outcome 6 High blood pressure (without proteinuria). | ||||
| 7 Eclampsia Show forest plot | 1 | 100 | Risk Ratio (M‐H, Fixed, 95% CI) | 0.14 [0.01, 2.70] |
| Analysis 1.7  Comparison 1 Overall: omega‐3 versus no omega‐3, Outcome 7 Eclampsia. | ||||
| 8 Maternal antepartum hospitalisation Show forest plot | 5 | 2876 | Risk Ratio (M‐H, Fixed, 95% CI) | 0.92 [0.81, 1.04] |
| Analysis 1.8  Comparison 1 Overall: omega‐3 versus no omega‐3, Outcome 8 Maternal antepartum hospitalisation. | ||||
| 8.1 Any | 4 | 2813 | Risk Ratio (M‐H, Fixed, 95% CI) | 0.91 [0.80, 1.03] |
| 8.2 Due to PIH or IUGR | 1 | 63 | Risk Ratio (M‐H, Fixed, 95% CI) | 1.23 [0.67, 2.28] |
| 9 Mother's length of stay in hospital (days) Show forest plot | 2 | 2290 | Mean Difference (IV, Fixed, 95% CI) | 0.18 [‐0.20, 0.57] |
| Analysis 1.9  Comparison 1 Overall: omega‐3 versus no omega‐3, Outcome 9 Mother's length of stay in hospital (days). | ||||
| 10 Maternal anaemia Show forest plot | 1 | 846 | Risk Ratio (M‐H, Fixed, 95% CI) | 1.16 [0.91, 1.48] |
| Analysis 1.10  Comparison 1 Overall: omega‐3 versus no omega‐3, Outcome 10 Maternal anaemia. | ||||
| 11 Miscarriage (< 24 weeks) Show forest plot | 9 | 4190 | Risk Ratio (M‐H, Fixed, 95% CI) | 1.07 [0.80, 1.43] |
| Analysis 1.11  Comparison 1 Overall: omega‐3 versus no omega‐3, Outcome 11 Miscarriage (< 24 weeks). | ||||
| 12 Antepartum vaginal bleeding Show forest plot | 2 | 2151 | Risk Ratio (M‐H, Fixed, 95% CI) | 1.01 [0.69, 1.48] |
| Analysis 1.12  Comparison 1 Overall: omega‐3 versus no omega‐3, Outcome 12 Antepartum vaginal bleeding. | ||||
| 13 Rupture of membranes (PPROM; PROM) Show forest plot | 4 | Risk Ratio (M‐H, Fixed, 95% CI) | Subtotals only | |
| Analysis 1.13  Comparison 1 Overall: omega‐3 versus no omega‐3, Outcome 13 Rupture of membranes (PPROM; PROM). | ||||
| 13.1 Preterm prelabour rupture of membranes (PPROM) | 3 | 925 | Risk Ratio (M‐H, Fixed, 95% CI) | 0.53 [0.25, 1.10] |
| 13.2 Premature rupture of membranes (PROM) | 3 | 915 | Risk Ratio (M‐H, Fixed, 95% CI) | 0.41 [0.21, 0.82] |
| 14 Maternal admission to intensive care Show forest plot | 2 | 2458 | Risk Ratio (M‐H, Fixed, 95% CI) | 0.56 [0.12, 2.63] |
| Analysis 1.14  Comparison 1 Overall: omega‐3 versus no omega‐3, Outcome 14 Maternal admission to intensive care. | ||||
| 15 Maternal adverse events Show forest plot | 17 | Risk Ratio (M‐H, Fixed, 95% CI) | Subtotals only | |
| Analysis 1.15  Comparison 1 Overall: omega‐3 versus no omega‐3, Outcome 15 Maternal adverse events. | ||||
| 15.1 Severe adverse event | 2 | 2690 | Risk Ratio (M‐H, Fixed, 95% CI) | 1.04 [0.40, 2.72] |
| 15.2 Severe enough for cessation | 6 | 1487 | Risk Ratio (M‐H, Fixed, 95% CI) | 1.01 [0.53, 1.93] |
| 15.3 Any | 5 | 1480 | Risk Ratio (M‐H, Fixed, 95% CI) | 1.38 [1.16, 1.65] |
| 15.4 Nausea | 9 | 2929 | Risk Ratio (M‐H, Fixed, 95% CI) | 1.05 [0.90, 1.22] |
| 15.5 Unpleasant taste | 5 | 2356 | Risk Ratio (M‐H, Fixed, 95% CI) | 4.82 [3.35, 6.92] |
| 15.6 Vomiting | 7 | 3640 | Risk Ratio (M‐H, Fixed, 95% CI) | 1.14 [0.95, 1.37] |
| 15.7 Stomach pain | 4 | 928 | Risk Ratio (M‐H, Fixed, 95% CI) | 1.49 [0.62, 3.59] |
| 15.8 Reflux | 1 | 26 | Risk Ratio (M‐H, Fixed, 95% CI) | 1.0 [0.16, 6.07] |
| 15.9 Belching or burping | 5 | 2262 | Risk Ratio (M‐H, Fixed, 95% CI) | 3.52 [2.86, 4.34] |
| 15.10 Diarrhoea | 6 | 1764 | Risk Ratio (M‐H, Fixed, 95% CI) | 0.80 [0.52, 1.24] |
| 15.11 Constipation | 1 | 1077 | Risk Ratio (M‐H, Fixed, 95% CI) | 0.42 [0.08, 2.15] |
| 15.12 Nasal bleeding | 2 | 1506 | Risk Ratio (M‐H, Fixed, 95% CI) | 0.94 [0.71, 1.24] |
| 15.13 Swelling/other reaction at injection site | 1 | 852 | Risk Ratio (M‐H, Fixed, 95% CI) | 1.10 [0.99, 1.22] |
| 15.14 Insomnia | 1 | 36 | Risk Ratio (M‐H, Fixed, 95% CI) | 1.5 [0.28, 7.93] |
| 15.15 Headache | 1 | 301 | Risk Ratio (M‐H, Fixed, 95% CI) | 1.61 [0.91, 2.86] |
| 15.16 Gynaecological infections | 1 | 291 | Risk Ratio (M‐H, Fixed, 95% CI) | 0.84 [0.45, 1.55] |
| 15.17 Labour related | 1 | 291 | Risk Ratio (M‐H, Fixed, 95% CI) | 0.49 [0.27, 0.88] |
| 15.18 Urinary tract infection | 1 | 291 | Risk Ratio (M‐H, Fixed, 95% CI) | 0.30 [0.06, 1.42] |
| 16 Caesarean section Show forest plot | 28 | 8481 | Risk Ratio (M‐H, Fixed, 95% CI) | 0.97 [0.91, 1.03] |
| Analysis 1.16  Comparison 1 Overall: omega‐3 versus no omega‐3, Outcome 16 Caesarean section. | ||||
| 17 Induction (post‐term) Show forest plot | 3 | 2900 | Risk Ratio (M‐H, Random, 95% CI) | 0.82 [0.22, 2.98] |
| Analysis 1.17  Comparison 1 Overall: omega‐3 versus no omega‐3, Outcome 17 Induction (post‐term). | ||||
| 18 Blood loss at birth (mL) Show forest plot | 6 | 2776 | Mean Difference (IV, Fixed, 95% CI) | 11.50 [‐6.75, 29.76] |
| Analysis 1.18  Comparison 1 Overall: omega‐3 versus no omega‐3, Outcome 18 Blood loss at birth (mL). | ||||
| 19 Postpartum haemorrhage Show forest plot | 4 | 4085 | Risk Ratio (M‐H, Fixed, 95% CI) | 1.03 [0.82, 1.30] |
| Analysis 1.19  Comparison 1 Overall: omega‐3 versus no omega‐3, Outcome 19 Postpartum haemorrhage. | ||||
| 20 Gestational diabetes Show forest plot | 12 | 5235 | Risk Ratio (M‐H, Fixed, 95% CI) | 1.02 [0.83, 1.26] |
| Analysis 1.20  Comparison 1 Overall: omega‐3 versus no omega‐3, Outcome 20 Gestational diabetes. | ||||
| 21 Maternal insulin resistance (HOMA‐IR) Show forest plot | 3 | 176 | Mean Difference (IV, Random, 95% CI) | ‐0.85 [‐2.50, 0.80] |
| Analysis 1.21  Comparison 1 Overall: omega‐3 versus no omega‐3, Outcome 21 Maternal insulin resistance (HOMA‐IR). | ||||
| 22 Excessive gestational weight gain Show forest plot | 1 | 350 | Risk Ratio (M‐H, Fixed, 95% CI) | 1.21 [0.95, 1.55] |
| Analysis 1.22  Comparison 1 Overall: omega‐3 versus no omega‐3, Outcome 22 Excessive gestational weight gain. | ||||
| 23 Gestational weight gain (kg) Show forest plot | 11 | 2297 | Mean Difference (IV, Random, 95% CI) | ‐0.05 [‐0.68, 0.59] |
| Analysis 1.23  Comparison 1 Overall: omega‐3 versus no omega‐3, Outcome 23 Gestational weight gain (kg). | ||||
| 24 Depression during pregnancy: thresholds Show forest plot | 3 | Risk Ratio (M‐H, Fixed, 95% CI) | Subtotals only | |
| Analysis 1.24  Comparison 1 Overall: omega‐3 versus no omega‐3, Outcome 24 Depression during pregnancy: thresholds. | ||||
| 24.1 HAMD 50% reduction (after 8 weeks) | 1 | 24 | Risk Ratio (M‐H, Fixed, 95% CI) | 2.26 [0.78, 6.49] |
| 24.2 HAMD ≤ 7 | 1 | 24 | Risk Ratio (M‐H, Fixed, 95% CI) | 2.12 [0.51, 8.84] |
| 24.3 Unspecified | 1 | 301 | Risk Ratio (M‐H, Fixed, 95% CI) | 2.39 [0.47, 12.11] |
| 24.4 EPDS ≥ 11 | 1 | 34 | Risk Ratio (M‐H, Fixed, 95% CI) | 1.4 [0.55, 3.55] |
| 25 Depression during pregnancy: scores Show forest plot | 5 | Mean Difference (IV, Random, 95% CI) | Subtotals only | |
| Analysis 1.25  Comparison 1 Overall: omega‐3 versus no omega‐3, Outcome 25 Depression during pregnancy: scores. | ||||
| 25.1 BDI | 2 | 104 | Mean Difference (IV, Random, 95% CI) | ‐5.86 [‐8.32, ‐3.39] |
| 25.2 HAMD | 3 | 71 | Mean Difference (IV, Random, 95% CI) | ‐0.92 [‐5.91, 4.06] |
| 25.3 EPDS | 4 | 122 | Mean Difference (IV, Random, 95% CI) | ‐0.40 [‐3.70, 2.89] |
| 25.4 MADRS | 1 | 26 | Mean Difference (IV, Random, 95% CI) | ‐1.60 [‐7.80, 4.60] |
| 26 Anxiety during pregnancy Show forest plot | 1 | 301 | Risk Ratio (M‐H, Fixed, 95% CI) | 0.95 [0.06, 15.12] |
| Analysis 1.26  Comparison 1 Overall: omega‐3 versus no omega‐3, Outcome 26 Anxiety during pregnancy. | ||||
| 27 Difficult life circumstances (maternal) Show forest plot | 1 | 51 | Mean Difference (IV, Fixed, 95% CI) | 0.32 [‐0.15, 0.79] |
| Analysis 1.27  Comparison 1 Overall: omega‐3 versus no omega‐3, Outcome 27 Difficult life circumstances (maternal). | ||||
| 28 Stress (maternal) Show forest plot | 1 | Mean Difference (IV, Fixed, 95% CI) | Subtotals only | |
| Analysis 1.28  Comparison 1 Overall: omega‐3 versus no omega‐3, Outcome 28 Stress (maternal). | ||||
| 28.1 Perceived Stress Scale (scores) | 1 | 51 | Mean Difference (IV, Fixed, 95% CI) | ‐1.82 [‐3.68, 0.04] |
| 29 Depressive symptoms postpartum: threshold Show forest plot | 4 | Risk Ratio (M‐H, Random, 95% CI) | Subtotals only | |
| Analysis 1.29  Comparison 1 Overall: omega‐3 versus no omega‐3, Outcome 29 Depressive symptoms postpartum: threshold. | ||||
| 29.1 PDSS ≥ 80 | 1 | 42 | Risk Ratio (M‐H, Random, 95% CI) | 0.37 [0.04, 3.25] |
| 29.2 EPDS | 2 | 2431 | Risk Ratio (M‐H, Random, 95% CI) | 0.99 [0.56, 1.77] |
| 29.3 Major depressive disorder | 1 | 118 | Risk Ratio (M‐H, Random, 95% CI) | 1.33 [0.27, 6.56] |
| 30 Depressive symptoms postpartum: scores Show forest plot | 2 | Mean Difference (IV, Fixed, 95% CI) | Subtotals only | |
| Analysis 1.30  Comparison 1 Overall: omega‐3 versus no omega‐3, Outcome 30 Depressive symptoms postpartum: scores. | ||||
| 30.1 BDI: 6‐8 weeks postpartum | 1 | 118 | Mean Difference (IV, Fixed, 95% CI) | 0.25 [‐1.93, 2.43] |
| 30.2 PDSS total (LS over 6 months) | 1 | 42 | Mean Difference (IV, Fixed, 95% CI) | ‐6.08 [‐12.42, 0.26] |
| 30.3 Disturbances sleep/eating (LS over 6 months) | 1 | 42 | Mean Difference (IV, Fixed, 95% CI) | ‐1.0 [‐2.66, 0.66] |
| 30.4 Anxiety/insecurity (LS over 6 months) | 1 | 42 | Mean Difference (IV, Fixed, 95% CI) | ‐1.30 [‐2.96, 0.36] |
| 30.5 Emotional lability (LS over 6 months) | 1 | 42 | Mean Difference (IV, Fixed, 95% CI) | ‐1.29 [‐3.10, 0.52] |
| 30.6 Mental confusion (LS over 6 months) | 1 | 42 | Mean Difference (IV, Fixed, 95% CI) | ‐1.30 [‐2.92, 0.32] |
| 30.7 Loss of self (LS over 6 months) | 1 | 42 | Mean Difference (IV, Fixed, 95% CI) | ‐0.90 [‐1.80, 0.00] |
| 30.8 Guilt (LS over 6 months) | 1 | 42 | Mean Difference (IV, Fixed, 95% CI) | ‐0.30 [‐1.13, 0.53] |
| 30.9 Suicide (LS over 6 months) | 1 | 42 | Mean Difference (IV, Fixed, 95% CI) | ‐0.07 [‐0.35, 0.21] |
| 30.10 PDSS total at 6 months | 1 | 42 | Mean Difference (IV, Fixed, 95% CI) | ‐2.87 [‐12.17, 6.43] |
| 30.11 Disturbances sleep/eating at 6 months | 1 | 42 | Mean Difference (IV, Fixed, 95% CI) | ‐0.20 [‐2.08, 1.68] |
| 30.12 Anxiety/insecurity at 6 months | 1 | 42 | Mean Difference (IV, Fixed, 95% CI) | ‐0.46 [‐2.65, 1.73] |
| 30.13 Emotional lability at 6 months | 1 | 42 | Mean Difference (IV, Fixed, 95% CI) | ‐0.96 [‐3.32, 1.40] |
| 30.14 Mental confusion at 6 months | 1 | 42 | Mean Difference (IV, Fixed, 95% CI) | ‐0.13 [‐2.15, 1.89] |
| 30.15 Loss of self at 6 months | 1 | 42 | Mean Difference (IV, Fixed, 95% CI) | ‐0.97 [‐2.18, 0.24] |
| 30.16 Guilt at 6 months | 1 | 42 | Mean Difference (IV, Fixed, 95% CI) | 0.21 [‐0.69, 1.11] |
| 30.17 Suicide at 6 months | 1 | 42 | Mean Difference (IV, Fixed, 95% CI) | ‐0.52 [‐1.13, 0.09] |
| 31 Gestational length (days) Show forest plot | 43 | 12517 | Mean Difference (IV, Random, 95% CI) | 1.67 [0.95, 2.39] |
| Analysis 1.31  Comparison 1 Overall: omega‐3 versus no omega‐3, Outcome 31 Gestational length (days). | ||||
| 32 Perinatal death Show forest plot | 10 | 7416 | Risk Ratio (M‐H, Fixed, 95% CI) | 0.75 [0.54, 1.03] |
| Analysis 1.32  Comparison 1 Overall: omega‐3 versus no omega‐3, Outcome 32 Perinatal death. | ||||
| 33 Stillbirth Show forest plot | 16 | 7880 | Risk Ratio (M‐H, Fixed, 95% CI) | 0.94 [0.62, 1.42] |
| Analysis 1.33  Comparison 1 Overall: omega‐3 versus no omega‐3, Outcome 33 Stillbirth. | ||||
| 34 Neonatal death Show forest plot | 9 | 7448 | Risk Ratio (M‐H, Fixed, 95% CI) | 0.61 [0.34, 1.11] |
| Analysis 1.34  Comparison 1 Overall: omega‐3 versus no omega‐3, Outcome 34 Neonatal death. | ||||
| 35 Infant death Show forest plot | 4 | 3239 | Risk Ratio (M‐H, Fixed, 95% CI) | 0.74 [0.25, 2.19] |
| Analysis 1.35  Comparison 1 Overall: omega‐3 versus no omega‐3, Outcome 35 Infant death. | ||||
| 36 Large‐for‐gestational age Show forest plot | 6 | 3722 | Risk Ratio (M‐H, Fixed, 95% CI) | 1.15 [0.97, 1.36] |
| Analysis 1.36  Comparison 1 Overall: omega‐3 versus no omega‐3, Outcome 36 Large‐for‐gestational age. | ||||
| 37 Macrosomia Show forest plot | 6 | 2008 | Risk Ratio (M‐H, Fixed, 95% CI) | 0.69 [0.43, 1.13] |
| Analysis 1.37  Comparison 1 Overall: omega‐3 versus no omega‐3, Outcome 37 Macrosomia. | ||||
| 38 Low birthweight (< 2500 g) Show forest plot | 15 | 8449 | Risk Ratio (M‐H, Fixed, 95% CI) | 0.90 [0.82, 0.99] |
| Analysis 1.38  Comparison 1 Overall: omega‐3 versus no omega‐3, Outcome 38 Low birthweight (< 2500 g). | ||||
| 39 Small‐for‐gestational age/IUGR Show forest plot | 8 | 6907 | Risk Ratio (M‐H, Fixed, 95% CI) | 1.01 [0.90, 1.13] |
| Analysis 1.39  Comparison 1 Overall: omega‐3 versus no omega‐3, Outcome 39 Small‐for‐gestational age/IUGR. | ||||
| 40 Birthweight (g) Show forest plot | 44 | 11584 | Mean Difference (IV, Random, 95% CI) | 75.74 [38.05, 113.43] |
| Analysis 1.40  Comparison 1 Overall: omega‐3 versus no omega‐3, Outcome 40 Birthweight (g). | ||||
| 41 Birthweight Z score Show forest plot | 4 | 2792 | Mean Difference (IV, Fixed, 95% CI) | 0.06 [‐0.02, 0.13] |
| Analysis 1.41  Comparison 1 Overall: omega‐3 versus no omega‐3, Outcome 41 Birthweight Z score. | ||||
| 42 Birth length (cm) Show forest plot | 29 | 8128 | Mean Difference (IV, Random, 95% CI) | 0.11 [‐0.10, 0.31] |
| Analysis 1.42  Comparison 1 Overall: omega‐3 versus no omega‐3, Outcome 42 Birth length (cm). | ||||
| 43 Head circumference at birth (cm) Show forest plot | 24 | 7161 | Mean Difference (IV, Random, 95% CI) | 0.07 [‐0.05, 0.19] |
| Analysis 1.43  Comparison 1 Overall: omega‐3 versus no omega‐3, Outcome 43 Head circumference at birth (cm). | ||||
| 44 Head circumference at birth Z score Show forest plot | 2 | 2462 | Mean Difference (IV, Fixed, 95% CI) | ‐0.03 [‐0.14, 0.07] |
| Analysis 1.44  Comparison 1 Overall: omega‐3 versus no omega‐3, Outcome 44 Head circumference at birth Z score. | ||||
| 45 Length at birth Z score Show forest plot | 2 | 2462 | Mean Difference (IV, Random, 95% CI) | 0.18 [‐0.18, 0.54] |
| Analysis 1.45  Comparison 1 Overall: omega‐3 versus no omega‐3, Outcome 45 Length at birth Z score. | ||||
| 46 Baby admitted to neonatal care Show forest plot | 9 | 6920 | Risk Ratio (M‐H, Fixed, 95% CI) | 0.92 [0.83, 1.03] |
| Analysis 1.46  Comparison 1 Overall: omega‐3 versus no omega‐3, Outcome 46 Baby admitted to neonatal care. | ||||
| 47 Infant length of stay in hospital (days) Show forest plot | 1 | 2041 | Mean Difference (IV, Fixed, 95% CI) | 0.11 [‐1.40, 1.62] |
| Analysis 1.47  Comparison 1 Overall: omega‐3 versus no omega‐3, Outcome 47 Infant length of stay in hospital (days). | ||||
| 48 Congenital anomalies Show forest plot | 3 | 1807 | Risk Ratio (M‐H, Fixed, 95% CI) | 1.08 [0.61, 1.92] |
| Analysis 1.48  Comparison 1 Overall: omega‐3 versus no omega‐3, Outcome 48 Congenital anomalies. | ||||
| 49 Retinopathy of prematurity Show forest plot | 1 | 837 | Risk Ratio (M‐H, Fixed, 95% CI) | 1.20 [0.32, 4.44] |
| Analysis 1.49  Comparison 1 Overall: omega‐3 versus no omega‐3, Outcome 49 Retinopathy of prematurity. | ||||
| 50 Bronchopulmonary dysplasia Show forest plot | 2 | 3191 | Risk Ratio (M‐H, Fixed, 95% CI) | 1.06 [0.45, 2.48] |
| Analysis 1.50  Comparison 1 Overall: omega‐3 versus no omega‐3, Outcome 50 Bronchopulmonary dysplasia. | ||||
| 51 Respiratory distress syndrome Show forest plot | 2 | 1129 | Risk Ratio (M‐H, Random, 95% CI) | 1.17 [0.54, 2.52] |
| Analysis 1.51  Comparison 1 Overall: omega‐3 versus no omega‐3, Outcome 51 Respiratory distress syndrome. | ||||
| 52 Necrotising enterocolitis (NEC) Show forest plot | 2 | 3198 | Risk Ratio (M‐H, Fixed, 95% CI) | 0.97 [0.26, 3.55] |
| Analysis 1.52  Comparison 1 Overall: omega‐3 versus no omega‐3, Outcome 52 Necrotising enterocolitis (NEC). | ||||
| 53 Neonatal sepsis (proven) Show forest plot | 3 | 3788 | Risk Ratio (M‐H, Fixed, 95% CI) | 0.97 [0.44, 2.14] |
| Analysis 1.53  Comparison 1 Overall: omega‐3 versus no omega‐3, Outcome 53 Neonatal sepsis (proven). | ||||
| 54 Convulsion Show forest plot | 1 | 2361 | Risk Ratio (M‐H, Fixed, 95% CI) | 0.09 [0.01, 1.63] |
| Analysis 1.54  Comparison 1 Overall: omega‐3 versus no omega‐3, Outcome 54 Convulsion. | ||||
| 55 Intraventricular haemorrhage Show forest plot | 3 | Risk Ratio (M‐H, Random, 95% CI) | Subtotals only | |
| Analysis 1.55  Comparison 1 Overall: omega‐3 versus no omega‐3, Outcome 55 Intraventricular haemorrhage. | ||||
| 55.1 Any | 3 | 5423 | Risk Ratio (M‐H, Random, 95% CI) | 1.00 [0.29, 3.49] |
| 55.2 Grade 3 or 4 | 1 | 837 | Risk Ratio (M‐H, Random, 95% CI) | 1.60 [0.38, 6.65] |
| 56 Neonatal/infant adverse events Show forest plot | 3 | Risk Ratio (M‐H, Fixed, 95% CI) | Subtotals only | |
| Analysis 1.56  Comparison 1 Overall: omega‐3 versus no omega‐3, Outcome 56 Neonatal/infant adverse events. | ||||
| 56.1 Any adverse event | 2 | 592 | Risk Ratio (M‐H, Fixed, 95% CI) | 0.92 [0.82, 1.02] |
| 56.2 Serious adverse events | 2 | 2690 | Risk Ratio (M‐H, Fixed, 95% CI) | 0.72 [0.53, 0.99] |
| 57 Neonatal/infant morbidity: cardiovascular Show forest plot | 1 | Risk Ratio (M‐H, Fixed, 95% CI) | Subtotals only | |
| Analysis 1.57  Comparison 1 Overall: omega‐3 versus no omega‐3, Outcome 57 Neonatal/infant morbidity: cardiovascular. | ||||
| 58 Neonatal/infant morbidity: respiratory Show forest plot | 1 | 291 | Risk Ratio (M‐H, Fixed, 95% CI) | 1.02 [0.66, 1.57] |
| Analysis 1.58  Comparison 1 Overall: omega‐3 versus no omega‐3, Outcome 58 Neonatal/infant morbidity: respiratory. | ||||
| 59 Neonatal/infant morbidity: due to pregnancy/birth events Show forest plot | 1 | 291 | Risk Ratio (M‐H, Fixed, 95% CI) | 1.02 [0.67, 1.55] |
| Analysis 1.59  Comparison 1 Overall: omega‐3 versus no omega‐3, Outcome 59 Neonatal/infant morbidity: due to pregnancy/birth events. | ||||
| 60 Neonatal/infant morbidity: other Show forest plot | 1 | Risk Ratio (M‐H, Fixed, 95% CI) | Subtotals only | |
| Analysis 1.60  Comparison 1 Overall: omega‐3 versus no omega‐3, Outcome 60 Neonatal/infant morbidity: other. | ||||
| 60.1 Colds in past 15 days: at 1 month of age | 1 | 849 | Risk Ratio (M‐H, Fixed, 95% CI) | 0.85 [0.72, 1.00] |
| 60.2 Colds in past 15 days: at 3 months of age | 1 | 834 | Risk Ratio (M‐H, Fixed, 95% CI) | 0.86 [0.73, 1.01] |
| 60.3 Colds in past 15 days: at 6 months of age | 1 | 834 | Risk Ratio (M‐H, Fixed, 95% CI) | 0.99 [0.86, 1.15] |
| 60.4 Fever in past 15 days: at 1 month of age | 1 | 849 | Risk Ratio (M‐H, Fixed, 95% CI) | 1.08 [0.53, 2.22] |
| 60.5 Fever in past 15 days: at 3 months of age | 1 | 834 | Risk Ratio (M‐H, Fixed, 95% CI) | 0.80 [0.53, 1.23] |
| 60.6 Fever in past 15 days: at 6 months of age | 1 | 834 | Risk Ratio (M‐H, Fixed, 95% CI) | 0.99 [0.74, 1.31] |
| 60.7 Rash in past 15 days: at 1 month of age | 1 | 849 | Risk Ratio (M‐H, Fixed, 95% CI) | 1.11 [0.89, 1.38] |
| 60.8 Rash in past 15 days: at 3 months of age | 1 | 834 | Risk Ratio (M‐H, Fixed, 95% CI) | 0.82 [0.54, 1.26] |
| 60.9 Rash in past 15 days: at 6 months of age | 1 | 834 | Risk Ratio (M‐H, Fixed, 95% CI) | 1.14 [0.76, 1.71] |
| 60.10 Vomiting in past 15 days: at 1 month of age | 1 | 849 | Risk Ratio (M‐H, Fixed, 95% CI) | 1.55 [0.82, 2.93] |
| 60.11 Vomiting in past 15 days: at 3 months of age | 1 | 834 | Risk Ratio (M‐H, Fixed, 95% CI) | 1.43 [0.69, 2.96] |
| 60.12 Vomiting in past 15 days: at 6 months of age | 1 | 834 | Risk Ratio (M‐H, Fixed, 95% CI) | 1.33 [0.72, 2.46] |
| 60.13 Diarrhoea in past 15 days: at 1 month of age | 1 | 849 | Risk Ratio (M‐H, Fixed, 95% CI) | 0.83 [0.42, 1.67] |
| 60.14 Diarrhoea in past 15 days: at 3 months of age | 1 | 834 | Risk Ratio (M‐H, Fixed, 95% CI) | 0.83 [0.46, 1.51] |
| 60.15 Diarrhoea in past 15 days: at 6 months of age | 1 | 834 | Risk Ratio (M‐H, Fixed, 95% CI) | 1.02 [0.63, 1.64] |
| 60.16 Other illness in the past 15 days: at 1 month | 1 | 849 | Risk Ratio (M‐H, Fixed, 95% CI) | 1.40 [0.81, 2.41] |
| 60.17 Other illness in the past 15 days: at 3 months | 1 | 834 | Risk Ratio (M‐H, Fixed, 95% CI) | 0.96 [0.54, 1.73] |
| 60.18 Other illness in the past 15 days: at 6 months | 1 | 834 | Risk Ratio (M‐H, Fixed, 95% CI) | 1.15 [0.68, 1.95] |
| 61 Infant/child morbidity Show forest plot | 1 | Risk Ratio (M‐H, Fixed, 95% CI) | Subtotals only | |
| Analysis 1.61  Comparison 1 Overall: omega‐3 versus no omega‐3, Outcome 61 Infant/child morbidity. | ||||
| 61.1 ICU admissions | 1 | 1396 | Risk Ratio (M‐H, Fixed, 95% CI) | 0.58 [0.31, 1.06] |
| 61.2 Medical diagnosis of attention deficit hyperactivity disorder (ADHD) | 1 | 1526 | Risk Ratio (M‐H, Fixed, 95% CI) | 2.96 [0.31, 28.40] |
| 61.3 Medical diagnosis of autism spectrum disorder | 1 | 1526 | Risk Ratio (M‐H, Fixed, 95% CI) | 1.15 [0.54, 2.47] |
| 61.4 Medical diagnosis of other learning/behavioural disorders | 1 | 1526 | Risk Ratio (M‐H, Fixed, 95% CI) | 1.12 [0.78, 1.60] |
| 61.5 Medical diagnosis of other chronic health conditions | 1 | 1526 | Risk Ratio (M‐H, Fixed, 95% CI) | 0.97 [0.65, 1.44] |
| 62 Ponderal index Show forest plot | 6 | 887 | Mean Difference (IV, Random, 95% CI) | 0.05 [‐0.01, 0.11] |
| Analysis 1.62  Comparison 1 Overall: omega‐3 versus no omega‐3, Outcome 62 Ponderal index. | ||||
| 63 Infant/child weight (kg) Show forest plot | 11 | Mean Difference (IV, Random, 95% CI) | Subtotals only | |
| Analysis 1.63  Comparison 1 Overall: omega‐3 versus no omega‐3, Outcome 63 Infant/child weight (kg). | ||||
| 63.1 At < 3 months | 2 | 863 | Mean Difference (IV, Random, 95% CI) | 0.01 [‐0.07, 0.09] |
| 63.2 At 3 to < 12 months | 4 | 1028 | Mean Difference (IV, Random, 95% CI) | 0.01 [‐0.18, 0.20] |
| 63.3 At 1 to < 2 years | 4 | 1084 | Mean Difference (IV, Random, 95% CI) | 0.01 [‐0.19, 0.21] |
| 63.4 At 2 to < 3 years | 2 | 182 | Mean Difference (IV, Random, 95% CI) | 0.24 [‐0.20, 0.68] |
| 63.5 At 3 to < 4 years | 2 | 1651 | Mean Difference (IV, Random, 95% CI) | 0.18 [‐0.20, 0.57] |
| 63.6 At 4 to < 5 years | 2 | 631 | Mean Difference (IV, Random, 95% CI) | 0.38 [‐0.29, 1.05] |
| 63.7 At 5 to < 6 years | 4 | 2618 | Mean Difference (IV, Random, 95% CI) | 0.23 [‐0.18, 0.63] |
| 63.8 At ≥ 6 years | 3 | 508 | Mean Difference (IV, Random, 95% CI) | ‐0.08 [‐0.79, 0.64] |
| 64 Infant/child length/height (cm) Show forest plot | 11 | Mean Difference (IV, Random, 95% CI) | Subtotals only | |
| Analysis 1.64  Comparison 1 Overall: omega‐3 versus no omega‐3, Outcome 64 Infant/child length/height (cm). | ||||
| 64.1 < 3 months | 2 | 861 | Mean Difference (IV, Random, 95% CI) | ‐0.01 [‐0.69, 0.66] |
| 64.2 3 to < 12 months | 4 | 1115 | Mean Difference (IV, Random, 95% CI) | 0.11 [‐0.20, 0.42] |
| 64.3 1 to < 2 years | 4 | 998 | Mean Difference (IV, Random, 95% CI) | 0.01 [‐0.45, 0.48] |
| 64.4 2 to < 3 years | 2 | 182 | Mean Difference (IV, Random, 95% CI) | 0.18 [‐0.73, 1.08] |
| 64.5 3 to < 4 years | 2 | 1651 | Mean Difference (IV, Random, 95% CI) | 0.18 [‐0.21, 0.58] |
| 64.6 4 to < 5 years | 2 | 631 | Mean Difference (IV, Random, 95% CI) | 0.30 [‐0.36, 0.95] |
| 64.7 5 to < 6 years | 5 | 2733 | Mean Difference (IV, Random, 95% CI) | 0.20 [‐0.17, 0.57] |
| 64.8 At ≥ 6 years | 2 | 393 | Mean Difference (IV, Random, 95% CI) | ‐1.22 [‐2.29, ‐0.16] |
| 65 Infant/child head circumference (cm) Show forest plot | 10 | Mean Difference (IV, Random, 95% CI) | Subtotals only | |
| Analysis 1.65  Comparison 1 Overall: omega‐3 versus no omega‐3, Outcome 65 Infant/child head circumference (cm). | ||||
| 65.1 At < 3 months | 2 | 863 | Mean Difference (IV, Random, 95% CI) | ‐0.04 [‐0.22, 0.14] |
| 65.2 At 3 to < 12 months | 5 | 1309 | Mean Difference (IV, Random, 95% CI) | ‐0.03 [‐0.19, 0.12] |
| 65.3 At 1 to < 2 years | 4 | 1084 | Mean Difference (IV, Random, 95% CI) | 0.06 [‐0.18, 0.30] |
| 65.4 At 2 to < 3 years | 2 | 182 | Mean Difference (IV, Random, 95% CI) | ‐0.04 [‐0.47, 0.40] |
| 65.5 At 3 to < 4 years | 2 | 1651 | Mean Difference (IV, Random, 95% CI) | ‐0.01 [‐0.16, 0.14] |
| 65.6 At 4 to < 5 years | 1 | 107 | Mean Difference (IV, Random, 95% CI) | 0.0 [‐0.47, 0.47] |
| 65.7 At ≥ 5 years | 3 | 1760 | Mean Difference (IV, Random, 95% CI) | 0.02 [‐0.13, 0.17] |
| 66 Infant/child length/height for age Z score (LAZ/HAZ) Show forest plot | 3 | Mean Difference (IV, Random, 95% CI) | Subtotals only | |
| Analysis 1.66  Comparison 1 Overall: omega‐3 versus no omega‐3, Outcome 66 Infant/child length/height for age Z score (LAZ/HAZ). | ||||
| 66.1 At < 3 months | 2 | 875 | Mean Difference (IV, Random, 95% CI) | ‐0.13 [‐0.27, 0.02] |
| 66.2 At 3 to < 12 months | 3 | 1085 | Mean Difference (IV, Random, 95% CI) | ‐0.05 [‐0.19, 0.09] |
| 66.3 At 12 to < 24 months | 2 | 897 | Mean Difference (IV, Random, 95% CI) | ‐0.06 [‐0.31, 0.18] |
| 66.4 At 4 to < 5 years | 1 | 524 | Mean Difference (IV, Random, 95% CI) | 0.0 [‐0.15, 0.15] |
| 66.5 At ≥ 5 years | 1 | 802 | Mean Difference (IV, Random, 95% CI) | 0.0 [‐0.12, 0.12] |
| 67 Infant/child waist circumference (cm) Show forest plot | 2 | Mean Difference (IV, Fixed, 95% CI) | Subtotals only | |
| Analysis 1.67  Comparison 1 Overall: omega‐3 versus no omega‐3, Outcome 67 Infant/child waist circumference (cm). | ||||
| 67.1 At 2 to < 3 years | 1 | 101 | Mean Difference (IV, Fixed, 95% CI) | ‐0.20 [‐1.29, 0.89] |
| 67.2 At 3 to < 4 years | 2 | 1651 | Mean Difference (IV, Fixed, 95% CI) | 0.28 [‐0.05, 0.60] |
| 67.3 At 4 to < 5 years | 1 | 106 | Mean Difference (IV, Fixed, 95% CI) | 0.70 [‐0.40, 1.80] |
| 67.4 At ≥ 5 years | 2 | 1645 | Mean Difference (IV, Fixed, 95% CI) | 0.15 [‐0.24, 0.55] |
| 68 Infant/child weight‐for‐age Z score (WAZ) Show forest plot | 2 | Mean Difference (IV, Random, 95% CI) | Subtotals only | |
| Analysis 1.68  Comparison 1 Overall: omega‐3 versus no omega‐3, Outcome 68 Infant/child weight‐for‐age Z score (WAZ). | ||||
| 68.1 At < 3 months | 2 | 874 | Mean Difference (IV, Random, 95% CI) | ‐0.09 [‐0.30, 0.12] |
| 68.2 At 3 to < 12 months | 2 | 834 | Mean Difference (IV, Random, 95% CI) | ‐0.05 [‐0.18, 0.08] |
| 68.3 At 12 to < 24 months | 2 | 883 | Mean Difference (IV, Random, 95% CI) | ‐0.01 [‐0.13, 0.12] |
| 68.4 At ≥ 60 months | 1 | 802 | Mean Difference (IV, Random, 95% CI) | ‐0.1 [‐0.25, 0.05] |
| 69 Infant/child BMI Z score Show forest plot | 5 | Mean Difference (IV, Random, 95% CI) | Subtotals only | |
| Analysis 1.69  Comparison 1 Overall: omega‐3 versus no omega‐3, Outcome 69 Infant/child BMI Z score. | ||||
| 69.1 At 1 to < 2 years | 2 | 801 | Mean Difference (IV, Random, 95% CI) | ‐0.05 [‐0.09, 0.00] |
| 69.2 At 2 to < 3 years | 1 | 63 | Mean Difference (IV, Random, 95% CI) | ‐0.07 [‐0.25, 0.11] |
| 69.3 At 3 to < 4 years | 1 | 1531 | Mean Difference (IV, Random, 95% CI) | 0.02 [‐0.08, 0.12] |
| 69.4 At 4 to < 5 years | 2 | 587 | Mean Difference (IV, Random, 95% CI) | 0.15 [‐0.16, 0.47] |
| 69.5 At 5 to < 6 years | 3 | 2504 | Mean Difference (IV, Random, 95% CI) | 0.03 [‐0.05, 0.11] |
| 69.6 At 6 to < 7 years | 1 | 115 | Mean Difference (IV, Random, 95% CI) | 0.01 [‐0.02, 0.05] |
| 69.7 At ≥ 7 years | 1 | 250 | Mean Difference (IV, Random, 95% CI) | 0.18 [‐0.10, 0.46] |
| 70 Infant/child weight for length/height Z score (WHZ) Show forest plot | 3 | Mean Difference (IV, Random, 95% CI) | Subtotals only | |
| Analysis 1.70  Comparison 1 Overall: omega‐3 versus no omega‐3, Outcome 70 Infant/child weight for length/height Z score (WHZ). | ||||
| 70.1 At < 3 months | 2 | 860 | Mean Difference (IV, Random, 95% CI) | ‐0.03 [‐0.41, 0.34] |
| 70.2 At 3 to < 12 months | 3 | 1083 | Mean Difference (IV, Random, 95% CI) | ‐0.00 [‐0.14, 0.14] |
| 70.3 At 12 to < 24 months | 2 | 883 | Mean Difference (IV, Random, 95% CI) | ‐0.02 [‐0.14, 0.10] |
| 71 Infant/child BMI percentile Show forest plot | 1 | Mean Difference (IV, Fixed, 95% CI) | Subtotals only | |
| Analysis 1.71  Comparison 1 Overall: omega‐3 versus no omega‐3, Outcome 71 Infant/child BMI percentile. | ||||
| 71.1 At 24 months | 1 | 118 | Mean Difference (IV, Fixed, 95% CI) | 4.5 [‐5.50, 14.50] |
| 71.2 At 36 months | 1 | 120 | Mean Difference (IV, Fixed, 95% CI) | 8.0 [‐1.09, 17.09] |
| 71.3 At 48 months | 1 | 107 | Mean Difference (IV, Fixed, 95% CI) | 13.0 [3.19, 22.81] |
| 71.4 At 60 months | 1 | 114 | Mean Difference (IV, Fixed, 95% CI) | 4.80 [‐4.70, 14.30] |
| 72 Child/adult BMI Show forest plot | 3 | Mean Difference (IV, Fixed, 95% CI) | Subtotals only | |
| Analysis 1.72  Comparison 1 Overall: omega‐3 versus no omega‐3, Outcome 72 Child/adult BMI. | ||||
| 72.1 At 3 to 4 years | 1 | 1531 | Mean Difference (IV, Fixed, 95% CI) | 0.01 [‐0.14, 0.16] |
| 72.2 At 5 to 6 years | 1 | 1531 | Mean Difference (IV, Fixed, 95% CI) | ‐0.01 [‐0.18, 0.16] |
| 72.3 At 7 to 9 years | 2 | 393 | Mean Difference (IV, Fixed, 95% CI) | 0.16 [‐0.25, 0.57] |
| 72.4 At 19 years | 1 | 243 | Mean Difference (IV, Fixed, 95% CI) | 0.0 [‐0.83, 0.83] |
| 73 Infant/child body fat (%) Show forest plot | 3 | Mean Difference (IV, Fixed, 95% CI) | Subtotals only | |
| Analysis 1.73  Comparison 1 Overall: omega‐3 versus no omega‐3, Outcome 73 Infant/child body fat (%). | ||||
| 73.1 At 1 year | 1 | 165 | Mean Difference (IV, Fixed, 95% CI) | 0.0 [‐0.88, 0.88] |
| 73.2 At 2 to < 3 years | 1 | 110 | Mean Difference (IV, Fixed, 95% CI) | 0.20 [‐0.68, 1.08] |
| 73.3 At 3 to < 4 years | 2 | 1644 | Mean Difference (IV, Fixed, 95% CI) | ‐0.18 [‐0.74, 0.38] |
| 73.4 At 4 to < 5 years | 1 | 102 | Mean Difference (IV, Fixed, 95% CI) | 0.30 [‐0.79, 1.39] |
| 73.5 At 5 to < 6 years | 3 | 1797 | Mean Difference (IV, Fixed, 95% CI) | 0.01 [‐0.56, 0.58] |
| 73.6 At ≥ 7 years: BIS | 1 | 250 | Mean Difference (IV, Fixed, 95% CI) | 1.44 [‐0.31, 3.19] |
| 73.7 At ≥ 7 years: BOD POD | 1 | 250 | Mean Difference (IV, Fixed, 95% CI) | ‐0.42 [‐2.23, 1.39] |
| 74 Infant/child total fat mass (kg) Show forest plot | 3 | Mean Difference (IV, Fixed, 95% CI) | Subtotals only | |
| Analysis 1.74  Comparison 1 Overall: omega‐3 versus no omega‐3, Outcome 74 Infant/child total fat mass (kg). | ||||
| 74.1 At 1 year | 1 | 164 | Mean Difference (IV, Fixed, 95% CI) | 0.0 [‐0.07, 0.07] |
| 74.2 At 2 to < 3 years | 1 | 110 | Mean Difference (IV, Fixed, 95% CI) | 0.10 [‐0.09, 0.29] |
| 74.3 At 3 to < 4 years | 2 | 1644 | Mean Difference (IV, Fixed, 95% CI) | ‐0.01 [‐0.12, 0.10] |
| 74.4 At 4 to < 5 years | 1 | 102 | Mean Difference (IV, Fixed, 95% CI) | 0.20 [‐0.05, 0.45] |
| 74.5 At 5 to < 6 years | 3 | 1797 | Mean Difference (IV, Fixed, 95% CI) | 0.05 [‐0.10, 0.21] |
| 74.6 Up to 8 years: BOD POD | 1 | 250 | Mean Difference (IV, Fixed, 95% CI) | 0.08 [‐0.71, 0.87] |
| 74.7 Up to 8 years: BIS | 1 | 250 | Mean Difference (IV, Fixed, 95% CI) | 0.29 [‐0.47, 1.05] |
| 75 Cognition: thresholds Show forest plot | 3 | Risk Ratio (M‐H, Fixed, 95% CI) | Subtotals only | |
| Analysis 1.75  Comparison 1 Overall: omega‐3 versus no omega‐3, Outcome 75 Cognition: thresholds. | ||||
| 75.1 BSID III < 85 at 18 months | 1 | 726 | Risk Ratio (M‐H, Fixed, 95% CI) | 0.49 [0.24, 0.98] |
| 75.2 BSID III > 115 at 18 months | 1 | 726 | Risk Ratio (M‐H, Fixed, 95% CI) | 0.84 [0.49, 1.44] |
| 75.3 BSID II < 85 at 18 months | 1 | 730 | Risk Ratio (M‐H, Fixed, 95% CI) | 1.43 [0.97, 2.12] |
| 75.4 BSID III cognitive score (highest quartile): at 18 months | 1 | 154 | Risk Ratio (M‐H, Fixed, 95% CI) | 0.90 [0.49, 1.65] |
| 76 Cognition: scores Show forest plot | 10 | Mean Difference (IV, Fixed, 95% CI) | Subtotals only | |
| Analysis 1.76  Comparison 1 Overall: omega‐3 versus no omega‐3, Outcome 76 Cognition: scores. | ||||
| 76.1 BSID II score < 24 months | 4 | 1154 | Mean Difference (IV, Fixed, 95% CI) | ‐0.37 [‐1.49, 0.76] |
| 76.2 BSID III score < 24 months | 2 | 809 | Mean Difference (IV, Fixed, 95% CI) | 0.04 [‐1.59, 1.68] |
| 76.3 Fagan novelty preference < 24 months | 2 | 274 | Mean Difference (IV, Fixed, 95% CI) | ‐0.79 [‐1.68, 0.11] |
| 76.4 K‐ABC mental processing composite at 2 to 5 years | 1 | 84 | Mean Difference (IV, Fixed, 95% CI) | 4.10 [‐0.14, 8.34] |
| 76.5 K‐ABC sequential processing at 5 to 6 years | 1 | 96 | Mean Difference (IV, Fixed, 95% CI) | 0.0 [‐1.80, 1.80] |
| 76.6 GMDS general quotient score at 2 to 5 years | 1 | 72 | Mean Difference (IV, Fixed, 95% CI) | 3.70 [‐1.02, 8.42] |
| 76.7 DAS II: General Conceptual Ability Scale at 2 to 5 years | 1 | 646 | Mean Difference (IV, Fixed, 95% CI) | 0.13 [‐1.53, 1.79] |
| 76.8 DAS II: Non‐verbal Reasoning Scale at 2 to 5 years | 1 | 646 | Mean Difference (IV, Fixed, 95% CI) | ‐0.35 [‐2.04, 1.34] |
| 76.9 DAS II: Verbal Scale at 2 to 5 years | 1 | 646 | Mean Difference (IV, Fixed, 95% CI) | ‐0.35 [‐1.74, 1.04] |
| 76.10 DAS II: Spatial Scale at 2 to 5 years | 1 | 646 | Mean Difference (IV, Fixed, 95% CI) | 0.96 [‐0.77, 2.69] |
| 76.11 MCDS: scale index general cognitive at 5 years | 1 | 797 | Mean Difference (IV, Fixed, 95% CI) | ‐0.5 [‐2.35, 1.35] |
| 76.12 WASI full‐scale IQ at 6 to 9 years | 1 | 543 | Mean Difference (IV, Fixed, 95% CI) | 1.0 [‐0.79, 2.79] |
| 76.13 WISC‐IV full scale IQ at > 12 years | 1 | 50 | Mean Difference (IV, Fixed, 95% CI) | 1.0 [‐5.16, 7.16] |
| 77 Attention: scores Show forest plot | 3 | Mean Difference (IV, Fixed, 95% CI) | Subtotals only | |
| Analysis 1.77  Comparison 1 Overall: omega‐3 versus no omega‐3, Outcome 77 Attention: scores. | ||||
| 77.1 K‐CPT omissions at 5 years | 1 | 797 | Mean Difference (IV, Fixed, 95% CI) | ‐1.90 [‐3.39, ‐0.41] |
| 77.2 K‐CPT commissions at 5 years | 1 | 797 | Mean Difference (IV, Fixed, 95% CI) | 0.10 [‐1.37, 1.57] |
| 77.3 K‐CPT hit response time at 5 years | 1 | 797 | Mean Difference (IV, Fixed, 95% CI) | ‐0.60 [‐2.06, 0.86] |
| 77.4 Attention: single‐object task: total time looking at toy(s) at 2 to 5 years | 1 | 150 | Mean Difference (IV, Fixed, 95% CI) | ‐7.80 [‐22.59, 6.99] |
| 77.5 Attention: multiple‐object task; # times shifted looks between toys at 2 to 5 years | 1 | 150 | Mean Difference (IV, Fixed, 95% CI) | ‐0.40 [‐4.28, 3.48] |
| 77.6 Attention: distractibility: av latency to look when attention focused (s) at 2 to 5 years | 1 | 150 | Mean Difference (IV, Fixed, 95% CI) | ‐0.30 [‐0.86, 0.26] |
| 77.7 Attention: global speed (ms) at 8.5 years | 1 | 130 | Mean Difference (IV, Fixed, 95% CI) | ‐5.5 [‐47.16, 36.16] |
| 77.8 Attention: interference (ms) at 8.5 years | 1 | 130 | Mean Difference (IV, Fixed, 95% CI) | 6.97 [‐16.42, 30.36] |
| 77.9 Attention: orienting (ms) at 8.5 years | 1 | 130 | Mean Difference (IV, Fixed, 95% CI) | 3.99 [‐16.90, 24.88] |
| 77.10 Attention: alertness (ms) at 8.5 years | 1 | 130 | Mean Difference (IV, Fixed, 95% CI) | ‐5.69 [‐27.88, 16.50] |
| 78 Motor: thresholds Show forest plot | 2 | Risk Ratio (M‐H, Fixed, 95% CI) | Subtotals only | |
| Analysis 1.78  Comparison 1 Overall: omega‐3 versus no omega‐3, Outcome 78 Motor: thresholds. | ||||
| 78.1 BSID II score < 85 at 18 months | 1 | 730 | Risk Ratio (M‐H, Fixed, 95% CI) | 0.88 [0.65, 1.19] |
| 78.2 Fine motor (highest quartile): at 18 months | 1 | 154 | Risk Ratio (M‐H, Fixed, 95% CI) | 1.19 [0.71, 1.99] |
| 78.3 Gross motor (highest quartile): at 18 months | 1 | 154 | Risk Ratio (M‐H, Fixed, 95% CI) | 1.13 [0.68, 1.88] |
| 79 Motor: scores Show forest plot | 6 | Mean Difference (IV, Fixed, 95% CI) | Subtotals only | |
| Analysis 1.79  Comparison 1 Overall: omega‐3 versus no omega‐3, Outcome 79 Motor: scores. | ||||
| 79.1 BSID II at < 24 months | 4 | 1153 | Mean Difference (IV, Fixed, 95% CI) | 0.23 [‐0.90, 1.36] |
| 79.2 BSID III at < 24 months | 1 | 726 | Mean Difference (IV, Fixed, 95% CI) | 0.06 [‐1.52, 1.64] |
| 79.3 BSID III fine motor score at < 24 months | 1 | 49 | Mean Difference (IV, Fixed, 95% CI) | 0.05 [‐1.20, 1.30] |
| 79.4 BSID III gross motor score at < 24 months | 1 | 49 | Mean Difference (IV, Fixed, 95% CI) | 0.05 [‐0.68, 0.78] |
| 80 Language: thresholds Show forest plot | 2 | Risk Ratio (M‐H, Fixed, 95% CI) | Subtotals only | |
| Analysis 1.80  Comparison 1 Overall: omega‐3 versus no omega‐3, Outcome 80 Language: thresholds. | ||||
| 80.1 BSID III < 85 | 1 | 726 | Risk Ratio (M‐H, Fixed, 95% CI) | 1.02 [0.74, 1.40] |
| 80.2 BSID III > 115 | 1 | 726 | Risk Ratio (M‐H, Fixed, 95% CI) | 0.82 [0.52, 1.29] |
| 80.3 Receptive language (highest quartile) | 1 | 154 | Risk Ratio (M‐H, Fixed, 95% CI) | 1.82 [1.07, 3.10] |
| 80.4 Expressive language (highest quartile) | 1 | 154 | Risk Ratio (M‐H, Fixed, 95% CI) | 1.65 [1.02, 2.68] |
| 80.5 Infant CDI: words understood (highest quartile) | 1 | 159 | Risk Ratio (M‐H, Fixed, 95% CI) | 2.42 [1.33, 4.42] |
| 80.6 Infant CDI: words produced (highest quartile) | 1 | 159 | Risk Ratio (M‐H, Fixed, 95% CI) | 2.08 [1.15, 3.74] |
| 80.7 Infant CDI: words understood (highest quartile) | 1 | 134 | Risk Ratio (M‐H, Fixed, 95% CI) | 1.97 [1.11, 3.48] |
| 80.8 Infant CDI: words produced (highest quartile) | 1 | 134 | Risk Ratio (M‐H, Fixed, 95% CI) | 1.97 [1.11, 3.48] |
| 80.9 Toddler CDI: words produced (highest quartile) | 1 | 134 | Risk Ratio (M‐H, Fixed, 95% CI) | 2.09 [1.12, 3.90] |
| 80.10 Non‐native constant contrast discrimination | 1 | 144 | Risk Ratio (M‐H, Fixed, 95% CI) | 0.97 [0.68, 1.40] |
| 81 Language: scores Show forest plot | 5 | Mean Difference (IV, Fixed, 95% CI) | Subtotals only | |
| Analysis 1.81  Comparison 1 Overall: omega‐3 versus no omega‐3, Outcome 81 Language: scores. | ||||
| 81.1 Receptive communication at < 24 months | 1 | 49 | Mean Difference (IV, Fixed, 95% CI) | 0.55 [‐0.77, 1.87] |
| 81.2 Receptive language (Peabody Picture Vocabulary Test IIIA) at 2 to 5 years | 1 | 70 | Mean Difference (IV, Fixed, 95% CI) | 3.90 [‐0.73, 8.53] |
| 81.3 Expressive communication at < 24 months | 1 | 49 | Mean Difference (IV, Fixed, 95% CI) | 0.21 [‐0.86, 1.28] |
| 81.4 BSID III at < 24 months | 2 | 809 | Mean Difference (IV, Fixed, 95% CI) | ‐0.84 [‐2.77, 1.09] |
| 81.5 CELF‐P2 Core Language Score at 2 to 5 years | 1 | 646 | Mean Difference (IV, Fixed, 95% CI) | ‐0.93 [‐2.92, 1.06] |
| 81.6 CELF‐P2 Core Language Score at 6 to 9 years | 1 | 543 | Mean Difference (IV, Fixed, 95% CI) | ‐0.21 [‐2.51, 2.09] |
| 81.7 Peabody Picture Vocabulary Test | 1 | 97 | Mean Difference (IV, Fixed, 95% CI) | 4.0 [‐3.11, 11.11] |
| 82 Behaviour: thresholds Show forest plot | 1 | Risk Ratio (M‐H, Fixed, 95% CI) | Subtotals only | |
| Analysis 1.82  Comparison 1 Overall: omega‐3 versus no omega‐3, Outcome 82 Behaviour: thresholds. | ||||
| 82.1 Behaviour Rating Scale scores < 26: at < 24 months | 1 | 730 | Risk Ratio (M‐H, Fixed, 95% CI) | 5.0 [0.24, 103.79] |
| 83 Behaviour: scores Show forest plot | 6 | Mean Difference (IV, Fixed, 95% CI) | Subtotals only | |
| Analysis 1.83  Comparison 1 Overall: omega‐3 versus no omega‐3, Outcome 83 Behaviour: scores. | ||||
| 83.1 NBAS habituation | 1 | 27 | Mean Difference (IV, Fixed, 95% CI) | ‐1.45 [‐8.49, 5.59] |
| 83.2 NBAS orienting | 1 | 27 | Mean Difference (IV, Fixed, 95% CI) | 3.65 [‐9.09, 16.39] |
| 83.3 NBAS motor | 1 | 27 | Mean Difference (IV, Fixed, 95% CI) | 2.99 [‐8.23, 14.21] |
| 83.4 NBAS state organisation | 1 | 27 | Mean Difference (IV, Fixed, 95% CI) | 1.63 [‐7.21, 10.47] |
| 83.5 NBAS state regulation | 1 | 27 | Mean Difference (IV, Fixed, 95% CI) | 0.51 [‐14.70, 15.72] |
| 83.6 NBAS autonomic | 1 | 27 | Mean Difference (IV, Fixed, 95% CI) | 3.30 [‐8.75, 15.35] |
| 83.7 NBAS reflexes | 1 | 27 | Mean Difference (IV, Fixed, 95% CI) | 0.68 [‐10.28, 11.64] |
| 83.8 BehavioUr Rating Scale score 12 to < 24 months | 1 | 730 | Mean Difference (IV, Fixed, 95% CI) | 0.0 [‐0.94, 0.94] |
| 83.9 Wolke: approach at < 12 months | 1 | 249 | Mean Difference (IV, Fixed, 95% CI) | ‐0.10 [‐0.42, 0.22] |
| 83.10 Wolke: activity at < 12 months | 1 | 249 | Mean Difference (IV, Fixed, 95% CI) | ‐0.10 [‐0.45, 0.25] |
| 83.11 Wolke: co‐operation at < 12 months | 1 | 249 | Mean Difference (IV, Fixed, 95% CI) | 0.0 [‐0.39, 0.39] |
| 83.12 Wolke: emotional tone at < 12 months | 1 | 249 | Mean Difference (IV, Fixed, 95% CI) | ‐0.10 [‐0.49, 0.29] |
| 83.13 Wolke: vocalisation at < 12 months | 1 | 249 | Mean Difference (IV, Fixed, 95% CI) | ‐0.10 [‐0.52, 0.32] |
| 83.14 BSID III social‐emotional score at < 24 months | 2 | 809 | Mean Difference (IV, Fixed, 95% CI) | ‐0.70 [‐3.04, 1.64] |
| 83.15 BSID III adaptive behaviour score at < 24 months | 2 | 809 | Mean Difference (IV, Fixed, 95% CI) | ‐1.20 [‐3.12, 0.72] |
| 83.16 SDQ Total Difficulties at 2 to 5 years | 1 | 646 | Mean Difference (IV, Fixed, 95% CI) | 0.62 [‐0.00, 1.24] |
| 83.17 SDQ Total Difficulties at 6 to 9 years | 1 | 543 | Mean Difference (IV, Fixed, 95% CI) | 1.08 [0.18, 1.98] |
| 83.18 BASC‐2: Behavioral Symptoms Index (%) at 5 years | 1 | 797 | Mean Difference (IV, Fixed, 95% CI) | ‐0.5 [‐4.54, 3.54] |
| 83.19 CBCL total problem behaviour at 2 ‐ 5 years | 1 | 72 | Mean Difference (IV, Fixed, 95% CI) | ‐1.0 [‐3.41, 1.41] |
| 83.20 CBCL parent report: total behaviours score at 12+ years | 1 | 48 | Mean Difference (IV, Fixed, 95% CI) | ‐0.80 [‐5.23, 3.63] |
| 83.21 CBCL parent report: total competence score at > 12 years | 1 | 48 | Mean Difference (IV, Fixed, 95% CI) | ‐0.20 [‐6.36, 5.96] |
| 84 Vision: visual acuity (cycles/degree) Show forest plot | 2 | Mean Difference (IV, Fixed, 95% CI) | Subtotals only | |
| Analysis 1.84  Comparison 1 Overall: omega‐3 versus no omega‐3, Outcome 84 Vision: visual acuity (cycles/degree). | ||||
| 84.1 At 2 months | 1 | 135 | Mean Difference (IV, Fixed, 95% CI) | 0.18 [‐0.01, 0.37] |
| 84.2 At 4 months | 1 | 30 | Mean Difference (IV, Fixed, 95% CI) | 0.5 [‐0.43, 1.43] |
| 84.3 At 6 months | 1 | 26 | Mean Difference (IV, Fixed, 95% CI) | 0.5 [‐0.48, 1.48] |
| 85 Vision: VEP acuity Show forest plot | 1 | Mean Difference (IV, Fixed, 95% CI) | Subtotals only | |
| Analysis 1.85  Comparison 1 Overall: omega‐3 versus no omega‐3, Outcome 85 Vision: VEP acuity. | ||||
| 85.1 Adjusted VEP acuity at 4 months (cpd) | 1 | 182 | Mean Difference (IV, Fixed, 95% CI) | ‐0.18 [‐0.75, 0.39] |
| 85.2 Unadjusted VEP acuity at 4 months (cpd) | 1 | 182 | Mean Difference (IV, Fixed, 95% CI) | ‐0.18 [‐0.76, 0.40] |
| 86 Vision: VEP latency Show forest plot | 3 | Mean Difference (IV, Fixed, 95% CI) | Subtotals only | |
| Analysis 1.86  Comparison 1 Overall: omega‐3 versus no omega‐3, Outcome 86 Vision: VEP latency. | ||||
| 86.1 Peak latency N1 at birth | 1 | 9 | Mean Difference (IV, Fixed, 95% CI) | ‐12.60 [‐29.40, 4.20] |
| 86.2 Peak latency P1 at birth | 1 | 14 | Mean Difference (IV, Fixed, 95% CI) | ‐6.80 [‐20.44, 6.84] |
| 86.3 Peak latency N2 at birth | 1 | 49 | Mean Difference (IV, Fixed, 95% CI) | 3.60 [‐12.39, 19.59] |
| 86.4 Peak latency P2 at birth | 1 | 55 | Mean Difference (IV, Fixed, 95% CI) | 0.10 [‐16.28, 16.48] |
| 86.5 Peak latency N3 at birth | 1 | 53 | Mean Difference (IV, Fixed, 95% CI) | ‐6.20 [‐36.15, 23.75] |
| 86.6 Latency N1 (ms) at 3 months | 1 | 679 | Mean Difference (IV, Fixed, 95% CI) | 0.30 [‐2.21, 2.81] |
| 86.7 Latency P1 (ms) at 3 months | 1 | 679 | Mean Difference (IV, Fixed, 95% CI) | ‐0.5 [‐3.19, 2.19] |
| 86.8 Latency N3 (ms) at 3 months | 1 | 679 | Mean Difference (IV, Fixed, 95% CI) | ‐2.30 [‐5.91, 1.31] |
| 86.9 Latency (69 min of arc) at 4 months (ms) | 1 | 182 | Mean Difference (IV, Fixed, 95% CI) | ‐1.0 [‐3.47, 1.47] |
| 86.10 Latency (48 min of arc) at 4 months (ms) | 1 | 182 | Mean Difference (IV, Fixed, 95% CI) | 0.0 [‐3.20, 3.20] |
| 86.11 Latency (20 min of arc) at 4 months (ms) | 1 | 182 | Mean Difference (IV, Fixed, 95% CI) | 0.0 [‐4.22, 4.22] |
| 86.12 Latency N1 (ms) at 6 months | 1 | 817 | Mean Difference (IV, Fixed, 95% CI) | ‐1.40 [‐3.44, 0.64] |
| 86.13 Latency P1 (ms) at 6 months | 1 | 817 | Mean Difference (IV, Fixed, 95% CI) | ‐0.80 [‐2.78, 1.18] |
| 86.14 Latency N3 (ms) at 6 months | 1 | 817 | Mean Difference (IV, Fixed, 95% CI) | ‐0.70 [‐3.45, 2.05] |
| 87 Hearing: brainstem auditory‐evoked responses Show forest plot | 1 | Mean Difference (IV, Fixed, 95% CI) | Subtotals only | |
| Analysis 1.87  Comparison 1 Overall: omega‐3 versus no omega‐3, Outcome 87 Hearing: brainstem auditory‐evoked responses. | ||||
| 87.1 Latency 1 (ms) at 1 month | 1 | 749 | Mean Difference (IV, Fixed, 95% CI) | ‐0.01 [‐0.03, 0.01] |
| 87.2 Latency 3 (ms) at 1 month | 1 | 749 | Mean Difference (IV, Fixed, 95% CI) | ‐0.01 [‐0.06, 0.04] |
| 87.3 Latency 5 (ms) at 1 month | 1 | 749 | Mean Difference (IV, Fixed, 95% CI) | ‐0.03 [‐0.09, 0.03] |
| 87.4 Interpeak latency 1‐3 (ms) at 1 month | 1 | 749 | Mean Difference (IV, Fixed, 95% CI) | ‐0.01 [‐0.06, 0.04] |
| 87.5 Interpeak latency 3‐5 (ms) at 1 month | 1 | 749 | Mean Difference (IV, Fixed, 95% CI) | 0.0 [‐0.05, 0.05] |
| 87.6 Interpeak latency 1‐5 (ms) at 1 month | 1 | 749 | Mean Difference (IV, Fixed, 95% CI) | ‐0.02 [‐0.07, 0.03] |
| 87.7 Latency 1 (ms) at 3 months | 1 | 664 | Mean Difference (IV, Fixed, 95% CI) | 0.0 [‐0.02, 0.02] |
| 87.8 Latency 3 (ms) at 3 months | 1 | 664 | Mean Difference (IV, Fixed, 95% CI) | 0.01 [‐0.04, 0.06] |
| 87.9 Latency 5 (ms) at 3 months | 1 | 664 | Mean Difference (IV, Fixed, 95% CI) | ‐0.04 [‐0.10, 0.02] |
| 87.10 Interpeak latency 1‐3 (ms) at 3 months | 1 | 664 | Mean Difference (IV, Fixed, 95% CI) | 0.01 [‐0.03, 0.05] |
| 87.11 Interpeak latency 3‐5 (ms) at 3 months | 1 | 664 | Mean Difference (IV, Fixed, 95% CI) | ‐0.03 [‐0.08, 0.02] |
| 87.12 Interpeak latency 1‐5 (ms) at 3 months | 1 | 664 | Mean Difference (IV, Fixed, 95% CI) | ‐0.03 [‐0.09, 0.03] |
| 88 Neurodevelopment: thresholds Show forest plot | 3 | Risk Ratio (M‐H, Fixed, 95% CI) | Subtotals only | |
| Analysis 1.88  Comparison 1 Overall: omega‐3 versus no omega‐3, Outcome 88 Neurodevelopment: thresholds. | ||||
| 88.1 Hempel: simple minor neurological dysfunction at 18 months | 1 | 114 | Risk Ratio (M‐H, Fixed, 95% CI) | 1.11 [0.80, 1.53] |
| 88.2 Hempel: simple and complex minor neurological dysfunction at 4 years | 1 | 167 | Risk Ratio (M‐H, Fixed, 95% CI) | 1.09 [0.37, 3.23] |
| 88.3 Hempel: complex minor neurological dysfunction at 18 months | 1 | 114 | Risk Ratio (M‐H, Fixed, 95% CI) | 0.68 [0.24, 1.93] |
| 88.4 ASQ total at 6 months (subnormal ‐ below 2 SD less than mean scores) | 1 | 146 | Risk Ratio (M‐H, Fixed, 95% CI) | 0.54 [0.17, 1.77] |
| 88.5 Touwen: simple and complex minor neurological dysfunction at 5.5 years | 1 | 148 | Risk Ratio (M‐H, Fixed, 95% CI) | 1.00 [0.61, 1.63] |
| 88.6 Neonatal neurological classification: mildly/definitely abnormal at 2 weeks | 1 | 119 | Risk Ratio (M‐H, Fixed, 95% CI) | 0.87 [0.38, 1.97] |
| 88.7 General movements: mildly/definitely abnormal at 2 weeks | 1 | 119 | Risk Ratio (M‐H, Fixed, 95% CI) | 1.27 [0.75, 2.14] |
| 88.8 General movements: mildly/definitely abnormal at 12 weeks | 1 | 119 | Risk Ratio (M‐H, Fixed, 95% CI) | 1.54 [0.89, 2.65] |
| 89 Neurodevelopment: scores Show forest plot | 1 | Mean Difference (IV, Fixed, 95% CI) | Subtotals only | |
| Analysis 1.89  Comparison 1 Overall: omega‐3 versus no omega‐3, Outcome 89 Neurodevelopment: scores. | ||||
| 89.1 ASQ gross motor at 4 months | 1 | 148 | Mean Difference (IV, Fixed, 95% CI) | 0.30 [‐2.38, 2.98] |
| 89.2 ASQ gross motor at 6 months | 1 | 146 | Mean Difference (IV, Fixed, 95% CI) | 1.20 [‐2.31, 4.71] |
| 89.3 ASQ fine motor at 4 months | 1 | 148 | Mean Difference (IV, Fixed, 95% CI) | 1.10 [‐2.03, 4.23] |
| 89.4 ASQ fine motor at 6 months | 1 | 146 | Mean Difference (IV, Fixed, 95% CI) | 1.20 [‐1.59, 3.99] |
| 89.5 ASQ problem solving at 4 months | 1 | 148 | Mean Difference (IV, Fixed, 95% CI) | 1.60 [‐0.99, 4.19] |
| 89.6 ASQ problem solving at 6 months | 1 | 146 | Mean Difference (IV, Fixed, 95% CI) | 0.5 [‐1.95, 2.95] |
| 89.7 ASQ personal‐social at 4 months | 1 | 148 | Mean Difference (IV, Fixed, 95% CI) | 1.10 [‐1.64, 3.84] |
| 89.8 ASQ personal‐social at 6 months | 1 | 146 | Mean Difference (IV, Fixed, 95% CI) | 0.80 [‐2.61, 4.21] |
| 89.9 ASQ communication at 4 months | 1 | 148 | Mean Difference (IV, Fixed, 95% CI) | 2.70 [0.41, 4.99] |
| 89.10 ASQ communication at 6 months | 1 | 146 | Mean Difference (IV, Fixed, 95% CI) | 0.40 [‐1.55, 2.35] |
| 90 Child Development Inventory Show forest plot | 1 | Risk Ratio (M‐H, Fixed, 95% CI) | Subtotals only | |
| Analysis 1.90  Comparison 1 Overall: omega‐3 versus no omega‐3, Outcome 90 Child Development Inventory. | ||||
| 90.1 Social | 1 | 130 | Risk Ratio (M‐H, Fixed, 95% CI) | 0.0 [0.0, 0.0] |
| 90.2 Self help | 1 | 130 | Risk Ratio (M‐H, Fixed, 95% CI) | 0.29 [0.01, 6.90] |
| 90.3 Gross motor | 1 | 130 | Risk Ratio (M‐H, Fixed, 95% CI) | 4.30 [0.21, 87.76] |
| 90.4 Fine motor | 1 | 130 | Risk Ratio (M‐H, Fixed, 95% CI) | 4.30 [0.21, 87.76] |
| 90.5 Expressive language | 1 | 130 | Risk Ratio (M‐H, Fixed, 95% CI) | 0.86 [0.05, 13.41] |
| 90.6 Language comprehension | 1 | 130 | Risk Ratio (M‐H, Fixed, 95% CI) | 0.0 [0.0, 0.0] |
| 90.7 Letters | 1 | 130 | Risk Ratio (M‐H, Fixed, 95% CI) | 0.17 [0.01, 3.51] |
| 90.8 Numbers | 1 | 130 | Risk Ratio (M‐H, Fixed, 95% CI) | 0.86 [0.05, 13.41] |
| 90.9 General development | 1 | 130 | Risk Ratio (M‐H, Fixed, 95% CI) | 0.51 [0.13, 2.06] |
| 91 Infant sleep behaviour (%) Show forest plot | 1 | Mean Difference (IV, Fixed, 95% CI) | Subtotals only | |
| Analysis 1.91  Comparison 1 Overall: omega‐3 versus no omega‐3, Outcome 91 Infant sleep behaviour (%). | ||||
| 91.1 Arousals in quiet sleep: day 1 | 1 | 46 | Mean Difference (IV, Fixed, 95% CI) | ‐3.19 [‐6.07, ‐0.31] |
| 91.2 Arousals in quiet sleep: day 2 | 1 | 39 | Mean Difference (IV, Fixed, 95% CI) | ‐1.89 [‐4.49, 0.71] |
| 91.3 Quiet sleep: day 1 | 1 | 46 | Mean Difference (IV, Fixed, 95% CI) | 0.74 [‐1.97, 3.45] |
| 91.4 Quiet sleep: day 2 | 1 | 39 | Mean Difference (IV, Fixed, 95% CI) | ‐1.0 [‐4.36, 2.36] |
| 91.5 Active sleep: day 1 | 1 | 46 | Mean Difference (IV, Fixed, 95% CI) | ‐2.42 [‐8.51, 3.67] |
| 91.6 Active sleep: day 2 | 1 | 39 | Mean Difference (IV, Fixed, 95% CI) | ‐0.13 [‐8.23, 7.97] |
| 91.7 Arousals in active sleep: day 1 | 1 | 46 | Mean Difference (IV, Fixed, 95% CI) | ‐3.0 [‐5.66, ‐0.34] |
| 91.8 Arousals in active sleep: day 2 | 1 | 46 | Mean Difference (IV, Fixed, 95% CI) | ‐0.63 [‐4.12, 2.86] |
| 92 Cerebral palsy Show forest plot | 1 | 114 | Risk Ratio (M‐H, Fixed, 95% CI) | 0.0 [0.0, 0.0] |
| Analysis 1.92  Comparison 1 Overall: omega‐3 versus no omega‐3, Outcome 92 Cerebral palsy. | ||||
| Outcome or subgroup title | No. of studies | No. of participants | Statistical method | Effect size |
| 1 Preterm birth (< 37 weeks) Show forest plot | 27 | 10304 | Risk Ratio (M‐H, Fixed, 95% CI) | 0.88 [0.81, 0.97] |
| Analysis 2.1  Comparison 2 Type of omega‐3 intervention, Outcome 1 Preterm birth (< 37 weeks). | ||||
| 1.1 Omega‐3 supplements only | 18 | 7608 | Risk Ratio (M‐H, Fixed, 95% CI) | 0.90 [0.80, 1.01] |
| 1.2 Omega‐3 supplements/enrichment + food/diet advice | 3 | 516 | Risk Ratio (M‐H, Fixed, 95% CI) | 0.73 [0.41, 1.29] |
| 1.3 Omega‐3 food/diet advice | 1 | 48 | Risk Ratio (M‐H, Fixed, 95% CI) | 0.11 [0.01, 2.22] |
| 1.4 Omega‐3 supplements + other agents | 6 | 2132 | Risk Ratio (M‐H, Fixed, 95% CI) | 0.89 [0.76, 1.04] |
| 2 Early preterm birth (< 34 weeks) Show forest plot | 9 | 5204 | Risk Ratio (M‐H, Fixed, 95% CI) | 0.58 [0.44, 0.77] |
| Analysis 2.2  Comparison 2 Type of omega‐3 intervention, Outcome 2 Early preterm birth (< 34 weeks). | ||||
| 2.1 Omega‐3 supplements only | 8 | 4234 | Risk Ratio (M‐H, Fixed, 95% CI) | 0.62 [0.46, 0.82] |
| 2.2 Omega‐3 supplements + other agents | 1 | 970 | Risk Ratio (M‐H, Fixed, 95% CI) | 0.19 [0.04, 0.88] |
| 3 Prolonged gestation (> 42 weeks) Show forest plot | 6 | 5141 | Risk Ratio (M‐H, Fixed, 95% CI) | 1.61 [1.11, 2.33] |
| Analysis 2.3  Comparison 2 Type of omega‐3 intervention, Outcome 3 Prolonged gestation (> 42 weeks). | ||||
| 3.1 Omega‐3 supplements only | 5 | 4953 | Risk Ratio (M‐H, Fixed, 95% CI) | 1.59 [1.09, 2.31] |
| 3.2 Omega‐3 supplements + food/diet advice | 1 | 188 | Risk Ratio (M‐H, Fixed, 95% CI) | 3.13 [0.13, 75.84] |
| 4 Maternal death Show forest plot | 4 | 4830 | Risk Ratio (M‐H, Fixed, 95% CI) | 1.69 [0.07, 39.30] |
| Analysis 2.4  Comparison 2 Type of omega‐3 intervention, Outcome 4 Maternal death. | ||||
| 4.1 Omega‐3 supplements only | 3 | 4782 | Risk Ratio (M‐H, Fixed, 95% CI) | 0.0 [0.0, 0.0] |
| 4.2 Omega‐3 food/diet advice | 1 | 48 | Risk Ratio (M‐H, Fixed, 95% CI) | 1.69 [0.07, 39.30] |
| 5 Pre‐eclampsia (hypertension with proteinuria) Show forest plot | 21 | 8306 | Risk Ratio (M‐H, Fixed, 95% CI) | 0.84 [0.69, 1.01] |
| Analysis 2.5  Comparison 2 Type of omega‐3 intervention, Outcome 5 Pre‐eclampsia (hypertension with proteinuria). | ||||
| 5.1 Omega‐3 supplements only | 13 | 5825 | Risk Ratio (M‐H, Fixed, 95% CI) | 0.95 [0.76, 1.19] |
| 5.2 Omega‐3 supplements/enrichment + food/dietary advice | 2 | 328 | Risk Ratio (M‐H, Fixed, 95% CI) | 0.65 [0.25, 1.69] |
| 5.3 Omega‐3 supplements + other agents | 6 | 2153 | Risk Ratio (M‐H, Fixed, 95% CI) | 0.58 [0.39, 0.88] |
| 6 High blood pressure (without proteinuria) Show forest plot | 7 | 4531 | Risk Ratio (M‐H, Fixed, 95% CI) | 1.03 [0.89, 1.20] |
| Analysis 2.6  Comparison 2 Type of omega‐3 intervention, Outcome 6 High blood pressure (without proteinuria). | ||||
| 6.1 Omega‐3 supplements only | 6 | 4431 | Risk Ratio (M‐H, Fixed, 95% CI) | 1.05 [0.90, 1.22] |
| 6.2 Omega‐3 supplements + other agents | 1 | 100 | Risk Ratio (M‐H, Fixed, 95% CI) | 0.69 [0.33, 1.47] |
| 7 Eclampsia Show forest plot | 1 | 100 | Risk Ratio (M‐H, Fixed, 95% CI) | 0.14 [0.01, 2.70] |
| Analysis 2.7  Comparison 2 Type of omega‐3 intervention, Outcome 7 Eclampsia. | ||||
| 7.1 Omega‐3 supplements + other agents | 1 | 100 | Risk Ratio (M‐H, Fixed, 95% CI) | 0.14 [0.01, 2.70] |
| 8 Maternal antepartum hospitalisation Show forest plot | 5 | 2876 | Risk Ratio (M‐H, Fixed, 95% CI) | 0.92 [0.81, 1.04] |
| Analysis 2.8  Comparison 2 Type of omega‐3 intervention, Outcome 8 Maternal antepartum hospitalisation. | ||||
| 8.1 Omega‐3 supplements only | 4 | 2817 | Risk Ratio (M‐H, Fixed, 95% CI) | 0.92 [0.82, 1.04] |
| 8.2 Omega‐3 supplementation + other agents | 1 | 59 | Risk Ratio (M‐H, Fixed, 95% CI) | 0.21 [0.01, 4.13] |
| 9 Mother's length of stay in hospital (days) Show forest plot | 2 | 2290 | Mean Difference (IV, Fixed, 95% CI) | 0.18 [‐0.20, 0.57] |
| Analysis 2.9  Comparison 2 Type of omega‐3 intervention, Outcome 9 Mother's length of stay in hospital (days). | ||||
| 9.1 Omega‐3 supplements only | 2 | 2290 | Mean Difference (IV, Fixed, 95% CI) | 0.18 [‐0.20, 0.57] |
| 10 Maternal anaemia Show forest plot | 1 | 846 | Risk Ratio (M‐H, Fixed, 95% CI) | 1.16 [0.91, 1.48] |
| Analysis 2.10  Comparison 2 Type of omega‐3 intervention, Outcome 10 Maternal anaemia. | ||||
| 10.1 Omega‐3 supplements only | 1 | 846 | Risk Ratio (M‐H, Fixed, 95% CI) | 1.16 [0.91, 1.48] |
| 11 Miscarriage (< 24 weeks) Show forest plot | 9 | 4190 | Risk Ratio (M‐H, Fixed, 95% CI) | 1.07 [0.80, 1.43] |
| Analysis 2.11  Comparison 2 Type of omega‐3 intervention, Outcome 11 Miscarriage (< 24 weeks). | ||||
| 11.1 Omega‐3 supplements only | 8 | 3049 | Risk Ratio (M‐H, Fixed, 95% CI) | 0.95 [0.56, 1.60] |
| 11.2 Omega‐3 supplements + other agents | 1 | 1141 | Risk Ratio (M‐H, Fixed, 95% CI) | 1.14 [0.80, 1.61] |
| 12 Antepartum vaginal bleeding Show forest plot | 2 | 2151 | Risk Ratio (M‐H, Fixed, 95% CI) | 1.01 [0.69, 1.48] |
| Analysis 2.12  Comparison 2 Type of omega‐3 intervention, Outcome 12 Antepartum vaginal bleeding. | ||||
| 12.1 Omega‐3 supplements only | 2 | 2151 | Risk Ratio (M‐H, Fixed, 95% CI) | 1.01 [0.69, 1.48] |
| 13 Preterm prelabour rupture of membranes Show forest plot | 3 | 925 | Risk Ratio (M‐H, Fixed, 95% CI) | 0.53 [0.25, 1.10] |
| Analysis 2.13  Comparison 2 Type of omega‐3 intervention, Outcome 13 Preterm prelabour rupture of membranes. | ||||
| 13.1 Omega‐3 supplements only | 2 | 670 | Risk Ratio (M‐H, Fixed, 95% CI) | 0.61 [0.28, 1.34] |
| 13.2 Omega‐3 supplementation/enrichment + food/diet advice | 1 | 255 | Risk Ratio (M‐H, Fixed, 95% CI) | 0.24 [0.03, 2.15] |
| 14 Prelabour rupture of membranes Show forest plot | 3 | 915 | Risk Ratio (M‐H, Fixed, 95% CI) | 0.41 [0.21, 0.82] |
| Analysis 2.14  Comparison 2 Type of omega‐3 intervention, Outcome 14 Prelabour rupture of membranes. | ||||
| 14.1 Omega‐3 supplements only | 1 | 369 | Risk Ratio (M‐H, Fixed, 95% CI) | 0.54 [0.14, 2.11] |
| 14.2 Omega‐3 supplementation/enrichment + food/diet advice | 2 | 546 | Risk Ratio (M‐H, Fixed, 95% CI) | 0.38 [0.17, 0.85] |
| 15 Maternal admission to intensive care Show forest plot | 2 | 2458 | Risk Ratio (M‐H, Fixed, 95% CI) | 0.56 [0.12, 2.63] |
| Analysis 2.15  Comparison 2 Type of omega‐3 intervention, Outcome 15 Maternal admission to intensive care. | ||||
| 15.1 Omega‐3 supplements only | 1 | 2399 | Risk Ratio (M‐H, Fixed, 95% CI) | 1.00 [0.14, 7.12] |
| 15.2 Omega‐3 supplements + other agent | 1 | 59 | Risk Ratio (M‐H, Fixed, 95% CI) | 0.21 [0.01, 4.13] |
| 16 Maternal severe adverse effects (including cessation) Show forest plot | 8 | 4177 | Risk Ratio (M‐H, Fixed, 95% CI) | 1.02 [0.59, 1.75] |
| Analysis 2.16  Comparison 2 Type of omega‐3 intervention, Outcome 16 Maternal severe adverse effects (including cessation). | ||||
| 16.1 Omega‐3 supplements only | 7 | 3886 | Risk Ratio (M‐H, Fixed, 95% CI) | 1.01 [0.54, 1.87] |
| 16.2 Omega‐3 supplementation/enrichment + food/diet advice | 1 | 291 | Risk Ratio (M‐H, Fixed, 95% CI) | 1.05 [0.35, 3.18] |
| 17 Caesarean section Show forest plot | 29 | 8481 | Risk Ratio (M‐H, Fixed, 95% CI) | 0.97 [0.91, 1.03] |
| Analysis 2.17  Comparison 2 Type of omega‐3 intervention, Outcome 17 Caesarean section. | ||||
| 17.1 Omega‐3 supplements only | 19 | 6537 | Risk Ratio (M‐H, Fixed, 95% CI) | 0.98 [0.92, 1.06] |
| 17.2 Omega‐3 supplements/enrichment +food/diet advice | 4 | 574 | Risk Ratio (M‐H, Fixed, 95% CI) | 0.87 [0.63, 1.19] |
| 17.3 Omega‐3 food/diet advice | 1 | 107 | Risk Ratio (M‐H, Fixed, 95% CI) | 0.91 [0.38, 2.17] |
| 17.4 Omega‐3 supplements + other agents | 5 | 1263 | Risk Ratio (M‐H, Fixed, 95% CI) | 0.88 [0.72, 1.08] |
| 18 Induction (post‐term) Show forest plot | 3 | 2900 | Risk Ratio (M‐H, Random, 95% CI) | 0.82 [0.22, 2.98] |
| Analysis 2.18  Comparison 2 Type of omega‐3 intervention, Outcome 18 Induction (post‐term). | ||||
| 18.1 Omega‐3 supplements only | 2 | 2712 | Risk Ratio (M‐H, Random, 95% CI) | 0.82 [0.22, 2.98] |
| 18.2 Omega‐3 supplements + food/diet advice | 1 | 188 | Risk Ratio (M‐H, Random, 95% CI) | 0.0 [0.0, 0.0] |
| 19 Blood loss at birth (mL) Show forest plot | 6 | 2776 | Mean Difference (IV, Fixed, 95% CI) | 11.50 [‐6.75, 29.76] |
| Analysis 2.19  Comparison 2 Type of omega‐3 intervention, Outcome 19 Blood loss at birth (mL). | ||||
| 19.1 Omega‐3 supplements only | 5 | 2588 | Mean Difference (IV, Fixed, 95% CI) | 11.64 [‐8.89, 32.17] |
| 19.2 Omega‐3 supplements + food/diet advice | 1 | 188 | Mean Difference (IV, Fixed, 95% CI) | 11.0 [‐28.91, 50.91] |
| 20 Postpartum haemorrhage Show forest plot | 4 | 4085 | Risk Ratio (M‐H, Fixed, 95% CI) | 1.03 [0.82, 1.30] |
| Analysis 2.20  Comparison 2 Type of omega‐3 intervention, Outcome 20 Postpartum haemorrhage. | ||||
| 20.1 Omega‐3 supplements only | 3 | 3233 | Risk Ratio (M‐H, Fixed, 95% CI) | 0.97 [0.71, 1.34] |
| 20.2 Omega‐3 supplements + other agent | 1 | 852 | Risk Ratio (M‐H, Fixed, 95% CI) | 1.11 [0.79, 1.57] |
| 21 Gestational diabetes Show forest plot | 12 | 5235 | Risk Ratio (M‐H, Fixed, 95% CI) | 1.02 [0.83, 1.26] |
| Analysis 2.21  Comparison 2 Type of omega‐3 intervention, Outcome 21 Gestational diabetes. | ||||
| 21.1 Omega‐3 supplements only | 7 | 3726 | Risk Ratio (M‐H, Fixed, 95% CI) | 1.02 [0.80, 1.30] |
| 21.2 Omega‐3 supplements/enrichment + food/diet advice | 4 | 595 | Risk Ratio (M‐H, Fixed, 95% CI) | 0.66 [0.33, 1.34] |
| 21.3 Omega‐3 supplements + other agents | 2 | 914 | Risk Ratio (M‐H, Fixed, 95% CI) | 1.34 [0.80, 2.24] |
| 22 Maternal insulin resistance (HOMA‐IR) Show forest plot | 3 | 176 | Mean Difference (IV, Random, 95% CI) | ‐0.85 [‐2.50, 0.80] |
| Analysis 2.22  Comparison 2 Type of omega‐3 intervention, Outcome 22 Maternal insulin resistance (HOMA‐IR). | ||||
| 22.1 Omega‐3 supplements only | 2 | 116 | Mean Difference (IV, Random, 95% CI) | ‐0.25 [‐1.94, 1.44] |
| 22.2 Omega‐3 supplements + other agents | 1 | 60 | Mean Difference (IV, Random, 95% CI) | ‐2.0 [‐3.10, ‐0.90] |
| 23 Excessive gestational weight gain Show forest plot | 1 | 350 | Risk Ratio (M‐H, Fixed, 95% CI) | 1.21 [0.95, 1.55] |
| Analysis 2.23  Comparison 2 Type of omega‐3 intervention, Outcome 23 Excessive gestational weight gain. | ||||
| 23.1 Omega‐3 supplements only | 1 | 350 | Risk Ratio (M‐H, Fixed, 95% CI) | 1.21 [0.95, 1.55] |
| 24 Gestational weight gain (kg) Show forest plot | 11 | 2297 | Mean Difference (IV, Random, 95% CI) | ‐0.05 [‐0.68, 0.59] |
| Analysis 2.24  Comparison 2 Type of omega‐3 intervention, Outcome 24 Gestational weight gain (kg). | ||||
| 24.1 Omega‐3 supplements only | 6 | 955 | Mean Difference (IV, Random, 95% CI) | ‐0.22 [‐1.47, 1.03] |
| 24.2 Omega‐3 supplements/enrichment + food/diet advice | 3 | 313 | Mean Difference (IV, Random, 95% CI) | ‐0.11 [‐0.99, 0.78] |
| 24.3 Omega‐3 supplements + other agents | 2 | 1029 | Mean Difference (IV, Random, 95% CI) | 0.43 [‐0.08, 0.95] |
| 25 Depression during pregnancy: scores Show forest plot | 5 | Mean Difference (IV, Fixed, 95% CI) | Subtotals only | |
| Analysis 2.25  Comparison 2 Type of omega‐3 intervention, Outcome 25 Depression during pregnancy: scores. | ||||
| 25.1 Omega‐3 supplements only: BDI | 2 | 104 | Mean Difference (IV, Fixed, 95% CI) | ‐5.86 [‐8.32, ‐3.39] |
| 25.2 Omega‐3 supplements only: HAMD | 3 | 71 | Mean Difference (IV, Fixed, 95% CI) | ‐1.08 [‐3.35, 1.19] |
| 25.3 Omega‐3 supplements only: EPDS | 4 | 122 | Mean Difference (IV, Fixed, 95% CI) | ‐0.15 [‐2.09, 1.79] |
| 25.4 Omega‐3 supplements only: MADRS | 1 | 26 | Mean Difference (IV, Fixed, 95% CI) | ‐1.60 [‐7.80, 4.60] |
| 26 Depression during pregnancy: thresholds Show forest plot | 3 | Risk Ratio (M‐H, Fixed, 95% CI) | Subtotals only | |
| Analysis 2.26  Comparison 2 Type of omega‐3 intervention, Outcome 26 Depression during pregnancy: thresholds. | ||||
| 26.1 Omega‐3 supplements only: HAMD 50% reduction (after 8 weeks) | 1 | 24 | Risk Ratio (M‐H, Fixed, 95% CI) | 2.26 [0.78, 6.49] |
| 26.2 Omega‐3 supplements only: HAMD ≤ 7 | 1 | 24 | Risk Ratio (M‐H, Fixed, 95% CI) | 2.12 [0.51, 8.84] |
| 26.3 Omega‐3 supplements only: unspecified | 1 | 301 | Risk Ratio (M‐H, Fixed, 95% CI) | 2.39 [0.47, 12.11] |
| 26.4 Omega‐3 supplements only: EPDS ≥ 11 | 1 | 34 | Risk Ratio (M‐H, Fixed, 95% CI) | 1.4 [0.55, 3.55] |
| 27 Depressive symptoms postpartum: thresholds Show forest plot | 4 | Risk Ratio (M‐H, Fixed, 95% CI) | Subtotals only | |
| Analysis 2.27  Comparison 2 Type of omega‐3 intervention, Outcome 27 Depressive symptoms postpartum: thresholds. | ||||
| 27.1 Omega‐3 supplements only: PDSS ≥80 | 1 | 42 | Risk Ratio (M‐H, Fixed, 95% CI) | 0.37 [0.04, 3.25] |
| 27.2 Omega‐3 supplements only: EPDS | 2 | 2431 | Risk Ratio (M‐H, Fixed, 95% CI) | 0.89 [0.71, 1.12] |
| 27.3 Omega‐3 supplements only: major depressive disorder | 1 | 118 | Risk Ratio (M‐H, Fixed, 95% CI) | 1.33 [0.27, 6.56] |
| 28 Depressive symptoms postpartum: scores Show forest plot | 2 | Mean Difference (IV, Fixed, 95% CI) | Subtotals only | |
| Analysis 2.28  Comparison 2 Type of omega‐3 intervention, Outcome 28 Depressive symptoms postpartum: scores. | ||||
| 28.1 Omega‐3 supplements only: BD: 6‐8 weeks postpartum | 1 | 118 | Mean Difference (IV, Fixed, 95% CI) | 0.25 [‐1.93, 2.43] |
| 28.2 Omega‐3 supplements only: PDSS total (LS over 6 months) | 1 | 42 | Mean Difference (IV, Fixed, 95% CI) | ‐6.08 [‐12.42, 0.26] |
| 29 Length of gestation (days) Show forest plot | 43 | 12517 | Mean Difference (IV, Random, 95% CI) | 1.65 [0.94, 2.37] |
| Analysis 2.29  Comparison 2 Type of omega‐3 intervention, Outcome 29 Length of gestation (days). | ||||
| 29.1 Omega‐3 supplements only | 29 | 9290 | Mean Difference (IV, Random, 95% CI) | 1.67 [0.76, 2.59] |
| 29.2 Omega‐3 supplements/enrichment + food/diet advice | 6 | 680 | Mean Difference (IV, Random, 95% CI) | 2.45 [‐0.14, 5.04] |
| 29.3 Omega‐3 food/diet advice | 1 | 107 | Mean Difference (IV, Random, 95% CI) | 5.00 [0.64, 9.36] |
| 29.4 Omega‐3 supplements + other agents | 8 | 2440 | Mean Difference (IV, Random, 95% CI) | 1.04 [0.05, 2.03] |
| 30 Perinatal death Show forest plot | 10 | 7416 | Risk Ratio (M‐H, Fixed, 95% CI) | 0.75 [0.54, 1.03] |
| Analysis 2.30  Comparison 2 Type of omega‐3 intervention, Outcome 30 Perinatal death. | ||||
| 30.1 Omega‐3 supplements only | 8 | 6496 | Risk Ratio (M‐H, Fixed, 95% CI) | 0.71 [0.48, 1.03] |
| 30.2 Omega‐3 supplements + other agents | 2 | 920 | Risk Ratio (M‐H, Fixed, 95% CI) | 0.87 [0.47, 1.62] |
| 31 Stillbirth Show forest plot | 16 | 7880 | Risk Ratio (M‐H, Fixed, 95% CI) | 0.94 [0.62, 1.42] |
| Analysis 2.31  Comparison 2 Type of omega‐3 intervention, Outcome 31 Stillbirth. | ||||
| 31.1 Omega‐3 supplements only | 13 | 7693 | Risk Ratio (M‐H, Fixed, 95% CI) | 0.92 [0.60, 1.42] |
| 31.2 Omega‐3 supplements + food/diet advice | 1 | 79 | Risk Ratio (M‐H, Fixed, 95% CI) | 0.33 [0.01, 7.75] |
| 31.3 Omega‐3 food/diet advice | 1 | 48 | Risk Ratio (M‐H, Fixed, 95% CI) | 1.69 [0.07, 39.30] |
| 31.4 Omega‐3 supplements + other agents | 1 | 60 | Risk Ratio (M‐H, Fixed, 95% CI) | 3.0 [0.13, 70.83] |
| 32 Neonatal death Show forest plot | 9 | 7448 | Risk Ratio (M‐H, Fixed, 95% CI) | 0.61 [0.34, 1.11] |
| Analysis 2.32  Comparison 2 Type of omega‐3 intervention, Outcome 32 Neonatal death. | ||||
| 32.1 Omega‐3 supplements only | 9 | 7448 | Risk Ratio (M‐H, Fixed, 95% CI) | 0.61 [0.34, 1.11] |
| 33 Infant death Show forest plot | 4 | 3239 | Risk Ratio (M‐H, Fixed, 95% CI) | 0.74 [0.25, 2.19] |
| Analysis 2.33  Comparison 2 Type of omega‐3 intervention, Outcome 33 Infant death. | ||||
| 33.1 Omega‐3 supplements only | 4 | 3239 | Risk Ratio (M‐H, Fixed, 95% CI) | 0.74 [0.25, 2.19] |
| 34 Large‐for‐gestational age Show forest plot | 5 | 3602 | Risk Ratio (M‐H, Fixed, 95% CI) | 1.20 [1.01, 1.43] |
| Analysis 2.34  Comparison 2 Type of omega‐3 intervention, Outcome 34 Large‐for‐gestational age. | ||||
| 34.1 Omega‐3 supplements only | 2 | 2518 | Risk Ratio (M‐H, Fixed, 95% CI) | 1.19 [0.99, 1.43] |
| 34.2 Omega‐3 supplements + food/diet advice | 1 | 188 | Risk Ratio (M‐H, Fixed, 95% CI) | 1.23 [0.48, 3.17] |
| 34.3 Omega‐3 supplements + other agent | 2 | 896 | Risk Ratio (M‐H, Fixed, 95% CI) | 1.28 [0.72, 2.29] |
| 35 Macrosomia Show forest plot | 7 | 2008 | Risk Ratio (M‐H, Fixed, 95% CI) | 0.69 [0.43, 1.13] |
| Analysis 2.35  Comparison 2 Type of omega‐3 intervention, Outcome 35 Macrosomia. | ||||
| 35.1 Omega‐3 supplements only | 5 | 1904 | Risk Ratio (M‐H, Fixed, 95% CI) | 0.80 [0.47, 1.36] |
| 35.2 Omega‐3 supplements + other agent | 2 | 104 | Risk Ratio (M‐H, Fixed, 95% CI) | 0.31 [0.08, 1.23] |
| 36 Low birthweight (< 2500 g) Show forest plot | 15 | 8449 | Risk Ratio (M‐H, Fixed, 95% CI) | 0.90 [0.82, 0.99] |
| Analysis 2.36  Comparison 2 Type of omega‐3 intervention, Outcome 36 Low birthweight (< 2500 g). | ||||
| 36.1 Omega‐3 supplements only | 10 | 6214 | Risk Ratio (M‐H, Fixed, 95% CI) | 0.96 [0.86, 1.07] |
| 36.2 Omega‐3 supplements/enrichment + food/diet advice | 2 | 328 | Risk Ratio (M‐H, Fixed, 95% CI) | 0.66 [0.34, 1.26] |
| 36.3 Omega‐3 supplements + other agents | 3 | 1907 | Risk Ratio (M‐H, Fixed, 95% CI) | 0.77 [0.62, 0.95] |
| 37 Small‐for‐gestational age/IUGR Show forest plot | 8 | 6907 | Risk Ratio (M‐H, Fixed, 95% CI) | 1.01 [0.90, 1.13] |
| Analysis 2.37  Comparison 2 Type of omega‐3 intervention, Outcome 37 Small‐for‐gestational age/IUGR. | ||||
| 37.1 Omega‐3 supplements only | 5 | 5041 | Risk Ratio (M‐H, Fixed, 95% CI) | 1.05 [0.93, 1.20] |
| 37.2 Omega‐3 supplements + other agents | 3 | 1866 | Risk Ratio (M‐H, Fixed, 95% CI) | 0.80 [0.59, 1.09] |
| 38 Birthweight (g) Show forest plot | 44 | 11584 | Mean Difference (IV, Random, 95% CI) | 75.74 [38.05, 113.43] |
| Analysis 2.38  Comparison 2 Type of omega‐3 intervention, Outcome 38 Birthweight (g). | ||||
| 38.1 Omega‐3 supplements only | 31 | 8522 | Mean Difference (IV, Random, 95% CI) | 59.41 [23.23, 95.59] |
| 38.2 Omega‐3 supplements/enrichment + food/diet advice | 6 | 859 | Mean Difference (IV, Random, 95% CI) | 129.42 [49.52, 209.31] |
| 38.3 Omega‐3 food/diet advice | 1 | 107 | Mean Difference (IV, Random, 95% CI) | ‐17.0 [‐190.97, 156.97] |
| 38.4 Omega‐3 supplements + other agents | 6 | 2096 | Mean Difference (IV, Random, 95% CI) | 69.14 [‐72.81, 211.10] |
| 39 Birthweight Z score Show forest plot | 4 | 2792 | Mean Difference (IV, Fixed, 95% CI) | 0.06 [‐0.02, 0.13] |
| Analysis 2.39  Comparison 2 Type of omega‐3 intervention, Outcome 39 Birthweight Z score. | ||||
| 39.1 Omega‐3 supplements only | 3 | 2677 | Mean Difference (IV, Fixed, 95% CI) | 0.06 [‐0.01, 0.14] |
| 39.2 Omega‐3 supplements + other agent | 1 | 115 | Mean Difference (IV, Fixed, 95% CI) | 0.00 [‐0.21, 0.21] |
| 40 Birth length (cm) Show forest plot | 29 | 8008 | Mean Difference (IV, Random, 95% CI) | 0.13 [‐0.08, 0.34] |
| Analysis 2.40  Comparison 2 Type of omega‐3 intervention, Outcome 40 Birth length (cm). | ||||
| 40.1 Omega‐3 supplements only | 20 | 6010 | Mean Difference (IV, Random, 95% CI) | 0.21 [‐0.03, 0.45] |
| 40.2 Omega‐3 supplements/enrichment + food/diet advice | 4 | 606 | Mean Difference (IV, Random, 95% CI) | 0.42 [‐0.01, 0.85] |
| 40.3 Omega‐3 food/diet advice | 1 | 123 | Mean Difference (IV, Random, 95% CI) | ‐0.10 [‐0.56, 0.36] |
| 40.4 Omega‐3 supplements + other agent | 4 | 1269 | Mean Difference (IV, Random, 95% CI) | ‐0.51 [‐0.78, ‐0.23] |
| 41 Length at birth Z score Show forest plot | 2 | 2462 | Mean Difference (IV, Random, 95% CI) | 0.18 [‐0.18, 0.54] |
| Analysis 2.41  Comparison 2 Type of omega‐3 intervention, Outcome 41 Length at birth Z score. | ||||
| 41.1 Omega‐3 supplements only | 2 | 2462 | Mean Difference (IV, Random, 95% CI) | 0.18 [‐0.18, 0.54] |
| 42 Head circumference at birth (cm) Show forest plot | 23 | 7041 | Mean Difference (IV, Fixed, 95% CI) | 0.10 [0.01, 0.18] |
| Analysis 2.42  Comparison 2 Type of omega‐3 intervention, Outcome 42 Head circumference at birth (cm). | ||||
| 42.1 Omega‐3 supplements only | 16 | 5442 | Mean Difference (IV, Fixed, 95% CI) | 0.07 [‐0.03, 0.17] |
| 42.2 Omega‐3 supplements/enrichment + food/diet advice | 3 | 418 | Mean Difference (IV, Fixed, 95% CI) | 0.34 [0.03, 0.65] |
| 42.3 Omega‐3 food/diet advice only | 1 | 107 | Mean Difference (IV, Fixed, 95% CI) | ‐0.20 [‐0.75, 0.35] |
| 42.4 Omega‐3 supplements + other agent | 3 | 1074 | Mean Difference (IV, Fixed, 95% CI) | 0.15 [‐0.06, 0.35] |
| 43 Head circumference at birth Z score Show forest plot | 2 | 2462 | Mean Difference (IV, Fixed, 95% CI) | ‐0.03 [‐0.14, 0.07] |
| Analysis 2.43  Comparison 2 Type of omega‐3 intervention, Outcome 43 Head circumference at birth Z score. | ||||
| 43.1 Omega‐3 supplementation only | 2 | 2462 | Mean Difference (IV, Fixed, 95% CI) | ‐0.03 [‐0.14, 0.07] |
| 44 Baby admitted to neonatal care Show forest plot | 9 | 6920 | Risk Ratio (M‐H, Fixed, 95% CI) | 0.92 [0.83, 1.03] |
| Analysis 2.44  Comparison 2 Type of omega‐3 intervention, Outcome 44 Baby admitted to neonatal care. | ||||
| 44.1 Omega‐3 supplements only | 5 | 5692 | Risk Ratio (M‐H, Fixed, 95% CI) | 0.90 [0.79, 1.02] |
| 44.2 Omega‐3 supplements/enrichment + food/diet advice | 2 | 328 | Risk Ratio (M‐H, Fixed, 95% CI) | 0.89 [0.54, 1.50] |
| 44.3 Omega‐3 supplements + other agents | 2 | 900 | Risk Ratio (M‐H, Fixed, 95% CI) | 1.01 [0.81, 1.26] |
| 45 Infant length of stay in hospital (days) Show forest plot | 1 | 2041 | Mean Difference (IV, Fixed, 95% CI) | 0.11 [‐1.40, 1.62] |
| Analysis 2.45  Comparison 2 Type of omega‐3 intervention, Outcome 45 Infant length of stay in hospital (days). | ||||
| 45.1 Omega‐3 supplementation only | 1 | 2041 | Mean Difference (IV, Fixed, 95% CI) | 0.11 [‐1.40, 1.62] |
| 46 Congenital anomalies Show forest plot | 3 | 1807 | Risk Ratio (M‐H, Fixed, 95% CI) | 1.08 [0.61, 1.92] |
| Analysis 2.46  Comparison 2 Type of omega‐3 intervention, Outcome 46 Congenital anomalies. | ||||
| 46.1 Omega‐3 supplements only | 3 | 1807 | Risk Ratio (M‐H, Fixed, 95% CI) | 1.08 [0.61, 1.92] |
| 47 Retinopathy of prematurity Show forest plot | 1 | 837 | Risk Ratio (M‐H, Fixed, 95% CI) | 1.20 [0.32, 4.44] |
| Analysis 2.47  Comparison 2 Type of omega‐3 intervention, Outcome 47 Retinopathy of prematurity. | ||||
| 47.1 Omega‐3 supplementation + other agent only | 1 | 837 | Risk Ratio (M‐H, Fixed, 95% CI) | 1.20 [0.32, 4.44] |
| 48 Bronchopulmonary dysplasia Show forest plot | 2 | 3191 | Risk Ratio (M‐H, Fixed, 95% CI) | 1.06 [0.45, 2.48] |
| Analysis 2.48  Comparison 2 Type of omega‐3 intervention, Outcome 48 Bronchopulmonary dysplasia. | ||||
| 48.1 Omega‐3 supplementation only | 1 | 2363 | Risk Ratio (M‐H, Fixed, 95% CI) | 0.50 [0.09, 2.71] |
| 48.2 Omega‐3 supplementation + other agent | 1 | 828 | Risk Ratio (M‐H, Fixed, 95% CI) | 1.42 [0.51, 3.96] |
| 49 Respiratory distress syndrome Show forest plot | 2 | 1129 | Risk Ratio (M‐H, Random, 95% CI) | 1.17 [0.54, 2.52] |
| Analysis 2.49  Comparison 2 Type of omega‐3 intervention, Outcome 49 Respiratory distress syndrome. | ||||
| 49.1 Omega‐3 supplementation only | 1 | 301 | Risk Ratio (M‐H, Random, 95% CI) | 0.72 [0.31, 1.65] |
| 49.2 Omega‐3 supplementation + other agent | 1 | 828 | Risk Ratio (M‐H, Random, 95% CI) | 1.60 [1.08, 2.37] |
| 50 Necrotising enterocolitis (NEC) Show forest plot | 2 | 3198 | Risk Ratio (M‐H, Fixed, 95% CI) | 0.97 [0.26, 3.55] |
| Analysis 2.50  Comparison 2 Type of omega‐3 intervention, Outcome 50 Necrotising enterocolitis (NEC). | ||||
| 50.1 Omega‐3 supplementation only | 1 | 2361 | Risk Ratio (M‐H, Fixed, 95% CI) | 2.98 [0.12, 73.13] |
| 50.2 Omega‐3 supplementation + other agent | 1 | 837 | Risk Ratio (M‐H, Fixed, 95% CI) | 0.72 [0.16, 3.20] |
| 51 Neonatal sepsis (proven) Show forest plot | 3 | 3788 | Risk Ratio (M‐H, Fixed, 95% CI) | 0.97 [0.44, 2.14] |
| Analysis 2.51  Comparison 2 Type of omega‐3 intervention, Outcome 51 Neonatal sepsis (proven). | ||||
| 51.1 Omega‐3 supplements only | 3 | 3788 | Risk Ratio (M‐H, Fixed, 95% CI) | 0.97 [0.44, 2.14] |
| 52 Convulsion Show forest plot | 1 | 2361 | Risk Ratio (M‐H, Fixed, 95% CI) | 0.09 [0.01, 1.63] |
| Analysis 2.52  Comparison 2 Type of omega‐3 intervention, Outcome 52 Convulsion. | ||||
| 52.1 Omega‐3 supplementation only | 1 | 2361 | Risk Ratio (M‐H, Fixed, 95% CI) | 0.09 [0.01, 1.63] |
| 53 Intraventricular haemorrhage Show forest plot | 3 | 5423 | Risk Ratio (M‐H, Random, 95% CI) | 1.00 [0.29, 3.49] |
| Analysis 2.53  Comparison 2 Type of omega‐3 intervention, Outcome 53 Intraventricular haemorrhage. | ||||
| 53.1 Omega‐3 supplements only | 2 | 4586 | Risk Ratio (M‐H, Random, 95% CI) | 0.59 [0.02, 16.16] |
| 53.2 Omega‐3 supplementation + other agent | 1 | 837 | Risk Ratio (M‐H, Random, 95% CI) | 1.07 [0.44, 2.60] |
| 54 Neonatal/infant serious adverse events Show forest plot | 2 | 2690 | Risk Ratio (M‐H, Fixed, 95% CI) | 0.72 [0.53, 0.99] |
| Analysis 2.54  Comparison 2 Type of omega‐3 intervention, Outcome 54 Neonatal/infant serious adverse events. | ||||
| 54.1 Omega‐3 supplementation | 1 | 2399 | Risk Ratio (M‐H, Fixed, 95% CI) | 0.67 [0.44, 1.01] |
| 54.2 Omega‐3 supplements/enrichment + food/diet advice | 1 | 291 | Risk Ratio (M‐H, Fixed, 95% CI) | 0.81 [0.50, 1.31] |
| 55 Neonatal/infant morbidity: cardiovascular Show forest plot | 1 | 291 | Risk Ratio (M‐H, Fixed, 95% CI) | 1.20 [0.85, 1.69] |
| Analysis 2.55  Comparison 2 Type of omega‐3 intervention, Outcome 55 Neonatal/infant morbidity: cardiovascular. | ||||
| 55.1 Omega‐3 supplements/enrichment + food/diet advice | 1 | 291 | Risk Ratio (M‐H, Fixed, 95% CI) | 1.20 [0.85, 1.69] |
| 56 Neonatal/infant morbidity: respiratory Show forest plot | 1 | 291 | Risk Ratio (M‐H, Fixed, 95% CI) | 1.02 [0.66, 1.57] |
| Analysis 2.56  Comparison 2 Type of omega‐3 intervention, Outcome 56 Neonatal/infant morbidity: respiratory. | ||||
| 56.1 Omega‐3 supplements/enrichment + food/diet advice | 1 | 291 | Risk Ratio (M‐H, Fixed, 95% CI) | 1.02 [0.66, 1.57] |
| 57 Neonatal/infant morbidity: caused by pregnancy/birth Show forest plot | 1 | 291 | Risk Ratio (M‐H, Fixed, 95% CI) | 1.02 [0.67, 1.55] |
| Analysis 2.57  Comparison 2 Type of omega‐3 intervention, Outcome 57 Neonatal/infant morbidity: caused by pregnancy/birth. | ||||
| 57.1 Omega‐3 supplements/enrichment + food/diet advice | 1 | 291 | Risk Ratio (M‐H, Fixed, 95% CI) | 1.02 [0.67, 1.55] |
| 58 Ponderal index Show forest plot | 6 | 887 | Mean Difference (IV, Random, 95% CI) | 0.05 [‐0.01, 0.11] |
| Analysis 2.58  Comparison 2 Type of omega‐3 intervention, Outcome 58 Ponderal index. | ||||
| 58.1 Omega‐3 supplements only | 5 | 699 | Mean Difference (IV, Random, 95% CI) | 0.04 [‐0.04, 0.11] |
| 58.2 Omega‐3 supplements + food/diet advice | 1 | 188 | Mean Difference (IV, Random, 95% CI) | 0.08 [0.01, 0.15] |
| Outcome or subgroup title | No. of studies | No. of participants | Statistical method | Effect size |
| 1 Preterm birth (< 37 weeks) Show forest plot | 26 | 10294 | Risk Ratio (M‐H, Fixed, 95% CI) | 0.88 [0.80, 0.97] |
| Analysis 3.1  Comparison 3 Dose (DHA/EPA) subgroups, Outcome 1 Preterm birth (< 37 weeks). | ||||
| 1.1 Low: < 500 mg/day | 6 | 1604 | Risk Ratio (M‐H, Fixed, 95% CI) | 0.88 [0.65, 1.20] |
| 1.2 Mid: 500 mg‐1 g/day | 9 | 4343 | Risk Ratio (M‐H, Fixed, 95% CI) | 0.79 [0.64, 0.98] |
| 1.3 High: > 1 g/day | 9 | 4240 | Risk Ratio (M‐H, Fixed, 95% CI) | 0.92 [0.83, 1.03] |
| 1.4 Other | 2 | 107 | Risk Ratio (M‐H, Fixed, 95% CI) | 0.66 [0.19, 2.32] |
| 2 Early preterm birth (< 34 weeks) Show forest plot | 9 | 5204 | Risk Ratio (M‐H, Fixed, 95% CI) | 0.58 [0.44, 0.77] |
| Analysis 3.2  Comparison 3 Dose (DHA/EPA) subgroups, Outcome 2 Early preterm birth (< 34 weeks). | ||||
| 2.1 Low: < 500 mg/day | 1 | 168 | Risk Ratio (M‐H, Fixed, 95% CI) | 0.29 [0.05, 1.51] |
| 2.2 Mid: 500 mg‐1 g/day | 7 | 4176 | Risk Ratio (M‐H, Fixed, 95% CI) | 0.47 [0.30, 0.75] |
| 2.3 High: > 1 g/day | 2 | 860 | Risk Ratio (M‐H, Fixed, 95% CI) | 0.69 [0.49, 0.99] |
| 3 Prolonged gestation (> 42 weeks) Show forest plot | 6 | 5141 | Risk Ratio (M‐H, Fixed, 95% CI) | 1.59 [1.10, 2.30] |
| Analysis 3.3  Comparison 3 Dose (DHA/EPA) subgroups, Outcome 3 Prolonged gestation (> 42 weeks). | ||||
| 3.1 Low: < 500 mg/day | 2 | 303 | Risk Ratio (M‐H, Fixed, 95% CI) | 1.72 [0.07, 41.64] |
| 3.2 Mid: 500 mg‐1 g/day | 2 | 2544 | Risk Ratio (M‐H, Fixed, 95% CI) | 1.92 [0.54, 6.81] |
| 3.3 High: > 1 g/day | 3 | 2294 | Risk Ratio (M‐H, Fixed, 95% CI) | 1.56 [1.05, 2.30] |
| 4 Pre‐eclampsia (hypertension with proteinuria) Show forest plot | 20 | 8306 | Risk Ratio (M‐H, Fixed, 95% CI) | 0.83 [0.69, 1.01] |
| Analysis 3.4  Comparison 3 Dose (DHA/EPA) subgroups, Outcome 4 Pre‐eclampsia (hypertension with proteinuria). | ||||
| 4.1 Low: < 500 mg/day | 5 | 650 | Risk Ratio (M‐H, Fixed, 95% CI) | 0.59 [0.28, 1.26] |
| 4.2 Mid: 500 mg‐1 g/day | 7 | 4118 | Risk Ratio (M‐H, Fixed, 95% CI) | 0.83 [0.62, 1.11] |
| 4.3 High: > 1 g/day | 8 | 3479 | Risk Ratio (M‐H, Fixed, 95% CI) | 0.87 [0.66, 1.14] |
| 4.4 Other | 1 | 59 | Risk Ratio (M‐H, Fixed, 95% CI) | 2.07 [0.20, 21.60] |
| 5 Caesarean section Show forest plot | 28 | 8481 | Risk Ratio (M‐H, Fixed, 95% CI) | 0.97 [0.91, 1.03] |
| Analysis 3.5  Comparison 3 Dose (DHA/EPA) subgroups, Outcome 5 Caesarean section. | ||||
| 5.1 Low: < 500 g/day | 8 | 1670 | Risk Ratio (M‐H, Fixed, 95% CI) | 0.94 [0.84, 1.06] |
| 5.2 Mid: 500 mg‐1 g/day | 10 | 4399 | Risk Ratio (M‐H, Fixed, 95% CI) | 0.93 [0.85, 1.02] |
| 5.3 High: > 1 g/day | 8 | 2294 | Risk Ratio (M‐H, Fixed, 95% CI) | 1.15 [0.97, 1.37] |
| 5.4 Other | 2 | 118 | Risk Ratio (M‐H, Fixed, 95% CI) | 0.59 [0.30, 1.15] |
| 6 Length of gestation (days) Show forest plot | 42 | 12517 | Mean Difference (IV, Random, 95% CI) | 1.67 [0.95, 2.39] |
| Analysis 3.6  Comparison 3 Dose (DHA/EPA) subgroups, Outcome 6 Length of gestation (days). | ||||
| 6.1 Low: < 500 mg/day | 12 | 2117 | Mean Difference (IV, Random, 95% CI) | 1.05 [0.07, 2.03] |
| 6.2 Mid: 500 mg‐1 g/day | 15 | 4881 | Mean Difference (IV, Random, 95% CI) | 1.97 [0.56, 3.38] |
| 6.3 High: > 1 g/day | 12 | 3364 | Mean Difference (IV, Random, 95% CI) | 1.86 [0.45, 3.27] |
| 6.4 Mixed | 1 | 1998 | Mean Difference (IV, Random, 95% CI) | 0.10 [‐1.00, 1.20] |
| 6.5 Other | 3 | 157 | Mean Difference (IV, Random, 95% CI) | 2.24 [‐0.83, 5.31] |
| 7 Perinatal death Show forest plot | 10 | 7416 | Risk Ratio (M‐H, Fixed, 95% CI) | 0.75 [0.54, 1.03] |
| Analysis 3.7  Comparison 3 Dose (DHA/EPA) subgroups, Outcome 7 Perinatal death. | ||||
| 7.1 Low: < 500 mg/day | 2 | 1127 | Risk Ratio (M‐H, Fixed, 95% CI) | 0.52 [0.20, 1.33] |
| 7.2 Mid: 500 mg‐1 g/day | 3 | 2566 | Risk Ratio (M‐H, Fixed, 95% CI) | 0.41 [0.16, 1.02] |
| 7.3 High: > 1 g/day | 5 | 3723 | Risk Ratio (M‐H, Fixed, 95% CI) | 0.89 [0.61, 1.29] |
| 8 Stillbirth Show forest plot | 16 | 7880 | Risk Ratio (M‐H, Fixed, 95% CI) | 0.94 [0.62, 1.42] |
| Analysis 3.8  Comparison 3 Dose (DHA/EPA) subgroups, Outcome 8 Stillbirth. | ||||
| 8.1 Low: < 500 mg/day | 1 | 977 | Risk Ratio (M‐H, Fixed, 95% CI) | 0.67 [0.11, 3.96] |
| 8.2 Mid: 500 mg/day‐1 g/day | 5 | 2783 | Risk Ratio (M‐H, Fixed, 95% CI) | 0.70 [0.27, 1.83] |
| 8.3 High: > 1 g/day | 7 | 3933 | Risk Ratio (M‐H, Fixed, 95% CI) | 1.03 [0.62, 1.69] |
| 8.4 Other | 3 | 187 | Risk Ratio (M‐H, Fixed, 95% CI) | 1.16 [0.23, 5.94] |
| 9 Neonatal death Show forest plot | 9 | 7448 | Risk Ratio (M‐H, Fixed, 95% CI) | 0.61 [0.34, 1.11] |
| Analysis 3.9  Comparison 3 Dose (DHA/EPA) subgroups, Outcome 9 Neonatal death. | ||||
| 9.1 Low: < 500 mg/day | 2 | 1123 | Risk Ratio (M‐H, Fixed, 95% CI) | 0.47 [0.15, 1.44] |
| 9.2 Mid: 500 mg/day‐1 g/day | 2 | 2700 | Risk Ratio (M‐H, Fixed, 95% CI) | 0.50 [0.12, 1.98] |
| 9.3 High: > 1 g/day | 5 | 3625 | Risk Ratio (M‐H, Fixed, 95% CI) | 0.78 [0.34, 1.78] |
| 10 Low birthweight (< 2500 g) Show forest plot | 15 | 8449 | Risk Ratio (M‐H, Fixed, 95% CI) | 0.90 [0.82, 0.99] |
| Analysis 3.10  Comparison 3 Dose (DHA/EPA) subgroups, Outcome 10 Low birthweight (< 2500 g). | ||||
| 10.1 Low: < 500 mg/day | 5 | 1551 | Risk Ratio (M‐H, Fixed, 95% CI) | 0.74 [0.51, 1.08] |
| 10.2 Mid: 500 mg‐1 g/day | 5 | 3901 | Risk Ratio (M‐H, Fixed, 95% CI) | 0.71 [0.54, 0.92] |
| 10.3 High: > 1 g/day | 5 | 2997 | Risk Ratio (M‐H, Fixed, 95% CI) | 0.97 [0.88, 1.08] |
| 11 Small‐for‐gestational age/IUGR Show forest plot | 8 | 6907 | Risk Ratio (M‐H, Fixed, 95% CI) | 1.01 [0.90, 1.13] |
| Analysis 3.11  Comparison 3 Dose (DHA/EPA) subgroups, Outcome 11 Small‐for‐gestational age/IUGR. | ||||
| 11.1 Low: < 500 mg/day | 1 | 973 | Risk Ratio (M‐H, Fixed, 95% CI) | 1.04 [0.73, 1.48] |
| 11.2 Mid: 500 mg‐1 g/day | 2 | 3369 | Risk Ratio (M‐H, Fixed, 95% CI) | 0.85 [0.66, 1.09] |
| 11.3 High: > 1 g/day | 4 | 2506 | Risk Ratio (M‐H, Fixed, 95% CI) | 1.07 [0.93, 1.23] |
| 11.4 Other | 1 | 59 | Risk Ratio (M‐H, Fixed, 95% CI) | 2.07 [0.20, 21.60] |
| 12 Birthweight (g) Show forest plot | 44 | 11584 | Mean Difference (IV, Random, 95% CI) | 75.30 [38.09, 112.50] |
| Analysis 3.12  Comparison 3 Dose (DHA/EPA) subgroups, Outcome 12 Birthweight (g). | ||||
| 12.1 Low: < 500 mg/day | 12 | 2220 | Mean Difference (IV, Random, 95% CI) | 26.32 [‐12.74, 65.39] |
| 12.2 Mid: 500 mg‐1 g/day | 18 | 5007 | Mean Difference (IV, Random, 95% CI) | 91.49 [24.34, 158.64] |
| 12.3 High: > 1 g/day | 14 | 4298 | Mean Difference (IV, Random, 95% CI) | 88.31 [29.61, 147.01] |
| 12.4 Other | 1 | 59 | Mean Difference (IV, Random, 95% CI) | ‐203.20 [‐456.97, 50.57] |
| Outcome or subgroup title | No. of studies | No. of participants | Statistical method | Effect size |
| 1 Preterm birth (< 37 weeks) Show forest plot | 26 | 10304 | Risk Ratio (M‐H, Fixed, 95% CI) | 0.89 [0.81, 0.97] |
| Analysis 4.1  Comparison 4 Timing subgroups, Outcome 1 Preterm birth (< 37 weeks). | ||||
| 1.1 ≤ 20 weeks GA start | 12 | 6563 | Risk Ratio (M‐H, Fixed, 95% CI) | 0.85 [0.76, 0.95] |
| 1.2 > 20 weeks GA start | 13 | 3693 | Risk Ratio (M‐H, Fixed, 95% CI) | 1.01 [0.82, 1.23] |
| 1.3 Mixed | 1 | 48 | Risk Ratio (M‐H, Fixed, 95% CI) | 0.11 [0.01, 2.22] |
| 2 Early preterm birth (< 34 weeks) Show forest plot | 9 | 5204 | Risk Ratio (M‐H, Fixed, 95% CI) | 0.58 [0.44, 0.77] |
| Analysis 4.2  Comparison 4 Timing subgroups, Outcome 2 Early preterm birth (< 34 weeks). | ||||
| 2.1 ≤ 20 weeks GA start | 8 | 5090 | Risk Ratio (M‐H, Fixed, 95% CI) | 0.56 [0.43, 0.75] |
| 2.2 > 20 weeks GA start | 1 | 114 | Risk Ratio (M‐H, Fixed, 95% CI) | 4.83 [0.24, 98.44] |
| 3 Prolonged gestation (> 42 weeks) Show forest plot | 6 | 5141 | Risk Ratio (M‐H, Fixed, 95% CI) | 1.61 [1.11, 2.33] |
| Analysis 4.3  Comparison 4 Timing subgroups, Outcome 3 Prolonged gestation (> 42 weeks). | ||||
| 3.1 ≤ 20 weeks GA start | 5 | 4608 | Risk Ratio (M‐H, Fixed, 95% CI) | 2.35 [1.29, 4.28] |
| 3.2 > 20 weeks GA start | 1 | 533 | Risk Ratio (M‐H, Fixed, 95% CI) | 1.19 [0.73, 1.93] |
| 4 Pre‐eclampsia (hypertension with proteinuria) Show forest plot | 20 | 8306 | Risk Ratio (M‐H, Fixed, 95% CI) | 0.84 [0.69, 1.01] |
| Analysis 4.4  Comparison 4 Timing subgroups, Outcome 4 Pre‐eclampsia (hypertension with proteinuria). | ||||
| 4.1 ≤ 20 weeks GA start | 13 | 6296 | Risk Ratio (M‐H, Fixed, 95% CI) | 0.92 [0.74, 1.15] |
| 4.2 > 20 weeks GA start | 6 | 1883 | Risk Ratio (M‐H, Fixed, 95% CI) | 0.79 [0.53, 1.18] |
| 4.3 Not reported | 1 | 127 | Risk Ratio (M‐H, Fixed, 95% CI) | 0.07 [0.01, 0.54] |
| 5 Caesarean section Show forest plot | 28 | 8481 | Risk Ratio (M‐H, Fixed, 95% CI) | 0.97 [0.91, 1.03] |
| Analysis 4.5  Comparison 4 Timing subgroups, Outcome 5 Caesarean section. | ||||
| 5.1 ≤ 20 weeks GA start | 13 | 4995 | Risk Ratio (M‐H, Fixed, 95% CI) | 0.97 [0.88, 1.07] |
| 5.2 > 20 weeks GA start | 14 | 2617 | Risk Ratio (M‐H, Fixed, 95% CI) | 0.98 [0.87, 1.10] |
| 5.3 Mixed | 1 | 869 | Risk Ratio (M‐H, Fixed, 95% CI) | 0.95 [0.83, 1.08] |
| 6 Length of gestation (days) Show forest plot | 43 | 12517 | Mean Difference (IV, Random, 95% CI) | 1.67 [0.95, 2.39] |
| Analysis 4.6  Comparison 4 Timing subgroups, Outcome 6 Length of gestation (days). | ||||
| 6.1 ≤ 20 weeks GA start | 23 | 9396 | Mean Difference (IV, Random, 95% CI) | 1.99 [1.08, 2.90] |
| 6.2 > 20 weeks GA start | 20 | 3121 | Mean Difference (IV, Random, 95% CI) | 1.18 [‐0.05, 2.40] |
| 7 Perinatal death Show forest plot | 10 | 7416 | Risk Ratio (M‐H, Fixed, 95% CI) | 0.75 [0.54, 1.03] |
| Analysis 4.7  Comparison 4 Timing subgroups, Outcome 7 Perinatal death. | ||||
| 7.1 ≤ 20 weeks GA start | 6 | 5815 | Risk Ratio (M‐H, Fixed, 95% CI) | 0.72 [0.49, 1.07] |
| 7.2 > 20 weeks GA start | 4 | 1601 | Risk Ratio (M‐H, Fixed, 95% CI) | 0.79 [0.46, 1.38] |
| 8 Stillbirth Show forest plot | 16 | 7880 | Risk Ratio (M‐H, Fixed, 95% CI) | 0.94 [0.62, 1.42] |
| Analysis 4.8  Comparison 4 Timing subgroups, Outcome 8 Stillbirth. | ||||
| 8.1 ≤ 20 weeks GA start | 8 | 5537 | Risk Ratio (M‐H, Fixed, 95% CI) | 0.88 [0.52, 1.48] |
| 8.2 > 20 weeks GA start | 7 | 2295 | Risk Ratio (M‐H, Fixed, 95% CI) | 1.02 [0.50, 2.07] |
| 8.3 Mixed | 1 | 48 | Risk Ratio (M‐H, Fixed, 95% CI) | 1.69 [0.07, 39.30] |
| 9 Neonatal death Show forest plot | 9 | 7448 | Risk Ratio (M‐H, Fixed, 95% CI) | 0.61 [0.34, 1.11] |
| Analysis 4.9  Comparison 4 Timing subgroups, Outcome 9 Neonatal death. | ||||
| 9.1 ≤ 20 weeks GA start | 6 | 5415 | Risk Ratio (M‐H, Fixed, 95% CI) | 0.60 [0.26, 1.36] |
| 9.2 > 20 weeks GA start | 3 | 2033 | Risk Ratio (M‐H, Fixed, 95% CI) | 0.62 [0.26, 1.49] |
| 10 Low birthweight (< 2500 g) Show forest plot | 15 | 8449 | Risk Ratio (M‐H, Fixed, 95% CI) | 0.90 [0.82, 0.99] |
| Analysis 4.10  Comparison 4 Timing subgroups, Outcome 10 Low birthweight (< 2500 g). | ||||
| 10.1 ≤ 20 weeks GA start | 9 | 6553 | Risk Ratio (M‐H, Fixed, 95% CI) | 0.88 [0.79, 0.97] |
| 10.2 > 20 weeks GA start | 6 | 1896 | Risk Ratio (M‐H, Fixed, 95% CI) | 1.02 [0.81, 1.28] |
| 11 Small‐for‐gestational age/IUGR Show forest plot | 8 | 6907 | Risk Ratio (M‐H, Fixed, 95% CI) | 1.01 [0.90, 1.13] |
| Analysis 4.11  Comparison 4 Timing subgroups, Outcome 11 Small‐for‐gestational age/IUGR. | ||||
| 11.1 ≤ 20 weeks GA start | 5 | 5643 | Risk Ratio (M‐H, Fixed, 95% CI) | 1.00 [0.88, 1.14] |
| 11.2 > 20 weeks GA start | 3 | 1264 | Risk Ratio (M‐H, Fixed, 95% CI) | 1.03 [0.79, 1.34] |
| 12 Birthweight (g) Show forest plot | 43 | 11584 | Mean Difference (IV, Random, 95% CI) | 75.69 [37.84, 113.55] |
| Analysis 4.12  Comparison 4 Timing subgroups, Outcome 12 Birthweight (g). | ||||
| 12.1 ≤ 20 weeks GA start | 25 | 7802 | Mean Difference (IV, Random, 95% CI) | 83.26 [44.09, 122.43] |
| 12.2 > 20 weeks GA start | 17 | 3747 | Mean Difference (IV, Random, 95% CI) | 42.96 [‐34.14, 120.06] |
| 12.3 Not reported | 1 | 35 | Mean Difference (IV, Random, 95% CI) | 200.0 [‐205.07, 605.07] |
| Outcome or subgroup title | No. of studies | No. of participants | Statistical method | Effect size |
| 1 Preterm birth (< 37 weeks) Show forest plot | 26 | 10304 | Risk Ratio (M‐H, Fixed, 95% CI) | 0.89 [0.81, 0.97] |
| Analysis 5.1  Comparison 5 DHA/mixed subgroups, Outcome 1 Preterm birth (< 37 weeks). | ||||
| 1.1 DHA/largely DHA | 12 | 4744 | Risk Ratio (M‐H, Fixed, 95% CI) | 0.84 [0.69, 1.02] |
| 1.2 Mixed DHA/EPA | 9 | 4172 | Risk Ratio (M‐H, Fixed, 95% CI) | 0.92 [0.83, 1.03] |
| 1.3 Mixed DHA/EPA/other | 5 | 1388 | Risk Ratio (M‐H, Fixed, 95% CI) | 0.71 [0.45, 1.11] |
| 2 Early preterm birth (< 34 weeks) Show forest plot | 9 | 5204 | Risk Ratio (M‐H, Fixed, 95% CI) | 0.58 [0.44, 0.77] |
| Analysis 5.2  Comparison 5 DHA/mixed subgroups, Outcome 2 Early preterm birth (< 34 weeks). | ||||
| 2.1 DHA/largely DHA | 5 | 3260 | Risk Ratio (M‐H, Fixed, 95% CI) | 0.46 [0.28, 0.76] |
| 2.2 Mixed DHA/EPA | 2 | 860 | Risk Ratio (M‐H, Fixed, 95% CI) | 0.69 [0.49, 0.99] |
| 2.3 Mixed DHA/EPA/other | 2 | 1084 | Risk Ratio (M‐H, Fixed, 95% CI) | 0.41 [0.14, 1.25] |
| 3 Prolonged gestation (> 42 weeks) Show forest plot | 6 | 5141 | Risk Ratio (M‐H, Fixed, 95% CI) | 1.61 [1.11, 2.33] |
| Analysis 5.3  Comparison 5 DHA/mixed subgroups, Outcome 3 Prolonged gestation (> 42 weeks). | ||||
| 3.1 DHA/largely DHA | 3 | 2847 | Risk Ratio (M‐H, Fixed, 95% CI) | 2.12 [0.60, 7.49] |
| 3.2 Mixed DHA/EPA | 2 | 2106 | Risk Ratio (M‐H, Fixed, 95% CI) | 1.54 [1.04, 2.28] |
| 3.3 Mixed DHA/EPA/other | 1 | 188 | Risk Ratio (M‐H, Fixed, 95% CI) | 3.13 [0.13, 75.84] |
| 4 Pre‐eclampsia (hypertension with proteinuria) Show forest plot | 20 | 8306 | Risk Ratio (M‐H, Fixed, 95% CI) | 0.84 [0.69, 1.01] |
| Analysis 5.4  Comparison 5 DHA/mixed subgroups, Outcome 4 Pre‐eclampsia (hypertension with proteinuria). | ||||
| 4.1 DHA/largely DHA | 6 | 3454 | Risk Ratio (M‐H, Fixed, 95% CI) | 0.98 [0.71, 1.33] |
| 4.2 Mixed DHA/EPA | 9 | 3506 | Risk Ratio (M‐H, Fixed, 95% CI) | 0.90 [0.69, 1.18] |
| 4.3 Mixed DHA/EPA/other | 5 | 1346 | Risk Ratio (M‐H, Fixed, 95% CI) | 0.40 [0.23, 0.71] |
| 5 Caesarean section Show forest plot | 28 | 8481 | Risk Ratio (M‐H, Fixed, 95% CI) | 0.97 [0.91, 1.03] |
| Analysis 5.5  Comparison 5 DHA/mixed subgroups, Outcome 5 Caesarean section. | ||||
| 5.1 DHA/largely DHA | 9 | 4327 | Risk Ratio (M‐H, Fixed, 95% CI) | 0.95 [0.87, 1.03] |
| 5.2 Mixed DHA/EPA | 10 | 2433 | Risk Ratio (M‐H, Fixed, 95% CI) | 1.10 [0.95, 1.27] |
| 5.3 Mixed DHA/EPA/other | 9 | 1721 | Risk Ratio (M‐H, Fixed, 95% CI) | 0.88 [0.75, 1.02] |
| 6 Gestational length (days) Show forest plot | 43 | 12517 | Mean Difference (IV, Random, 95% CI) | 1.67 [0.95, 2.39] |
| Analysis 5.6  Comparison 5 DHA/mixed subgroups, Outcome 6 Gestational length (days). | ||||
| 6.1 DHA/largely DHA | 14 | 4791 | Mean Difference (IV, Random, 95% CI) | 2.44 [0.91, 3.98] |
| 6.2 Mixed DHA/EPA | 17 | 5760 | Mean Difference (IV, Random, 95% CI) | 1.23 [0.21, 2.24] |
| 6.3 Mixed DHA/EPA/other | 12 | 1966 | Mean Difference (IV, Random, 95% CI) | 1.42 [0.33, 2.50] |
| 7 Perinatal death Show forest plot | 10 | 7416 | Risk Ratio (M‐H, Fixed, 95% CI) | 0.75 [0.54, 1.03] |
| Analysis 5.7  Comparison 5 DHA/mixed subgroups, Outcome 7 Perinatal death. | ||||
| 7.1 DHA/largely DHA | 3 | 3475 | Risk Ratio (M‐H, Fixed, 95% CI) | 0.44 [0.21, 0.91] |
| 7.2 Mixed DHA/EPA | 6 | 3873 | Risk Ratio (M‐H, Fixed, 95% CI) | 0.88 [0.60, 1.27] |
| 7.3 Mixed DHA/EPA/other | 1 | 68 | Risk Ratio (M‐H, Fixed, 95% CI) | 0.67 [0.12, 3.74] |
| 8 Stillbirth Show forest plot | 16 | 7880 | Risk Ratio (M‐H, Fixed, 95% CI) | 0.94 [0.62, 1.42] |
| Analysis 5.8  Comparison 5 DHA/mixed subgroups, Outcome 8 Stillbirth. | ||||
| 8.1 DHA/largely DHA | 5 | 3639 | Risk Ratio (M‐H, Fixed, 95% CI) | 0.69 [0.28, 1.70] |
| 8.2 Mixed DHA/EPA | 8 | 3987 | Risk Ratio (M‐H, Fixed, 95% CI) | 1.06 [0.65, 1.73] |
| 8.3 Mixed DHA/EPA/other | 3 | 254 | Risk Ratio (M‐H, Fixed, 95% CI) | 0.70 [0.14, 3.51] |
| 9 Neonatal death Show forest plot | 9 | 7448 | Risk Ratio (M‐H, Fixed, 95% CI) | 0.61 [0.34, 1.11] |
| Analysis 5.9  Comparison 5 DHA/mixed subgroups, Outcome 9 Neonatal death. | ||||
| 9.1 DHA/largely DHA | 3 | 3673 | Risk Ratio (M‐H, Fixed, 95% CI) | 0.50 [0.20, 1.23] |
| 9.2 Mixed DHA/EPA | 6 | 3775 | Risk Ratio (M‐H, Fixed, 95% CI) | 0.73 [0.33, 1.62] |
| 10 Low birthweight (< 2500 g) Show forest plot | 15 | 8449 | Risk Ratio (M‐H, Fixed, 95% CI) | 0.90 [0.82, 0.99] |
| Analysis 5.10  Comparison 5 DHA/mixed subgroups, Outcome 10 Low birthweight (< 2500 g). | ||||
| 10.1 DHA/largely DHA | 6 | 4118 | Risk Ratio (M‐H, Fixed, 95% CI) | 0.72 [0.56, 0.93] |
| 10.2 Mixed DHA/EPA | 6 | 3147 | Risk Ratio (M‐H, Fixed, 95% CI) | 0.96 [0.87, 1.07] |
| 10.3 Mixed DHA/EPA/other | 3 | 1184 | Risk Ratio (M‐H, Fixed, 95% CI) | 0.78 [0.51, 1.18] |
| 11 Small‐for‐gestational age/IUGR Show forest plot | 8 | 6907 | Risk Ratio (M‐H, Fixed, 95% CI) | 1.01 [0.90, 1.13] |
| Analysis 5.11  Comparison 5 DHA/mixed subgroups, Outcome 11 Small‐for‐gestational age/IUGR. | ||||
| 11.1 DHA/largely DHA | 2 | 3372 | Risk Ratio (M‐H, Fixed, 95% CI) | 0.95 [0.75, 1.20] |
| 11.2 Mixed DHA/EPA | 4 | 2506 | Risk Ratio (M‐H, Fixed, 95% CI) | 1.07 [0.93, 1.23] |
| 11.3 Mixed EPA/DHA/other | 2 | 1029 | Risk Ratio (M‐H, Fixed, 95% CI) | 0.78 [0.50, 1.22] |
| 12 Birthweight (g) Show forest plot | 43 | 11584 | Mean Difference (IV, Random, 95% CI) | 75.69 [37.84, 113.55] |
| Analysis 5.12  Comparison 5 DHA/mixed subgroups, Outcome 12 Birthweight (g). | ||||
| 12.1 DHA/largely DHA | 17 | 6121 | Mean Difference (IV, Random, 95% CI) | 52.60 [26.96, 78.23] |
| 12.2 Mixed DHA/EPA | 15 | 4429 | Mean Difference (IV, Random, 95% CI) | 72.72 [6.67, 138.78] |
| 12.3 Mixed DHA/EPA/other | 11 | 1034 | Mean Difference (IV, Random, 95% CI) | 113.65 [12.54, 214.75] |
| Outcome or subgroup title | No. of studies | No. of participants | Statistical method | Effect size |
| 1 Preterm birth (< 37 weeks) Show forest plot | 27 | 10304 | Risk Ratio (M‐H, Fixed, 95% CI) | 0.89 [0.81, 0.97] |
| Analysis 6.1  Comparison 6 Risk subgroups, Outcome 1 Preterm birth (< 37 weeks). | ||||
| 1.1 Increased/high risk | 12 | 3702 | Risk Ratio (M‐H, Fixed, 95% CI) | 0.92 [0.83, 1.03] |
| 1.2 Low risk | 10 | 3241 | Risk Ratio (M‐H, Fixed, 95% CI) | 0.92 [0.71, 1.20] |
| 1.3 Any/mixed risk | 5 | 3361 | Risk Ratio (M‐H, Fixed, 95% CI) | 0.71 [0.54, 0.93] |
| 2 Early preterm birth (< 34 weeks) Show forest plot | 10 | 5204 | Risk Ratio (M‐H, Fixed, 95% CI) | 0.58 [0.44, 0.77] |
| Analysis 6.2  Comparison 6 Risk subgroups, Outcome 2 Early preterm birth (< 34 weeks). | ||||
| 2.1 Increased/high risk | 6 | 2104 | Risk Ratio (M‐H, Fixed, 95% CI) | 0.67 [0.49, 0.93] |
| 2.2 Low risk | 3 | 701 | Risk Ratio (M‐H, Fixed, 95% CI) | 0.31 [0.12, 0.79] |
| 2.3 Any/mixed risk | 1 | 2399 | Risk Ratio (M‐H, Fixed, 95% CI) | 0.48 [0.25, 0.93] |
| 3 Prolonged gestation (> 42 weeks) Show forest plot | 6 | 5141 | Risk Ratio (M‐H, Fixed, 95% CI) | 1.61 [1.11, 2.33] |
| Analysis 6.3  Comparison 6 Risk subgroups, Outcome 3 Prolonged gestation (> 42 weeks). | ||||
| 3.1 Increased/high risk | 1 | 1573 | Risk Ratio (M‐H, Fixed, 95% CI) | 2.39 [1.19, 4.80] |
| 3.2 Low risk | 4 | 1201 | Risk Ratio (M‐H, Fixed, 95% CI) | 1.26 [0.79, 2.01] |
| 3.3 Any/mixed risk | 1 | 2367 | Risk Ratio (M‐H, Fixed, 95% CI) | 2.00 [0.50, 7.97] |
| 4 Pre‐eclampsia (hypertension with proteinuria) Show forest plot | 20 | 8306 | Risk Ratio (M‐H, Fixed, 95% CI) | 0.84 [0.69, 1.01] |
| Analysis 6.4  Comparison 6 Risk subgroups, Outcome 4 Pre‐eclampsia (hypertension with proteinuria). | ||||
| 4.1 Increased/high risk | 12 | 3564 | Risk Ratio (M‐H, Fixed, 95% CI) | 0.76 [0.59, 0.99] |
| 4.2 Low risk | 5 | 1507 | Risk Ratio (M‐H, Fixed, 95% CI) | 0.59 [0.28, 1.24] |
| 4.3 Any/mixed risk | 3 | 3235 | Risk Ratio (M‐H, Fixed, 95% CI) | 1.01 [0.74, 1.37] |
| 5 Caesarean section Show forest plot | 29 | 8481 | Risk Ratio (M‐H, Fixed, 95% CI) | 0.97 [0.91, 1.03] |
| Analysis 6.5  Comparison 6 Risk subgroups, Outcome 5 Caesarean section. | ||||
| 5.1 Increased/high risk | 12 | 2046 | Risk Ratio (M‐H, Fixed, 95% CI) | 0.92 [0.80, 1.05] |
| 5.2 Low risk | 14 | 3185 | Risk Ratio (M‐H, Fixed, 95% CI) | 0.99 [0.89, 1.09] |
| 5.3 Any/mixed risk | 3 | 3250 | Risk Ratio (M‐H, Fixed, 95% CI) | 0.98 [0.87, 1.10] |
| 6 Length of gestation (days) Show forest plot | 43 | 12517 | Mean Difference (IV, Random, 95% CI) | 1.67 [0.95, 2.39] |
| Analysis 6.6  Comparison 6 Risk subgroups, Outcome 6 Length of gestation (days). | ||||
| 6.1 Increased/high risk | 18 | 3707 | Mean Difference (IV, Random, 95% CI) | 2.17 [0.65, 3.68] |
| 6.2 Low risk | 22 | 4330 | Mean Difference (IV, Random, 95% CI) | 1.41 [0.52, 2.29] |
| 6.3 Any/mixed group | 3 | 4480 | Mean Difference (IV, Random, 95% CI) | 1.27 [‐0.36, 2.91] |
| 7 Perinatal death Show forest plot | 10 | 7416 | Risk Ratio (M‐H, Fixed, 95% CI) | 0.75 [0.54, 1.03] |
| Analysis 6.7  Comparison 6 Risk subgroups, Outcome 7 Perinatal death. | ||||
| 7.1 Increased/high risk | 6 | 3566 | Risk Ratio (M‐H, Fixed, 95% CI) | 0.84 [0.56, 1.26] |
| 7.2 Low risk | 2 | 1127 | Risk Ratio (M‐H, Fixed, 95% CI) | 0.52 [0.20, 1.33] |
| 7.3 Any/mixed risk | 2 | 2723 | Risk Ratio (M‐H, Fixed, 95% CI) | 0.67 [0.35, 1.26] |
| 8 Stillbirth Show forest plot | 16 | 7880 | Risk Ratio (M‐H, Fixed, 95% CI) | 0.94 [0.62, 1.42] |
| Analysis 6.8  Comparison 6 Risk subgroups, Outcome 8 Stillbirth. | ||||
| 8.1 Increased/high risk | 9 | 3137 | Risk Ratio (M‐H, Fixed, 95% CI) | 1.06 [0.65, 1.72] |
| 8.2 Low risk | 5 | 2296 | Risk Ratio (M‐H, Fixed, 95% CI) | 1.13 [0.40, 3.23] |
| 8.3 Any/mixed risk | 2 | 2447 | Risk Ratio (M‐H, Fixed, 95% CI) | 0.27 [0.06, 1.27] |
| 9 Neonatal death Show forest plot | 9 | 7448 | Risk Ratio (M‐H, Fixed, 95% CI) | 0.61 [0.34, 1.11] |
| Analysis 6.9  Comparison 6 Risk subgroups, Outcome 9 Neonatal death. | ||||
| 9.1 Increased/high risk | 4 | 2889 | Risk Ratio (M‐H, Fixed, 95% CI) | 0.78 [0.34, 1.78] |
| 9.2 Low risk | 3 | 1424 | Risk Ratio (M‐H, Fixed, 95% CI) | 0.52 [0.19, 1.45] |
| 9.3 Any/mixed risk | 2 | 3135 | Risk Ratio (M‐H, Fixed, 95% CI) | 0.40 [0.08, 2.07] |
| 10 Low birthweight (< 2500 g) Show forest plot | 15 | 8449 | Risk Ratio (M‐H, Fixed, 95% CI) | 0.90 [0.82, 0.99] |
| Analysis 6.10  Comparison 6 Risk subgroups, Outcome 10 Low birthweight (< 2500 g). | ||||
| 10.1 Increased/high risk | 7 | 4081 | Risk Ratio (M‐H, Fixed, 95% CI) | 0.96 [0.87, 1.07] |
| 10.2 Low risk | 6 | 1869 | Risk Ratio (M‐H, Fixed, 95% CI) | 0.73 [0.52, 1.02] |
| 10.3 Any/mixed risk | 2 | 2499 | Risk Ratio (M‐H, Fixed, 95% CI) | 0.63 [0.44, 0.92] |
| 11 Small‐for‐gestational age/IUGR Show forest plot | 8 | 6907 | Risk Ratio (M‐H, Fixed, 95% CI) | 1.01 [0.90, 1.13] |
| Analysis 6.11  Comparison 6 Risk subgroups, Outcome 11 Small‐for‐gestational age/IUGR. | ||||
| 11.1 Increased/high risk | 6 | 3535 | Risk Ratio (M‐H, Fixed, 95% CI) | 1.03 [0.90, 1.18] |
| 11.2 Low risk | 1 | 973 | Risk Ratio (M‐H, Fixed, 95% CI) | 1.04 [0.73, 1.48] |
| 11.3 Any/mixed risk | 1 | 2399 | Risk Ratio (M‐H, Fixed, 95% CI) | 0.89 [0.66, 1.21] |
| 12 Birthweight (g) Show forest plot | 43 | 11584 | Mean Difference (IV, Random, 95% CI) | 75.69 [37.84, 113.55] |
| Analysis 6.12  Comparison 6 Risk subgroups, Outcome 12 Birthweight (g). | ||||
| 12.1 Increased/high risk | 19 | 4848 | Mean Difference (IV, Random, 95% CI) | 105.52 [30.84, 180.21] |
| 12.2 Low risk | 23 | 4337 | Mean Difference (IV, Random, 95% CI) | 46.63 [13.90, 79.36] |
| 12.3 Any/mixed group | 1 | 2399 | Mean Difference (IV, Random, 95% CI) | 68.0 [22.38, 113.62] |
| Outcome or subgroup title | No. of studies | No. of participants | Statistical method | Effect size |
| 1 Early preterm birth < 34 weeks Show forest plot | 1 | 224 | Risk Ratio (M‐H, Fixed, 95% CI) | 0.91 [0.13, 6.38] |
| Analysis 7.1  Comparison 7 Omega‐3 doses: direct comparisons, Outcome 1 Early preterm birth < 34 weeks. | ||||
| 2 Prolonged gestation > 42 weeks Show forest plot | 1 | 224 | Risk Ratio (M‐H, Fixed, 95% CI) | 0.91 [0.06, 14.44] |
| Analysis 7.2  Comparison 7 Omega‐3 doses: direct comparisons, Outcome 2 Prolonged gestation > 42 weeks. | ||||
| 3 Pre‐eclampsia Show forest plot | 1 | 224 | Risk Ratio (M‐H, Fixed, 95% CI) | 0.91 [0.06, 14.44] |
| Analysis 7.3  Comparison 7 Omega‐3 doses: direct comparisons, Outcome 3 Pre‐eclampsia. | ||||
| 4 Induction (post‐term) Show forest plot | 1 | 224 | Risk Ratio (M‐H, Fixed, 95% CI) | 0.10 [0.01, 1.87] |
| Analysis 7.4  Comparison 7 Omega‐3 doses: direct comparisons, Outcome 4 Induction (post‐term). | ||||
| 5 PROM Show forest plot | 1 | 224 | Risk Ratio (M‐H, Fixed, 95% CI) | 0.30 [0.03, 2.89] |
| Analysis 7.5  Comparison 7 Omega‐3 doses: direct comparisons, Outcome 5 PROM. | ||||
| 6 PPROM Show forest plot | 1 | 224 | Risk Ratio (M‐H, Fixed, 95% CI) | 1.22 [0.28, 5.32] |
| Analysis 7.6  Comparison 7 Omega‐3 doses: direct comparisons, Outcome 6 PPROM. | ||||
| 7 Length of gestation Show forest plot | 2 | 1474 | Mean Difference (IV, Fixed, 95% CI) | 0.24 [‐1.16, 1.64] |
| Analysis 7.7  Comparison 7 Omega‐3 doses: direct comparisons, Outcome 7 Length of gestation. | ||||
| 8 Birthweight (g) Show forest plot | 1 | 224 | Mean Difference (IV, Fixed, 95% CI) | ‐110.35 [‐242.80, 22.10] |
| Analysis 7.8  Comparison 7 Omega‐3 doses: direct comparisons, Outcome 8 Birthweight (g). | ||||
| 9 Length at birth (cm) Show forest plot | 1 | 224 | Mean Difference (IV, Fixed, 95% CI) | 0.05 [‐0.80, 0.90] |
| Analysis 7.9  Comparison 7 Omega‐3 doses: direct comparisons, Outcome 9 Length at birth (cm). | ||||
| 10 Head circumference at birth (cm) Show forest plot | 1 | 224 | Mean Difference (IV, Fixed, 95% CI) | ‐0.24 [‐0.87, 0.39] |
| Analysis 7.10  Comparison 7 Omega‐3 doses: direct comparisons, Outcome 10 Head circumference at birth (cm). | ||||
| Outcome or subgroup title | No. of studies | No. of participants | Statistical method | Effect size |
| 1 Gestational diabetes Show forest plot | 2 | Risk Ratio (M‐H, Fixed, 95% CI) | Subtotals only | |
| Analysis 8.1  Comparison 8 Omega‐3 type: direct comparisons, Outcome 1 Gestational diabetes. | ||||
| 1.1 DHA versus EPA | 1 | 77 | Risk Ratio (M‐H, Fixed, 95% CI) | 0.15 [0.02, 1.14] |
| 1.2 DHA versus DHA/AA | 1 | 86 | Risk Ratio (M‐H, Fixed, 95% CI) | 0.33 [0.01, 7.96] |
| 2 Caesarean section Show forest plot | 1 | 77 | Risk Ratio (M‐H, Fixed, 95% CI) | 1.23 [0.61, 2.51] |
| Analysis 8.2  Comparison 8 Omega‐3 type: direct comparisons, Outcome 2 Caesarean section. | ||||
| 2.1 DHA versus EPA | 1 | 77 | Risk Ratio (M‐H, Fixed, 95% CI) | 1.23 [0.61, 2.51] |
| 3 Adverse events: cessation Show forest plot | 1 | Risk Ratio (M‐H, Fixed, 95% CI) | Subtotals only | |
| Analysis 8.3  Comparison 8 Omega‐3 type: direct comparisons, Outcome 3 Adverse events: cessation. | ||||
| 3.1 DHA versus EPA | 1 | 77 | Risk Ratio (M‐H, Fixed, 95% CI) | 0.82 [0.24, 2.83] |
| 4 Pre‐eclampsia Show forest plot | 1 | 77 | Risk Ratio (M‐H, Fixed, 95% CI) | 0.26 [0.06, 1.13] |
| Analysis 8.4  Comparison 8 Omega‐3 type: direct comparisons, Outcome 4 Pre‐eclampsia. | ||||
| 4.1 DHA versus EPA | 1 | 77 | Risk Ratio (M‐H, Fixed, 95% CI) | 0.26 [0.06, 1.13] |
| 5 Blood loss at birth (mL) Show forest plot | 1 | 77 | Mean Difference (IV, Fixed, 95% CI) | 1.0 [‐181.94, 183.94] |
| Analysis 8.5  Comparison 8 Omega‐3 type: direct comparisons, Outcome 5 Blood loss at birth (mL). | ||||
| 5.1 DHA versus EPA | 1 | 77 | Mean Difference (IV, Fixed, 95% CI) | 1.0 [‐181.94, 183.94] |
| 6 Depressive symptoms postpartum: thresholds Show forest plot | 1 | Risk Ratio (M‐H, Fixed, 95% CI) | Subtotals only | |
| Analysis 8.6  Comparison 8 Omega‐3 type: direct comparisons, Outcome 6 Depressive symptoms postpartum: thresholds. | ||||
| 6.1 Major depressive disorder at 6‐8 weeks | 1 | 77 | Risk Ratio (M‐H, Fixed, 95% CI) | 0.68 [0.12, 3.87] |
| 7 Depressive symptoms postpartum: scores Show forest plot | 1 | Mean Difference (IV, Fixed, 95% CI) | Subtotals only | |
| Analysis 8.7  Comparison 8 Omega‐3 type: direct comparisons, Outcome 7 Depressive symptoms postpartum: scores. | ||||
| 7.1 BDI: 6‐8 weeks postpartum | 1 | 77 | Mean Difference (IV, Fixed, 95% CI) | ‐1.40 [‐3.75, 0.95] |
| 8 Length of gestation (days) Show forest plot | 3 | Mean Difference (IV, Fixed, 95% CI) | Subtotals only | |
| Analysis 8.8  Comparison 8 Omega‐3 type: direct comparisons, Outcome 8 Length of gestation (days). | ||||
| 8.1 DHA versus EPA | 1 | 77 | Mean Difference (IV, Fixed, 95% CI) | 9.10 [5.24, 12.96] |
| 8.2 EPA/DHA vs ALA | 1 | 1250 | Mean Difference (IV, Fixed, 95% CI) | ‐0.29 [‐2.33, 1.75] |
| 8.3 DHA versus DHA/AA | 1 | 83 | Mean Difference (IV, Fixed, 95% CI) | 0.0 [‐3.31, 3.31] |
| 9 Baby admitted to neonatal care Show forest plot | 1 | 78 | Risk Ratio (M‐H, Fixed, 95% CI) | 0.35 [0.08, 1.63] |
| Analysis 8.9  Comparison 8 Omega‐3 type: direct comparisons, Outcome 9 Baby admitted to neonatal care. | ||||
| 9.1 DHA versus EPA | 1 | 78 | Risk Ratio (M‐H, Fixed, 95% CI) | 0.35 [0.08, 1.63] |
| 10 Birthweight (g) Show forest plot | 2 | Mean Difference (IV, Fixed, 95% CI) | Subtotals only | |
| Analysis 8.10  Comparison 8 Omega‐3 type: direct comparisons, Outcome 10 Birthweight (g). | ||||
| 10.1 DHA versus EPA | 1 | 78 | Mean Difference (IV, Fixed, 95% CI) | 372.0 [151.90, 592.10] |
| 10.2 DHA versus DHA/AA | 1 | 83 | Mean Difference (IV, Fixed, 95% CI) | ‐79.0 [‐260.22, 102.22] |
| 11 Infant weight (kg) Show forest plot | 1 | Mean Difference (IV, Fixed, 95% CI) | Subtotals only | |
| Analysis 8.11  Comparison 8 Omega‐3 type: direct comparisons, Outcome 11 Infant weight (kg). | ||||
| 11.1 DHA versus DHA/AA | 1 | 80 | Mean Difference (IV, Fixed, 95% CI) | ‐0.20 [‐0.79, 0.39] |
| 12 Infant height (cm) Show forest plot | 1 | Mean Difference (IV, Fixed, 95% CI) | Subtotals only | |
| Analysis 8.12  Comparison 8 Omega‐3 type: direct comparisons, Outcome 12 Infant height (cm). | ||||
| 12.1 DHA versus DHA/AA | 1 | 80 | Mean Difference (IV, Fixed, 95% CI) | ‐0.80 [‐2.50, 0.90] |
| 13 Infant head circumference (cm) Show forest plot | 1 | Mean Difference (IV, Fixed, 95% CI) | Subtotals only | |
| Analysis 8.13  Comparison 8 Omega‐3 type: direct comparisons, Outcome 13 Infant head circumference (cm). | ||||
| 13.1 At 18 months | 1 | 80 | Mean Difference (IV, Fixed, 95% CI) | 0.10 [‐0.45, 0.65] |
| 14 Cognition: Scores Show forest plot | 1 | Mean Difference (IV, Fixed, 95% CI) | Subtotals only | |
| Analysis 8.14  Comparison 8 Omega‐3 type: direct comparisons, Outcome 14 Cognition: Scores. | ||||
| 14.1 DHA versus DHA/AA: BSID II | 1 | 80 | Mean Difference (IV, Fixed, 95% CI) | 0.90 [‐4.71, 6.51] |
| 15 Motor: Scores Show forest plot | 1 | Mean Difference (IV, Fixed, 95% CI) | Subtotals only | |
| Analysis 8.15  Comparison 8 Omega‐3 type: direct comparisons, Outcome 15 Motor: Scores. | ||||
| 15.1 DHA versus DHA/AA: BSID II | 1 | 79 | Mean Difference (IV, Fixed, 95% CI) | 3.40 [‐1.07, 7.87] |
| 16 Neurodevelopment Show forest plot | 1 | Risk Ratio (M‐H, Fixed, 95% CI) | Subtotals only | |
| Analysis 8.16  Comparison 8 Omega‐3 type: direct comparisons, Outcome 16 Neurodevelopment. | ||||
| 16.1 DHA versus DHA/AA: neonatal neurological classification: mildly/definitely abnormal at 2 weeks | 1 | 67 | Risk Ratio (M‐H, Fixed, 95% CI) | 0.73 [0.28, 1.87] |
| 16.2 DHA versus DHA/AA: general movement quality: mildly/definitely abnormal at 2 weeks | 1 | 67 | Risk Ratio (M‐H, Fixed, 95% CI) | 1.08 [0.68, 1.72] |
| 16.3 DHA versus DHA/AA: general movement quality: mildly/definitely abnormal at 12 weeks | 1 | 83 | Risk Ratio (M‐H, Fixed, 95% CI) | 1.81 [1.11, 2.95] |
| 17 Cerebral palsy Show forest plot | 1 | Risk Ratio (M‐H, Fixed, 95% CI) | Subtotals only | |
| Analysis 8.17  Comparison 8 Omega‐3 type: direct comparisons, Outcome 17 Cerebral palsy. | ||||
| 17.1 DHA versus DHA/AA | 1 | 80 | Risk Ratio (M‐H, Fixed, 95% CI) | 0.0 [0.0, 0.0] |
| Outcome or subgroup title | No. of studies | No. of participants | Statistical method | Effect size |
| 1 Preterm birth (< 37 weeks) Show forest plot | 12 | 6718 | Risk Ratio (M‐H, Fixed, 95% CI) | 0.92 [0.83, 1.02] |
| Analysis 9.1  Comparison 9 Sensitivity analysis: omega‐3 versus no omega‐3, Outcome 1 Preterm birth (< 37 weeks). | ||||
| 2 Early preterm birth (< 34 weeks) Show forest plot | 6 | 4073 | Risk Ratio (M‐H, Fixed, 95% CI) | 0.61 [0.46, 0.82] |
| Analysis 9.2  Comparison 9 Sensitivity analysis: omega‐3 versus no omega‐3, Outcome 2 Early preterm birth (< 34 weeks). | ||||
| 3 Prolonged gestation (> 42 weeks) Show forest plot | 3 | 4285 | Risk Ratio (M‐H, Fixed, 95% CI) | 2.32 [1.26, 4.28] |
| Analysis 9.3  Comparison 9 Sensitivity analysis: omega‐3 versus no omega‐3, Outcome 3 Prolonged gestation (> 42 weeks). | ||||
| 4 Pre‐eclampsia (hypertension with proteinuria) Show forest plot | 12 | 6104 | Risk Ratio (M‐H, Fixed, 95% CI) | 1.00 [0.81, 1.25] |
| Analysis 9.4  Comparison 9 Sensitivity analysis: omega‐3 versus no omega‐3, Outcome 4 Pre‐eclampsia (hypertension with proteinuria). | ||||
| 5 Caesarean section Show forest plot | 12 | 5239 | Risk Ratio (M‐H, Fixed, 95% CI) | 0.96 [0.89, 1.04] |
| Analysis 9.5  Comparison 9 Sensitivity analysis: omega‐3 versus no omega‐3, Outcome 5 Caesarean section. | ||||
| 6 Length of gestation (days) Show forest plot | 16 | 6313 | Mean Difference (IV, Fixed, 95% CI) | 1.42 [0.73, 2.11] |
| Analysis 9.6  Comparison 9 Sensitivity analysis: omega‐3 versus no omega‐3, Outcome 6 Length of gestation (days). | ||||
| 7 Perinatal death Show forest plot | 5 | 4610 | Risk Ratio (M‐H, Fixed, 95% CI) | 0.60 [0.37, 0.97] |
| Analysis 9.7  Comparison 9 Sensitivity analysis: omega‐3 versus no omega‐3, Outcome 7 Perinatal death. | ||||
| 8 Stillbirth Show forest plot | 10 | 6193 | Risk Ratio (M‐H, Fixed, 95% CI) | 0.80 [0.49, 1.31] |
| Analysis 9.8  Comparison 9 Sensitivity analysis: omega‐3 versus no omega‐3, Outcome 8 Stillbirth. | ||||
| 9 Neonatal death Show forest plot | 6 | 4791 | Risk Ratio (M‐H, Fixed, 95% CI) | 0.56 [0.25, 1.27] |
| Analysis 9.9  Comparison 9 Sensitivity analysis: omega‐3 versus no omega‐3, Outcome 9 Neonatal death. | ||||
| 10 Low birthweight (< 2500 g) Show forest plot | 10 | 6839 | Risk Ratio (M‐H, Random, 95% CI) | 0.87 [0.73, 1.04] |
| Analysis 9.10  Comparison 9 Sensitivity analysis: omega‐3 versus no omega‐3, Outcome 10 Low birthweight (< 2500 g). | ||||
| 11 Small‐for‐gestational age/IUGR Show forest plot | 6 | 5874 | Risk Ratio (M‐H, Fixed, 95% CI) | 1.03 [0.91, 1.16] |
| Analysis 9.11  Comparison 9 Sensitivity analysis: omega‐3 versus no omega‐3, Outcome 11 Small‐for‐gestational age/IUGR. | ||||
| 12 Birthweight (g) Show forest plot | 18 | 7382 | Mean Difference (IV, Fixed, 95% CI) | 48.84 [22.93, 74.76] |
| Analysis 9.12  Comparison 9 Sensitivity analysis: omega‐3 versus no omega‐3, Outcome 12 Birthweight (g). | ||||

Study flow diagram.

Risk of bias summary: review authors' judgements about each risk of bias item for each included study.
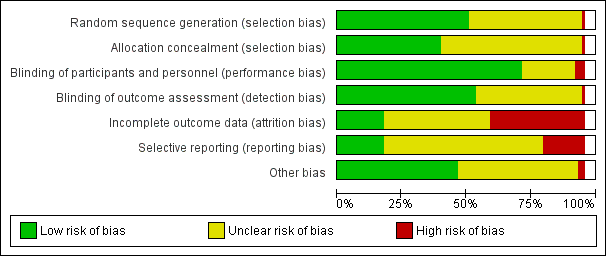
Risk of bias graph: review authors' judgements about each risk of bias item presented as percentages across all included studies.
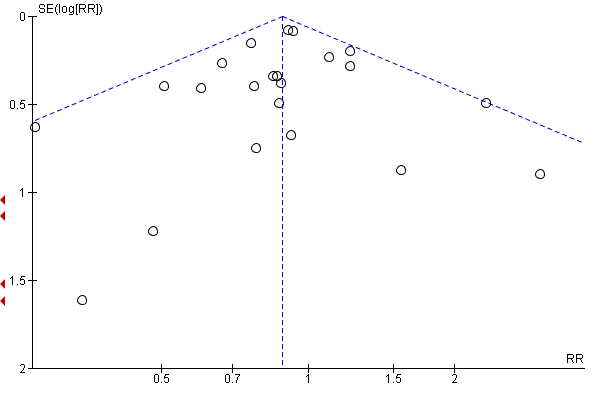
Funnel plot of comparison: 1 Omega‐3 versus placebo/no omega‐3: OVERALL, outcome: 1.7 Preterm birth (< 37 weeks).
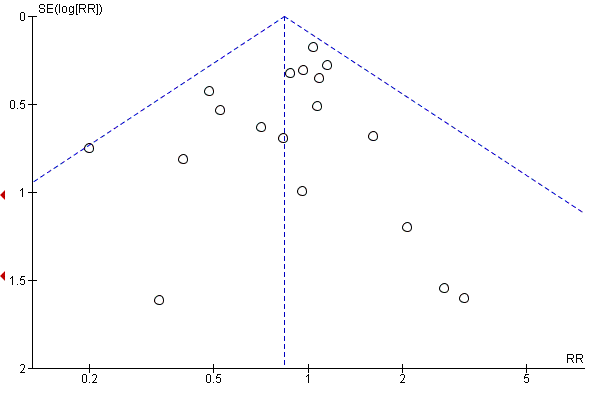
Funnel plot of comparison: 1 Omega‐3 versus placebo/no omega‐3: OVERALL, outcome: 1.4 Pre‐eclampsia (hypertension with proteinuria).

Funnel plot of comparison: 1 Omega‐3 versus placebo/no omega‐3: OVERALL, outcome: 1.16 Caesarean section.

Funnel plot of comparison: 1 Omega‐3 versus placebo/no omega‐3: OVERALL, outcome: 1.20 Gestational diabetes.
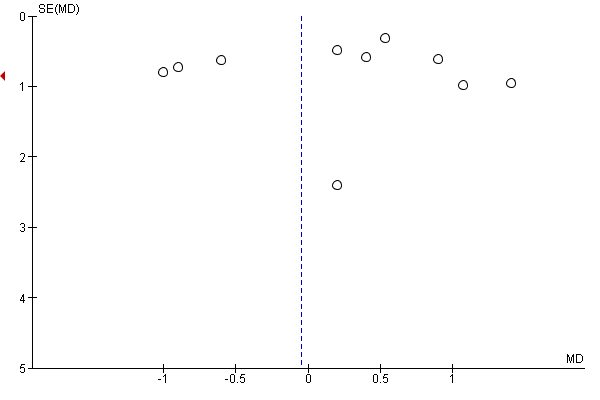
Funnel plot of comparison: 1 Overall: omega‐3 versus no omega‐3, outcome: 1.23 Gestational weight gain (kg).
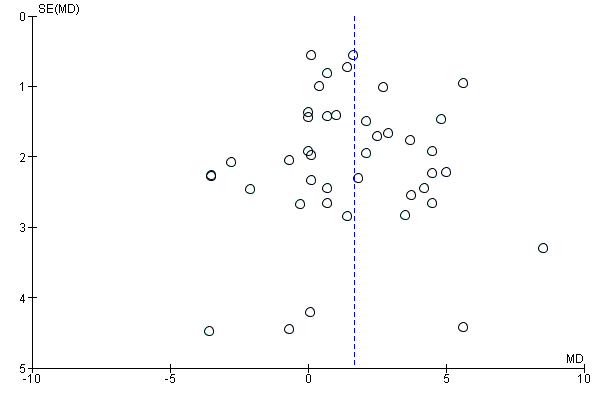
Funnel plot of comparison: 1 OVERALL omega‐3 versus placebo/no omega‐3, outcome: 1.31 Length of gestation (days).

Funnel plot of comparison: 1 OVERALL omega‐3 versus no omega‐3, outcome: 1.32 Perinatal death.

Funnel plot of comparison: 1 Omega‐3 versus placebo/no omega‐3: OVERALL, outcome: 1.32 Stillbirth.

Funnel plot of comparison: 1 Omega‐3 versus placebo/no omega‐3: OVERALL, outcome: 1.38 Low birthweight (< 2500 g).
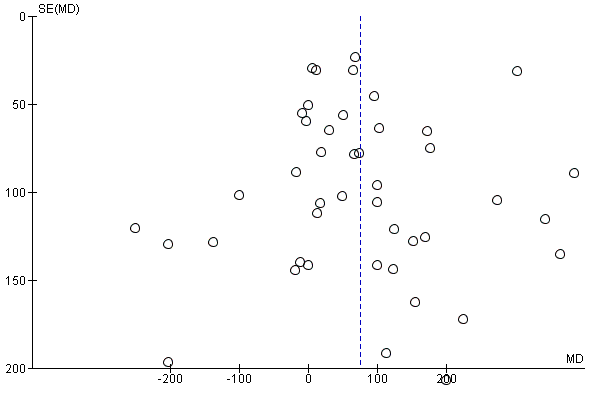
Funnel plot of comparison: 1 Omega‐3 versus placebo/no omega‐3: OVERALL, outcome: 1.41 Birthweight (g).
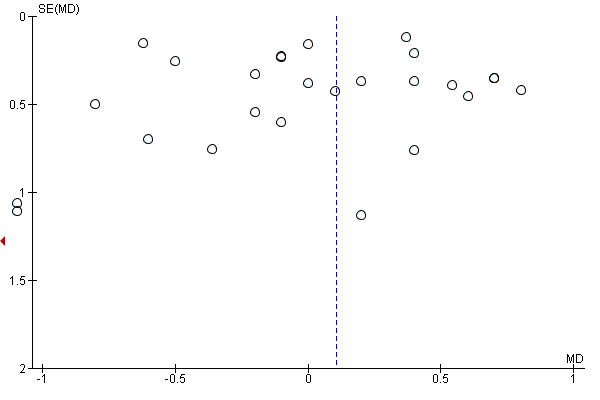
Funnel plot of comparison: 1 Omega‐3 versus placebo/no omega‐3: OVERALL, outcome: 1.43 Birth length (cm).

Funnel plot of comparison: 1 Omega‐3 versus placebo/no omega‐3: OVERALL, outcome: 1.45 Head circumference at birth (cm).

Comparison 1 Overall: omega‐3 versus no omega‐3, Outcome 1 Preterm birth (< 37 weeks).
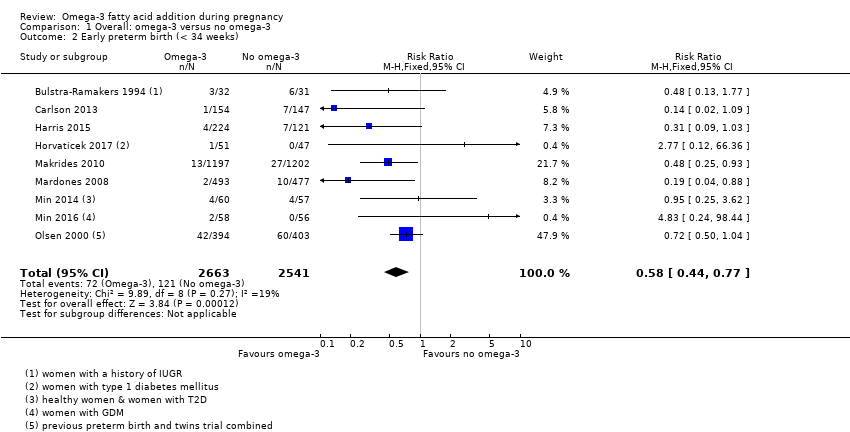
Comparison 1 Overall: omega‐3 versus no omega‐3, Outcome 2 Early preterm birth (< 34 weeks).

Comparison 1 Overall: omega‐3 versus no omega‐3, Outcome 3 Prolonged gestation (> 42 weeks).
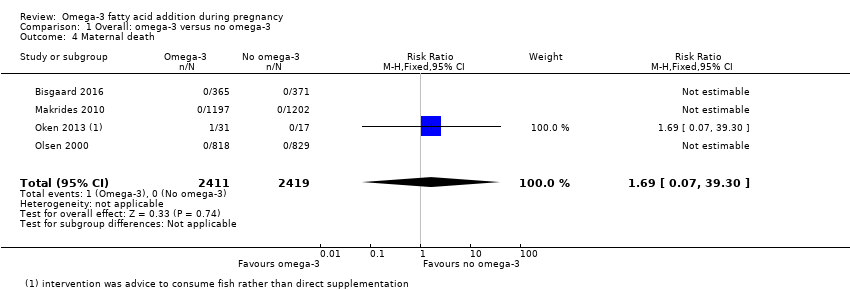
Comparison 1 Overall: omega‐3 versus no omega‐3, Outcome 4 Maternal death.
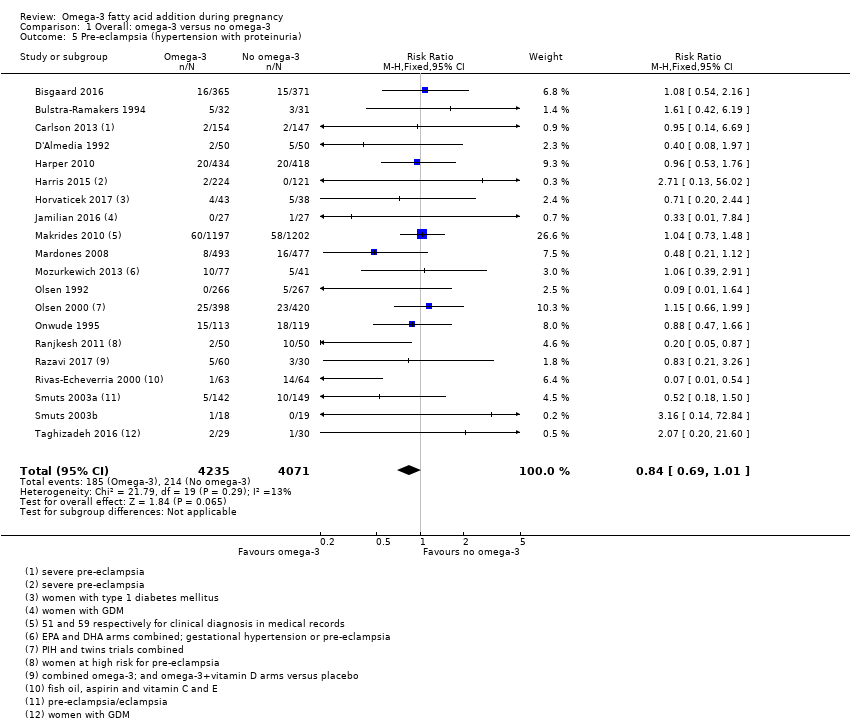
Comparison 1 Overall: omega‐3 versus no omega‐3, Outcome 5 Pre‐eclampsia (hypertension with proteinuria).
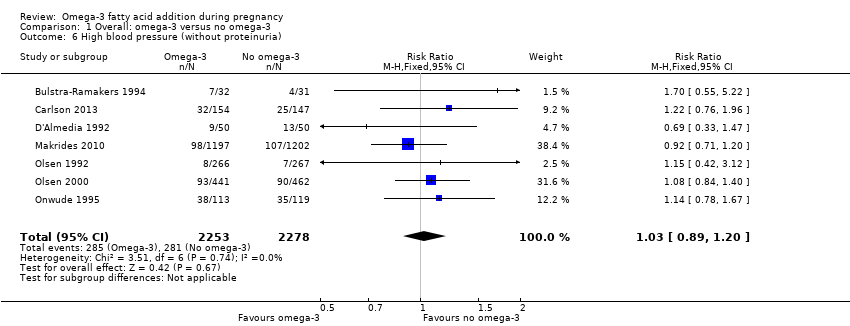
Comparison 1 Overall: omega‐3 versus no omega‐3, Outcome 6 High blood pressure (without proteinuria).
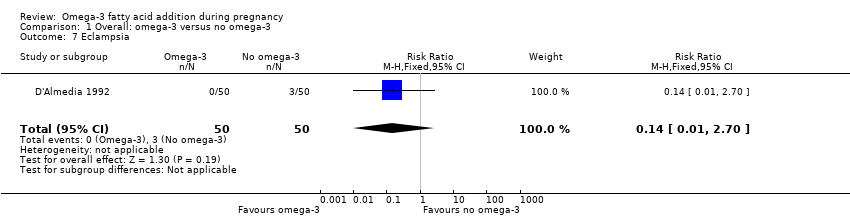
Comparison 1 Overall: omega‐3 versus no omega‐3, Outcome 7 Eclampsia.
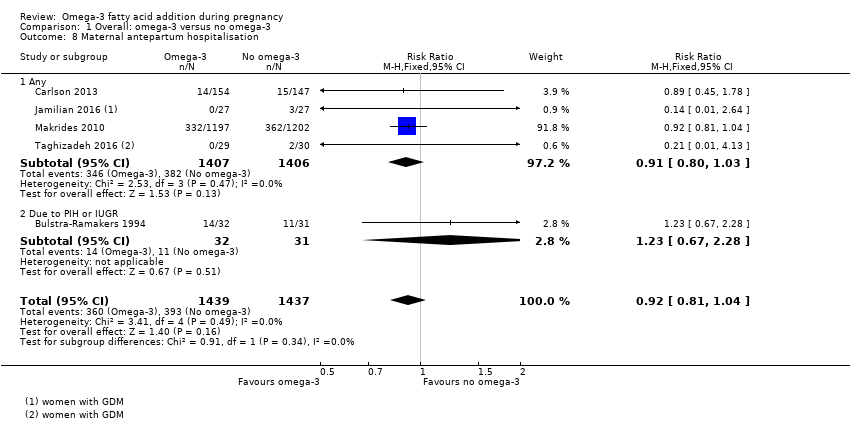
Comparison 1 Overall: omega‐3 versus no omega‐3, Outcome 8 Maternal antepartum hospitalisation.

Comparison 1 Overall: omega‐3 versus no omega‐3, Outcome 9 Mother's length of stay in hospital (days).

Comparison 1 Overall: omega‐3 versus no omega‐3, Outcome 10 Maternal anaemia.
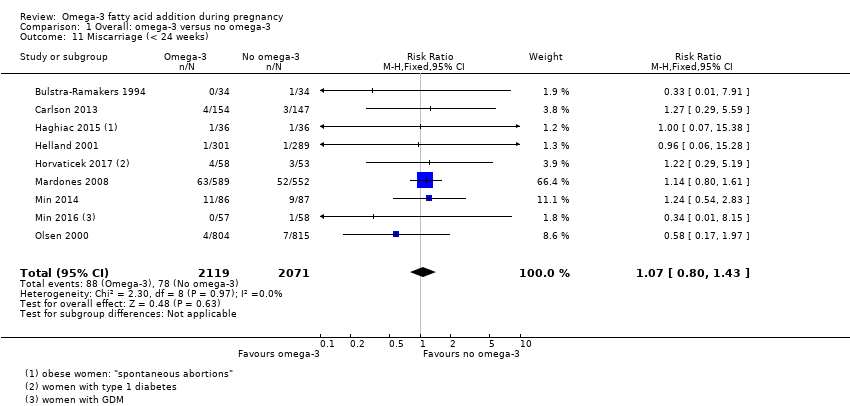
Comparison 1 Overall: omega‐3 versus no omega‐3, Outcome 11 Miscarriage (< 24 weeks).
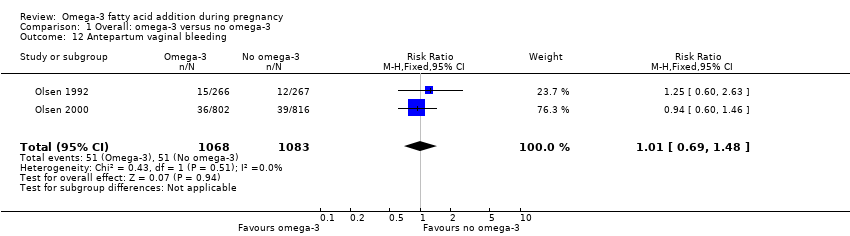
Comparison 1 Overall: omega‐3 versus no omega‐3, Outcome 12 Antepartum vaginal bleeding.

Comparison 1 Overall: omega‐3 versus no omega‐3, Outcome 13 Rupture of membranes (PPROM; PROM).

Comparison 1 Overall: omega‐3 versus no omega‐3, Outcome 14 Maternal admission to intensive care.

Comparison 1 Overall: omega‐3 versus no omega‐3, Outcome 15 Maternal adverse events.

Comparison 1 Overall: omega‐3 versus no omega‐3, Outcome 16 Caesarean section.

Comparison 1 Overall: omega‐3 versus no omega‐3, Outcome 17 Induction (post‐term).

Comparison 1 Overall: omega‐3 versus no omega‐3, Outcome 18 Blood loss at birth (mL).

Comparison 1 Overall: omega‐3 versus no omega‐3, Outcome 19 Postpartum haemorrhage.

Comparison 1 Overall: omega‐3 versus no omega‐3, Outcome 20 Gestational diabetes.

Comparison 1 Overall: omega‐3 versus no omega‐3, Outcome 21 Maternal insulin resistance (HOMA‐IR).

Comparison 1 Overall: omega‐3 versus no omega‐3, Outcome 22 Excessive gestational weight gain.

Comparison 1 Overall: omega‐3 versus no omega‐3, Outcome 23 Gestational weight gain (kg).

Comparison 1 Overall: omega‐3 versus no omega‐3, Outcome 24 Depression during pregnancy: thresholds.
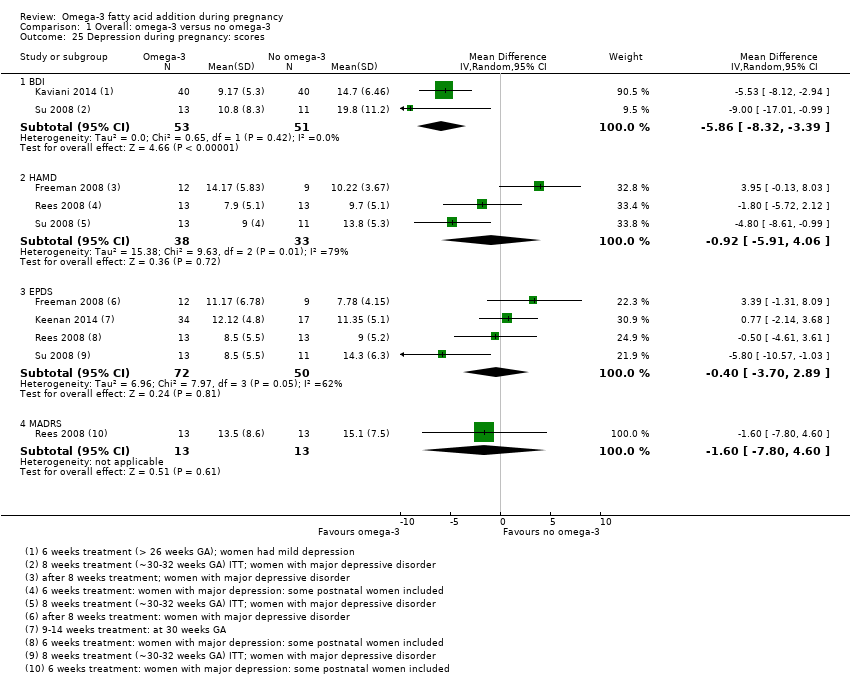
Comparison 1 Overall: omega‐3 versus no omega‐3, Outcome 25 Depression during pregnancy: scores.

Comparison 1 Overall: omega‐3 versus no omega‐3, Outcome 26 Anxiety during pregnancy.
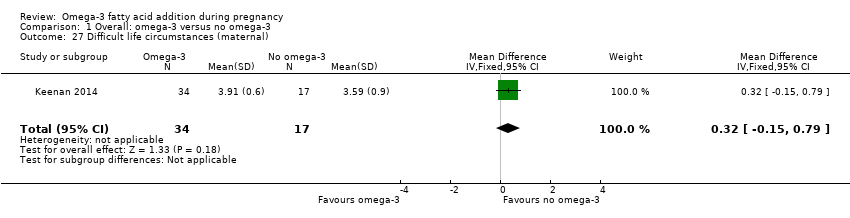
Comparison 1 Overall: omega‐3 versus no omega‐3, Outcome 27 Difficult life circumstances (maternal).
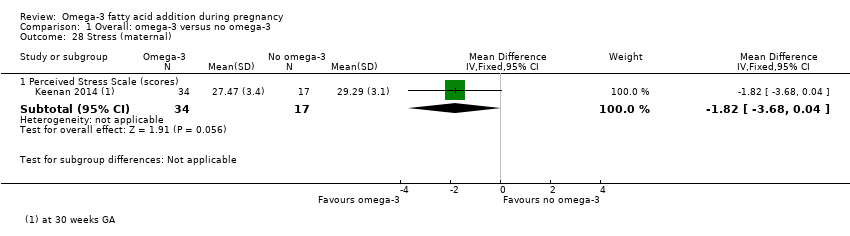
Comparison 1 Overall: omega‐3 versus no omega‐3, Outcome 28 Stress (maternal).
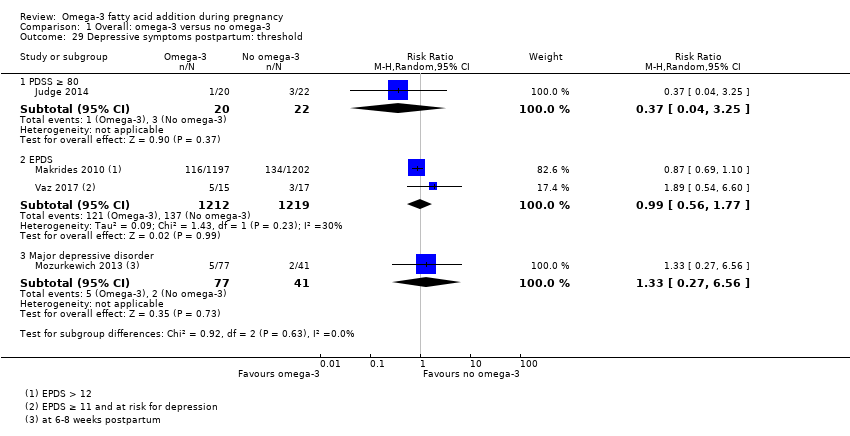
Comparison 1 Overall: omega‐3 versus no omega‐3, Outcome 29 Depressive symptoms postpartum: threshold.

Comparison 1 Overall: omega‐3 versus no omega‐3, Outcome 30 Depressive symptoms postpartum: scores.
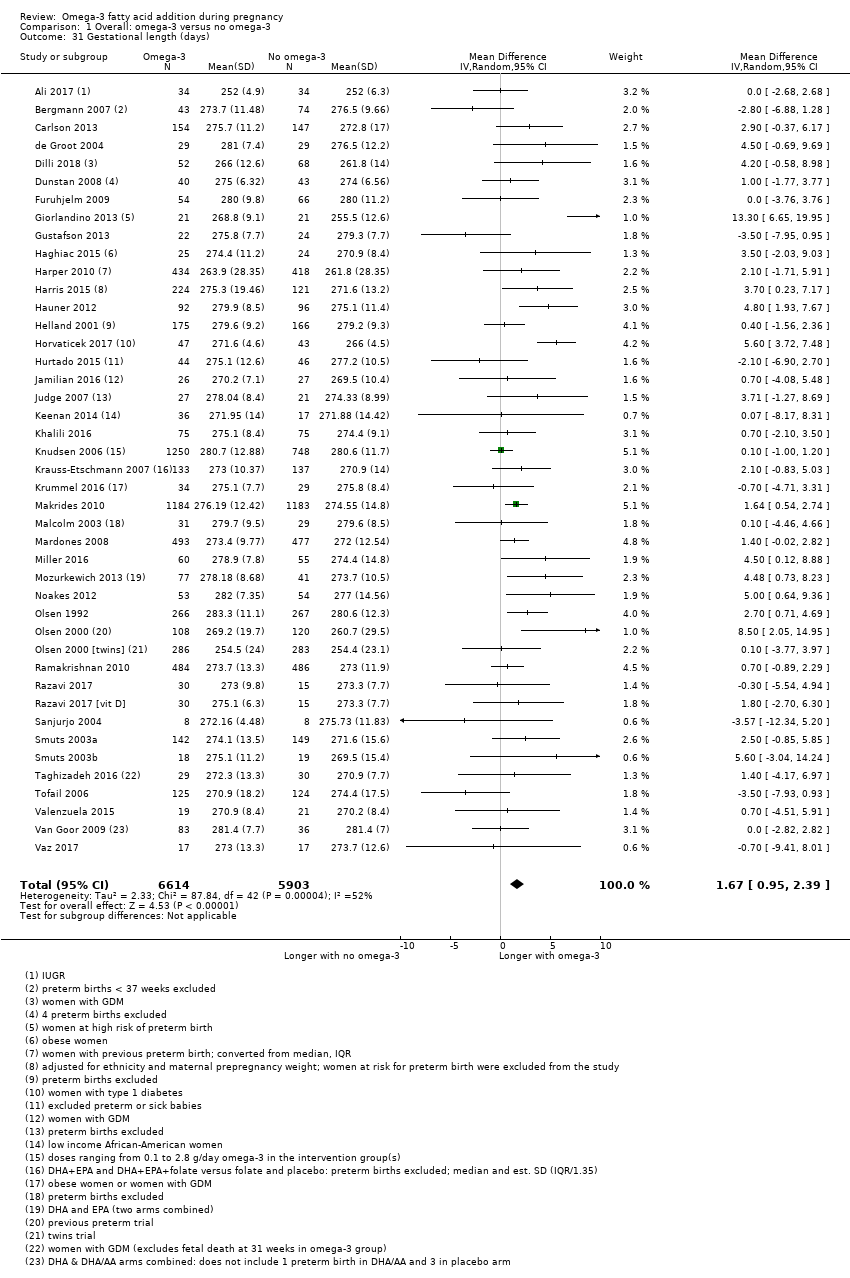
Comparison 1 Overall: omega‐3 versus no omega‐3, Outcome 31 Gestational length (days).
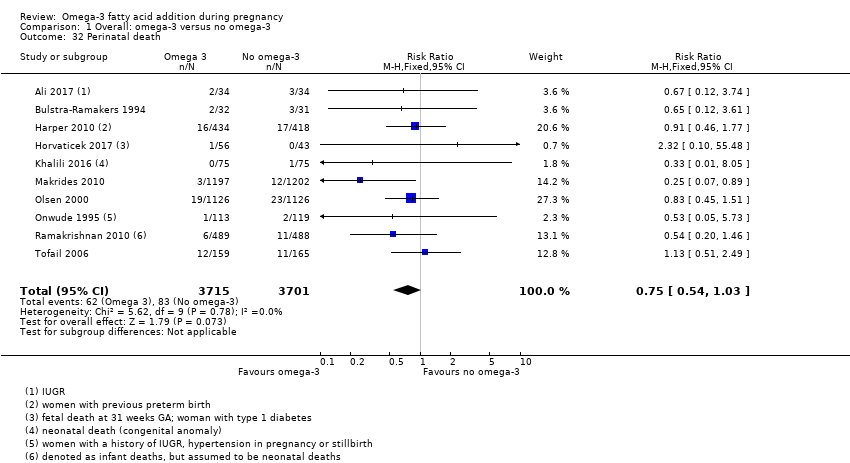
Comparison 1 Overall: omega‐3 versus no omega‐3, Outcome 32 Perinatal death.
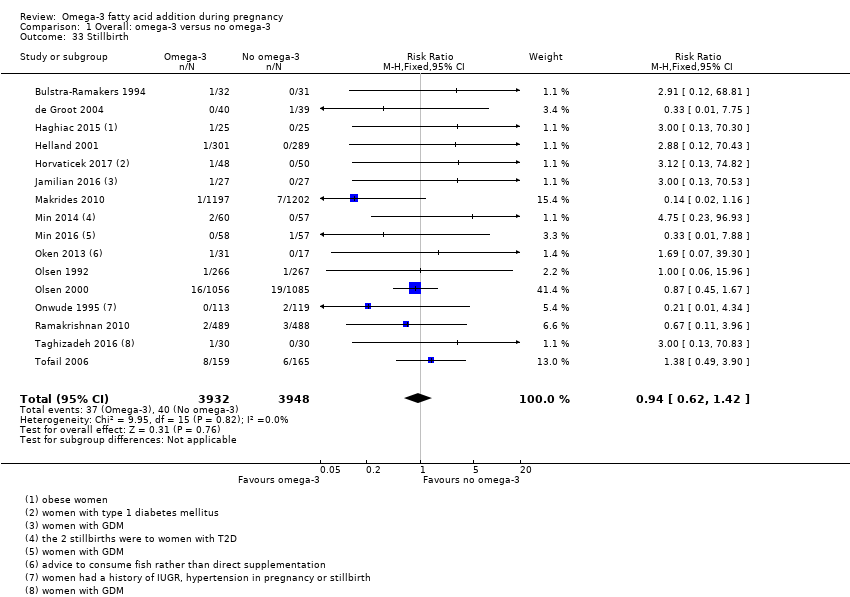
Comparison 1 Overall: omega‐3 versus no omega‐3, Outcome 33 Stillbirth.
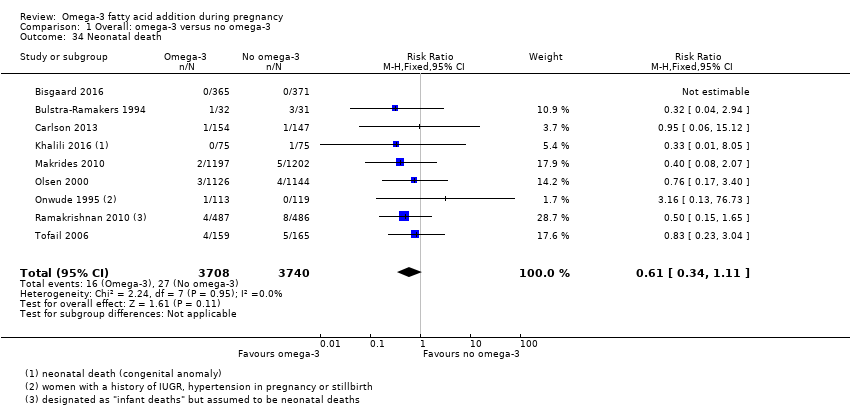
Comparison 1 Overall: omega‐3 versus no omega‐3, Outcome 34 Neonatal death.
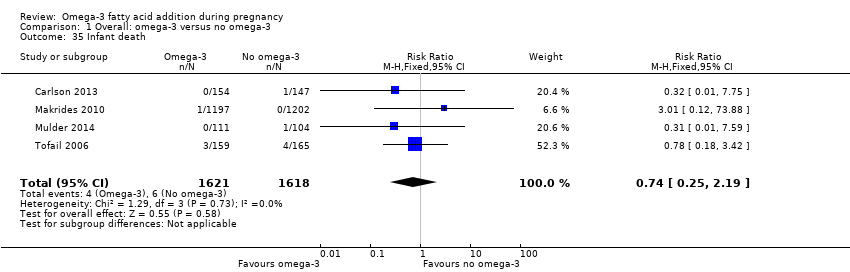
Comparison 1 Overall: omega‐3 versus no omega‐3, Outcome 35 Infant death.

Comparison 1 Overall: omega‐3 versus no omega‐3, Outcome 36 Large‐for‐gestational age.

Comparison 1 Overall: omega‐3 versus no omega‐3, Outcome 37 Macrosomia.
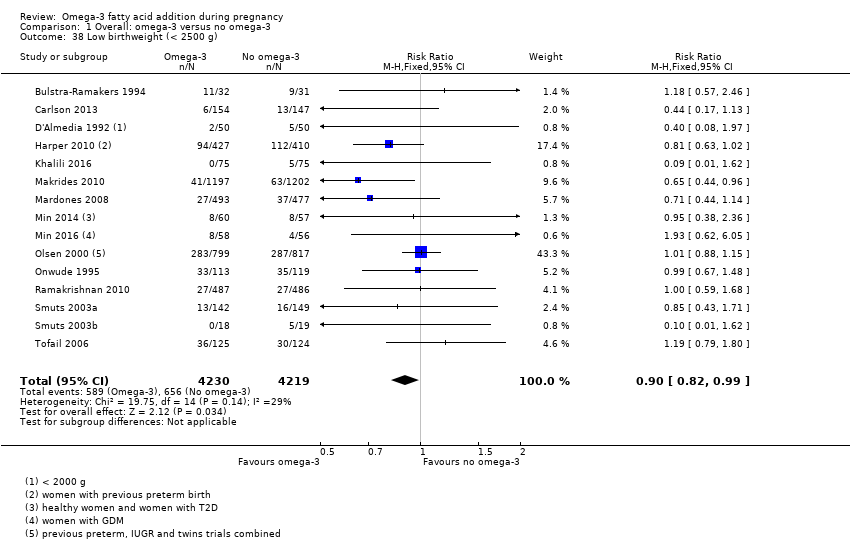
Comparison 1 Overall: omega‐3 versus no omega‐3, Outcome 38 Low birthweight (< 2500 g).

Comparison 1 Overall: omega‐3 versus no omega‐3, Outcome 39 Small‐for‐gestational age/IUGR.
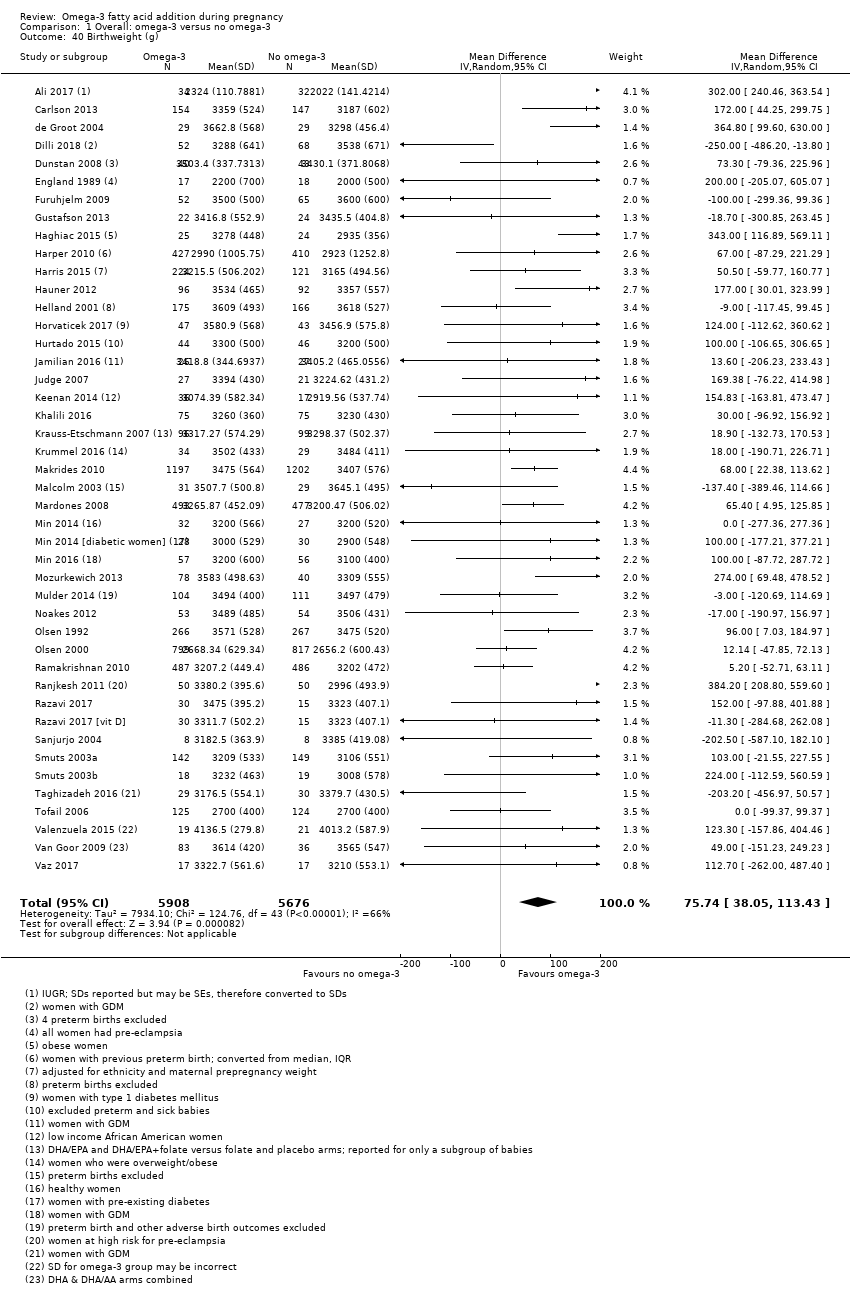
Comparison 1 Overall: omega‐3 versus no omega‐3, Outcome 40 Birthweight (g).

Comparison 1 Overall: omega‐3 versus no omega‐3, Outcome 41 Birthweight Z score.
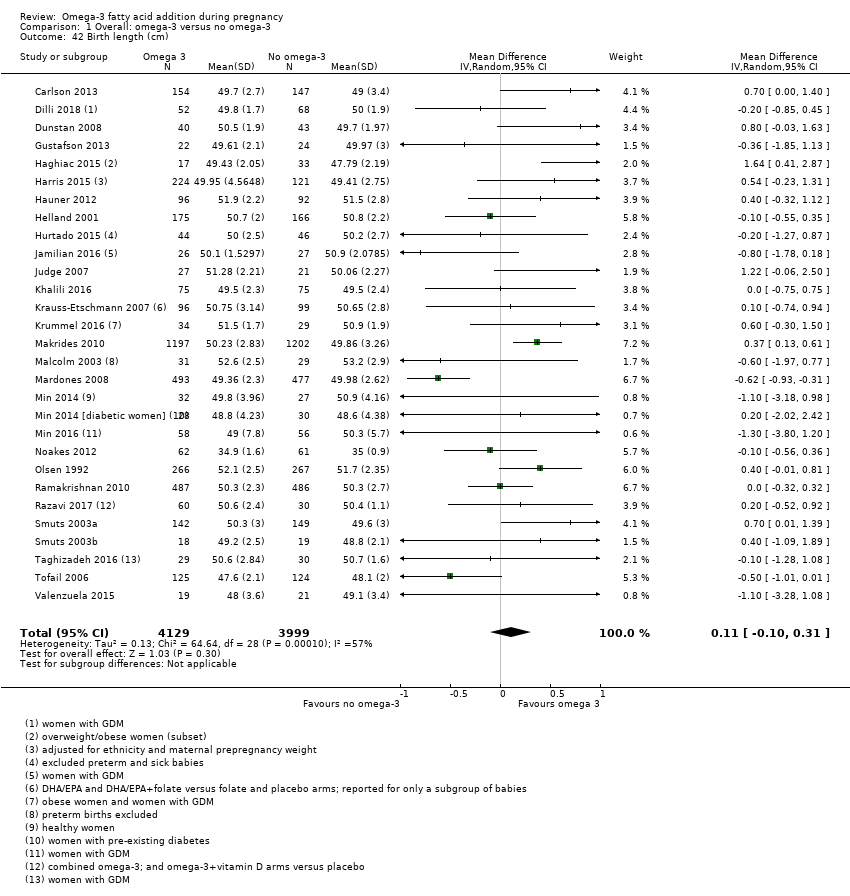
Comparison 1 Overall: omega‐3 versus no omega‐3, Outcome 42 Birth length (cm).

Comparison 1 Overall: omega‐3 versus no omega‐3, Outcome 43 Head circumference at birth (cm).
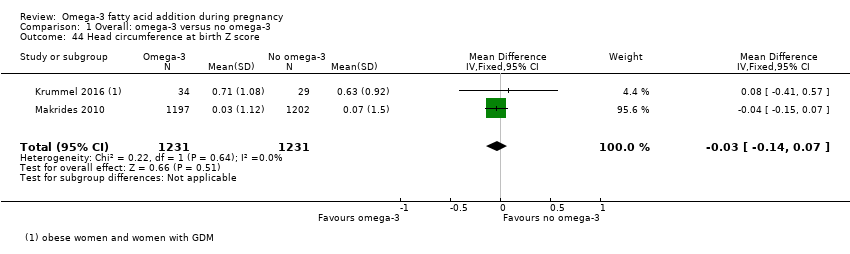
Comparison 1 Overall: omega‐3 versus no omega‐3, Outcome 44 Head circumference at birth Z score.

Comparison 1 Overall: omega‐3 versus no omega‐3, Outcome 45 Length at birth Z score.

Comparison 1 Overall: omega‐3 versus no omega‐3, Outcome 46 Baby admitted to neonatal care.
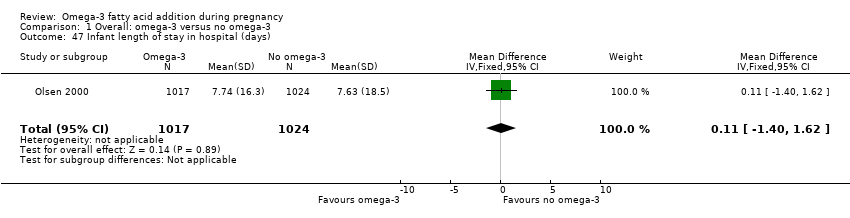
Comparison 1 Overall: omega‐3 versus no omega‐3, Outcome 47 Infant length of stay in hospital (days).

Comparison 1 Overall: omega‐3 versus no omega‐3, Outcome 48 Congenital anomalies.
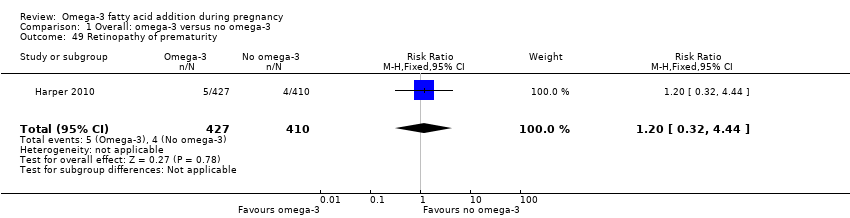
Comparison 1 Overall: omega‐3 versus no omega‐3, Outcome 49 Retinopathy of prematurity.

Comparison 1 Overall: omega‐3 versus no omega‐3, Outcome 50 Bronchopulmonary dysplasia.

Comparison 1 Overall: omega‐3 versus no omega‐3, Outcome 51 Respiratory distress syndrome.
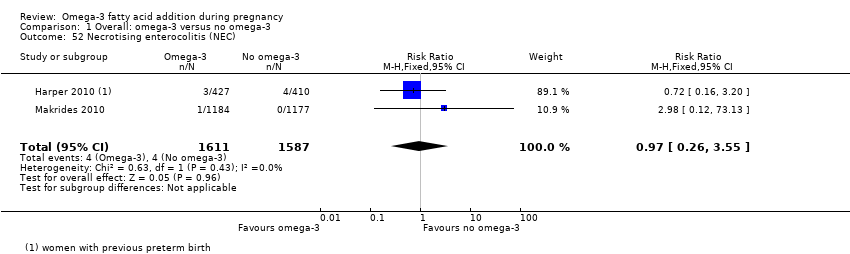
Comparison 1 Overall: omega‐3 versus no omega‐3, Outcome 52 Necrotising enterocolitis (NEC).

Comparison 1 Overall: omega‐3 versus no omega‐3, Outcome 53 Neonatal sepsis (proven).

Comparison 1 Overall: omega‐3 versus no omega‐3, Outcome 54 Convulsion.

Comparison 1 Overall: omega‐3 versus no omega‐3, Outcome 55 Intraventricular haemorrhage.
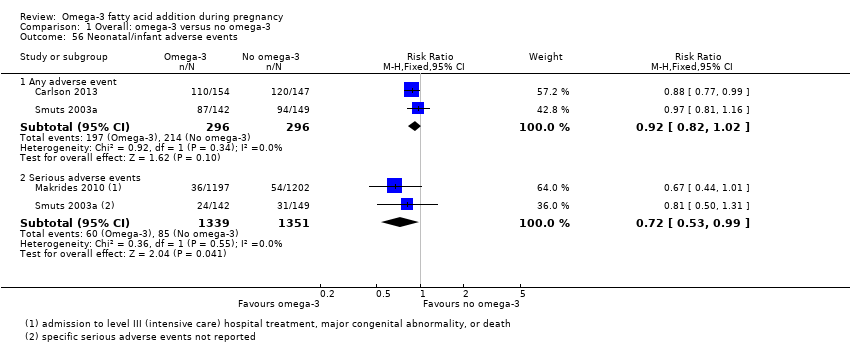
Comparison 1 Overall: omega‐3 versus no omega‐3, Outcome 56 Neonatal/infant adverse events.
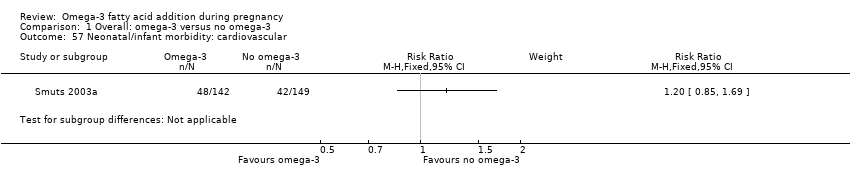
Comparison 1 Overall: omega‐3 versus no omega‐3, Outcome 57 Neonatal/infant morbidity: cardiovascular.

Comparison 1 Overall: omega‐3 versus no omega‐3, Outcome 58 Neonatal/infant morbidity: respiratory.

Comparison 1 Overall: omega‐3 versus no omega‐3, Outcome 59 Neonatal/infant morbidity: due to pregnancy/birth events.

Comparison 1 Overall: omega‐3 versus no omega‐3, Outcome 60 Neonatal/infant morbidity: other.

Comparison 1 Overall: omega‐3 versus no omega‐3, Outcome 61 Infant/child morbidity.

Comparison 1 Overall: omega‐3 versus no omega‐3, Outcome 62 Ponderal index.
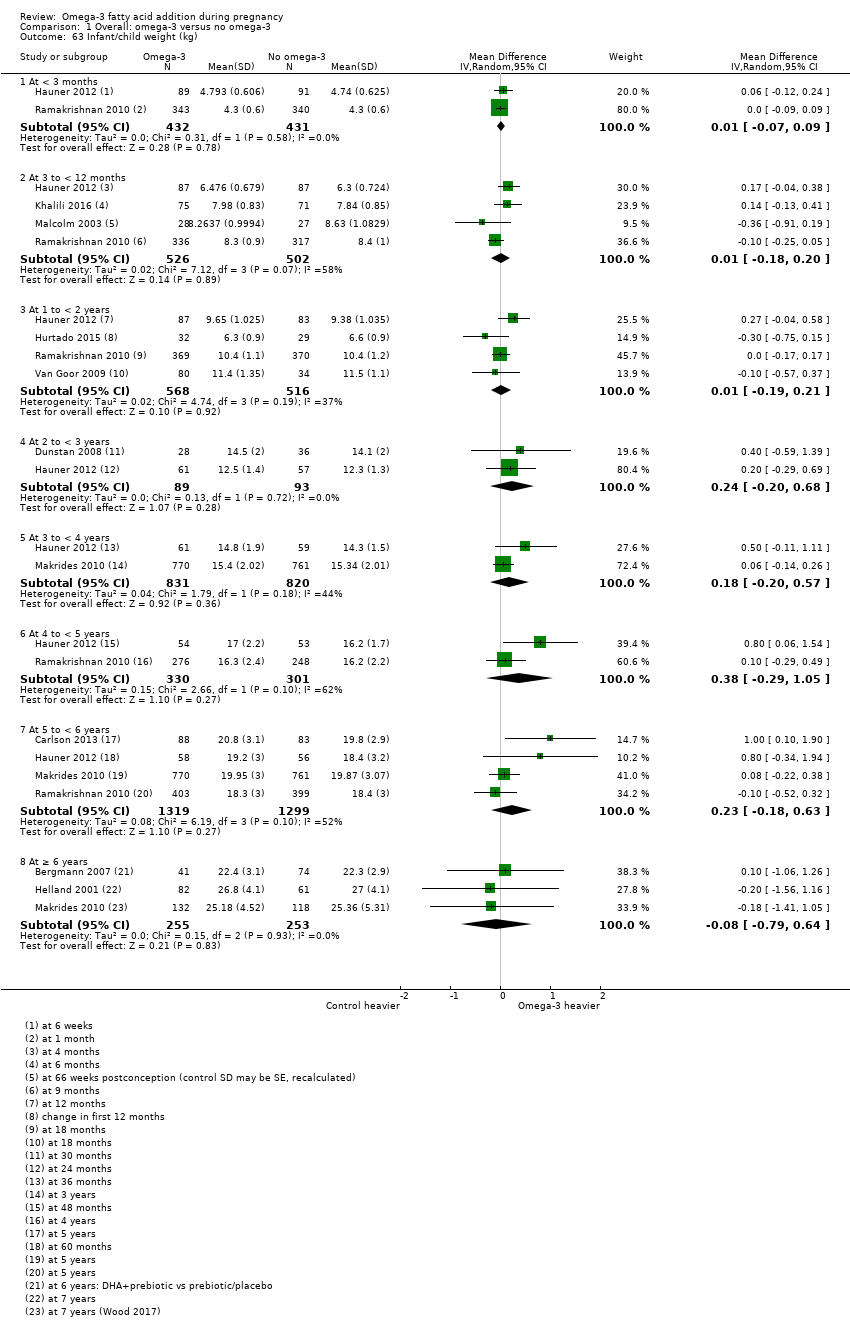
Comparison 1 Overall: omega‐3 versus no omega‐3, Outcome 63 Infant/child weight (kg).

Comparison 1 Overall: omega‐3 versus no omega‐3, Outcome 64 Infant/child length/height (cm).

Comparison 1 Overall: omega‐3 versus no omega‐3, Outcome 65 Infant/child head circumference (cm).
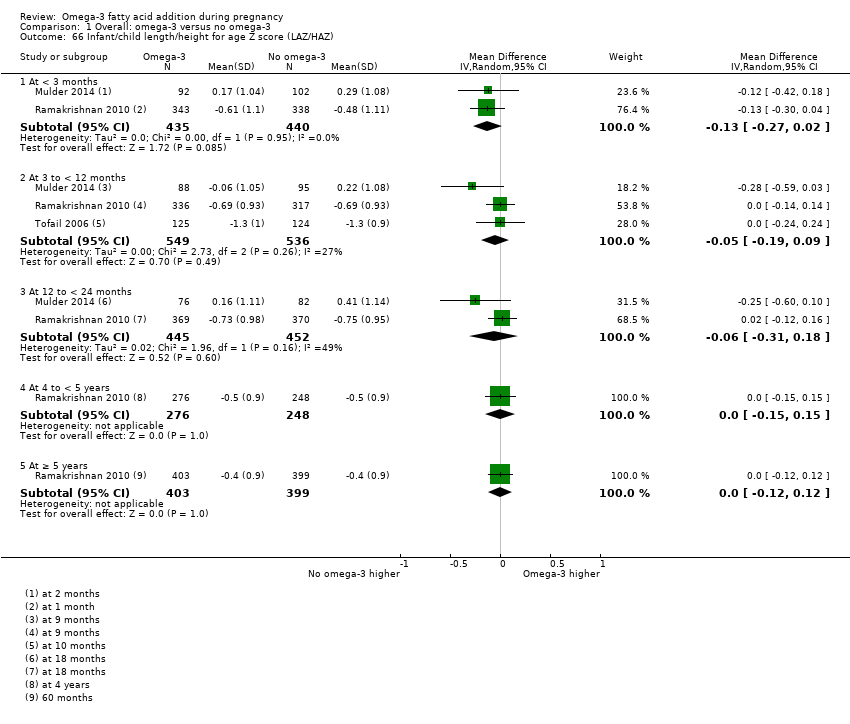
Comparison 1 Overall: omega‐3 versus no omega‐3, Outcome 66 Infant/child length/height for age Z score (LAZ/HAZ).
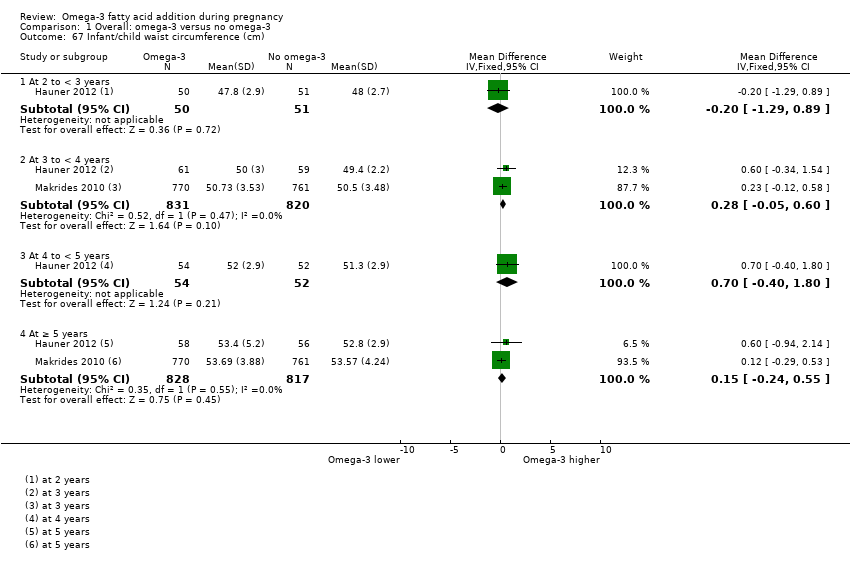
Comparison 1 Overall: omega‐3 versus no omega‐3, Outcome 67 Infant/child waist circumference (cm).

Comparison 1 Overall: omega‐3 versus no omega‐3, Outcome 68 Infant/child weight‐for‐age Z score (WAZ).
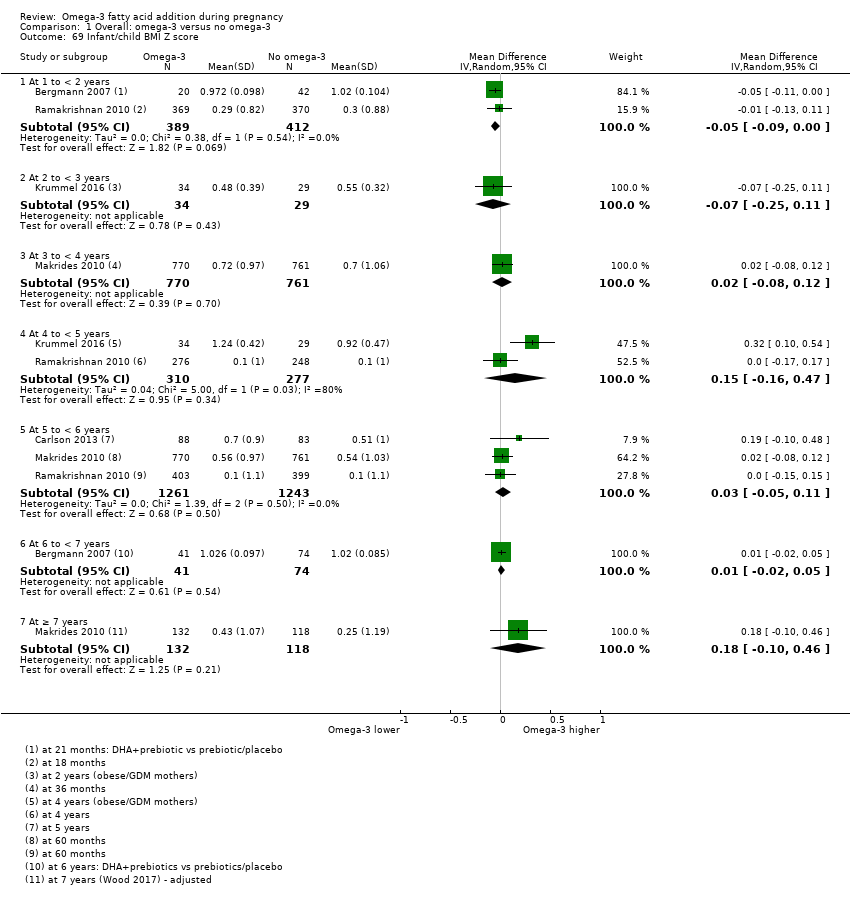
Comparison 1 Overall: omega‐3 versus no omega‐3, Outcome 69 Infant/child BMI Z score.

Comparison 1 Overall: omega‐3 versus no omega‐3, Outcome 70 Infant/child weight for length/height Z score (WHZ).

Comparison 1 Overall: omega‐3 versus no omega‐3, Outcome 71 Infant/child BMI percentile.

Comparison 1 Overall: omega‐3 versus no omega‐3, Outcome 72 Child/adult BMI.

Comparison 1 Overall: omega‐3 versus no omega‐3, Outcome 73 Infant/child body fat (%).

Comparison 1 Overall: omega‐3 versus no omega‐3, Outcome 74 Infant/child total fat mass (kg).
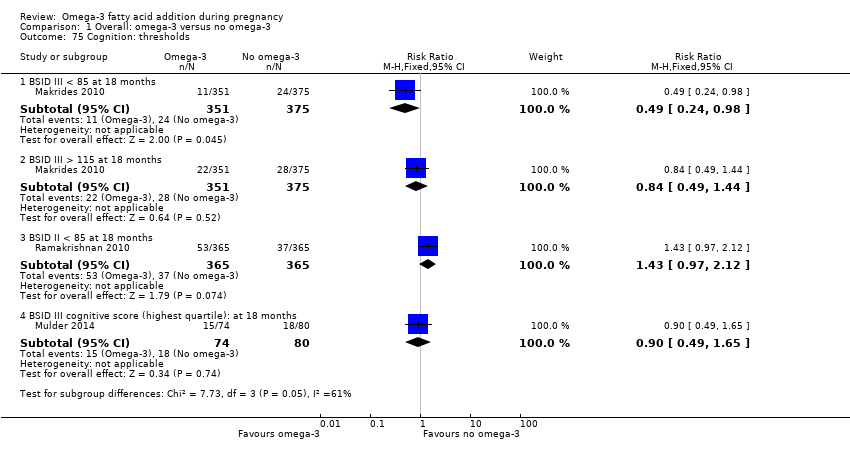
Comparison 1 Overall: omega‐3 versus no omega‐3, Outcome 75 Cognition: thresholds.
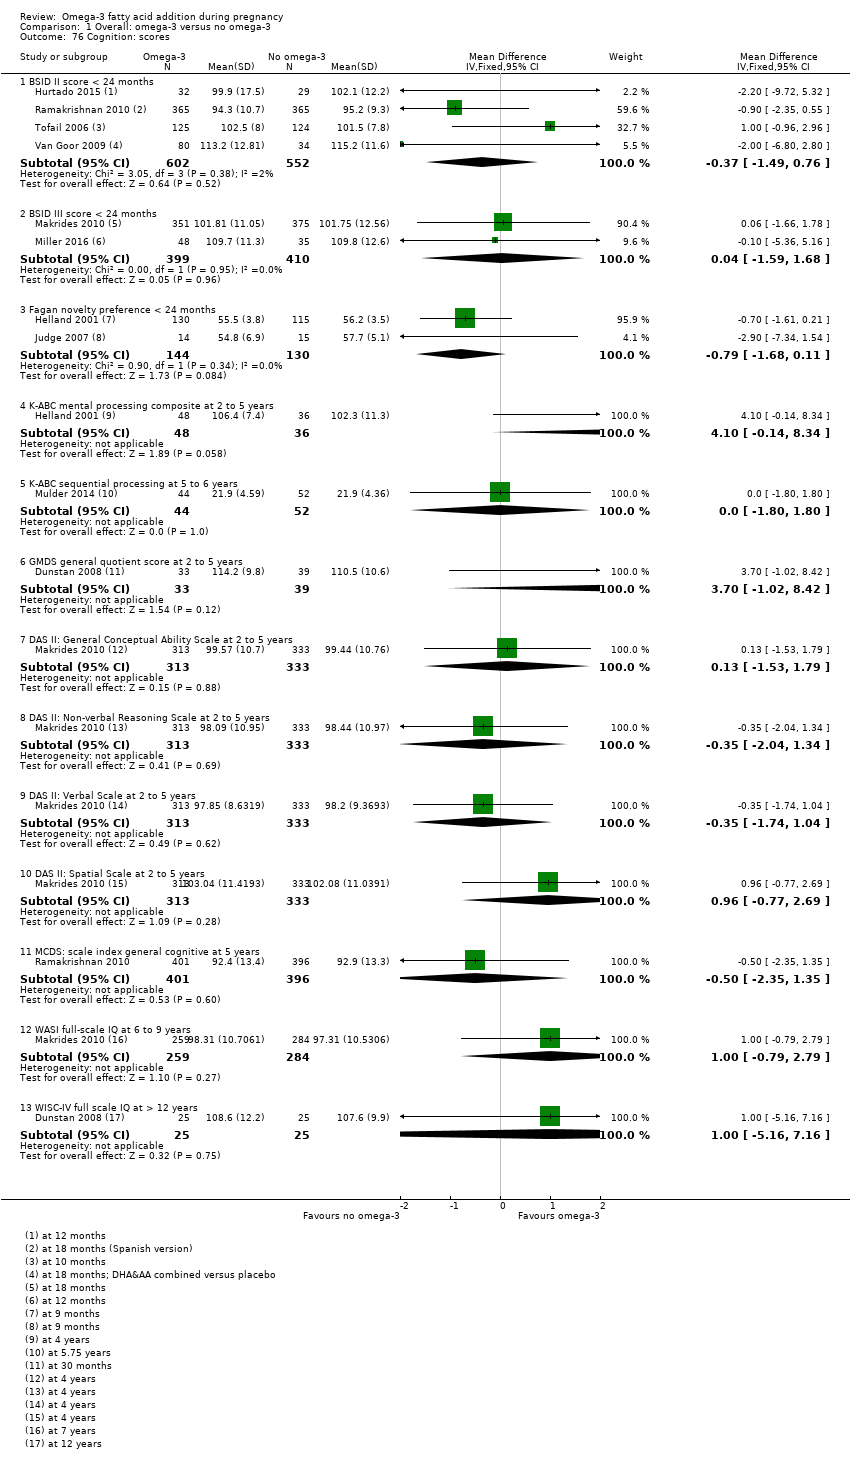
Comparison 1 Overall: omega‐3 versus no omega‐3, Outcome 76 Cognition: scores.
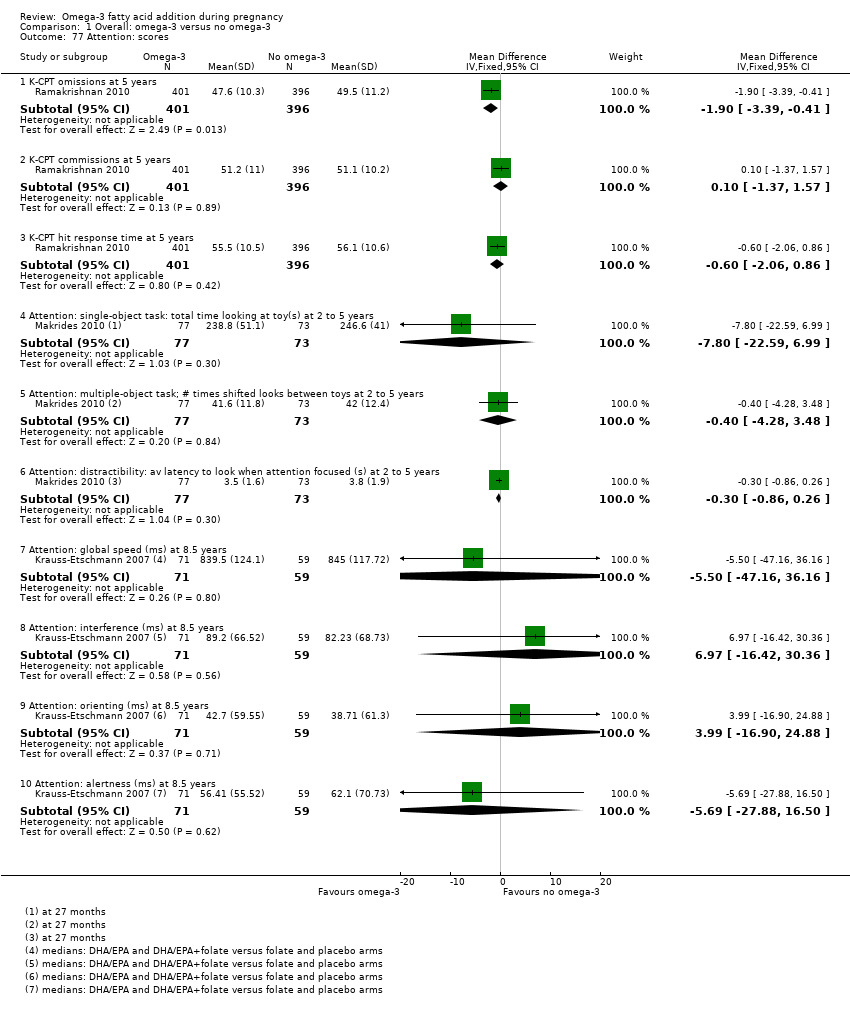
Comparison 1 Overall: omega‐3 versus no omega‐3, Outcome 77 Attention: scores.
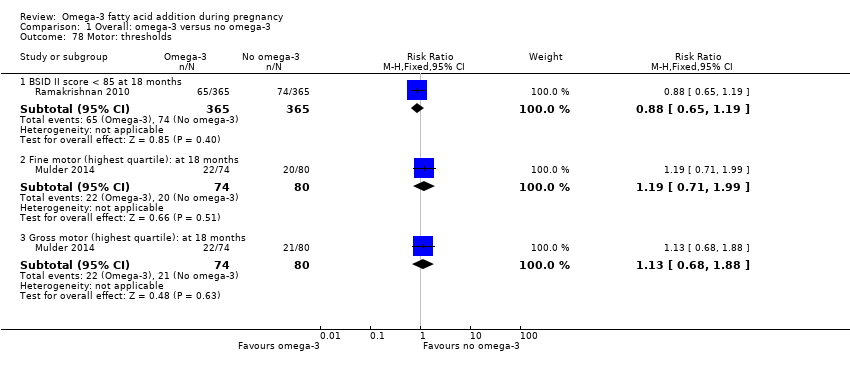
Comparison 1 Overall: omega‐3 versus no omega‐3, Outcome 78 Motor: thresholds.
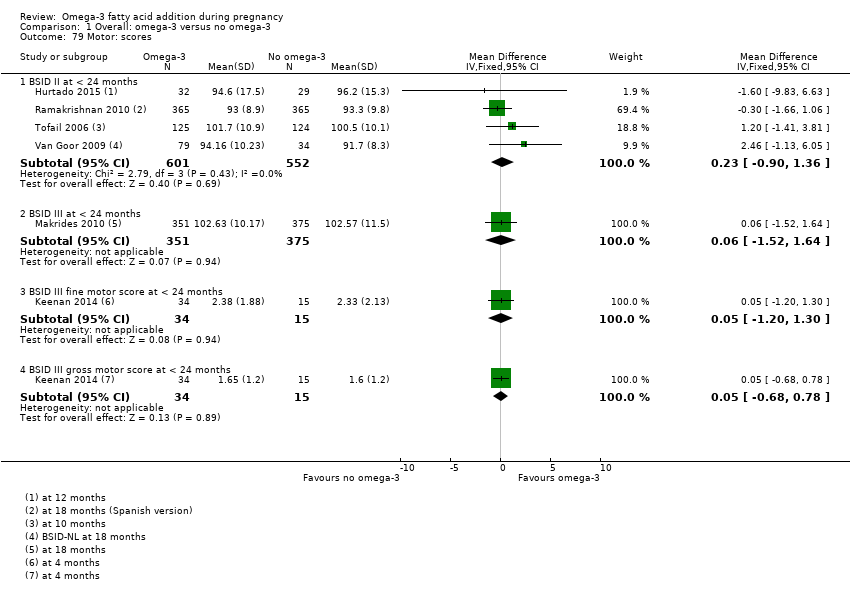
Comparison 1 Overall: omega‐3 versus no omega‐3, Outcome 79 Motor: scores.

Comparison 1 Overall: omega‐3 versus no omega‐3, Outcome 80 Language: thresholds.

Comparison 1 Overall: omega‐3 versus no omega‐3, Outcome 81 Language: scores.
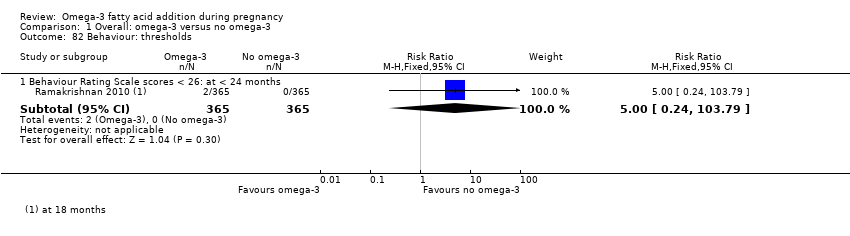
Comparison 1 Overall: omega‐3 versus no omega‐3, Outcome 82 Behaviour: thresholds.

Comparison 1 Overall: omega‐3 versus no omega‐3, Outcome 83 Behaviour: scores.

Comparison 1 Overall: omega‐3 versus no omega‐3, Outcome 84 Vision: visual acuity (cycles/degree).
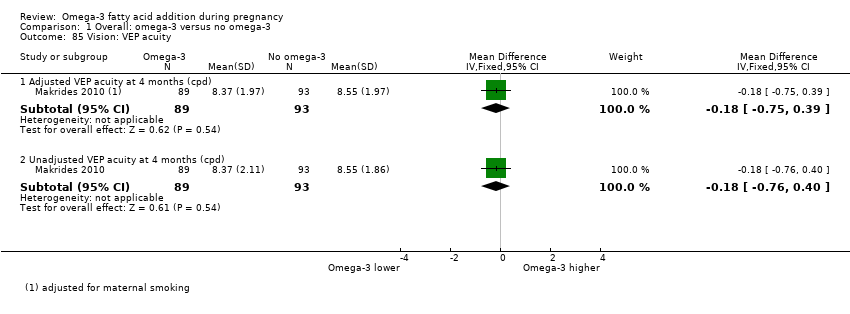
Comparison 1 Overall: omega‐3 versus no omega‐3, Outcome 85 Vision: VEP acuity.

Comparison 1 Overall: omega‐3 versus no omega‐3, Outcome 86 Vision: VEP latency.
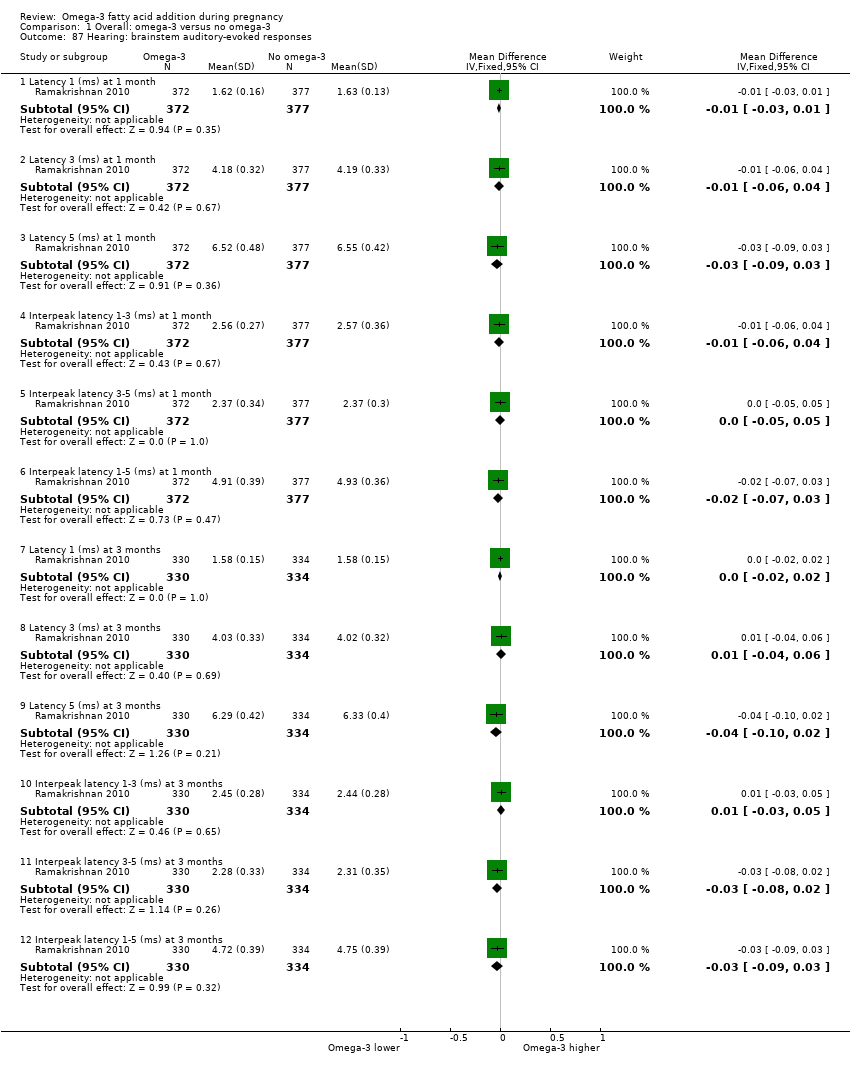
Comparison 1 Overall: omega‐3 versus no omega‐3, Outcome 87 Hearing: brainstem auditory‐evoked responses.

Comparison 1 Overall: omega‐3 versus no omega‐3, Outcome 88 Neurodevelopment: thresholds.

Comparison 1 Overall: omega‐3 versus no omega‐3, Outcome 89 Neurodevelopment: scores.
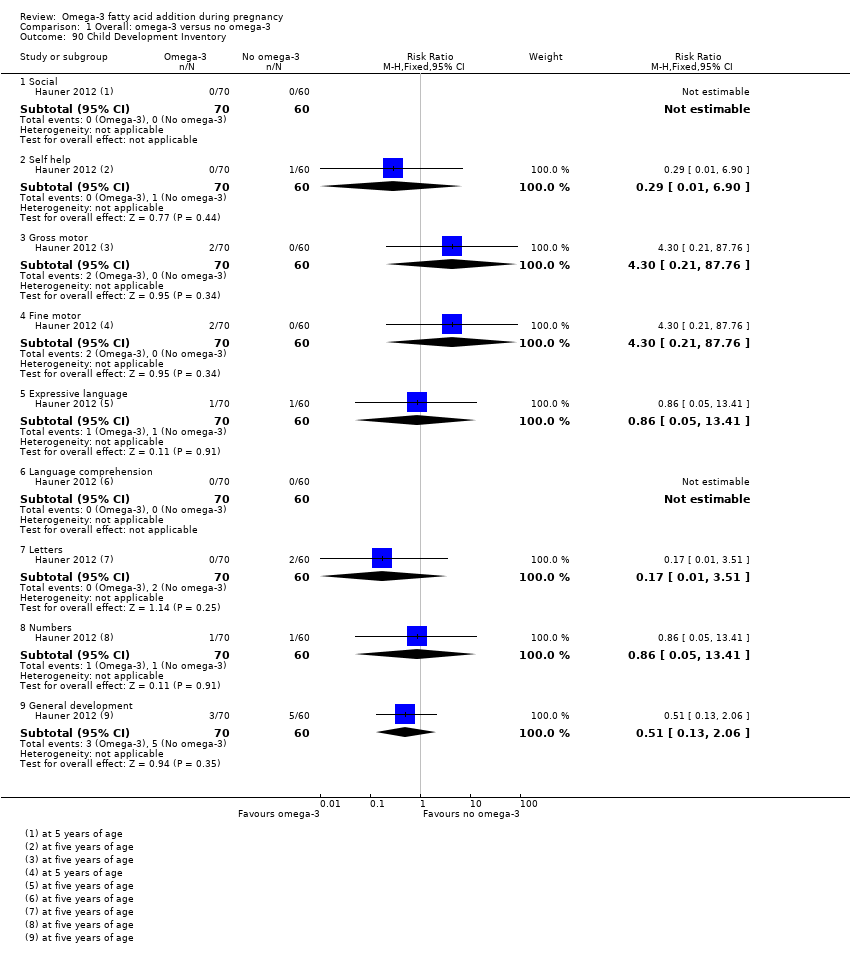
Comparison 1 Overall: omega‐3 versus no omega‐3, Outcome 90 Child Development Inventory.
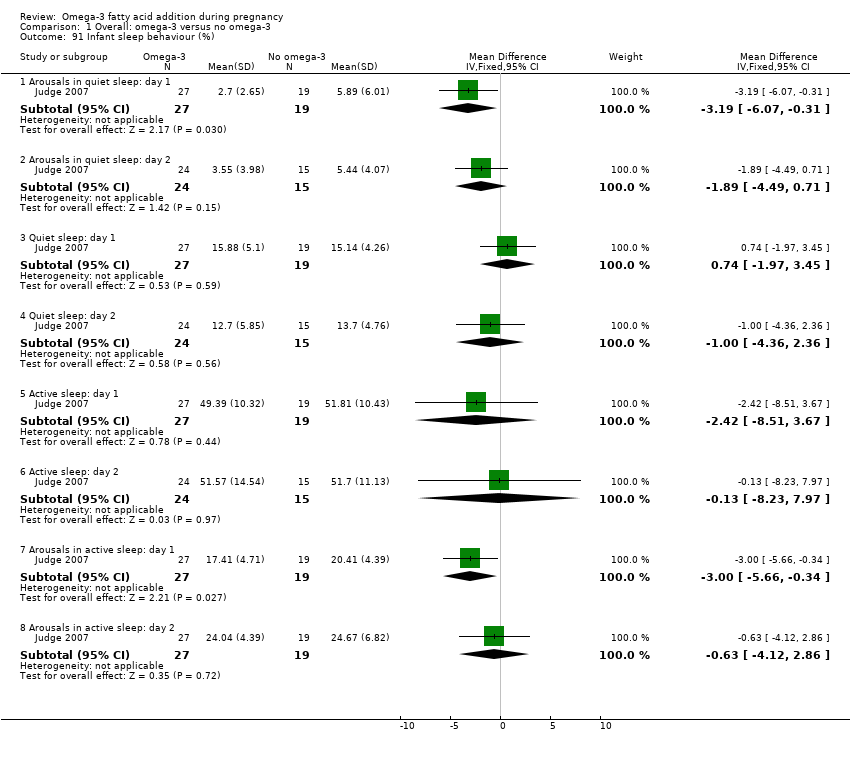
Comparison 1 Overall: omega‐3 versus no omega‐3, Outcome 91 Infant sleep behaviour (%).

Comparison 1 Overall: omega‐3 versus no omega‐3, Outcome 92 Cerebral palsy.

Comparison 2 Type of omega‐3 intervention, Outcome 1 Preterm birth (< 37 weeks).

Comparison 2 Type of omega‐3 intervention, Outcome 2 Early preterm birth (< 34 weeks).
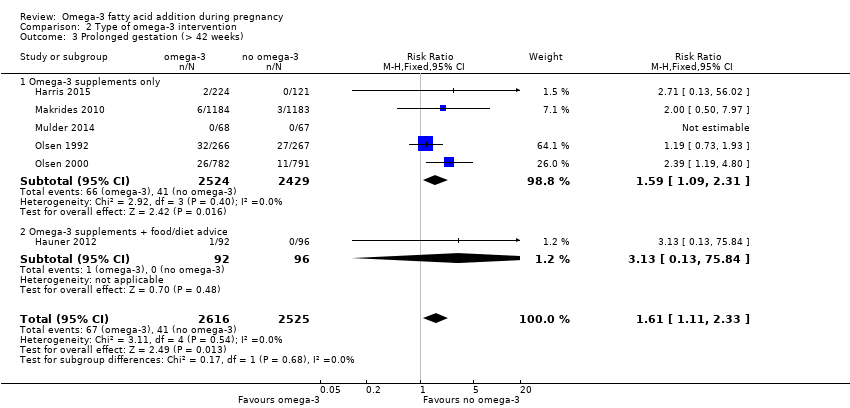
Comparison 2 Type of omega‐3 intervention, Outcome 3 Prolonged gestation (> 42 weeks).

Comparison 2 Type of omega‐3 intervention, Outcome 4 Maternal death.

Comparison 2 Type of omega‐3 intervention, Outcome 5 Pre‐eclampsia (hypertension with proteinuria).

Comparison 2 Type of omega‐3 intervention, Outcome 6 High blood pressure (without proteinuria).

Comparison 2 Type of omega‐3 intervention, Outcome 7 Eclampsia.

Comparison 2 Type of omega‐3 intervention, Outcome 8 Maternal antepartum hospitalisation.

Comparison 2 Type of omega‐3 intervention, Outcome 9 Mother's length of stay in hospital (days).
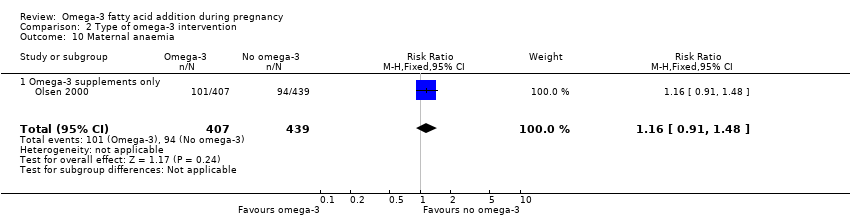
Comparison 2 Type of omega‐3 intervention, Outcome 10 Maternal anaemia.
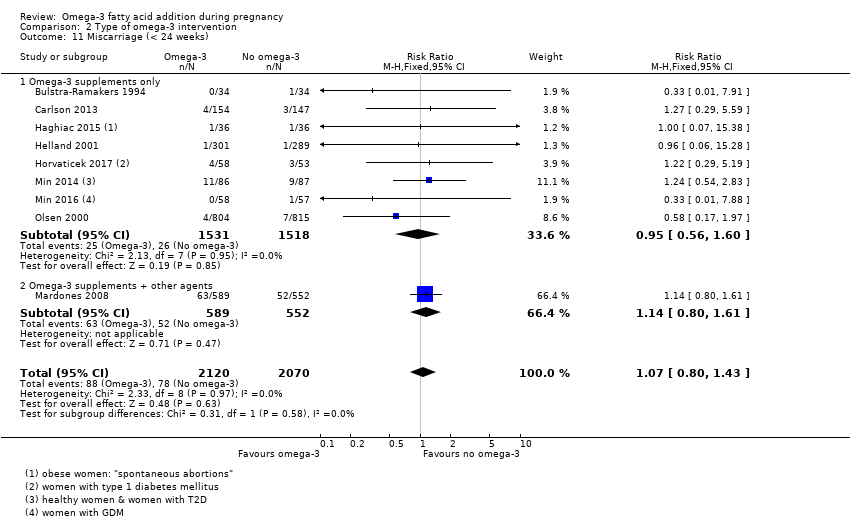
Comparison 2 Type of omega‐3 intervention, Outcome 11 Miscarriage (< 24 weeks).

Comparison 2 Type of omega‐3 intervention, Outcome 12 Antepartum vaginal bleeding.

Comparison 2 Type of omega‐3 intervention, Outcome 13 Preterm prelabour rupture of membranes.

Comparison 2 Type of omega‐3 intervention, Outcome 14 Prelabour rupture of membranes.
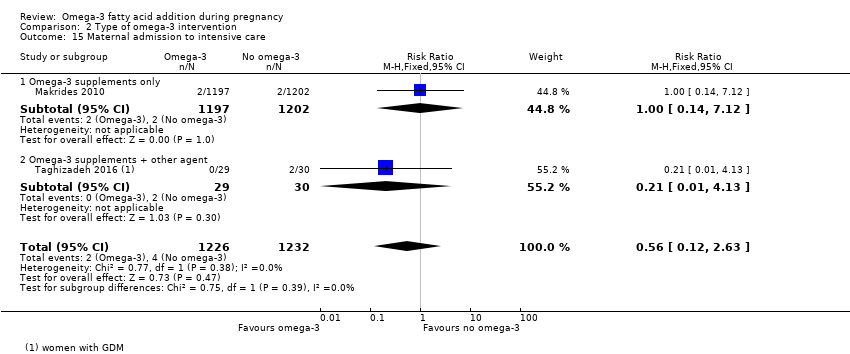
Comparison 2 Type of omega‐3 intervention, Outcome 15 Maternal admission to intensive care.
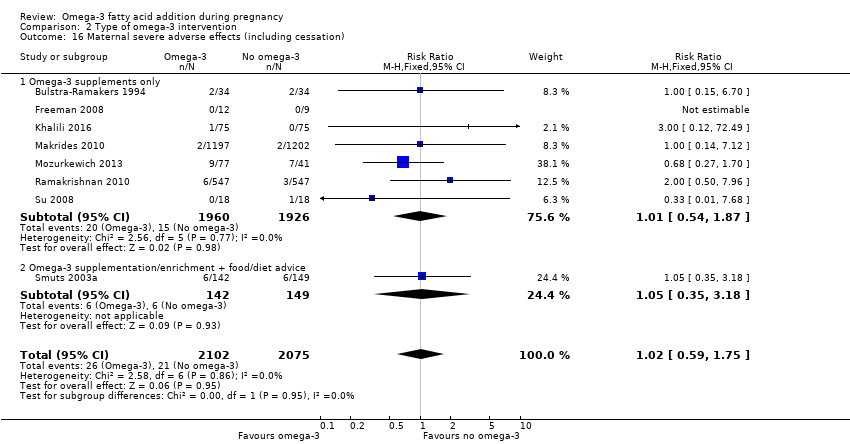
Comparison 2 Type of omega‐3 intervention, Outcome 16 Maternal severe adverse effects (including cessation).

Comparison 2 Type of omega‐3 intervention, Outcome 17 Caesarean section.

Comparison 2 Type of omega‐3 intervention, Outcome 18 Induction (post‐term).

Comparison 2 Type of omega‐3 intervention, Outcome 19 Blood loss at birth (mL).

Comparison 2 Type of omega‐3 intervention, Outcome 20 Postpartum haemorrhage.

Comparison 2 Type of omega‐3 intervention, Outcome 21 Gestational diabetes.

Comparison 2 Type of omega‐3 intervention, Outcome 22 Maternal insulin resistance (HOMA‐IR).

Comparison 2 Type of omega‐3 intervention, Outcome 23 Excessive gestational weight gain.

Comparison 2 Type of omega‐3 intervention, Outcome 24 Gestational weight gain (kg).

Comparison 2 Type of omega‐3 intervention, Outcome 25 Depression during pregnancy: scores.
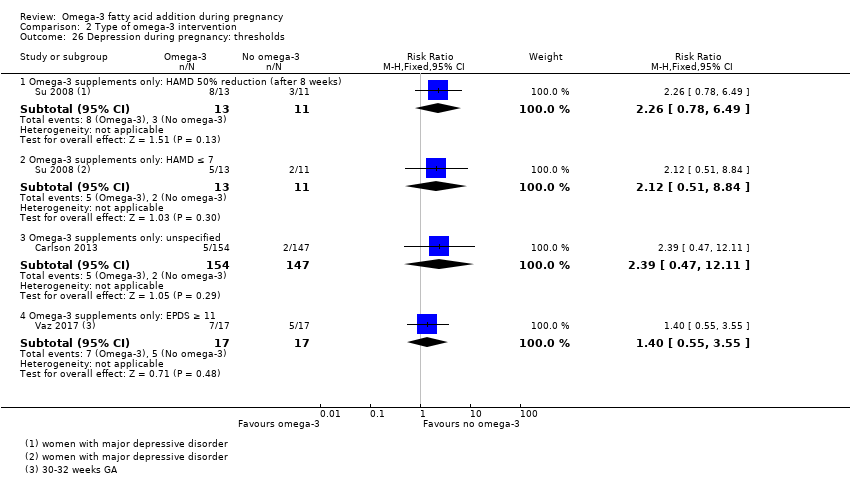
Comparison 2 Type of omega‐3 intervention, Outcome 26 Depression during pregnancy: thresholds.
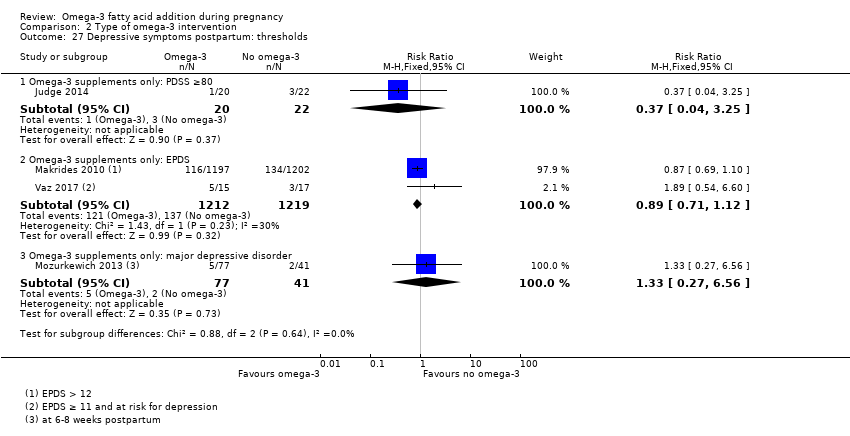
Comparison 2 Type of omega‐3 intervention, Outcome 27 Depressive symptoms postpartum: thresholds.
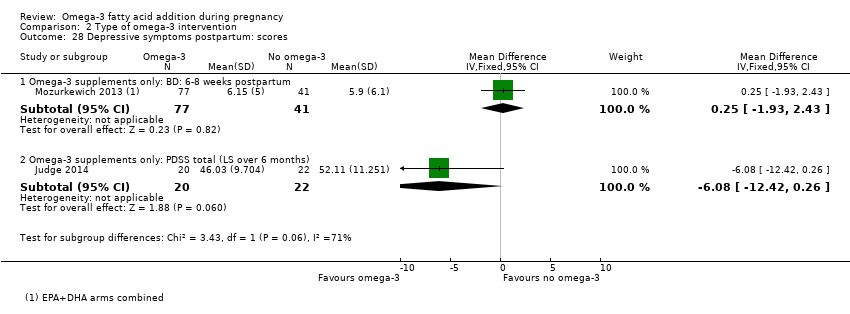
Comparison 2 Type of omega‐3 intervention, Outcome 28 Depressive symptoms postpartum: scores.
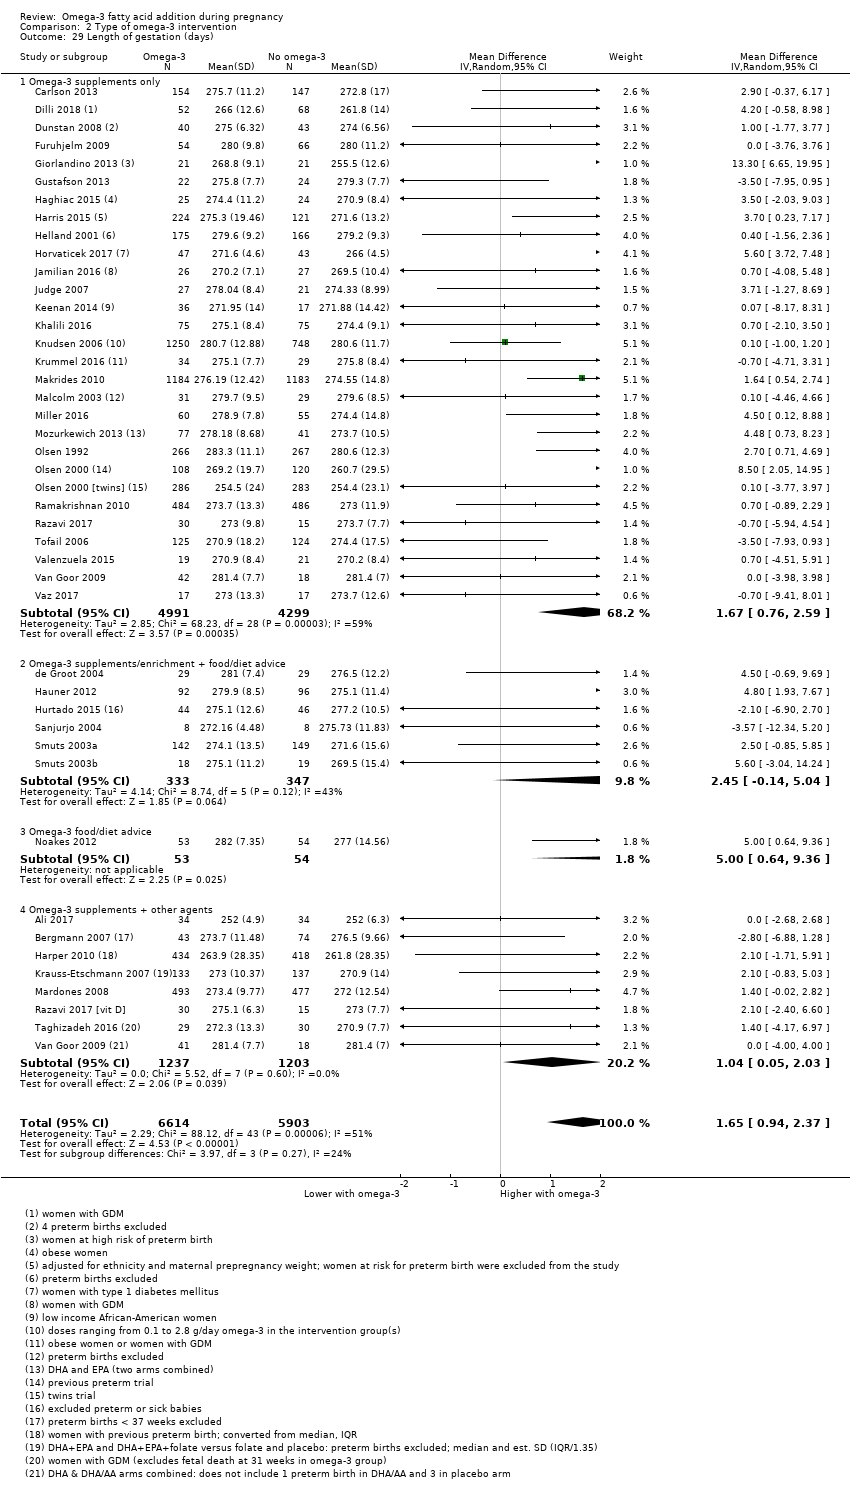
Comparison 2 Type of omega‐3 intervention, Outcome 29 Length of gestation (days).

Comparison 2 Type of omega‐3 intervention, Outcome 30 Perinatal death.

Comparison 2 Type of omega‐3 intervention, Outcome 31 Stillbirth.

Comparison 2 Type of omega‐3 intervention, Outcome 32 Neonatal death.

Comparison 2 Type of omega‐3 intervention, Outcome 33 Infant death.

Comparison 2 Type of omega‐3 intervention, Outcome 34 Large‐for‐gestational age.

Comparison 2 Type of omega‐3 intervention, Outcome 35 Macrosomia.

Comparison 2 Type of omega‐3 intervention, Outcome 36 Low birthweight (< 2500 g).
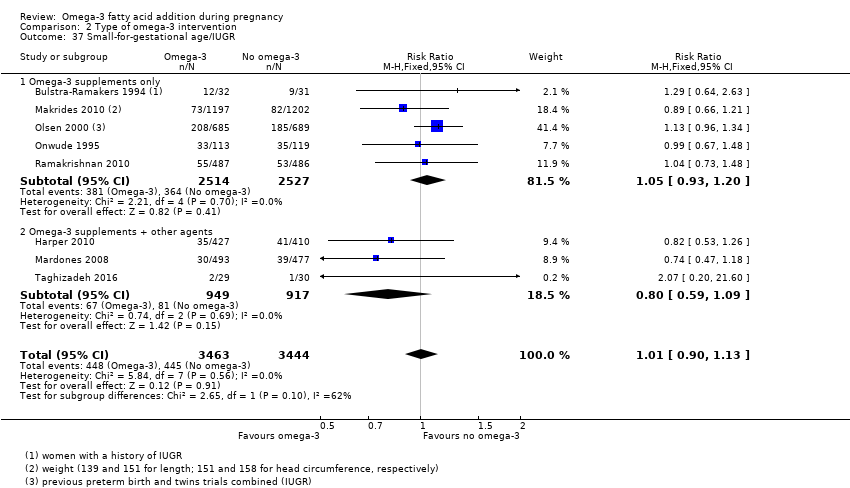
Comparison 2 Type of omega‐3 intervention, Outcome 37 Small‐for‐gestational age/IUGR.
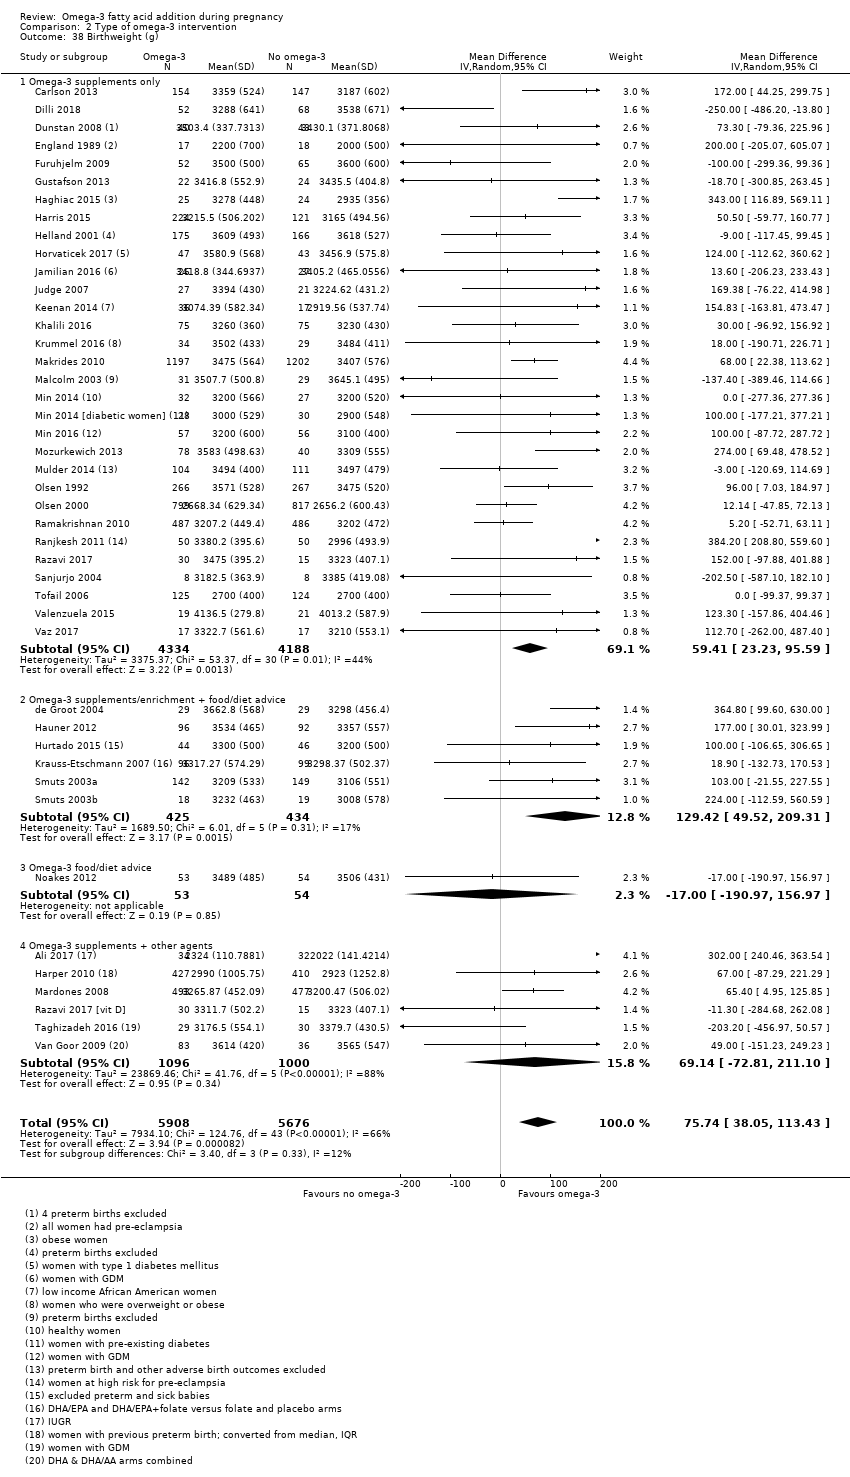
Comparison 2 Type of omega‐3 intervention, Outcome 38 Birthweight (g).
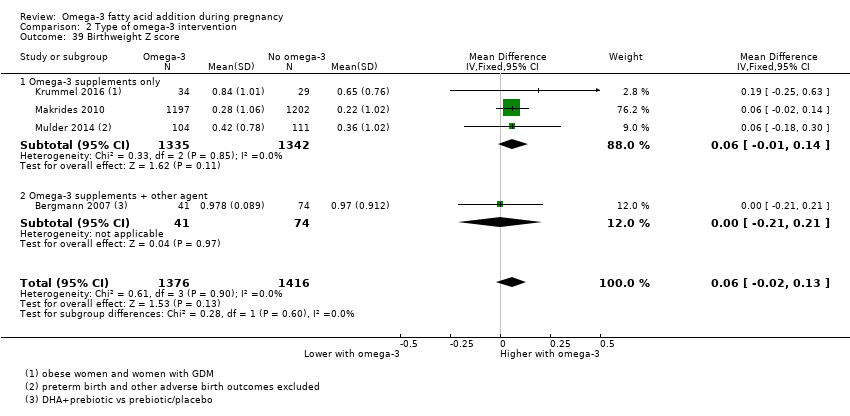
Comparison 2 Type of omega‐3 intervention, Outcome 39 Birthweight Z score.
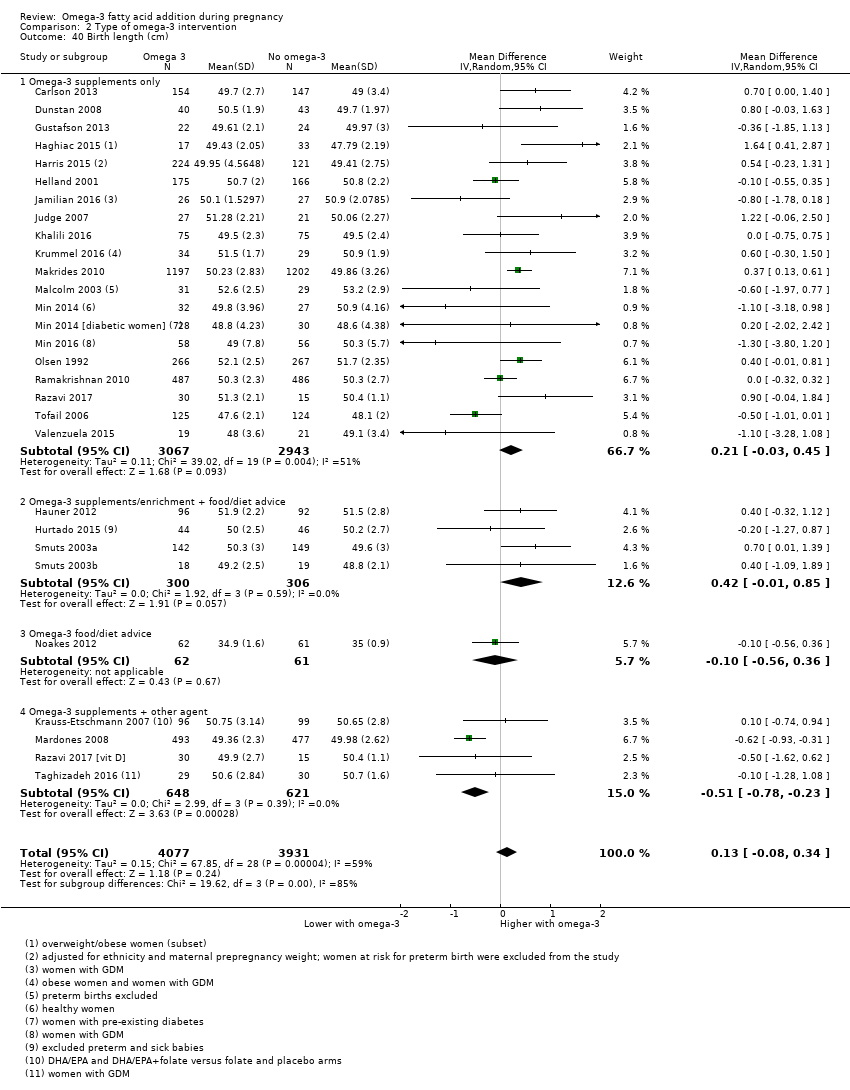
Comparison 2 Type of omega‐3 intervention, Outcome 40 Birth length (cm).

Comparison 2 Type of omega‐3 intervention, Outcome 41 Length at birth Z score.

Comparison 2 Type of omega‐3 intervention, Outcome 42 Head circumference at birth (cm).

Comparison 2 Type of omega‐3 intervention, Outcome 43 Head circumference at birth Z score.

Comparison 2 Type of omega‐3 intervention, Outcome 44 Baby admitted to neonatal care.
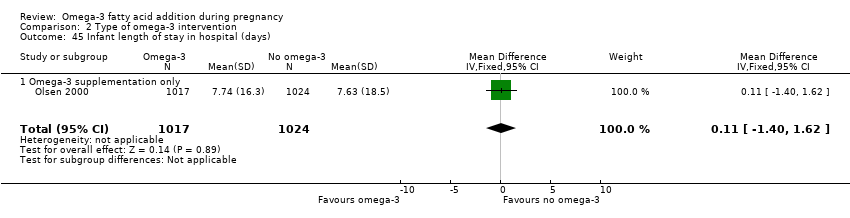
Comparison 2 Type of omega‐3 intervention, Outcome 45 Infant length of stay in hospital (days).

Comparison 2 Type of omega‐3 intervention, Outcome 46 Congenital anomalies.
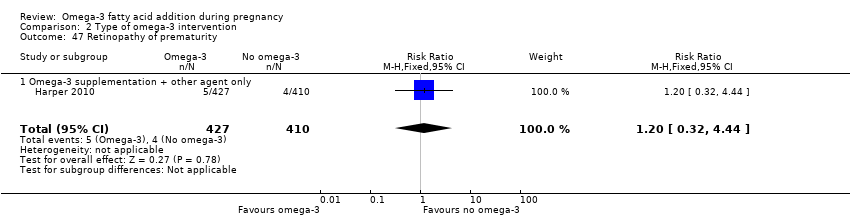
Comparison 2 Type of omega‐3 intervention, Outcome 47 Retinopathy of prematurity.
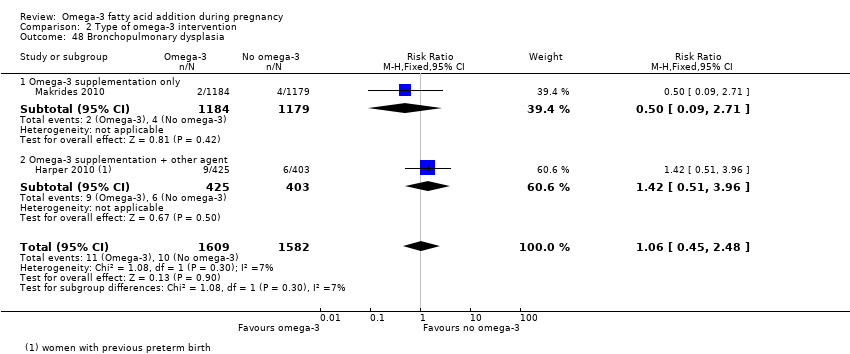
Comparison 2 Type of omega‐3 intervention, Outcome 48 Bronchopulmonary dysplasia.

Comparison 2 Type of omega‐3 intervention, Outcome 49 Respiratory distress syndrome.

Comparison 2 Type of omega‐3 intervention, Outcome 50 Necrotising enterocolitis (NEC).
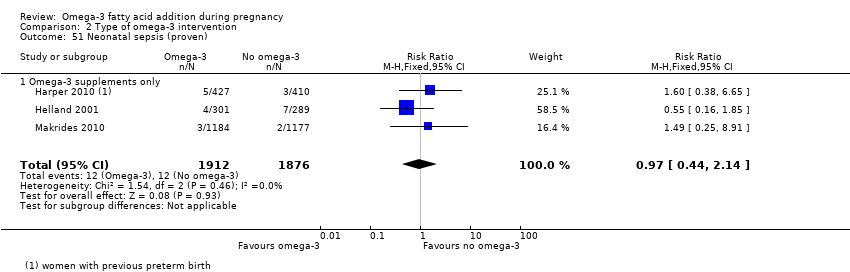
Comparison 2 Type of omega‐3 intervention, Outcome 51 Neonatal sepsis (proven).

Comparison 2 Type of omega‐3 intervention, Outcome 52 Convulsion.
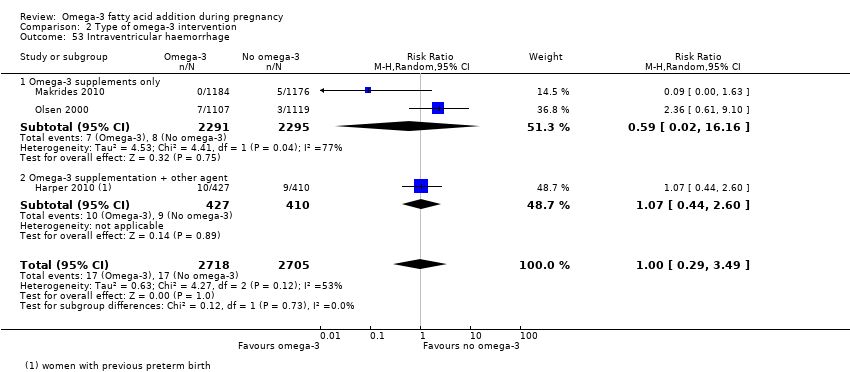
Comparison 2 Type of omega‐3 intervention, Outcome 53 Intraventricular haemorrhage.

Comparison 2 Type of omega‐3 intervention, Outcome 54 Neonatal/infant serious adverse events.

Comparison 2 Type of omega‐3 intervention, Outcome 55 Neonatal/infant morbidity: cardiovascular.

Comparison 2 Type of omega‐3 intervention, Outcome 56 Neonatal/infant morbidity: respiratory.

Comparison 2 Type of omega‐3 intervention, Outcome 57 Neonatal/infant morbidity: caused by pregnancy/birth.

Comparison 2 Type of omega‐3 intervention, Outcome 58 Ponderal index.
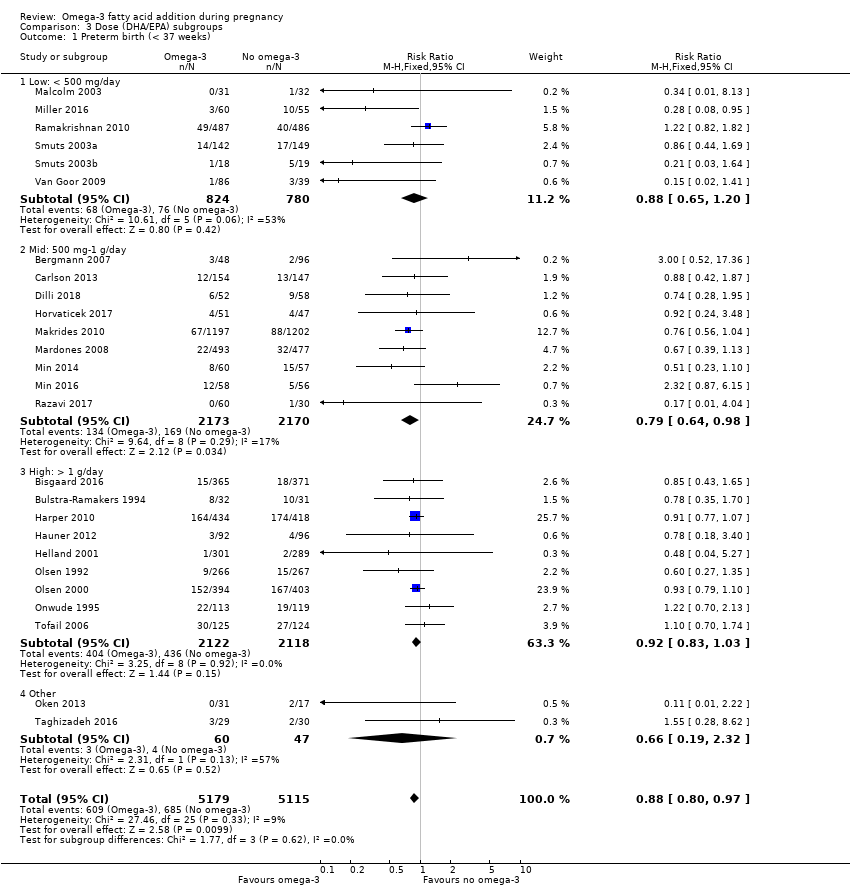
Comparison 3 Dose (DHA/EPA) subgroups, Outcome 1 Preterm birth (< 37 weeks).
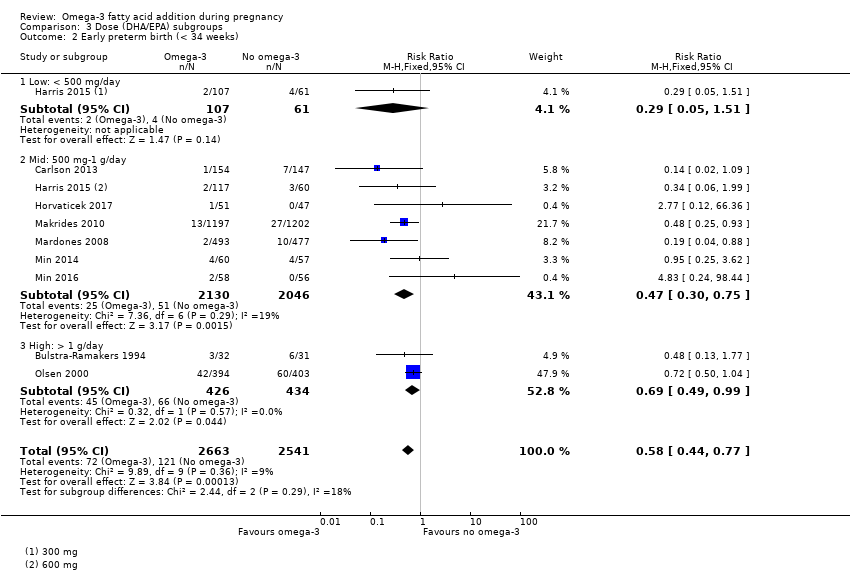
Comparison 3 Dose (DHA/EPA) subgroups, Outcome 2 Early preterm birth (< 34 weeks).
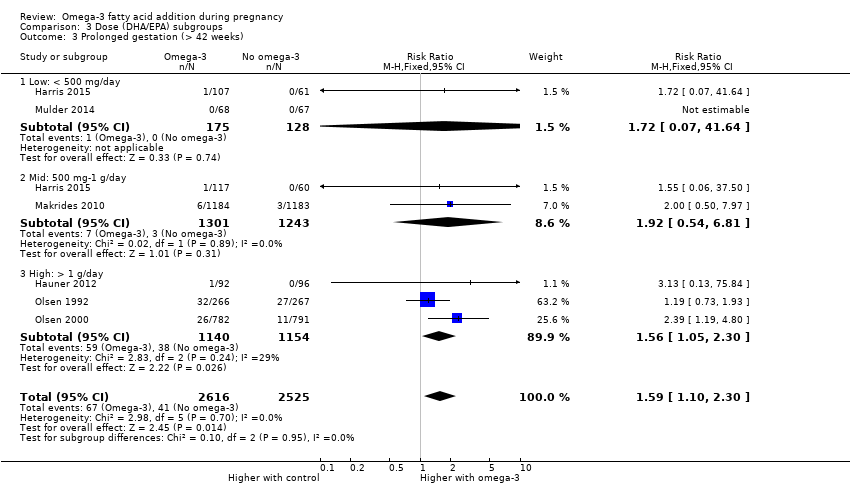
Comparison 3 Dose (DHA/EPA) subgroups, Outcome 3 Prolonged gestation (> 42 weeks).
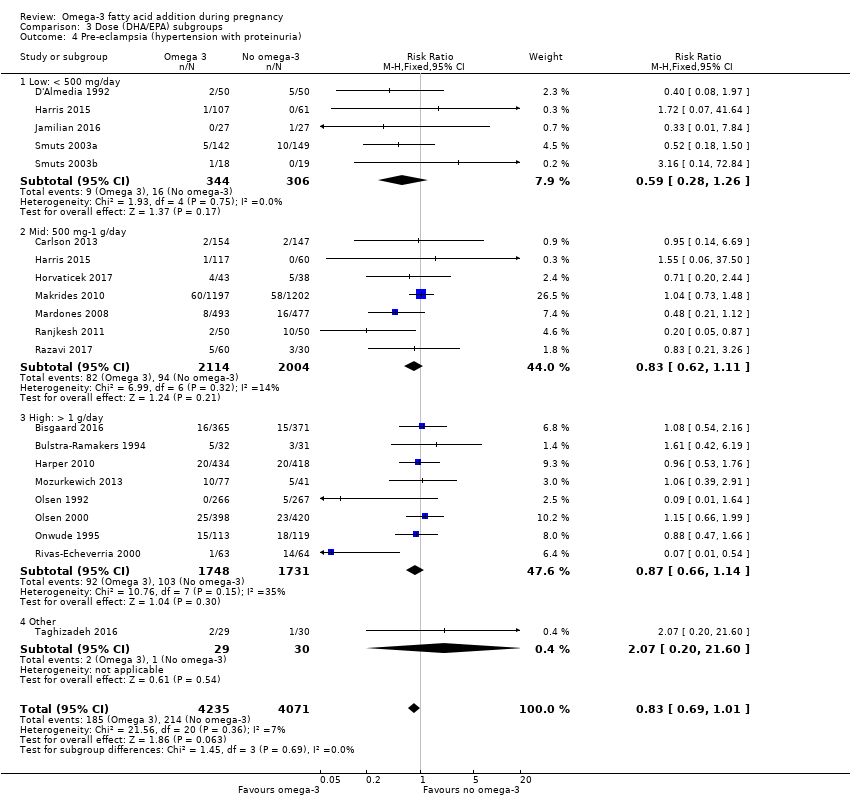
Comparison 3 Dose (DHA/EPA) subgroups, Outcome 4 Pre‐eclampsia (hypertension with proteinuria).

Comparison 3 Dose (DHA/EPA) subgroups, Outcome 5 Caesarean section.

Comparison 3 Dose (DHA/EPA) subgroups, Outcome 6 Length of gestation (days).

Comparison 3 Dose (DHA/EPA) subgroups, Outcome 7 Perinatal death.

Comparison 3 Dose (DHA/EPA) subgroups, Outcome 8 Stillbirth.
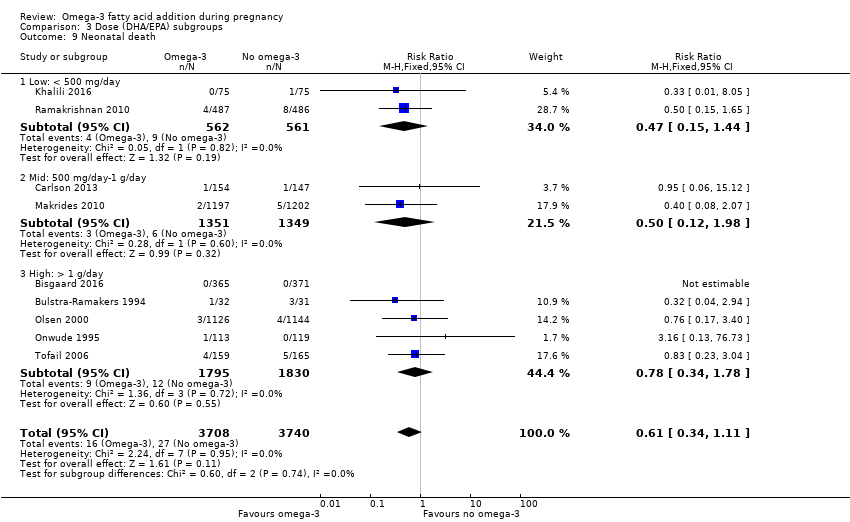
Comparison 3 Dose (DHA/EPA) subgroups, Outcome 9 Neonatal death.
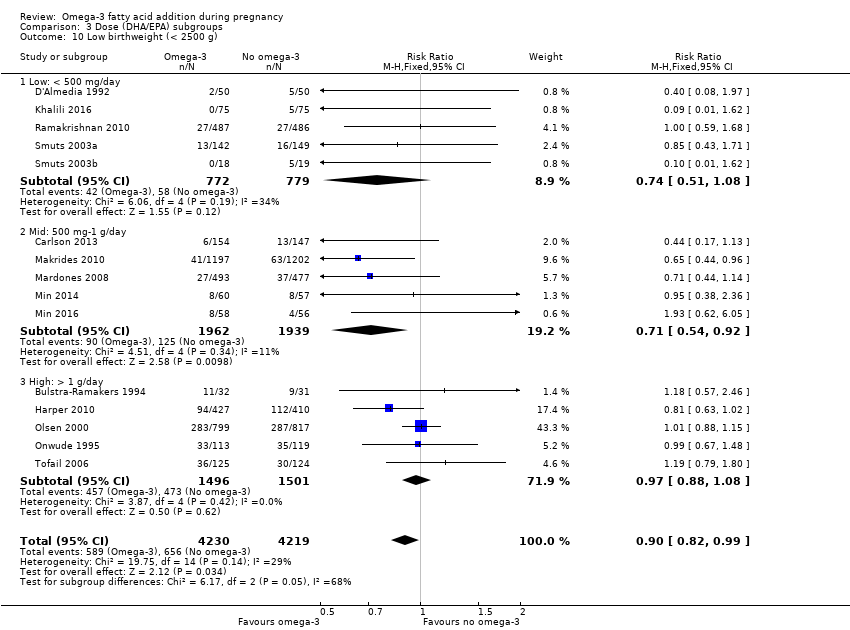
Comparison 3 Dose (DHA/EPA) subgroups, Outcome 10 Low birthweight (< 2500 g).

Comparison 3 Dose (DHA/EPA) subgroups, Outcome 11 Small‐for‐gestational age/IUGR.

Comparison 3 Dose (DHA/EPA) subgroups, Outcome 12 Birthweight (g).

Comparison 4 Timing subgroups, Outcome 1 Preterm birth (< 37 weeks).
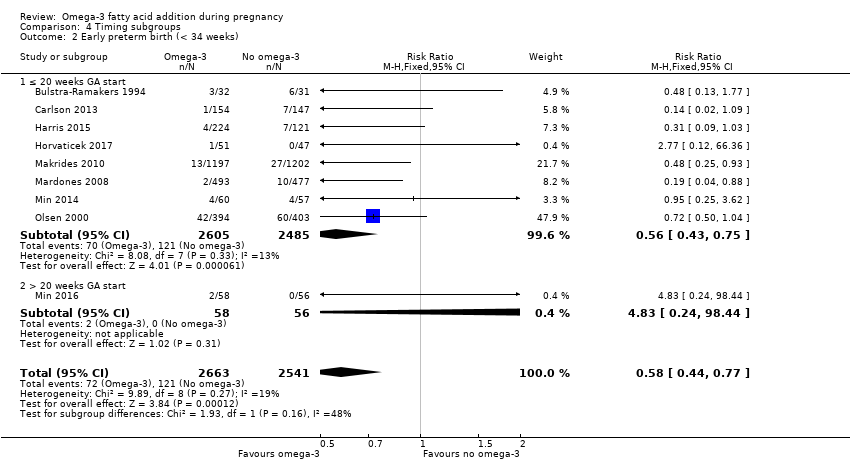
Comparison 4 Timing subgroups, Outcome 2 Early preterm birth (< 34 weeks).
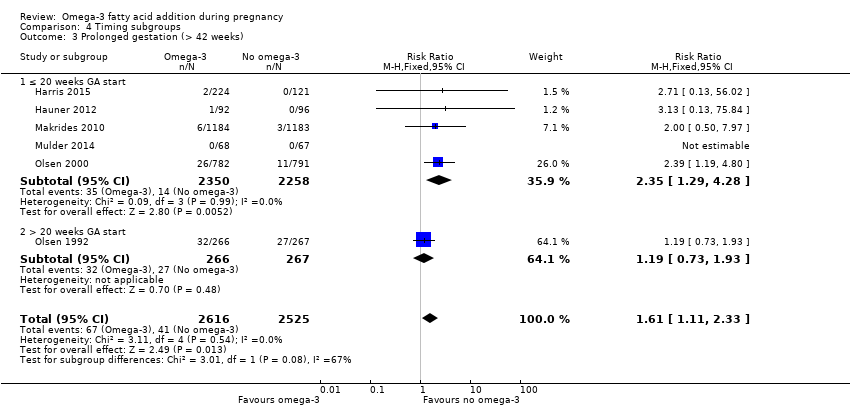
Comparison 4 Timing subgroups, Outcome 3 Prolonged gestation (> 42 weeks).

Comparison 4 Timing subgroups, Outcome 4 Pre‐eclampsia (hypertension with proteinuria).

Comparison 4 Timing subgroups, Outcome 5 Caesarean section.
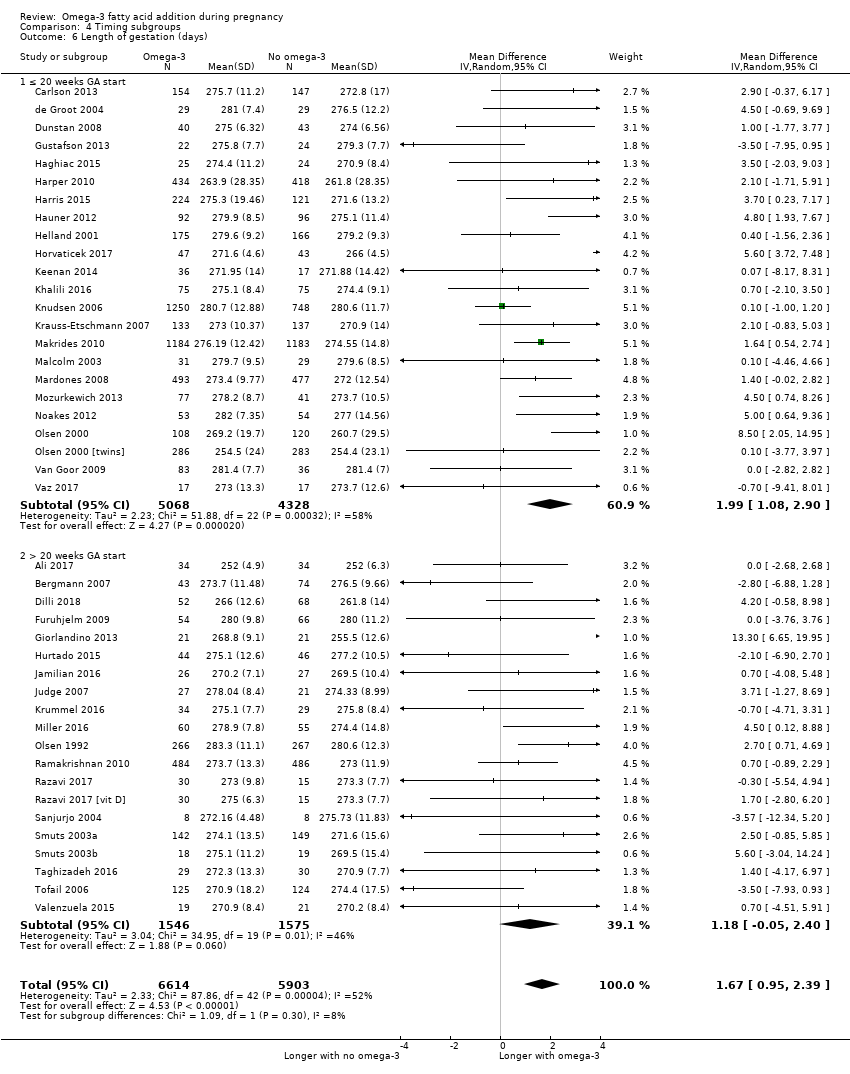
Comparison 4 Timing subgroups, Outcome 6 Length of gestation (days).
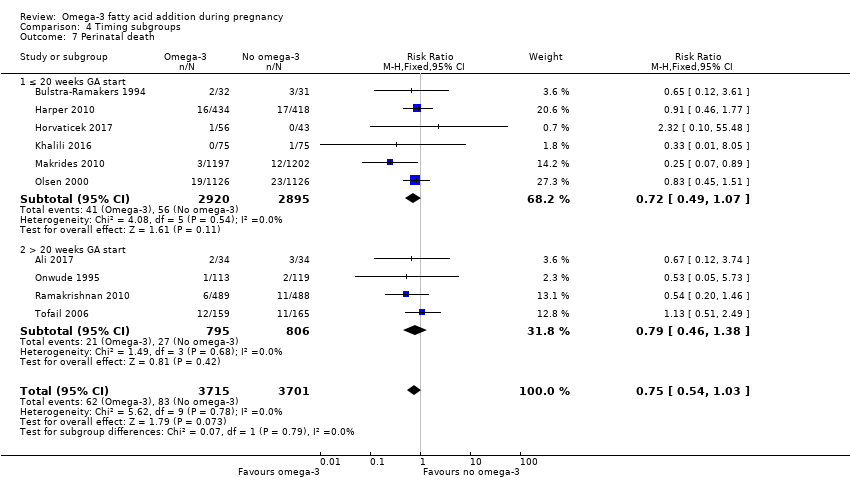
Comparison 4 Timing subgroups, Outcome 7 Perinatal death.

Comparison 4 Timing subgroups, Outcome 8 Stillbirth.
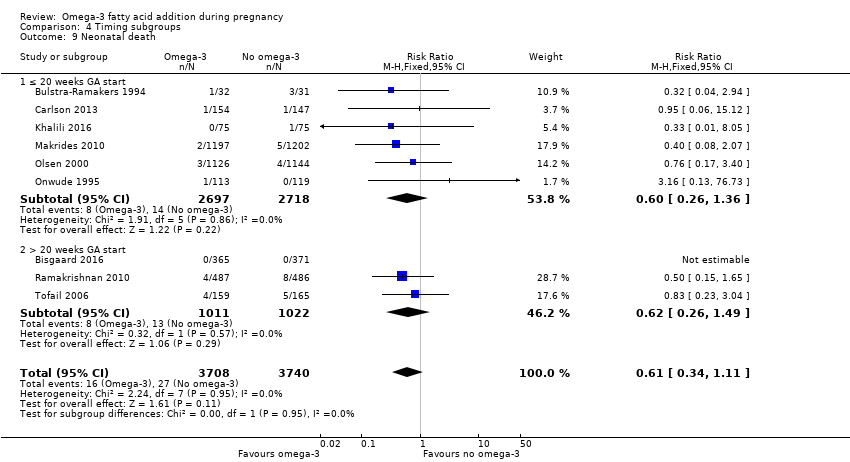
Comparison 4 Timing subgroups, Outcome 9 Neonatal death.
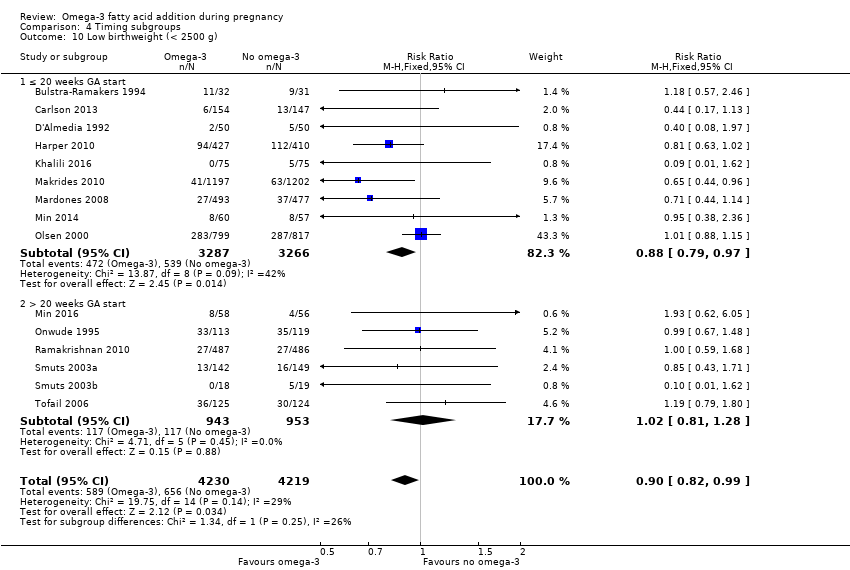
Comparison 4 Timing subgroups, Outcome 10 Low birthweight (< 2500 g).

Comparison 4 Timing subgroups, Outcome 11 Small‐for‐gestational age/IUGR.
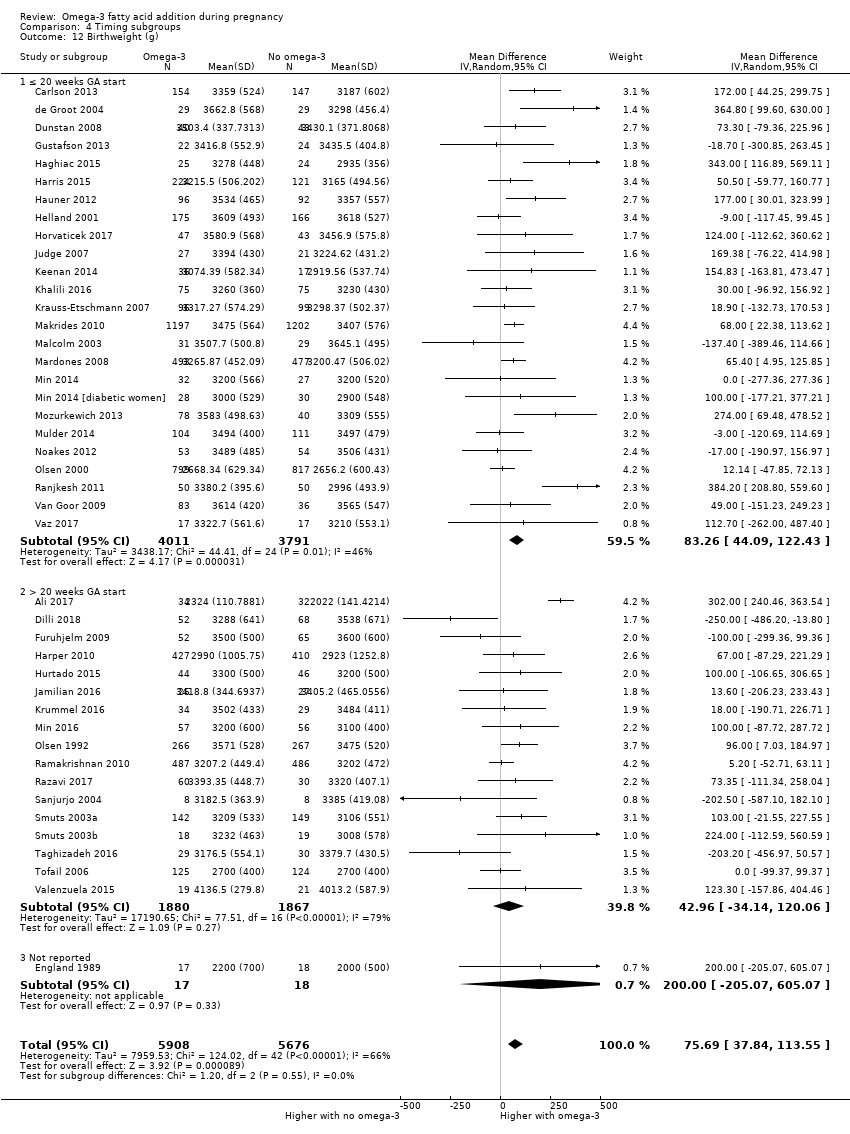
Comparison 4 Timing subgroups, Outcome 12 Birthweight (g).

Comparison 5 DHA/mixed subgroups, Outcome 1 Preterm birth (< 37 weeks).

Comparison 5 DHA/mixed subgroups, Outcome 2 Early preterm birth (< 34 weeks).
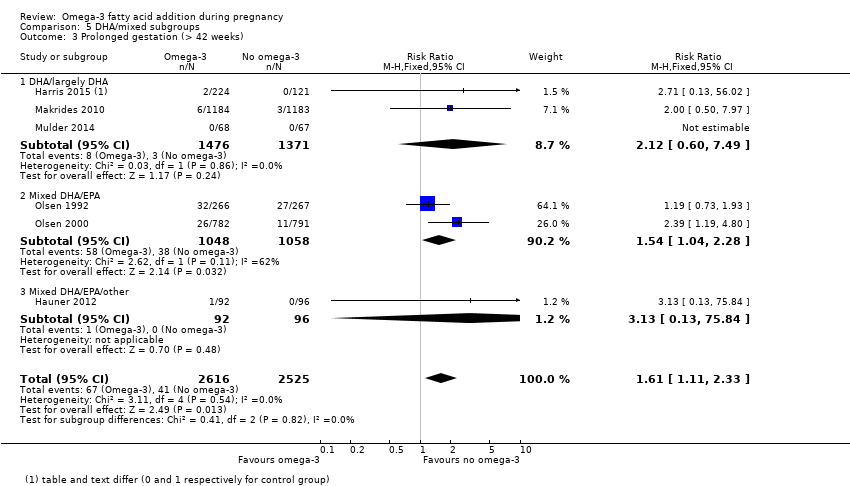
Comparison 5 DHA/mixed subgroups, Outcome 3 Prolonged gestation (> 42 weeks).
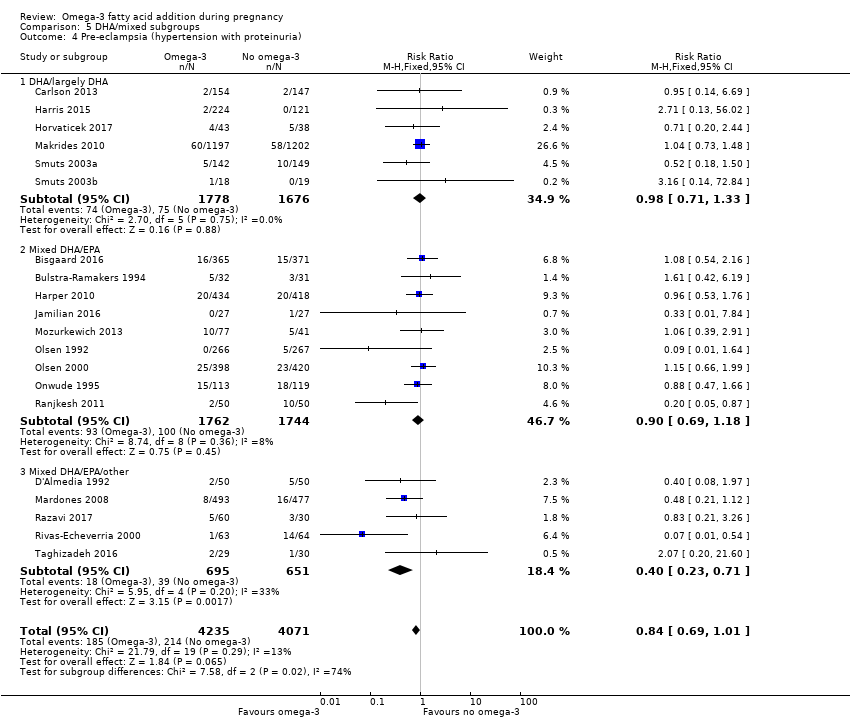
Comparison 5 DHA/mixed subgroups, Outcome 4 Pre‐eclampsia (hypertension with proteinuria).

Comparison 5 DHA/mixed subgroups, Outcome 5 Caesarean section.
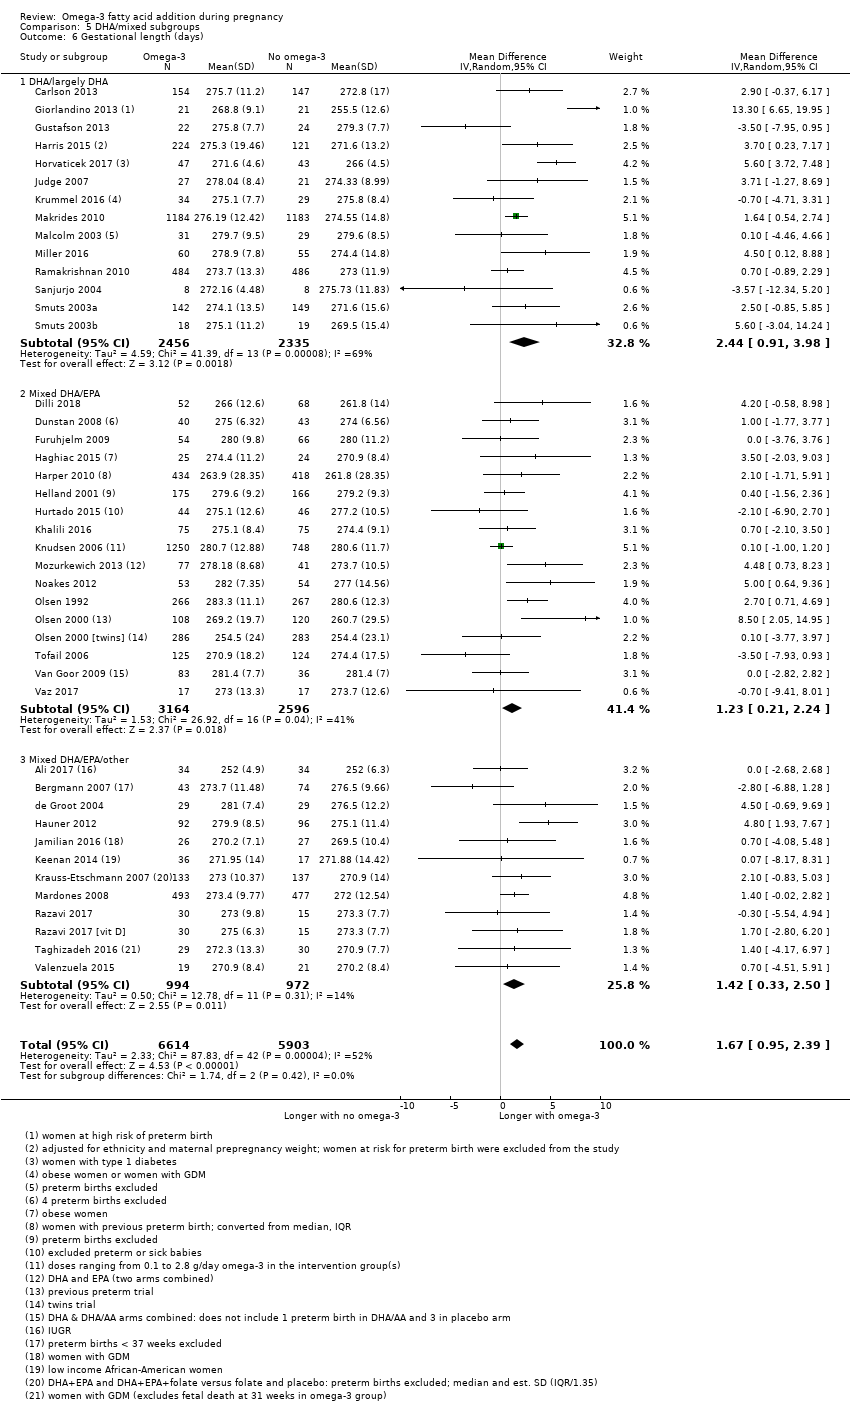
Comparison 5 DHA/mixed subgroups, Outcome 6 Gestational length (days).
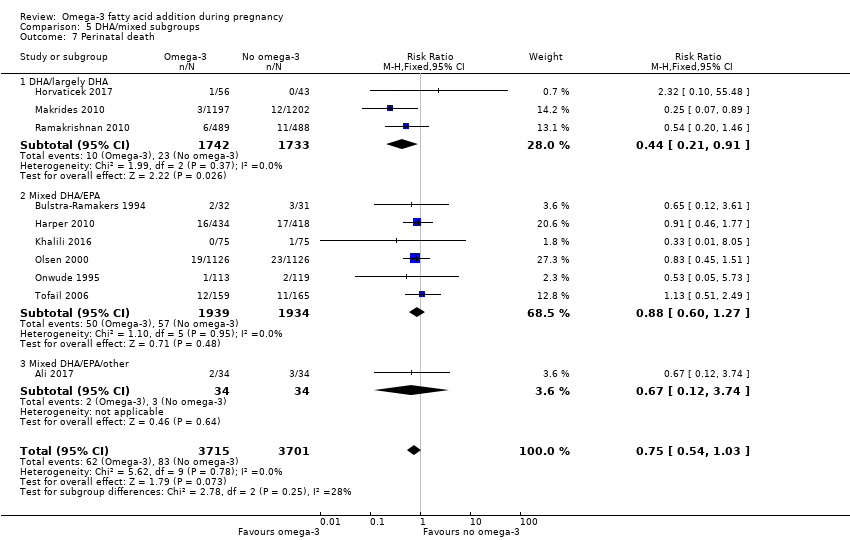
Comparison 5 DHA/mixed subgroups, Outcome 7 Perinatal death.
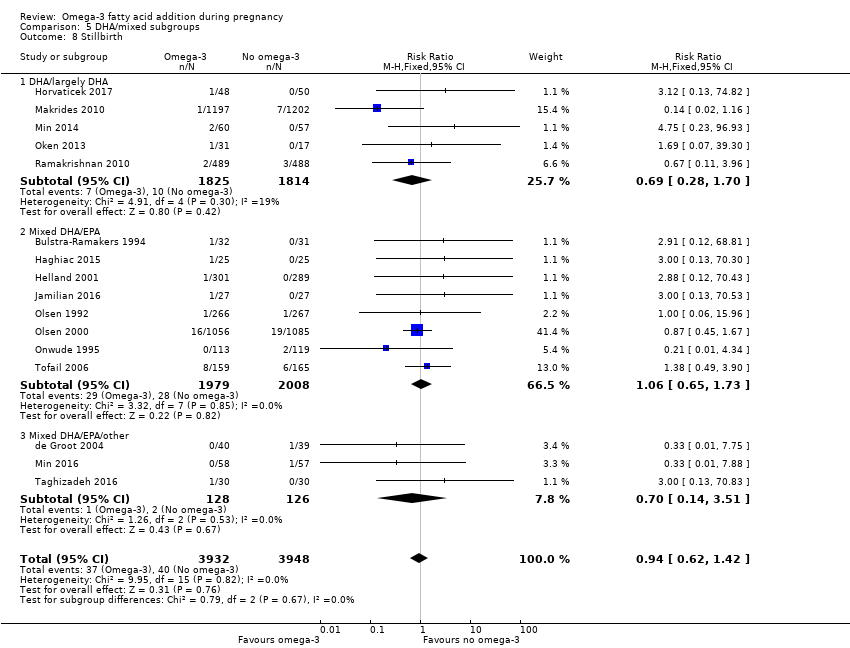
Comparison 5 DHA/mixed subgroups, Outcome 8 Stillbirth.
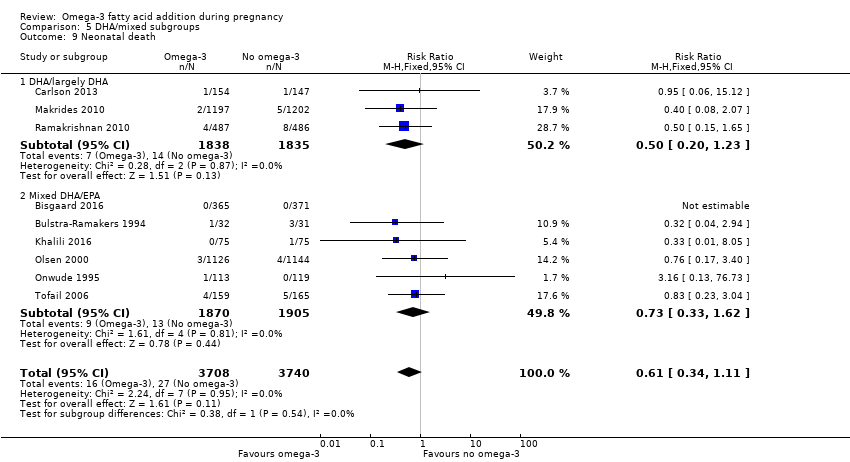
Comparison 5 DHA/mixed subgroups, Outcome 9 Neonatal death.
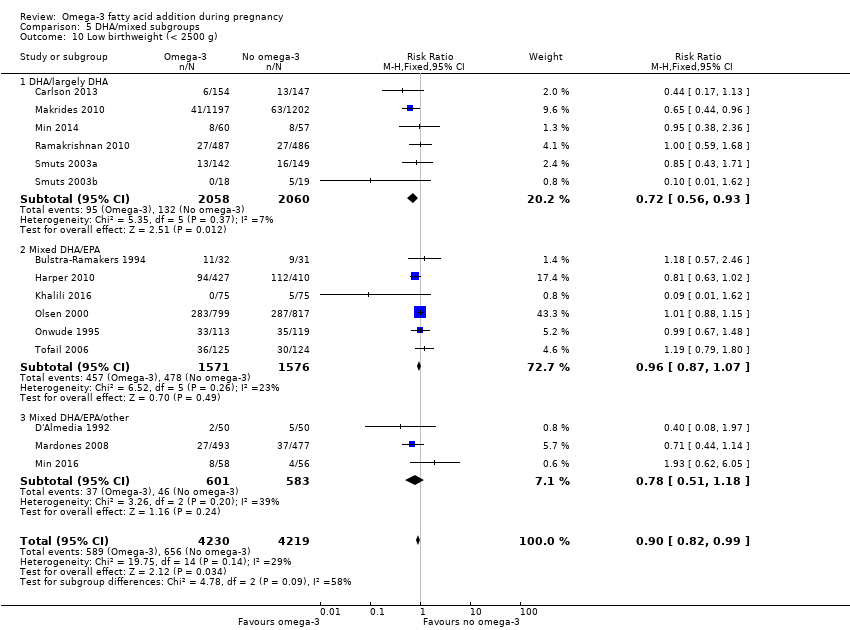
Comparison 5 DHA/mixed subgroups, Outcome 10 Low birthweight (< 2500 g).
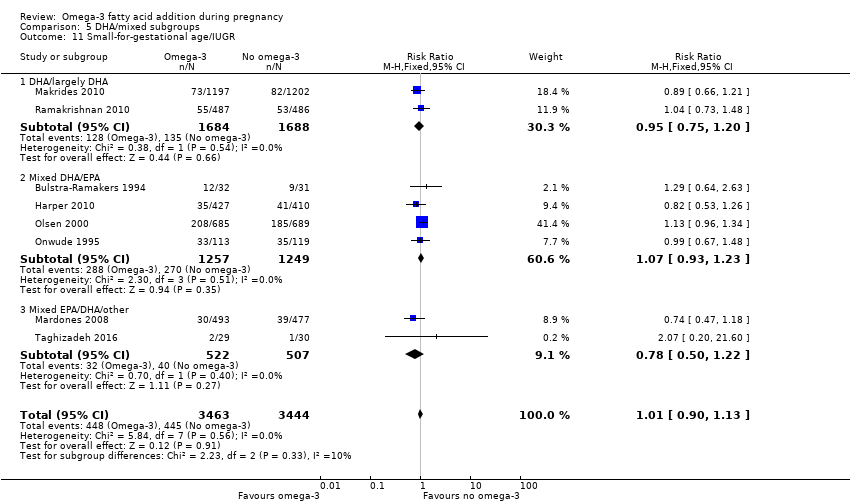
Comparison 5 DHA/mixed subgroups, Outcome 11 Small‐for‐gestational age/IUGR.

Comparison 5 DHA/mixed subgroups, Outcome 12 Birthweight (g).

Comparison 6 Risk subgroups, Outcome 1 Preterm birth (< 37 weeks).

Comparison 6 Risk subgroups, Outcome 2 Early preterm birth (< 34 weeks).

Comparison 6 Risk subgroups, Outcome 3 Prolonged gestation (> 42 weeks).

Comparison 6 Risk subgroups, Outcome 4 Pre‐eclampsia (hypertension with proteinuria).

Comparison 6 Risk subgroups, Outcome 5 Caesarean section.

Comparison 6 Risk subgroups, Outcome 6 Length of gestation (days).

Comparison 6 Risk subgroups, Outcome 7 Perinatal death.

Comparison 6 Risk subgroups, Outcome 8 Stillbirth.

Comparison 6 Risk subgroups, Outcome 9 Neonatal death.
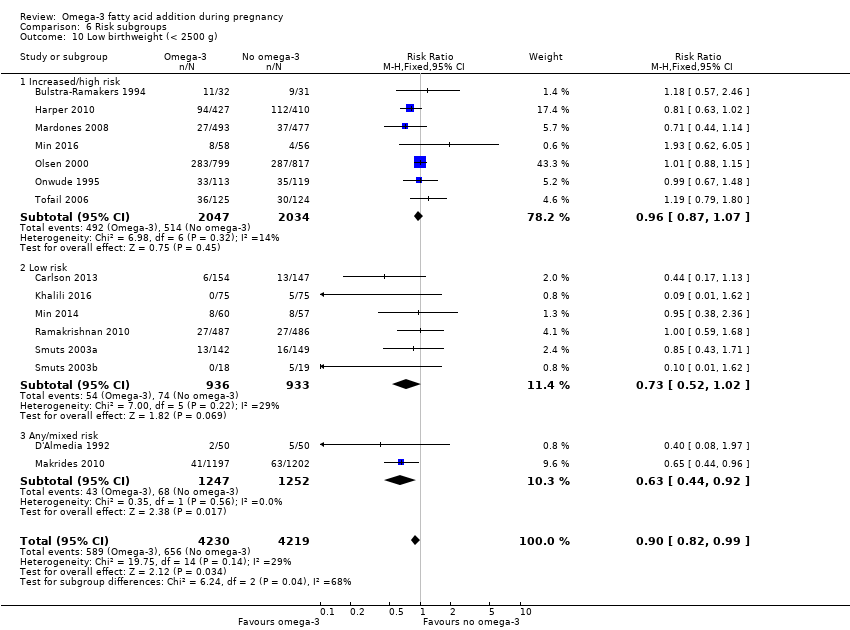
Comparison 6 Risk subgroups, Outcome 10 Low birthweight (< 2500 g).

Comparison 6 Risk subgroups, Outcome 11 Small‐for‐gestational age/IUGR.

Comparison 6 Risk subgroups, Outcome 12 Birthweight (g).
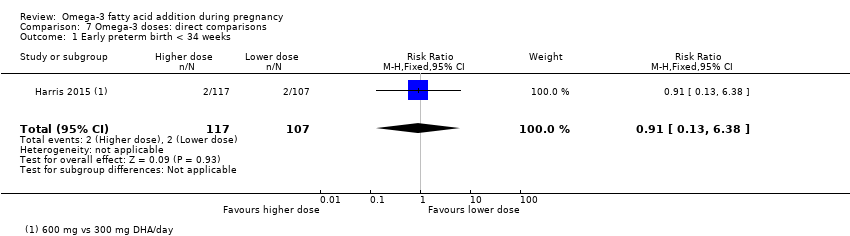
Comparison 7 Omega‐3 doses: direct comparisons, Outcome 1 Early preterm birth < 34 weeks.
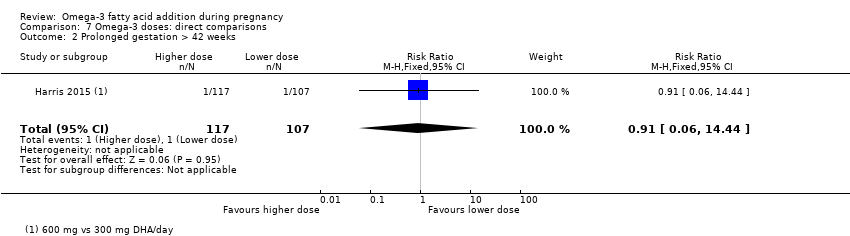
Comparison 7 Omega‐3 doses: direct comparisons, Outcome 2 Prolonged gestation > 42 weeks.

Comparison 7 Omega‐3 doses: direct comparisons, Outcome 3 Pre‐eclampsia.

Comparison 7 Omega‐3 doses: direct comparisons, Outcome 4 Induction (post‐term).
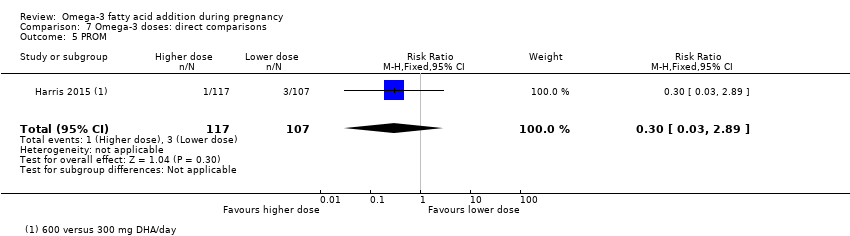
Comparison 7 Omega‐3 doses: direct comparisons, Outcome 5 PROM.

Comparison 7 Omega‐3 doses: direct comparisons, Outcome 6 PPROM.
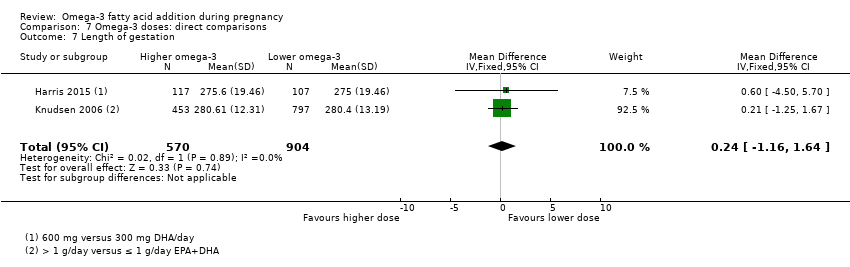
Comparison 7 Omega‐3 doses: direct comparisons, Outcome 7 Length of gestation.
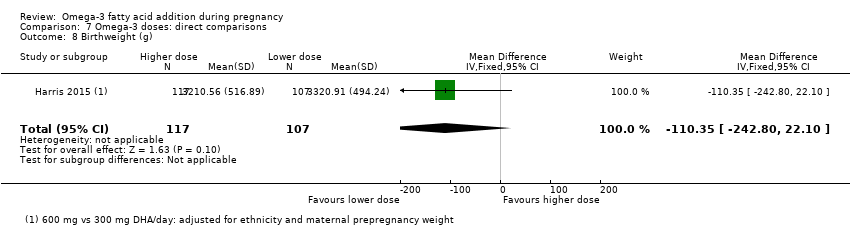
Comparison 7 Omega‐3 doses: direct comparisons, Outcome 8 Birthweight (g).

Comparison 7 Omega‐3 doses: direct comparisons, Outcome 9 Length at birth (cm).

Comparison 7 Omega‐3 doses: direct comparisons, Outcome 10 Head circumference at birth (cm).

Comparison 8 Omega‐3 type: direct comparisons, Outcome 1 Gestational diabetes.
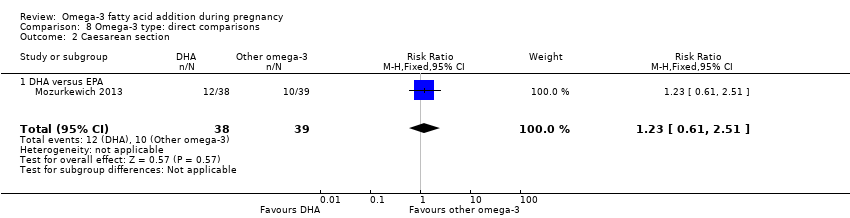
Comparison 8 Omega‐3 type: direct comparisons, Outcome 2 Caesarean section.
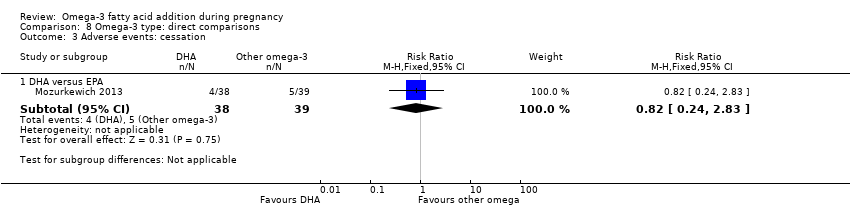
Comparison 8 Omega‐3 type: direct comparisons, Outcome 3 Adverse events: cessation.

Comparison 8 Omega‐3 type: direct comparisons, Outcome 4 Pre‐eclampsia.

Comparison 8 Omega‐3 type: direct comparisons, Outcome 5 Blood loss at birth (mL).
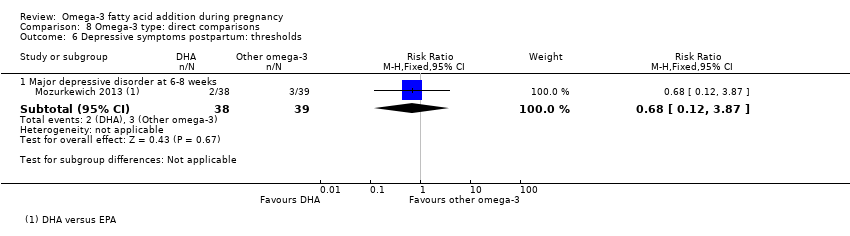
Comparison 8 Omega‐3 type: direct comparisons, Outcome 6 Depressive symptoms postpartum: thresholds.

Comparison 8 Omega‐3 type: direct comparisons, Outcome 7 Depressive symptoms postpartum: scores.
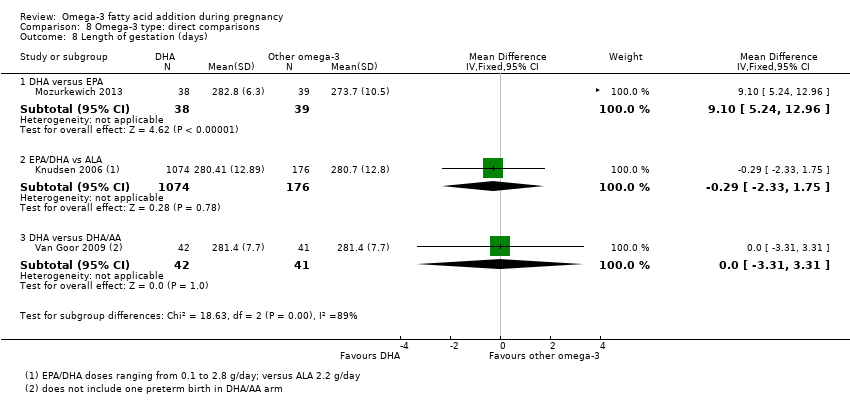
Comparison 8 Omega‐3 type: direct comparisons, Outcome 8 Length of gestation (days).
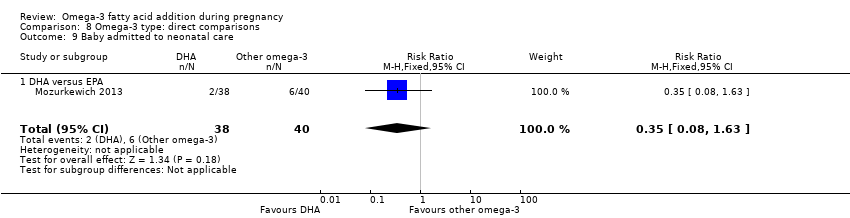
Comparison 8 Omega‐3 type: direct comparisons, Outcome 9 Baby admitted to neonatal care.

Comparison 8 Omega‐3 type: direct comparisons, Outcome 10 Birthweight (g).

Comparison 8 Omega‐3 type: direct comparisons, Outcome 11 Infant weight (kg).
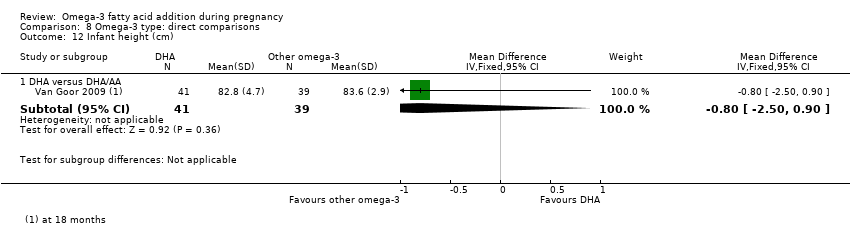
Comparison 8 Omega‐3 type: direct comparisons, Outcome 12 Infant height (cm).
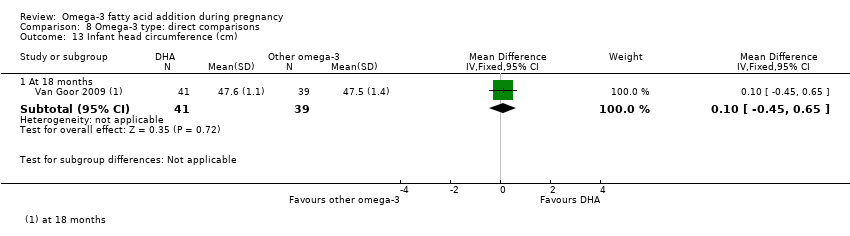
Comparison 8 Omega‐3 type: direct comparisons, Outcome 13 Infant head circumference (cm).

Comparison 8 Omega‐3 type: direct comparisons, Outcome 14 Cognition: Scores.
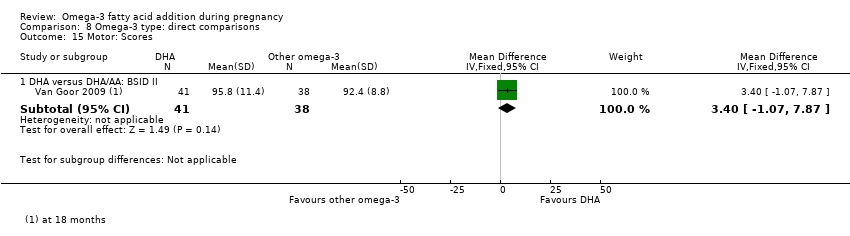
Comparison 8 Omega‐3 type: direct comparisons, Outcome 15 Motor: Scores.
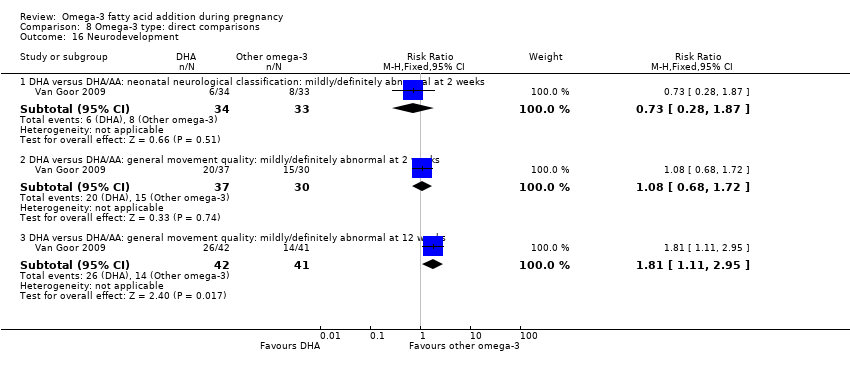
Comparison 8 Omega‐3 type: direct comparisons, Outcome 16 Neurodevelopment.

Comparison 8 Omega‐3 type: direct comparisons, Outcome 17 Cerebral palsy.
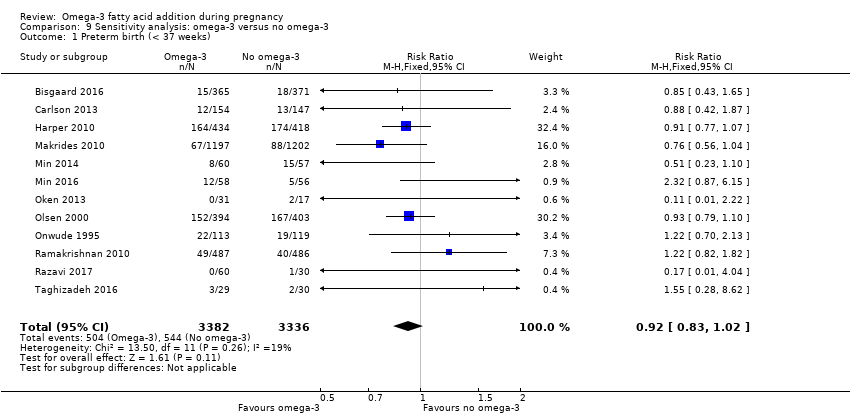
Comparison 9 Sensitivity analysis: omega‐3 versus no omega‐3, Outcome 1 Preterm birth (< 37 weeks).

Comparison 9 Sensitivity analysis: omega‐3 versus no omega‐3, Outcome 2 Early preterm birth (< 34 weeks).
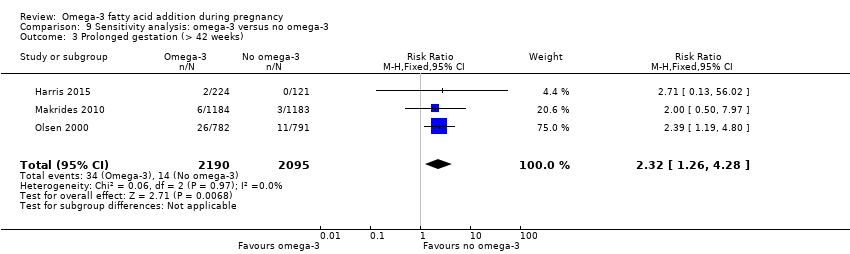
Comparison 9 Sensitivity analysis: omega‐3 versus no omega‐3, Outcome 3 Prolonged gestation (> 42 weeks).
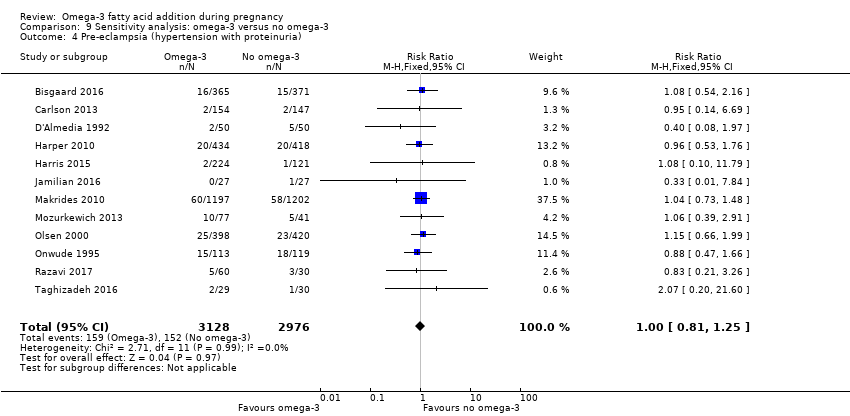
Comparison 9 Sensitivity analysis: omega‐3 versus no omega‐3, Outcome 4 Pre‐eclampsia (hypertension with proteinuria).

Comparison 9 Sensitivity analysis: omega‐3 versus no omega‐3, Outcome 5 Caesarean section.
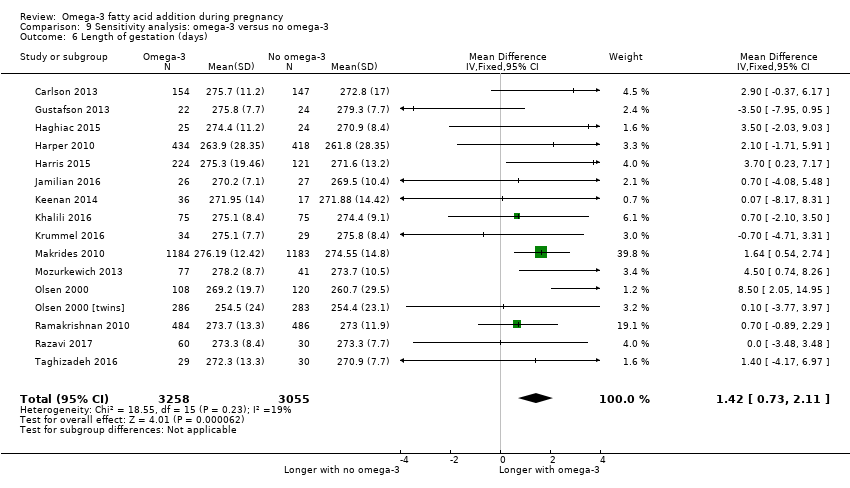
Comparison 9 Sensitivity analysis: omega‐3 versus no omega‐3, Outcome 6 Length of gestation (days).

Comparison 9 Sensitivity analysis: omega‐3 versus no omega‐3, Outcome 7 Perinatal death.
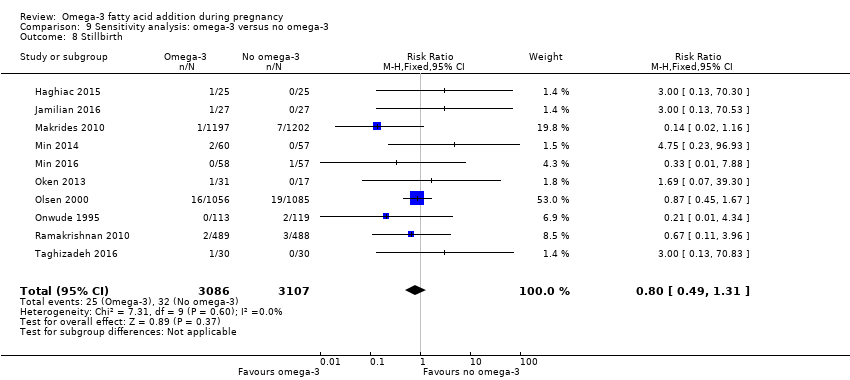
Comparison 9 Sensitivity analysis: omega‐3 versus no omega‐3, Outcome 8 Stillbirth.
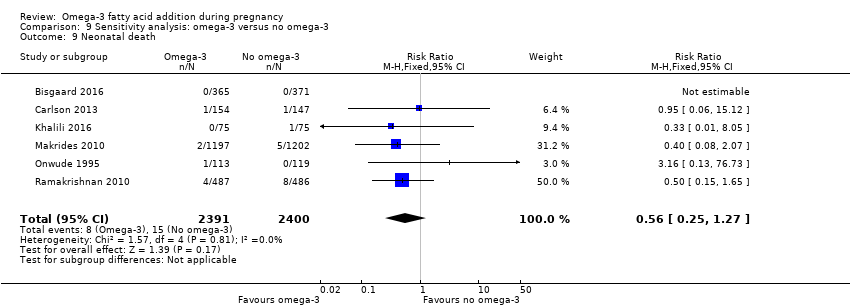
Comparison 9 Sensitivity analysis: omega‐3 versus no omega‐3, Outcome 9 Neonatal death.
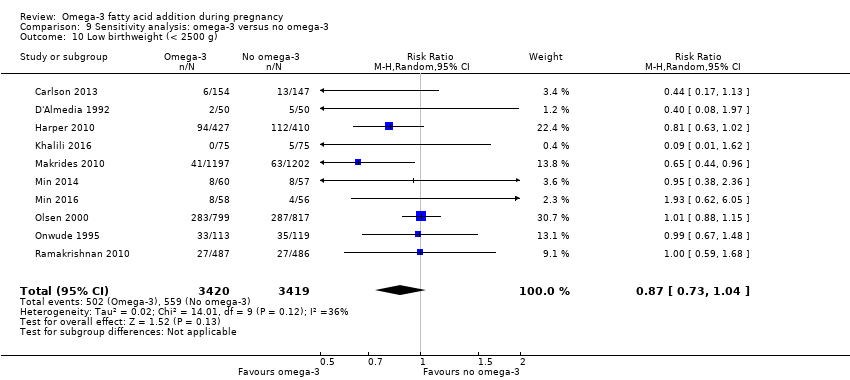
Comparison 9 Sensitivity analysis: omega‐3 versus no omega‐3, Outcome 10 Low birthweight (< 2500 g).
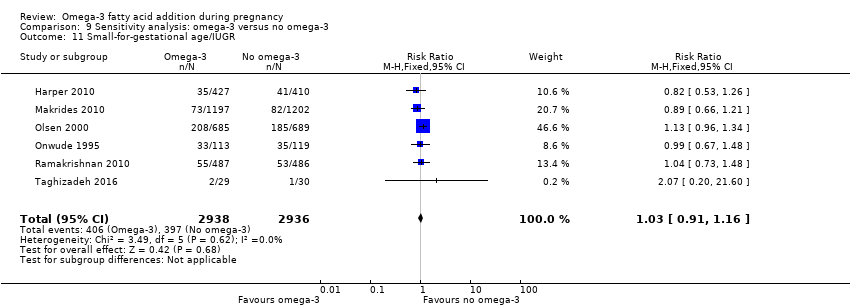
Comparison 9 Sensitivity analysis: omega‐3 versus no omega‐3, Outcome 11 Small‐for‐gestational age/IUGR.

Comparison 9 Sensitivity analysis: omega‐3 versus no omega‐3, Outcome 12 Birthweight (g).
| Omega‐3 LCPUFA compared with no omega‐3 during pregnancy: birth/infant outcomes | ||||||
| Population: pregnant women and their babies Settings: Angola (1 RCT), Australia (1 RCT), Belgium (1 RCT), Canada (1 RCT), Chile (1 RCT), Croatia (1 RCT), Chile (1 RCT), Denmark (3 RCTs), Egypt (1 RCT), Germany (2 RCTs), India (1 RCT), Iran (3 RCTs), Italy (1 RCT), Mexico (1 RCT), Netherlands (3 RCTs), Norway (1 RCT), Russia (1 RCT), Sweden (1 RCT), Turkey (1 RCT), UK (4 RCTs), USA (8 RCTs) Intervention: omega 3 Comparison: no omega‐3 | ||||||
| Outcomes | Illustrative comparative risks* (95% CI) | Relative effect | No of participants | Quality of the evidence | Comments | |
| Assumed risk | Corresponding risk | |||||
| Risk with no omega‐3 | Risk with omega‐3 | |||||
| Preterm birth < 37 weeks | 134/1000 | 119 per 1000 (109 to 130) | RR 0.89 (0.81 to 0.97) | 10,304 (26 RCTs) | ⊕⊕⊕⊕ HIGH1 | |
| Early preterm birth < 34 weeks | 46/1000 | 27 per 1000 (20 to 35) | RR 0.58 (0.44 to 0.77) | 5204 (9 RCTs) | ⊕⊕⊕⊕ HIGH2 | |
| Perinatal death | 20/1000 | 15 per 1000 (11 to 21) | RR 0.75 (0.54 to 1.03) | 7416 (10 RCTs) | ⊕⊕⊕⊝ MODERATE3 | |
| SGA/IUGR | 129/1000 | 130 per 1000 (116 to 146) | RR 1.01 (0.90 to 1.13) | 6907 (8 RCTs) | ⊕⊕⊕⊝ MODERATE3 | |
| LBW | 156/1000 | 140 (128 to 154) | RR 0.90 (0.82 to 0.99) | 8449 (15 RCTs) | ⊕⊕⊕⊕ HIGH | |
| LGA | 117/1000 | 134 per 1000 (113 to 159) | RR 1.15 (0.97 to 1.36) | 3722 (6 RCTs) | ⊕⊕⊕⊝ MODERATE4 | |
| Serious adverse events for neonate/infant | 63/1000 | 45 per 1000 (37 to 62) | RR 0.72 (0.53 to 0.99) | 2690 (2 RCTs) | ⊕⊕⊝⊝ low:5 | |
| *The basis for the assumed risk (e.g. the median control group risk across studies) is provided in footnotes. The corresponding risk (and its 95% confidence interval) is based on the assumed risk in the comparison group and the relative effect of the intervention (and its 95% CI). | ||||||
| GRADE Working Group grades of evidence | ||||||
| 1 Design limitations: larger studies of high quality, but some smaller studies with unclear risk of selective reporting and some smaller studies with unclear or high attrition bias at the time of birth (not downgraded for study limitations) 2 Design limitations: larger studies of higher quality, but several studies with unclear or high attrition bias at the time of birth, or baseline imbalances (not downgraded for study limitations) 3 Imprecision (‐1): downgraded one level due to crossing line of no effect and/or wide confidence intervals 4 Imprecision (‐1): downgraded one level due to wide confidence intervals 5 Design limitations (‐2): downgraded two levels; one study with unclear allocation concealment and attrition bias; specific adverse events not detailed in this study | ||||||
| Omega‐3 LCPUFA compared with no omega‐3 during pregnancy: maternal outcomes | ||||||
| Population: pregnant women Settings: Angola (1 RCT), Australia (2 RCTs), Belgium (1 RCT), Brazil (1 RCT), Chile (1 RCT), Croatia (1 RCT), Denmark (3 RCTs), Egypt (1 RCT), Germany (3 RCTs), Hungary (1 RCT), Iran (5 RCTs), India (1 RCT), Italy (2 RCTs), Mexico (1 RCT), Netherlands (4 RCTs), Norway (2 RCTs), Russia (1 RCT), Scotland (2 RCTs), Spain (4 RCTs) Sweden (2 RCTs), Turkey (1 RCT), UK (3 RCTs) USA (12 RCTs), Venezuela (1 RCT) Intervention: omega‐3 Comparison: no omega‐3 | ||||||
| Outcomes | Illustrative comparative risks* (95% CI) | Relative effect | No of participants | Quality of the evidence | Comments | |
| Assumed risk | Corresponding risk | |||||
| Risk with no omega‐3 | Risk with omega‐3 | |||||
| Prolonged gestation > 42 weeks | 16/1000 | 26/1000 (18 to 37) | RR 1.61 (1.11 to 2.33) | 5141 (6) | ⊕⊕⊕⊝ MODERATE6 | |
| Induction post‐term | 83/1000 | 68/1000 (18 to 247) | Average RR 0.82 (0.22 to 2.98) | 2900 (3) | ⊕⊕⊝⊝ LOW7 | |
| Pre‐eclampsia | 53/1000 | 44/1000 (37 to 53) | RR 0.84 (0.69 to 1.01) | 8306 (20) | ⊕⊕⊝⊝ LOW7 | Defined as hypertension with proteinuria |
| Gestational length | The mean gestational age in the intervention group was 1.67 days greater (0.95 greater to 2.39 days greater) | Average MD 1.67 days (0.95 to 2.39) | 12,517 (41) | ⊕⊕⊕⊝ MODERATE8 | ||
| Maternal serious adverse events | 6/1000 | 6/1000 (2 to 16) | RR 1.04 (0.40 to 2.72) | 2690 (2) | ⊕⊕⊝⊝ LOW9 | |
| Maternal admission to intensive care | 1/1000 | 1/1000 (0 to 3) | RR 0.56 (0.12 to 2.63) | 2458 (2) | ⊕⊕⊝⊝ LOW9 | |
| Postnatal depression | 112/1000 | 100 (80 to 125) | Average RR 0.99 (0.56 to 1.77) | 2431 (2) | ⊕⊕⊝⊝ LOW10 | |
| *The basis for the assumed risk (e.g. the median control group risk across studies) is provided in footnotes. The corresponding risk (and its 95% confidence interval) is based on the assumed risk in the comparison group and the relative effect of the intervention (and its 95% CI). | ||||||
| GRADE Working Group grades of evidence | ||||||
| 6 Design limitations (‐1): downgraded one level due to some studies with attrition bias and some selective reporting bias; and some imprecision (not downgraded) 7 Design limitations (‐1): downgraded one level for combined study limitations (mostly attrition bias and selective reporting bias); Imprecision (‐1): downgraded one level due to confidence intervals including line of no effect 8 Design limitations (‐1): downgraded one level for study limitations (mainly attrition bias): heterogeneity I2 = 54%, but not downgraded due to use of a random‐effects model 9 Imprecision (‐2): downgraded two levels for wide confidence intervals and only 2 studies 10 Design limitations (‐1): downgraded one level for study limitations (unclear randomisation in 1 study); downgraded one level for imprecision (wide confidence intervals; 2 studies only) | ||||||
| Omega‐3 LCPUFA compared with no omega‐3 during pregnancy: child/adult outcomes | ||||||
| Population: children of women randomised to omega‐3 or no omega‐3 during pregnancy Settings: Australia (2 RCTs), Bangladesh (1 RCT), Canada (1 RCT), Denmark (1 RCT), Hungary (1 RCT), Germany (1 RCT), Spain (2 RCTs), Mexico (1 RCT), Netherlands (1 RCT) Intervention: omega‐3 Comparison: no omega‐3 | ||||||
| Outcomes | Illustrative comparative risks* (95% CI) | Relative effect | No of participants | Quality of the evidence | Comments | |
| Assumed risk | Corresponding risk | |||||
| Risk with no omega‐3 | Risk with omega‐3 | |||||
| Cognition: BSID II score at < 24 months | The mean BSID II score at 24 months in the intervention group was 0.37 points lower in the intervention group (1.47 lower to 0.76 higher) | MD ‐0.37 (‐1.49 to 0.76) | 1154 (4) | ⊕⊕⊝⊝ LOW11 | ||
| Cognition: BSID III score at < 24 months | The mean BSID III score at 24 months in the intervention group was 0.04 points higher (1.59 lower to 1.68 higher) | MD 0.04 (‐1.59 to 1.68) | 809 (2) | ⊕⊕⊝⊝ LOW12 | ||
| IQ: WASI at 7 years | The mean WASI at 7 years in the intervention group was identical to the mean in the control group (0.79 points lower to 2.79 higher) | MD 1.00 (‐0.79 to 2.79) | 543 (1) | ⊕⊕⊝⊝ LOW12 | ||
| IQ: WISC‐IV at 12 years | The WISC‐IV at 12 years in the intervention group was identical to in the control group (5.16 points lower to 7.16 higher) | MD 1.00 (‐5.16 to 7.16) | 50 (1) | ⊕⊝⊝⊝ VERY LOW13 | ||
| Behaviour: BSID III adaptive behaviour score at 12‐18 months | The mean BSID III adaptive behaviour score in the intervention group at 12‐18 months was 1.20 points lower (3.12 lower to 0.72 higher) | MD ‐1.20 (‐3.12 to 0.72) | 809 (2) | ⊕⊕⊝⊝ LOW14 | At 12 months (one study), 18 months (one study) | |
| Behaviour: SDQ Total Difficulties at 7 years | The mean SDQ total difficulties score at 7 years in the intervention group was 1.08 higher (0.18 higher to 1.98 higher) | MD 1.08 (0.18 to 1.98) | 543 (1) | ⊕⊕⊝⊝ LOW12 | ||
| BMI at 19 years | The mean BMI at 19 years in the intervention group was identical to that in the control group (0.83 lower to 0.83 higher) | MD 0 (‐0.83 to 0.83) | 243 (1) | ⊕⊝⊝⊝ VERY LOW15 | ||
| Diabetes | Not reported | |||||
| *The basis for the assumed risk (e.g. the median control group risk across studies) is provided in footnotes. The corresponding risk (and its 95% confidence interval) is based on the assumed risk in the comparison group and the relative effect of the intervention (and its 95% CI). | ||||||
| GRADE Working Group grades of evidence | ||||||
| 11 Design limitations (‐1): downgraded one level due to unclear randomisation in 3 studies (that contributed 40% to meta‐analysis) and some studies at high risk of attrition bias; Imprecision (‐1): downgraded one level for wide confidence intervals including line of no effect 12 Imprecision (‐2): downgraded one level for confidence intervals including line of no effect; and one level for small number of studies/single study 13 Design limitations (‐1): downgraded one level for unclear selection bias (not clear if random sequence generated), possible attrition and/or reporting bias; Imprecision (‐2): downgraded two levels for wide confidence intervals including line of no effect and 1 study with small number of participants 14 Design limitations (‐1): downgraded one level for unclear randomisation (possible lack of allocation concealment), possible attrition and/or selective bias in 1 of the trials (contributing 15% to analysis); Imprecision (‐1): downgraded one level for confidence intervals including line of no effect and few studies Design limitations (‐1): downgraded one level for unclear sequence generation and unclear blinding: Imprecision (‐2): downgraded two levels for confidence intervals including line of no effect and 1 study with small number of participants | ||||||
| Omega‐3 compared with no omega‐3 during pregnancy: health services outcomes | ||||||
| Population: pregnant women and their infants Settings: Australia (1 RCT), Belgium (1 RCT), Denmark (2 RCTs), Egypt (1), Iran (2 RCTs), Italy (1 RCT), Netherlands (1 RCT), Norway (1 RCT), Russia (1 RCT), Scotland (1 RCT), UK (1 RCT), USA (5 RCTs) Intervention: omega‐3 Comparison: no omega‐3 | ||||||
| Outcomes | Illustrative comparative risks* (95% CI) | Relative effect | No of participants | Quality of the evidence | Comments | |
| Assumed risk | Corresponding risk | |||||
| no omega‐3 | omega‐3 | |||||
| Maternal hospital admission (antenatal) | 273/1000 | 251/1000 (221 to 284) | RR 0.92 (0.81 to 1.04) | 2876 (5) | ⊕⊕⊝⊝ LOW 16 | |
| Infant admission to neonatal care | 151/1000 | 139/1000 (125 to 156) | RR 0.92 (0.83 to 1.03) | 6920 (9) | ⊕⊕⊕⊝ MODERATE 17 | |
| Maternal length of hospital stay (days) | The mean length of stay in the intervention group was 0.18 days greater (0.20 less to 0.57 days greater) | MD 0.18 (‐0.20 to 0.57) | 2290 (2) | ⊕⊕⊝⊝ LOW 8 | ||
| Infant length of hospital stay (days) | The mean length of stay in the intervention group was 0.11 days greater (1.40 less to 1.62 days greater) | MD 0.11 (‐1.40 to 1.62) | 2041 (1) | ⊕⊕⊝⊝ LOW 8 | ||
| Costs | Not reported | |||||
| *The basis for the assumed risk (e.g. the median control group risk across studies) is provided in footnotes. The corresponding risk (and its 95% confidence interval) is based on the assumed risk in the comparison group and the relative effect of the intervention (and its 95% CI). | ||||||
| GRADE Working Group grades of evidence | ||||||
| 16 Design limitations (‐1): downgraded one level due to some studies with possible risk of attrition bias; Imprecision (‐1): downgraded one level for confidence intervals including line of no effect 17 Imprecision (‐1): downgraded one level for confidence intervals including line of no effect 18 Imprecision (‐2): downgraded one level for confidence intervals including line of no effect and once for small number of studies | ||||||
| Study ID | Omega‐3 (mean (SD)unless otherwise reported) | No omega‐3 (mean (SD)unless otherwise reported) |
| 27 (4.3) | 27 (4.8) | |
| 30.9 (4.6) for DHA/FOS group | 30.0 (4.62) in vitamin/mineral group; 31 (4.71) for FOS group | |
| 32.3 (4.3) | 32.2 (4.5) | |
| "The three study groups were similar in baseline characteristics with regard to maternal age at delivery (data not shown)". | ||
| 31.4 (3.9) | 31.2 (4.0) | |
| Not reported | ||
| 25.3 (4.9) | 24.8 (4.7) | |
| Not reported | ||
| "Ages ranged from 14‐40 years" | ||
| 30.0 (3.3) | 29.2 (3.8) | |
| 30.9 (5.3) | 32.7 (5.9) | |
| 30.9 (3.7) | 32.6 (3.6) | |
| Not reported | ||
| 31.0 (5.8) | 29.7 (6.2) | |
| 31.1 (4.1) | 31.7 (3.9) | |
| 32.6 (4.6) | 32.2 (4.8) | |
| 25.5 (4.3) | 25.6 (4.8) | |
| 27 (5) | 27 (5) | |
| Median (interquartile range): 28 (23 ‐ 32) | Median (interquartile range): 27 (24‐32) | |
| In high‐dose group 24.5 (12.72); In low‐dose group 24.3 (12.72) | 27.0 (9.05) | |
| 31.9 (4.9) | 31.6 (4.5) | |
| 28.6 (3.4) | 27.6 (3.2) | |
| 29.8 (5.5) | 29.6 (4.8) | |
| 30.5 (4.8) | 29.9 (4.7) | |
| 27.17 (6.34) | 26.71 (5.66) | |
| 30.1 (5.3) | 30.0 (5.5) | |
| 30.7 (3.5) for omega‐3 group 31.2 (4.3) for omega‐3 + vitamin D group | 30.7 (4.1) for placebo group 31.5 (7.0) for vitamin D group | |
| 23.9 (4.3) | 24.7 (4.8) | |
| Not reported | ||
| 26.33 (4.2) | 25.15 (4.2) | |
| Not reported | ||
| 25.9 (4.8) | 26.9 (4.5) | |
| 28.4 for 0.1 g/day EPA + DHA group 28.7 for 0.3 g/day EPA + DHA group 28.4 for 0.7 g/day EPA + DHA group 28.9 for 1.4 g/day EPA + DHA group 28.8 for 2.8 g/day EPA + DHA group 28.8 for 2.2g/day ALA group | 28.5 for no treatment group | |
| Median (range): 30.6 (20.1 ‐ 41.1) for DHA/EPA group Median (range): 31.1 (21.5 ‐ 40.1) for DHA/EPA+folate group | Median (range): 31.1 (18.8 ‐ 40.8) for folate group Median (range): 31.1 (18.4 ‐ 40.3) for no treatment (placebo) group | |
| 27.9 (4.6) | 26.3 (5.0) | |
| Median (IQR): 30.3 (24‐40) | Median (IQR): 30.2 (26‐32) in placebo group; 32.0 (23‐40) in primrose oil group | |
| 28.9 (5.7) | 28.9 (5.6) | |
| Not reported | ||
| 25.06 (5.73) | 25.11 (7.45) | |
| Not reported | ||
| 31.7 (4.4) | 31.2 (4.4) | |
| Median (range): 29 (18 ‐ 42) | Median (range): 29 (18 ‐ 44) | |
| Median (range): 34 (20 ‐ 45) | Median (range): 37 (27‐45) | |
| Median (range): 31.0 (21.0 ‐ 41.0) | Median (range): 32.0 (21.0 ‐ 44.0) | |
| 30.6 (4.5) in DHA rich fish oil group; 29.9 (5.0) in EPA rich fish oil group | 30.4 (5.9) | |
| 32.6 (4.04) | 33.4 (3.61) | |
| 29.5 (3.94) | 28.4 (4.69) | |
| Not reported | ||
| Median (IQR): 32.6 (27.9 ‐ 35.9) advice group; 27.6 (24.5 ‐ 32.0) advice + gift card group | Median (IQR): 32.4 (27.7 to 34.3) | |
| 29.4 (4.4) | olive oil group 29.7 (4.3); placebo/no oil group 29.1 (4.1) | |
| Prophylactic trials PD trial 29.3 (4.87) IUGR trial 30 (4.64) PIH trial 30.3 (7.01) Twins trial 30.2 (6.18) Therapeutic trials Threat‐PE trial 32.1 (11.7) Susp‐IUGR trial 29.3 (7.88) | Prophylactic trials PD trial 30.0 (6.22) IUGR trial 29.0 (3.93) PIH trial 28.9 (5.32) Twins trial 30.2 (6.35) Therapeutic trials Threat‐PE trial 32.9 (14.6) Susp‐IUGR trial 29.8 (10.3) | |
| see Olsen 2000 | ||
| Mean (range): 26.6 (18‐39) | Mean (range): 26.1 (16‐40) | |
| 30.3 (5.2) | 28.3 (4.85) | |
| 30.86 (4.18) | 29.92 (4.80) | |
| 26.2 (4.6) | 26.3 (4.8) | |
| 30.06 (7.59) | 28.96 (6.40) | |
| 29.7 (3.6) for omega‐3 group 29.9 (4.0) for omega‐3 + vitamin D group | 29.2 (3.4) for placebo group 29.9 (5.0) for vitamin D group | |
| 31.2 (4.4) | 34.5 (3.8) | |
| Not reported | ||
| Not reported | ||
| Median (range): 26.8 (18‐39) | Median (range): 26.1 (16‐40) | |
| 34.5 (7.41) | 31.25 (5.18) | |
| 21.7 (4.3) | 21.6 (4.2) | |
| High DHA egg group 19.9 (4.1) | Ordinary egg group 24.8 (7.8) | |
| 30.9 (3.9) | 31.3 (5.7) | |
| 28.6 (6.3) | 29.4 (4.4) | |
| 22.1 (4.2) | 23.4 (4.5) | |
| 29 (4.7) | 28.3 (6.7) | |
| Median (range): 32.3 (22.3 ‐ 43.3) in DHA group; 31.5 (24.8 ‐ 41.4) in DHA + AA group | Median (range): 33.5 (26.0 ‐ 40.3) | |
| Not reported | ||
| Median (IQR): 25.5 (22.0‐34.5) | Median (IQR): 27.0 (21.0 ‐ 31.0) | |
| Abbreviations: IQR (interquartile range) | ||
| Study ID | Omega‐3 | No omega‐3 |
| Mean (SD): 2.9 (4.8) | Mean (SD): 2.8 (1.6) | |
| > 1: 22 (45.8%) in DHA/FOS group | > 1: 28 (57.1%) in vitamin/mineral group 24 (51.1%) in FOS group | |
| 1: 155 (44.8%) | 1: 166 (47.6%) | |
| Not reported | ||
| Median (IQR): 0.5 (0,1) | Median (IQR): 0 (0,1) | |
| Not reported | ||
| Prior pregnancies, N Mean (SD): 1.2 (1.3) | Prior pregnancies, N Mean (SD): 1.3 (1.4) | |
| Not reported | ||
| Not reported | ||
| 0: 11 (38%) 1: 15 (52%) 2: 3 (10%) 3: 0 (0%) | 0: 12 (41%) 1: 11 (38%) 2: 5 (17%) 3: 1 (3%) | |
| ≥ 1: 15 (45.5%) | ≥ 1: 21 (53.8%) | |
| Not reported | ||
| Primiparous: 24 (77.4%) | Primiparous: 22 (78.6%) | |
| Not reported | ||
| Not reported | ||
| Not reported | ||
| 0: 7 (28%) 1:18 (72%) | 0: 5 (21%) 1: 19 (79%) | |
| Not reported | ||
| Not reported | ||
| Primiparous: 55.8% | Primiparous: 61.2% | |
| Mean (SD): 0.3 (0.5) | Mean (SD): 0.3 (0.5) | |
| Nulliparous: 25 (53%) Primiparous: 22 (47%) | Nulliparous: 26 (60%) Primiparous: 17 (40%) | |
| Multiparous: 35.6% | Multiparous: 31.8% | |
| Mean (SD): 1.38 (1.67) | Mean (SD): 1.53 (1.55) | |
| Not reported | ||
| Not reported | ||
| Mean (SD): 1.5 (0.8) | Mean (SD): 1.8 (0.8) | |
| Not reported | ||
| Not reported | ||
| Not reported | ||
| 1: 38 (50.7%) 2: 28 (37.3%) ≥ 3: 9 (12.0%) | 1: 37 (49.3%) 2: 27 (36%) ≥ 3: 11 (14.7%) | |
| Primiparous women 0.1 g/day EPA + DHA group: 257 (66.2%) 0.3 g/day EPA + DHA group: 267 (69.5%) 0.7 g/day EPA + DHA group: 244 (63.5%) 1.4 g/day EPA + DHA group: 247 (64.7%) 2.8 g/day EPA + DHA group: 246 (62.9%) 2.2 g/day ALA group: 258 (66.3%) | Primiparous women No treatment group: 513 (66.4%) | |
| < 2: 56 (86%) for DHA/EPA group; 56 (88%) for DHA/EPA+folate group 2: 7 (11%) for DHA/EPA group; 6 (9%) for DHA/EPA+folate group > 2: 2 (3%) for DHA/EPA group; 2 (3%) for DHA/EPA+folate group | < 2: 65 (90%) for folate group; 61 (88%) for placebo group 2: 7 (10%).for folate group; 7 (10%) for placebo group > 2: 0 (0) for folate group; 1 (1%) for placebo group | |
| Not reported | ||
| Nulliparous: 2 (66%) in fish oil group Primiparous: 1 in (33%) fish oil group | Nulliparous: 1 (25%) in primrose oil group; 3 (75%) in placebo group Primiparous: 3 (60%) in primrose oil group; 2 (40%) in placebo group | |
| Primiparous: 471 (39.3%) | Primiparous: 474 (39.4%) | |
| Not reported | ||
| Mean (SD): 1.68 (0.90) | Mean (SD): 1.74 (0.91) | |
| Not reported | ||
| Not reported | ||
| 0: 18 (40%) 1‐3: 26 (57.8%) > 4: 1 (2.2%) | 0: 14 (35.0%) 1‐3: 23 (57.5%) > 4: 2 (5.0%) | |
| 0: 10 (24%) 1‐3: 27 (65.9%) > 4: 3 (7.3%) | 0: 7 (14.9%) 1‐3: 32 (68.1%) > 4: 6 (12.8%) | |
| 0: 33 (50%) 1‐3: 27 (41%) ≥ 4: 6 (9%) | 0: 24 (35%) 1‐3: 40 (57%) ≥ 4: 5 (7%) | |
| Mean (SD): 0.87 (0.83) for EPA rich fish oil group; 1.08 (0.94) for DHA rich fish oil group | Mean (SD): 0.85 (1.2) | |
| 1: 60.6% 2: 30.8% > 2: 8.6% | 1: 47.7% 2: 36.7% > 2: 15.6% | |
| Not reported | ||
| Not reported | ||
| Primiparous: 6 (35%) in advice group; 4 (24%) in advice + gift card group | Primiparous: 6 (30%) in control group | |
| Primiparous: Fish oil group: 56% | Primiparous: Olive oil group: 61% No oil group: 60% | |
| Prophylactic trials: no nulliparous women except for: Twins trial: 52.5% nulliparous Therapeutic trials Threat‐PE trial: 71.4% nulliparous Susp‐IUGR trial: 52.0% nulliparous | Prophylactic trials: no nulliparous women except for: Twins trial: 52.5% nulliparous Therapeutic trials Threat‐PE trial: 65.6% nulliparous Susp‐IUGR trial: 51.9% nulliparous | |
| Included primiparous and multiparous women | ||
| Primiparous: 8 (67%) | Primiparous: 5 (42%) | |
| 0: 46 (36%) 1: 83 (64%) | 0: 50 (40%) 1: 76 (60%) | |
| Not reported | ||
| Mean (SD): 0.46 (0.50) | Mean (SD): 0.40 (0.49) | |
| Not reported | ||
| Mean (SD): 1.4 (0.9) | Mean (SD): 1.6 (1.2) | |
| Not reported | ||
| Excluded nulliparous women | ||
| Not reported | ||
| Mean (SD): 1.63 (0.74) | Mean (SD): 1.38 (0.52) | |
| Nulliparous before study: 68% | Nulliparous before study: 58% | |
| Women were excluded if they had more than 4 previous pregnancies Mean (SD): 1.9 (1.1) | Mean (SD): 2.3 (1.9) | |
| Mean (SD): 1.7 (1.1) | Mean (SD): 1.8 (1.1) | |
| Not reported | ||
| Women with > 2 children: 16.8% | Women with > 2 children: 31.5% | |
| Included women with 1‐4 prior births | ||
| Included women with a first or second pregnancy | ||
| Not reported | ||
| 0‐1: 26 (81.2%) ≥ 2: 6 (18.8%) | 0‐1: 18 (64.3%) ≥ 2: 10 (35.7%) | |
| Study | Eligibility criteria |
| Excluded women taking ≥ 300 mg DHA a day | |
| Excluded women planning to take DHA during pregnancy | |
| Excluded women consuming fish more than twice a week | |
| Excluded women consuming fish more than twice a week | |
| Excluded women with a previous intolerance to omega‐3 fatty acids | |
| Excluded women with an allergy to fish or undergoing treatment with omega‐3 fatty acid supplements | |
| Excluded women with an allergy to fish or regular intake of fish oil | |
| Excluded women taking more than 200 mg DHA a day | |
| Excluded women with an allergy to fish or fish products; women who do not eat any fish; and women with a regular intake of fish oil (> 500 mg/week in the previous 4 weeks) | |
| Excluded women with an allergy to fish or fish products; and women with a regular intake of fish oil supplements (> 500 mg/week at any time during the preceding month) | |
| Excluded women with allergies to fish or consumption of salmon, mackerel, rainbow trout or sardines at least weekly | |
| Excluded women taking omega‐3 supplementation before randomisation | |
| Excluded women already taking DHA | |
| Did not include women taking DHA supplements in pregnancy | |
| Excluded women taking omega‐3 fatty acid supplements | |
| Excluded women consuming fish more than twice a week | |
| Excluded women consuming ≥ 2 servings of sea fish a week | |
| Excluded women with an allergy to fish oil or fish products; and women consuming fish more than twice a week | |
| Included women with only limited fish intake and who did not use fish oil capsules during pregnancy | |
| Excluded women who had used fish oil supplements since the beginning of their pregnancy | |
| Excluded women who consumed > 1 fish meal/week or who used DHA‐fortified foods or supplements | |
| Excluded women who were already taking DHA supplements | |
| Excluded women with an allergy to fish products | |
| Excluded women with an allergy to seafood or fish oils | |
| Excluded women taking fish oil supplements | |
| Excluded women taking omega‐3 fatty acid supplements and women consuming > 2 fish meals a week | |
| Excluded women taking any lipid or fatty acid supplementation | |
| included women with a diet low in oily fish (excluding canned tuna) ≤ twice per month | |
| Excluded women with an allergy to fish and fish oil and women previously regularly taking a preconception fish oil supplement | |
| Excluded women consuming fish > 3 times a month; or with no contraindications to fish consumption such as allergy, or self‐restrictions such as a vegetarian diet | |
| Excluded women with a fish allergy or regular intake of fish oil | |
| Excluded women with a fish allergy or regular intake of fish oil | |
| Only included women who consumed fish at least twice a week (equivalent to 600 g fish a week) | |
| Excluded women regularly taking fish oil or DHA supplements | |
| Excluded women taking omega‐3 fatty acid supplements | |
| Excluded women taking fish oil supplements or eating more than 3 oily fish portions per week; not showing any signs of intolerance or allergy to fish | |
| Excluded women with any signs of intolerance or allergy to fish or using dietary supplements containing omega‐3 and omega‐6 PUFA | |
| Excluded women with a diet including polyunsaturated fatty acids (PUFA, ALA supplements) or LCPUFA (EPA and or DHA supplements) | |
| Excluded women who were vegetarians or vegans | |
| Excluded women taking any oil supplementation (such as fish oil, flaxseed oil or cod liver oil) |
| Study ID | omega‐3 | no omega‐3 |
| Not reported | ||
| Employed: 31 (77.5%) in DHA/folate group 13 years of schooling: 32 (66.7%) in DHA/folate group | Employed: 35 (85.4%) in Vit/Min group; 30 (78.9%) in folate group 13 years of schooling: 28 (57.1%) in Vit/Min group; 32 (68.1%) in folate group | |
| Household annual income: Low: 33 (9.6%) Medium: 179 (51.9%) High: 133 (38.6%) | Household annual income: Low: 34 (9.7%) Medium: 187 (53.6%) High: 128 (36.7%) | |
| Not reported | ||
| 15 or more years of education: 17 (94.4%) | 15 or more years of education: 15 (88.2%) | |
| Not reported | ||
| Maternal education: Mean (SD): 13.69 years (2.67) | Maternal education: Mean (SD): 13.36 years (2.72) | |
| Not reported | ||
| "Sixty‐nine percent were employed; ninety‐four percent of their husbands were employed". | ||
| Education measured on an 8‐point scale: Mean (SD): 4.3 (1.4) | Education measured on an 8‐point scale: Mean (SD): 3.9 (1.5) | |
| Maternal education: 10‐12 years: 10 (30.3%) > 12 years: 23 (69.7%) | Maternal education: 10‐12 years: 9 (23.1%) > 12 years: 30 (76.9%) | |
| Not reported | ||
| Maternal employment: 61.3% employed Maternal education: Mean (SD): 15.5 years ((2.1) | Maternal employment: 60.7% employed Maternal education, Mean (SD): 14.6 years (2.2) | |
| Not reported | ||
| Not reported | ||
| Maternal education: Mean (SD): 14.0 years (3.1) | Maternal education: Mean (SD): 13.9 years (2.7) | |
| Not reported | ||
| Maternal education: Median (IQR): 13 years (12‐16) | Maternal education: Median (IQR): 13 years (12‐16) | |
| Not reported | ||
| Maternal education: 63.8% attended ≥ 12 years of school | Maternal education: 69.9% attended ≥ 12 years of school | |
| Maternal education: < 10 years: 2.9% 10‐12 years: 21.4% > 12 years: 75.7% | Maternal education: < 10 years: 1.8% 10‐12 years: 31.1% > 12 years: 67.1% | |
| Not reported | ||
| Not reported | ||
| Not reported | ||
| Not reported | ||
| Not reported | ||
| Maternal education: Mean (SD): 12.8 years (2.2) | Maternal education; Mean (SD): 12.2 years (1.5) | |
| Not reported | ||
| Maternal education: < 6 years: 7.5% 6 to 9 years: 12.5% 9 to 12 years: 20% | Maternal education: < 6 years: 7.5 % 6 to 9 years: 15% 9 to 12 years: 10% | |
| Not reported | ||
| Maternal education: Primary school (1‐5 years): 14 (18.7%) Seconday school (6‐8 years): 23 (30.7%) High school (9‐12 years): 33 (44.0%) University (> 12 years): 5 (6.7%) Family income: Adequate: 15 (20%) Relatively adequate: 44 (58.7%) Non adequate: 16 (21.3%) | Maternal education: Primary school (1‐5 years): 15 (20.0%) Seconday school (6‐8 years): 14 (18.7%) High school (9‐12 years): 39 (52.0%) University (> 12 years): 7 (9.3%) Family income; Adequate: 13 (17.3%) Relatively adequate: 50 (66.7%) Non adequate: 12 (16.0%) | |
| Not reported | ||
| Job training of father: None: 29 (45%) for DHA/EPA group; 17 (27%) for DHA/EPA+folate group Apprenticeship: 14 (22%) for DHA/EPA group; 19 (31%) for DHA/EPA+folate group University degree: 15 (23%) for DHA/EPA group; 21 (34%) for DHA/EPA+folate group | Job training of father: None: 33 (47%) for folate group; 27 (40%) for placebo group Apprenticeship: 10 (14%) for folate group; 14 (21%) for placebo group University degree: 24 (34%) for folate group; 20 (29%) for placebo group | |
| Education: Mean (SD): 14.8 years (2.1) | Education: Mean (SD): 14.9 years (3.2) | |
| Not reported | ||
| Mother completed secondary education: 755 (63.1%) Mother completed further education: 816 (68.2%) MSSI score: median 28.5, IQR (25.0 ‐ 31.0) | Mother completed secondary education: 760 (63.2%) Mother completed further education: 824 (68.6%) MSSI score: median 29.0, IQR (25.0 ‐ 31.0) | |
| Not reported | ||
| Education: > 8 years: 82.1% ESOMAR classification: AB (high level): 0.5% CA (medium level): 4.4% CB (medium level): 34.9% D (medium ‐ low level): 40.4% E (low level): 19.8% | Education: > 8 years: 80.7% ESOMAR classification: AB (high level): 0.3% CA (medium level): 4.2% CB (medium level): 33.4% D (medium ‐ low level): 44.6% E (low level): 17.5% | |
| Not reported | ||
| Not reported | ||
| Not reported | ||
| Not reported | ||
| Not reported | ||
| Not reported | ||
| Not reported | ||
| Not reported | ||
| Not reported | ||
| Working full time: 6 (35%) for advice to eat fish group; 9 (50%) for advice to eat fish + gift card group | Working full time: 7 (35%) for control group | |
| Not reported | ||
| Not reported | ||
| see Olsen 2000 | ||
| Not reported | ||
| Not reported | ||
| High school or university degree: 129 (100%) Average socioeconomic status (not defined): 129 (100%) | High school or university degree: 126 (100%) Average socioeconomic status (not defined): 126 (100%) | |
| High school education or above: 56.6% | High school education or above: 59.5% | |
| Not reported | ||
| Not reported | ||
| Maternal education: Mean (SD): 14.5 years (3.5) | Maternal education: Mean (SD): 15.3 (2.9) | |
| Not reported | ||
| Not reported | ||
| Not reported | ||
| Not reported | ||
| "Most subjects received government assistance for medical care" | ||
| Not reported | ||
| Not reported | ||
| Not reported | ||
| Mostly low‐income participants Mothers with > 5 years of schooling: 36.8% Working mothers: 16.0 Fathers with stable job: 65.6 Family income (taka/month, 1 USD = 59 taka): 64.0 | Mostly low‐income participants Mothers with > 5 years of schooling: 32.3% Working mothers: 12.1% Fathers with stable job: 65.3% Family income (taka/month, 1 USD = 59 taka): 54.0 | |
| SES assessed using the ESOMAR criteria: High: 5.3% Medium: 73.7% Low: 21.1% | SES assessed using the ESOMAR criteria: High: 19.0% Medium: 66.7% Low: 14.3% | |
| Not reported | ||
| Not reported | ||
| Family income, not further defined: US $263.2 (181.9‐383.0) Maternal education: | Family income (US $) not further defined: US $304.1 (180.7 ‐ 379.8) Maternal education: Median (IQR): 8.0 years (7.5 ‐ 10.5) | |
| Abbreviations: DHA: docosahexaenoic acid; EPA: eicosapentaenoic acid; ESOMAR: European Society for Opinion and Marketing Research; IQR: interquartile range; MSSI: maternal social support index; SD: standard deviation; SES: socioeconomic status | ||
| Study ID | Omega‐3 | No omega‐3 |
| Not reported (study conducted in Egypt) | ||
| "Caucasian women" | ||
| Caucasian: 333 (96.2%) | Caucasian: 332 (95.1%) | |
| Not reported (conducted in Denmark) | ||
| Women of European descent | ||
| Not reported (study conducted in the Netherlands) | ||
| Hispanic: 8% Not Hispanic: 92% | Hispanic: 8% Not Hispanic 92% | |
| African‐American: 38% | ||
| Maternal ethnicity not reported; reported that 98% of included infants were white | Maternal ethnicity not reported; reported that 93% of included infants were white | |
| Not reported (conducted in Angola) | ||
| "White women" | ||
| Caucasian women | ||
| Not reported (conducted in South Africa) | ||
| Not reported (conducted in USA) | ||
| Not reported (conducted in Sweden) | ||
| Not reported (conducted in Italy) | ||
| 28% African‐American (conducted in USA) | ||
| African American: 11 (44%) Caucasian: 10 (40%) Other (e.g. Hispanic or Asian): 4 (16%) | African American: 6 (25%) Caucasian: 11 (46%) Other (e.g. Hispanic or Asian): 7 (29%) | |
| African American: 148 (34.1%) White: 245 (56.5%) Asian: 13 (3.0%) Other: 28 (6.5%) Hispanic/Latina ethnicity: 64 (14.7%) | African American: 145 (34.9%) White: 240 (57.7%) Asian: 5 (1.2%) Other: 26 (6.3%) Hispanic/Latina ethnicity: 57 (13.6%) | |
| Not reported (conducted in USA) | ||
| Not reported (conducted in Germany) | ||
| Not reported (conducted in Norway) | ||
| Not reported (conducted in Croatia) | ||
| Not reported (conducted in Spain) | ||
| Not reported (conducted in Egypt) | ||
| Not reported (conducted in Iran) | ||
| Not reported (conducted in Iran) | ||
| Not reported (conducted in USA) | ||
| Not reported (conducted in USA) | ||
| Not reported (conducted in Iran) | ||
| African American women | ||
| Not reported (conducted in Iran) | ||
| Not reported (conducted in Denmark) | ||
| Not reported (conducted in Spain, Germany or Hungary) | ||
| African American: 12 (37.5%) White: 20 (62.5%) | African American: 15 (53.6%) White: 13 (46.4%) | |
| Not reported (conducted in Finland) | ||
| Not reported (conducted in Australia) | ||
| Not reported (conducted in UK) | ||
| "mainly ethnically mixed (American and Hispanic)" | ||
| Not reported (conducted in Spain) | ||
| African American: 1 (1.7%) Caucasian: 55 (92%) Hispanic: 2 (3%) Asian: 1 (1.67%) Other: 1 (1.67%) | African American: 0 (0%) Caucasian: 52 (95%) Hispanic: 2 (3%) Asian: 1 (2%) Other: 0 (0%) | |
| Asian: 16 (35.6%) African/Afro‐Caribbean: 10 (22.2%) Caucasian: 13 (28.9%) Others: 6 (13.3%) | Asian: 18 (45.0%) African/Afro‐Caribbean: 14 (35.0%) Caucasian: 6 (15.0%) Others: 2 (5.0%) | |
| Asian: 18 (43.9%) African/Afro‐Caribbean: 15 (36.6%) Caucasian: 5 (12.2%) Others: 3 (7.3%) | Asian: 27 (57.5%) African/Afro‐Caribbean: 10 (21.3%) Caucasian: 5 (10.6%) Others: 5 (10.6%) | |
| Asian: 40 (60%) African/Afro‐Caribbean: 18 (27%) Caucasian: 5 (7%) Others: 4 (7%) | Asian: 44 (62%) African/Afro‐Caribbean: 18 (25%) Caucasian: 5 (7%) Others: 4 (6%) | |
| White: 33 (85%) for EPA‐rich group; 29 (76%) for DHA‐rich group African‐American: 4 (10%) for EPA‐rich group; 4 (11%) for DHA‐rich group Hispanic‐Latina: 0 (0%) for EPA‐rich group; 4 (11%) for DHA‐rich group Asian: 1 (3%) for EPA‐rich group; 1 (3%) for DHA‐rich group American Indian or Alaska Native: 0 (0%) for EPA‐rich group; 0 (0) for DHA‐rich group Native Hawaiian or other Pacific ethnicity: 1 (3) for EPA‐rich group; 0 (0%) for DHA‐rich group | White: 34 (83%) African‐American: 2 (5%) Hispanic‐Latina: 3 (7%) Asian: 1 (2%) American Indian or Alaska Native: 1 (2%) Native Hawaiian or other Pacific ethnicity: 0 (0%) | |
| White: 73.1% Non‐white: 26.9% | White: 73.9% Non‐white: 26.1% | |
| Not reported (conducted in UK) | ||
| Not reported (conducted in UK) | ||
| White: 9 (50%) advice only group; 9 (53%) advice+voucher group Black: 2 (11%) advice only group; 2 (12%) advice+voucher group Asian: 2 (11%) advice only group; 1 (6%) advice+voucher group Hispanic/other: 5 (28%) advice only group; 5 (29%) advice+voucher group | White: 9 (45%) Black: 2 (10%) Asian: 3 (15%) Hispanic/other: 6 (30%) | |
| Not reported (conducted in Denmark) | ||
| Not reported (conducted in Denmark, Scotland, Sweden, England, Italy, Netherlands, Norway, Belgium and Russia) | ||
| See Olsen 2000 | ||
| Not reported (conducted in UK) | ||
| Not reported (conducted in the Netherlands) | ||
| Caucasians | ||
| Not reported (conducted in Mexico) | ||
| Not reported (conducted in Iran) | ||
| Not reported (conducted in Iran) | ||
| Not reported (conducted in Australia) | ||
| Not reported (conducted in Brazil) | ||
| Not reported (conducted in Venezuela) | ||
| Not reported (conducted in Iran) | ||
| Not reported (conducted in Spain) | ||
| African:104 (73%) Other: 38 (27%) | African: 109 (73%) Other: 40 (27%) | |
| African: 15 (83%) Other: 3 (17%) | African: 15 (78%) Other: 4 (22%) | |
| Not reported (conducted in Taiwan) | ||
| Not reported (conducted in Iran) | ||
| Not reported (conducted in India) | ||
| Hispanic: 19 (100%) | Hispanic: 21 (100%) | |
| Not reported (conducted in the Netherlands) | ||
| Neither ethnicity, race or country where study conducted reported | ||
| White: 13 (40.6%) Non‐white: 19 (59.4%) | White: 5 (17.9%) Non‐white: 23 (82.1%) | |
| Study ID | Omega‐3 | No omega‐3 | |
| Smokers were excluded | |||
| Smokers were excluded | |||
| Smoking during pregnancy: 21 (6.1%) | Smoking during pregnancy: 33 (9.5%) | ||
| "The three study groups were similar in baseline characteristics with regard to... percentage of smokers (data not shown)". | |||
| Not reported | |||
| Not reported | |||
| History of smoking: 41% Smoking during pregnancy: 30% | History of smoking: 45% Smoking during pregnancy: 38% | ||
| Not reported | |||
| Not reported | |||
| Smoking at 14 weeks GA: Yes: 4 (14%) | Smoking at 14 weeks GA: Yes: 10 (34%) | ||
| 15 (28%) | 24 (35%) | ||
| Smokers were excluded | |||
| Not reported | |||
| Not reported | |||
| Exposure to smoke: (at least 1 of immediate family a smoker) 9 (17%) | Exposure to smoke: (at least 1 of immediate family a smoker) 11 (17%) | ||
| Maternal smoking at baseline: 50% | Maternal smoking at baseline: 48% | ||
| Not reported | |||
| Not reported | |||
| Smoking during pregnancy: 64 (15%) | Smoking during pregnancy: 72 (17%) | ||
| Not reported | |||
| Smoking before pregnancy: 16% | Smoking before pregnancy: 24% | ||
| Smoking: 16% | Smoking: 22% | ||
| Not reported | |||
| Not reported | |||
| Not reported | |||
| Smokers were excluded | |||
| Smokers were excluded | |||
| Smokers were excluded | |||
| Not reported | |||
| Smokers were excluded | |||
| Regular smokers were excluded | |||
| Not reported | |||
| Smoked during pregnancy 0.1 g/day EPA + DHA group: 79 (20.3%) 0.3 g/day EPA + DHA group: 78 (20.3%) 0.7 g/day EPA + DHA group: 78 (20.3%) 1.4 g/day EPA + DHA group: 79 (20.6%) 2.8 g/day EPA + DHA group: 78 (19.9%) 2.2g/day ALA group: 79 (20.3%) | Smoked during pregnancy 160 (20.7%) | ||
| Smoking at study entry Yes: 8 (12%) for DHA/EPA group; 9 (14%) for DHA/EPA + Folate group | Smoking at study entry Yes: 5 (7%) for Folate group; 9 (13%) for placebo group | ||
| "Current or previous use of tobacco" an exclusion criteria | |||
| Not reported | |||
| Smoking at trial entry or leading up to pregnancy 358 (29.9%) | Smoking at trial entry or leading up to pregnancy 407 (33.9%) | ||
| Not reported | |||
| Not reported | |||
| Not reported | |||
| Not reported | |||
| Smoker 6 (13%) | Smoker 0 (0%) | ||
| Smoker 2 (4%) | Smoker 0 (0%) | ||
| Smoker 2 (3%) | Smoker 0 (0%) | ||
| Not reported | |||
| Not reported | |||
| Not reported | |||
| Not reported | |||
| Never smoker 14 (78%) in advice group; 12 (71%) in advice+gift card group | Never smoker 14 (70%) in control group | ||
| Smokers Fish oil group: 33% | Smokers Olive oil group: 29% No oil group: 33% | ||
| Smoker Prophylactic trials Earl‐PD trial 45% Earl‐IUGR trial 52% Earl‐PIH trial 19% Twins trial 33% Therapeutic trials Threat‐PE trial 18% Susp‐IUGR trial 31% | Smoker Prophylactic trials Earl‐PD trial 41% Earl‐IUGR 52% Earl‐PIH trial 24% Twins trial 29% Therapeutic trials Threat‐PE trial 21% Susp‐IUGR trial 30% | ||
| Current smoker 42 (37%) | Current smoker 32 (27%) | ||
| Not reported | |||
| Smokers were excluded | |||
| Not reported | |||
| Not reported | |||
| Smokers were excluded | |||
| Smoker 0 (0%) | Smoker 3 (23%) | ||
| Not reported | |||
| Not reported | |||
| Smokers were excluded | |||
| Smoker 1 (13%) | Smoker 2 (25%) | ||
| Smoker before pregnancy: 46.8% Smoker during pregnancy: 27.0% | Smoker before pregnancy: 38.2% Smoker during pregnancy: 21.5% | ||
| Not reported | |||
| Not reported | |||
| Smokers were excluded | |||
| Not reported | |||
| Not reported | |||
| Not reported | |||
| Not reported | |||
| Not reported | |||
| Study ID | All women included in the study |
| Increased/high‐risk (pregnancy complicated with asymmetrical IUGR) | |
| Low‐risk (healthy women) | |
| Any/mixed risk (not reported) | |
| Low‐risk (healthy women) | |
| Low‐risk (healthy women) | |
| Increased/high‐risk (women with a history of IUGR with or without PIH in the previous pregnancy) | |
| Low‐risk (healthy women) | |
| Increased/high‐risk (Infants at risk of T1D (e.g. mothers with T1D) | |
| Mixed risk (21% of all included women had a history of PIH, and 4% a history of preterm birth) | |
| Low‐risk (healthy women) | |
| Increased/high risk (women with GDM) | |
| Low‐risk (history of physician‐diagnosed allergic rhinitis and/or asthma and 1 or more positive skin prick test to common allergens, but who were otherwise healthy) | |
| Increased/high‐risk (women with severe gestational proteinuric hypertension | |
| Increased/high‐risk (pregnant and postpartum women with a major depressive order) | |
| Low‐risk (pregnant women affected by allergy themselves, of having a husband or previous child with allergies, otherwise healthy) | |
| Increased/high‐risk (pregnancy women with a history of IUGR, fetal demise or pre‐eclampsia) | |
| Low‐risk (healthy women) | |
| Increased/high‐risk: (overweight or obese (BMI ≥ 25) | |
| Increased/high‐risk (women with at least 1 prior spontaneous preterm birth) | |
| Low‐risk (healthy women) | |
| Low‐risk (healthy women) | |
| Low‐risk (healthy women) | |
| Increased/high‐risk (pregnant women with T1D) | |
| Low‐risk (healthy women) | |
| Increased/high‐risk (oligohydramnios at 30‐34 weeks GA) | |
| Increased/high‐risk (women with GDM) | |
| Increased/high‐risk (women with GDM) | |
| Low‐risk (healthy women) | |
| Low‐risk (healthy women) | |
| Increased/high‐risk (women diagnosed with mild depression) | |
| Increased/high‐risk (women living in urban low‐income environments) | |
| Low‐risk (healthy women) | |
| Any/mixed risk (not reported) | |
| Low‐risk (healthy women) | |
| Increased/high‐risk (all women overweight or obese) | |
| Increased/high‐risk (women with pre‐eclampsia) | |
| Any/mixed risk | |
| Low‐risk (healthy women) for final outcomes (any/mixed risk for preterm birth outcome) | |
| Increased/high‐risk (all included women underweight (BMI ≤ 21.2kg/m 2 at 10 weeks GA)) | |
| Any/mixed risk (not reported) | |
| Any/mixed risk | |
| Low‐risk (healthy women) | |
| Increased/high‐risk (women diagnosed with Type 2 diabetes) | |
| Increased/high‐risk (women with GDM) | |
| Increased/high‐risk (women with a history of depression) | |
| Low‐risk (healthy women) | |
| Low‐risk (women with a history of allergy, atopy or asthma) | |
| Increased/high‐risk: (women at risk of developing pre‐eclampsia, fetal growth restriction, gestational diabetes) | |
| Any/mixed risk | |
| Low‐risk (healthy women) | |
| Increased/high‐risk (previous preterm birth or IUGR in previous pregnancy or pregnancy‐induced hypertension or twins in current pregnancy; threatening pre‐eclampsia or ultrasonically estimated fetal weight below the 10th centile) | |
| See Olsen 2000 | |
| Increased/high‐risk (primigravida with abnormal Doppler blood flow, previous birthweight < 3rd centile, PIH, previous unexplained stillbirth) | |
| Low‐risk (healthy women) | |
| Low‐risk (healthy women) | |
| Low‐risk (healthy women) | |
| Increased/high‐risk (women at high risk for pre‐eclampsia) | |
| Increased/high‐risk (women diagnosed with GDM) | |
| Increased/high‐risk (current episode of major depression or dysthymia) | |
| Any/mixed (not reported) | |
| Increased/high‐risk (women at risk of pre‐eclampsia) | |
| Increased/high‐risk (women with GDM) | |
| Low‐risk (healthy women) | |
| Low‐risk (healthy women) | |
| Low‐risk (healthy women) | |
| Increased/high‐risk (women diagnosed with major depressive disorder between 16 weeks and 32 weeks GA) | |
| Increased/high‐risk (women with GDM) | |
| Increased/high‐risk (low income; 28% women undernourished) | |
| Low‐risk ("women free from any known diseases that could affect fetal growth") | |
| Low‐risk (healthy women) | |
| Increased/high‐risk (women with GDM) | |
| Increased/high‐risk (pregnant women classified at risk for postpartum depression) | |
| Abbreviations: ADA: American Diabetes Association; BMI: body mass index; GA: gestational age; GDM: gestational diabetes mellitus; IUGR: intrauterine growth restriction; OGTT: oral glucose tolerance test; PIH: pregnancy‐induced hypertension; PPD: postpartum depression | |
| Outcome or subgroup title | No. of studies | No. of participants | Statistical method | Effect size |
| 1 Preterm birth (< 37 weeks) Show forest plot | 26 | 10304 | Risk Ratio (M‐H, Fixed, 95% CI) | 0.89 [0.81, 0.97] |
| 2 Early preterm birth (< 34 weeks) Show forest plot | 9 | 5204 | Risk Ratio (M‐H, Fixed, 95% CI) | 0.58 [0.44, 0.77] |
| 3 Prolonged gestation (> 42 weeks) Show forest plot | 6 | 5141 | Risk Ratio (M‐H, Fixed, 95% CI) | 1.61 [1.11, 2.33] |
| 4 Maternal death Show forest plot | 4 | 4830 | Risk Ratio (M‐H, Fixed, 95% CI) | 1.69 [0.07, 39.30] |
| 5 Pre‐eclampsia (hypertension with proteinuria) Show forest plot | 20 | 8306 | Risk Ratio (M‐H, Fixed, 95% CI) | 0.84 [0.69, 1.01] |
| 6 High blood pressure (without proteinuria) Show forest plot | 7 | 4531 | Risk Ratio (M‐H, Fixed, 95% CI) | 1.03 [0.89, 1.20] |
| 7 Eclampsia Show forest plot | 1 | 100 | Risk Ratio (M‐H, Fixed, 95% CI) | 0.14 [0.01, 2.70] |
| 8 Maternal antepartum hospitalisation Show forest plot | 5 | 2876 | Risk Ratio (M‐H, Fixed, 95% CI) | 0.92 [0.81, 1.04] |
| 8.1 Any | 4 | 2813 | Risk Ratio (M‐H, Fixed, 95% CI) | 0.91 [0.80, 1.03] |
| 8.2 Due to PIH or IUGR | 1 | 63 | Risk Ratio (M‐H, Fixed, 95% CI) | 1.23 [0.67, 2.28] |
| 9 Mother's length of stay in hospital (days) Show forest plot | 2 | 2290 | Mean Difference (IV, Fixed, 95% CI) | 0.18 [‐0.20, 0.57] |
| 10 Maternal anaemia Show forest plot | 1 | 846 | Risk Ratio (M‐H, Fixed, 95% CI) | 1.16 [0.91, 1.48] |
| 11 Miscarriage (< 24 weeks) Show forest plot | 9 | 4190 | Risk Ratio (M‐H, Fixed, 95% CI) | 1.07 [0.80, 1.43] |
| 12 Antepartum vaginal bleeding Show forest plot | 2 | 2151 | Risk Ratio (M‐H, Fixed, 95% CI) | 1.01 [0.69, 1.48] |
| 13 Rupture of membranes (PPROM; PROM) Show forest plot | 4 | Risk Ratio (M‐H, Fixed, 95% CI) | Subtotals only | |
| 13.1 Preterm prelabour rupture of membranes (PPROM) | 3 | 925 | Risk Ratio (M‐H, Fixed, 95% CI) | 0.53 [0.25, 1.10] |
| 13.2 Premature rupture of membranes (PROM) | 3 | 915 | Risk Ratio (M‐H, Fixed, 95% CI) | 0.41 [0.21, 0.82] |
| 14 Maternal admission to intensive care Show forest plot | 2 | 2458 | Risk Ratio (M‐H, Fixed, 95% CI) | 0.56 [0.12, 2.63] |
| 15 Maternal adverse events Show forest plot | 17 | Risk Ratio (M‐H, Fixed, 95% CI) | Subtotals only | |
| 15.1 Severe adverse event | 2 | 2690 | Risk Ratio (M‐H, Fixed, 95% CI) | 1.04 [0.40, 2.72] |
| 15.2 Severe enough for cessation | 6 | 1487 | Risk Ratio (M‐H, Fixed, 95% CI) | 1.01 [0.53, 1.93] |
| 15.3 Any | 5 | 1480 | Risk Ratio (M‐H, Fixed, 95% CI) | 1.38 [1.16, 1.65] |
| 15.4 Nausea | 9 | 2929 | Risk Ratio (M‐H, Fixed, 95% CI) | 1.05 [0.90, 1.22] |
| 15.5 Unpleasant taste | 5 | 2356 | Risk Ratio (M‐H, Fixed, 95% CI) | 4.82 [3.35, 6.92] |
| 15.6 Vomiting | 7 | 3640 | Risk Ratio (M‐H, Fixed, 95% CI) | 1.14 [0.95, 1.37] |
| 15.7 Stomach pain | 4 | 928 | Risk Ratio (M‐H, Fixed, 95% CI) | 1.49 [0.62, 3.59] |
| 15.8 Reflux | 1 | 26 | Risk Ratio (M‐H, Fixed, 95% CI) | 1.0 [0.16, 6.07] |
| 15.9 Belching or burping | 5 | 2262 | Risk Ratio (M‐H, Fixed, 95% CI) | 3.52 [2.86, 4.34] |
| 15.10 Diarrhoea | 6 | 1764 | Risk Ratio (M‐H, Fixed, 95% CI) | 0.80 [0.52, 1.24] |
| 15.11 Constipation | 1 | 1077 | Risk Ratio (M‐H, Fixed, 95% CI) | 0.42 [0.08, 2.15] |
| 15.12 Nasal bleeding | 2 | 1506 | Risk Ratio (M‐H, Fixed, 95% CI) | 0.94 [0.71, 1.24] |
| 15.13 Swelling/other reaction at injection site | 1 | 852 | Risk Ratio (M‐H, Fixed, 95% CI) | 1.10 [0.99, 1.22] |
| 15.14 Insomnia | 1 | 36 | Risk Ratio (M‐H, Fixed, 95% CI) | 1.5 [0.28, 7.93] |
| 15.15 Headache | 1 | 301 | Risk Ratio (M‐H, Fixed, 95% CI) | 1.61 [0.91, 2.86] |
| 15.16 Gynaecological infections | 1 | 291 | Risk Ratio (M‐H, Fixed, 95% CI) | 0.84 [0.45, 1.55] |
| 15.17 Labour related | 1 | 291 | Risk Ratio (M‐H, Fixed, 95% CI) | 0.49 [0.27, 0.88] |
| 15.18 Urinary tract infection | 1 | 291 | Risk Ratio (M‐H, Fixed, 95% CI) | 0.30 [0.06, 1.42] |
| 16 Caesarean section Show forest plot | 28 | 8481 | Risk Ratio (M‐H, Fixed, 95% CI) | 0.97 [0.91, 1.03] |
| 17 Induction (post‐term) Show forest plot | 3 | 2900 | Risk Ratio (M‐H, Random, 95% CI) | 0.82 [0.22, 2.98] |
| 18 Blood loss at birth (mL) Show forest plot | 6 | 2776 | Mean Difference (IV, Fixed, 95% CI) | 11.50 [‐6.75, 29.76] |
| 19 Postpartum haemorrhage Show forest plot | 4 | 4085 | Risk Ratio (M‐H, Fixed, 95% CI) | 1.03 [0.82, 1.30] |
| 20 Gestational diabetes Show forest plot | 12 | 5235 | Risk Ratio (M‐H, Fixed, 95% CI) | 1.02 [0.83, 1.26] |
| 21 Maternal insulin resistance (HOMA‐IR) Show forest plot | 3 | 176 | Mean Difference (IV, Random, 95% CI) | ‐0.85 [‐2.50, 0.80] |
| 22 Excessive gestational weight gain Show forest plot | 1 | 350 | Risk Ratio (M‐H, Fixed, 95% CI) | 1.21 [0.95, 1.55] |
| 23 Gestational weight gain (kg) Show forest plot | 11 | 2297 | Mean Difference (IV, Random, 95% CI) | ‐0.05 [‐0.68, 0.59] |
| 24 Depression during pregnancy: thresholds Show forest plot | 3 | Risk Ratio (M‐H, Fixed, 95% CI) | Subtotals only | |
| 24.1 HAMD 50% reduction (after 8 weeks) | 1 | 24 | Risk Ratio (M‐H, Fixed, 95% CI) | 2.26 [0.78, 6.49] |
| 24.2 HAMD ≤ 7 | 1 | 24 | Risk Ratio (M‐H, Fixed, 95% CI) | 2.12 [0.51, 8.84] |
| 24.3 Unspecified | 1 | 301 | Risk Ratio (M‐H, Fixed, 95% CI) | 2.39 [0.47, 12.11] |
| 24.4 EPDS ≥ 11 | 1 | 34 | Risk Ratio (M‐H, Fixed, 95% CI) | 1.4 [0.55, 3.55] |
| 25 Depression during pregnancy: scores Show forest plot | 5 | Mean Difference (IV, Random, 95% CI) | Subtotals only | |
| 25.1 BDI | 2 | 104 | Mean Difference (IV, Random, 95% CI) | ‐5.86 [‐8.32, ‐3.39] |
| 25.2 HAMD | 3 | 71 | Mean Difference (IV, Random, 95% CI) | ‐0.92 [‐5.91, 4.06] |
| 25.3 EPDS | 4 | 122 | Mean Difference (IV, Random, 95% CI) | ‐0.40 [‐3.70, 2.89] |
| 25.4 MADRS | 1 | 26 | Mean Difference (IV, Random, 95% CI) | ‐1.60 [‐7.80, 4.60] |
| 26 Anxiety during pregnancy Show forest plot | 1 | 301 | Risk Ratio (M‐H, Fixed, 95% CI) | 0.95 [0.06, 15.12] |
| 27 Difficult life circumstances (maternal) Show forest plot | 1 | 51 | Mean Difference (IV, Fixed, 95% CI) | 0.32 [‐0.15, 0.79] |
| 28 Stress (maternal) Show forest plot | 1 | Mean Difference (IV, Fixed, 95% CI) | Subtotals only | |
| 28.1 Perceived Stress Scale (scores) | 1 | 51 | Mean Difference (IV, Fixed, 95% CI) | ‐1.82 [‐3.68, 0.04] |
| 29 Depressive symptoms postpartum: threshold Show forest plot | 4 | Risk Ratio (M‐H, Random, 95% CI) | Subtotals only | |
| 29.1 PDSS ≥ 80 | 1 | 42 | Risk Ratio (M‐H, Random, 95% CI) | 0.37 [0.04, 3.25] |
| 29.2 EPDS | 2 | 2431 | Risk Ratio (M‐H, Random, 95% CI) | 0.99 [0.56, 1.77] |
| 29.3 Major depressive disorder | 1 | 118 | Risk Ratio (M‐H, Random, 95% CI) | 1.33 [0.27, 6.56] |
| 30 Depressive symptoms postpartum: scores Show forest plot | 2 | Mean Difference (IV, Fixed, 95% CI) | Subtotals only | |
| 30.1 BDI: 6‐8 weeks postpartum | 1 | 118 | Mean Difference (IV, Fixed, 95% CI) | 0.25 [‐1.93, 2.43] |
| 30.2 PDSS total (LS over 6 months) | 1 | 42 | Mean Difference (IV, Fixed, 95% CI) | ‐6.08 [‐12.42, 0.26] |
| 30.3 Disturbances sleep/eating (LS over 6 months) | 1 | 42 | Mean Difference (IV, Fixed, 95% CI) | ‐1.0 [‐2.66, 0.66] |
| 30.4 Anxiety/insecurity (LS over 6 months) | 1 | 42 | Mean Difference (IV, Fixed, 95% CI) | ‐1.30 [‐2.96, 0.36] |
| 30.5 Emotional lability (LS over 6 months) | 1 | 42 | Mean Difference (IV, Fixed, 95% CI) | ‐1.29 [‐3.10, 0.52] |
| 30.6 Mental confusion (LS over 6 months) | 1 | 42 | Mean Difference (IV, Fixed, 95% CI) | ‐1.30 [‐2.92, 0.32] |
| 30.7 Loss of self (LS over 6 months) | 1 | 42 | Mean Difference (IV, Fixed, 95% CI) | ‐0.90 [‐1.80, 0.00] |
| 30.8 Guilt (LS over 6 months) | 1 | 42 | Mean Difference (IV, Fixed, 95% CI) | ‐0.30 [‐1.13, 0.53] |
| 30.9 Suicide (LS over 6 months) | 1 | 42 | Mean Difference (IV, Fixed, 95% CI) | ‐0.07 [‐0.35, 0.21] |
| 30.10 PDSS total at 6 months | 1 | 42 | Mean Difference (IV, Fixed, 95% CI) | ‐2.87 [‐12.17, 6.43] |
| 30.11 Disturbances sleep/eating at 6 months | 1 | 42 | Mean Difference (IV, Fixed, 95% CI) | ‐0.20 [‐2.08, 1.68] |
| 30.12 Anxiety/insecurity at 6 months | 1 | 42 | Mean Difference (IV, Fixed, 95% CI) | ‐0.46 [‐2.65, 1.73] |
| 30.13 Emotional lability at 6 months | 1 | 42 | Mean Difference (IV, Fixed, 95% CI) | ‐0.96 [‐3.32, 1.40] |
| 30.14 Mental confusion at 6 months | 1 | 42 | Mean Difference (IV, Fixed, 95% CI) | ‐0.13 [‐2.15, 1.89] |
| 30.15 Loss of self at 6 months | 1 | 42 | Mean Difference (IV, Fixed, 95% CI) | ‐0.97 [‐2.18, 0.24] |
| 30.16 Guilt at 6 months | 1 | 42 | Mean Difference (IV, Fixed, 95% CI) | 0.21 [‐0.69, 1.11] |
| 30.17 Suicide at 6 months | 1 | 42 | Mean Difference (IV, Fixed, 95% CI) | ‐0.52 [‐1.13, 0.09] |
| 31 Gestational length (days) Show forest plot | 43 | 12517 | Mean Difference (IV, Random, 95% CI) | 1.67 [0.95, 2.39] |
| 32 Perinatal death Show forest plot | 10 | 7416 | Risk Ratio (M‐H, Fixed, 95% CI) | 0.75 [0.54, 1.03] |
| 33 Stillbirth Show forest plot | 16 | 7880 | Risk Ratio (M‐H, Fixed, 95% CI) | 0.94 [0.62, 1.42] |
| 34 Neonatal death Show forest plot | 9 | 7448 | Risk Ratio (M‐H, Fixed, 95% CI) | 0.61 [0.34, 1.11] |
| 35 Infant death Show forest plot | 4 | 3239 | Risk Ratio (M‐H, Fixed, 95% CI) | 0.74 [0.25, 2.19] |
| 36 Large‐for‐gestational age Show forest plot | 6 | 3722 | Risk Ratio (M‐H, Fixed, 95% CI) | 1.15 [0.97, 1.36] |
| 37 Macrosomia Show forest plot | 6 | 2008 | Risk Ratio (M‐H, Fixed, 95% CI) | 0.69 [0.43, 1.13] |
| 38 Low birthweight (< 2500 g) Show forest plot | 15 | 8449 | Risk Ratio (M‐H, Fixed, 95% CI) | 0.90 [0.82, 0.99] |
| 39 Small‐for‐gestational age/IUGR Show forest plot | 8 | 6907 | Risk Ratio (M‐H, Fixed, 95% CI) | 1.01 [0.90, 1.13] |
| 40 Birthweight (g) Show forest plot | 44 | 11584 | Mean Difference (IV, Random, 95% CI) | 75.74 [38.05, 113.43] |
| 41 Birthweight Z score Show forest plot | 4 | 2792 | Mean Difference (IV, Fixed, 95% CI) | 0.06 [‐0.02, 0.13] |
| 42 Birth length (cm) Show forest plot | 29 | 8128 | Mean Difference (IV, Random, 95% CI) | 0.11 [‐0.10, 0.31] |
| 43 Head circumference at birth (cm) Show forest plot | 24 | 7161 | Mean Difference (IV, Random, 95% CI) | 0.07 [‐0.05, 0.19] |
| 44 Head circumference at birth Z score Show forest plot | 2 | 2462 | Mean Difference (IV, Fixed, 95% CI) | ‐0.03 [‐0.14, 0.07] |
| 45 Length at birth Z score Show forest plot | 2 | 2462 | Mean Difference (IV, Random, 95% CI) | 0.18 [‐0.18, 0.54] |
| 46 Baby admitted to neonatal care Show forest plot | 9 | 6920 | Risk Ratio (M‐H, Fixed, 95% CI) | 0.92 [0.83, 1.03] |
| 47 Infant length of stay in hospital (days) Show forest plot | 1 | 2041 | Mean Difference (IV, Fixed, 95% CI) | 0.11 [‐1.40, 1.62] |
| 48 Congenital anomalies Show forest plot | 3 | 1807 | Risk Ratio (M‐H, Fixed, 95% CI) | 1.08 [0.61, 1.92] |
| 49 Retinopathy of prematurity Show forest plot | 1 | 837 | Risk Ratio (M‐H, Fixed, 95% CI) | 1.20 [0.32, 4.44] |
| 50 Bronchopulmonary dysplasia Show forest plot | 2 | 3191 | Risk Ratio (M‐H, Fixed, 95% CI) | 1.06 [0.45, 2.48] |
| 51 Respiratory distress syndrome Show forest plot | 2 | 1129 | Risk Ratio (M‐H, Random, 95% CI) | 1.17 [0.54, 2.52] |
| 52 Necrotising enterocolitis (NEC) Show forest plot | 2 | 3198 | Risk Ratio (M‐H, Fixed, 95% CI) | 0.97 [0.26, 3.55] |
| 53 Neonatal sepsis (proven) Show forest plot | 3 | 3788 | Risk Ratio (M‐H, Fixed, 95% CI) | 0.97 [0.44, 2.14] |
| 54 Convulsion Show forest plot | 1 | 2361 | Risk Ratio (M‐H, Fixed, 95% CI) | 0.09 [0.01, 1.63] |
| 55 Intraventricular haemorrhage Show forest plot | 3 | Risk Ratio (M‐H, Random, 95% CI) | Subtotals only | |
| 55.1 Any | 3 | 5423 | Risk Ratio (M‐H, Random, 95% CI) | 1.00 [0.29, 3.49] |
| 55.2 Grade 3 or 4 | 1 | 837 | Risk Ratio (M‐H, Random, 95% CI) | 1.60 [0.38, 6.65] |
| 56 Neonatal/infant adverse events Show forest plot | 3 | Risk Ratio (M‐H, Fixed, 95% CI) | Subtotals only | |
| 56.1 Any adverse event | 2 | 592 | Risk Ratio (M‐H, Fixed, 95% CI) | 0.92 [0.82, 1.02] |
| 56.2 Serious adverse events | 2 | 2690 | Risk Ratio (M‐H, Fixed, 95% CI) | 0.72 [0.53, 0.99] |
| 57 Neonatal/infant morbidity: cardiovascular Show forest plot | 1 | Risk Ratio (M‐H, Fixed, 95% CI) | Subtotals only | |
| 58 Neonatal/infant morbidity: respiratory Show forest plot | 1 | 291 | Risk Ratio (M‐H, Fixed, 95% CI) | 1.02 [0.66, 1.57] |
| 59 Neonatal/infant morbidity: due to pregnancy/birth events Show forest plot | 1 | 291 | Risk Ratio (M‐H, Fixed, 95% CI) | 1.02 [0.67, 1.55] |
| 60 Neonatal/infant morbidity: other Show forest plot | 1 | Risk Ratio (M‐H, Fixed, 95% CI) | Subtotals only | |
| 60.1 Colds in past 15 days: at 1 month of age | 1 | 849 | Risk Ratio (M‐H, Fixed, 95% CI) | 0.85 [0.72, 1.00] |
| 60.2 Colds in past 15 days: at 3 months of age | 1 | 834 | Risk Ratio (M‐H, Fixed, 95% CI) | 0.86 [0.73, 1.01] |
| 60.3 Colds in past 15 days: at 6 months of age | 1 | 834 | Risk Ratio (M‐H, Fixed, 95% CI) | 0.99 [0.86, 1.15] |
| 60.4 Fever in past 15 days: at 1 month of age | 1 | 849 | Risk Ratio (M‐H, Fixed, 95% CI) | 1.08 [0.53, 2.22] |
| 60.5 Fever in past 15 days: at 3 months of age | 1 | 834 | Risk Ratio (M‐H, Fixed, 95% CI) | 0.80 [0.53, 1.23] |
| 60.6 Fever in past 15 days: at 6 months of age | 1 | 834 | Risk Ratio (M‐H, Fixed, 95% CI) | 0.99 [0.74, 1.31] |
| 60.7 Rash in past 15 days: at 1 month of age | 1 | 849 | Risk Ratio (M‐H, Fixed, 95% CI) | 1.11 [0.89, 1.38] |
| 60.8 Rash in past 15 days: at 3 months of age | 1 | 834 | Risk Ratio (M‐H, Fixed, 95% CI) | 0.82 [0.54, 1.26] |
| 60.9 Rash in past 15 days: at 6 months of age | 1 | 834 | Risk Ratio (M‐H, Fixed, 95% CI) | 1.14 [0.76, 1.71] |
| 60.10 Vomiting in past 15 days: at 1 month of age | 1 | 849 | Risk Ratio (M‐H, Fixed, 95% CI) | 1.55 [0.82, 2.93] |
| 60.11 Vomiting in past 15 days: at 3 months of age | 1 | 834 | Risk Ratio (M‐H, Fixed, 95% CI) | 1.43 [0.69, 2.96] |
| 60.12 Vomiting in past 15 days: at 6 months of age | 1 | 834 | Risk Ratio (M‐H, Fixed, 95% CI) | 1.33 [0.72, 2.46] |
| 60.13 Diarrhoea in past 15 days: at 1 month of age | 1 | 849 | Risk Ratio (M‐H, Fixed, 95% CI) | 0.83 [0.42, 1.67] |
| 60.14 Diarrhoea in past 15 days: at 3 months of age | 1 | 834 | Risk Ratio (M‐H, Fixed, 95% CI) | 0.83 [0.46, 1.51] |
| 60.15 Diarrhoea in past 15 days: at 6 months of age | 1 | 834 | Risk Ratio (M‐H, Fixed, 95% CI) | 1.02 [0.63, 1.64] |
| 60.16 Other illness in the past 15 days: at 1 month | 1 | 849 | Risk Ratio (M‐H, Fixed, 95% CI) | 1.40 [0.81, 2.41] |
| 60.17 Other illness in the past 15 days: at 3 months | 1 | 834 | Risk Ratio (M‐H, Fixed, 95% CI) | 0.96 [0.54, 1.73] |
| 60.18 Other illness in the past 15 days: at 6 months | 1 | 834 | Risk Ratio (M‐H, Fixed, 95% CI) | 1.15 [0.68, 1.95] |
| 61 Infant/child morbidity Show forest plot | 1 | Risk Ratio (M‐H, Fixed, 95% CI) | Subtotals only | |
| 61.1 ICU admissions | 1 | 1396 | Risk Ratio (M‐H, Fixed, 95% CI) | 0.58 [0.31, 1.06] |
| 61.2 Medical diagnosis of attention deficit hyperactivity disorder (ADHD) | 1 | 1526 | Risk Ratio (M‐H, Fixed, 95% CI) | 2.96 [0.31, 28.40] |
| 61.3 Medical diagnosis of autism spectrum disorder | 1 | 1526 | Risk Ratio (M‐H, Fixed, 95% CI) | 1.15 [0.54, 2.47] |
| 61.4 Medical diagnosis of other learning/behavioural disorders | 1 | 1526 | Risk Ratio (M‐H, Fixed, 95% CI) | 1.12 [0.78, 1.60] |
| 61.5 Medical diagnosis of other chronic health conditions | 1 | 1526 | Risk Ratio (M‐H, Fixed, 95% CI) | 0.97 [0.65, 1.44] |
| 62 Ponderal index Show forest plot | 6 | 887 | Mean Difference (IV, Random, 95% CI) | 0.05 [‐0.01, 0.11] |
| 63 Infant/child weight (kg) Show forest plot | 11 | Mean Difference (IV, Random, 95% CI) | Subtotals only | |
| 63.1 At < 3 months | 2 | 863 | Mean Difference (IV, Random, 95% CI) | 0.01 [‐0.07, 0.09] |
| 63.2 At 3 to < 12 months | 4 | 1028 | Mean Difference (IV, Random, 95% CI) | 0.01 [‐0.18, 0.20] |
| 63.3 At 1 to < 2 years | 4 | 1084 | Mean Difference (IV, Random, 95% CI) | 0.01 [‐0.19, 0.21] |
| 63.4 At 2 to < 3 years | 2 | 182 | Mean Difference (IV, Random, 95% CI) | 0.24 [‐0.20, 0.68] |
| 63.5 At 3 to < 4 years | 2 | 1651 | Mean Difference (IV, Random, 95% CI) | 0.18 [‐0.20, 0.57] |
| 63.6 At 4 to < 5 years | 2 | 631 | Mean Difference (IV, Random, 95% CI) | 0.38 [‐0.29, 1.05] |
| 63.7 At 5 to < 6 years | 4 | 2618 | Mean Difference (IV, Random, 95% CI) | 0.23 [‐0.18, 0.63] |
| 63.8 At ≥ 6 years | 3 | 508 | Mean Difference (IV, Random, 95% CI) | ‐0.08 [‐0.79, 0.64] |
| 64 Infant/child length/height (cm) Show forest plot | 11 | Mean Difference (IV, Random, 95% CI) | Subtotals only | |
| 64.1 < 3 months | 2 | 861 | Mean Difference (IV, Random, 95% CI) | ‐0.01 [‐0.69, 0.66] |
| 64.2 3 to < 12 months | 4 | 1115 | Mean Difference (IV, Random, 95% CI) | 0.11 [‐0.20, 0.42] |
| 64.3 1 to < 2 years | 4 | 998 | Mean Difference (IV, Random, 95% CI) | 0.01 [‐0.45, 0.48] |
| 64.4 2 to < 3 years | 2 | 182 | Mean Difference (IV, Random, 95% CI) | 0.18 [‐0.73, 1.08] |
| 64.5 3 to < 4 years | 2 | 1651 | Mean Difference (IV, Random, 95% CI) | 0.18 [‐0.21, 0.58] |
| 64.6 4 to < 5 years | 2 | 631 | Mean Difference (IV, Random, 95% CI) | 0.30 [‐0.36, 0.95] |
| 64.7 5 to < 6 years | 5 | 2733 | Mean Difference (IV, Random, 95% CI) | 0.20 [‐0.17, 0.57] |
| 64.8 At ≥ 6 years | 2 | 393 | Mean Difference (IV, Random, 95% CI) | ‐1.22 [‐2.29, ‐0.16] |
| 65 Infant/child head circumference (cm) Show forest plot | 10 | Mean Difference (IV, Random, 95% CI) | Subtotals only | |
| 65.1 At < 3 months | 2 | 863 | Mean Difference (IV, Random, 95% CI) | ‐0.04 [‐0.22, 0.14] |
| 65.2 At 3 to < 12 months | 5 | 1309 | Mean Difference (IV, Random, 95% CI) | ‐0.03 [‐0.19, 0.12] |
| 65.3 At 1 to < 2 years | 4 | 1084 | Mean Difference (IV, Random, 95% CI) | 0.06 [‐0.18, 0.30] |
| 65.4 At 2 to < 3 years | 2 | 182 | Mean Difference (IV, Random, 95% CI) | ‐0.04 [‐0.47, 0.40] |
| 65.5 At 3 to < 4 years | 2 | 1651 | Mean Difference (IV, Random, 95% CI) | ‐0.01 [‐0.16, 0.14] |
| 65.6 At 4 to < 5 years | 1 | 107 | Mean Difference (IV, Random, 95% CI) | 0.0 [‐0.47, 0.47] |
| 65.7 At ≥ 5 years | 3 | 1760 | Mean Difference (IV, Random, 95% CI) | 0.02 [‐0.13, 0.17] |
| 66 Infant/child length/height for age Z score (LAZ/HAZ) Show forest plot | 3 | Mean Difference (IV, Random, 95% CI) | Subtotals only | |
| 66.1 At < 3 months | 2 | 875 | Mean Difference (IV, Random, 95% CI) | ‐0.13 [‐0.27, 0.02] |
| 66.2 At 3 to < 12 months | 3 | 1085 | Mean Difference (IV, Random, 95% CI) | ‐0.05 [‐0.19, 0.09] |
| 66.3 At 12 to < 24 months | 2 | 897 | Mean Difference (IV, Random, 95% CI) | ‐0.06 [‐0.31, 0.18] |
| 66.4 At 4 to < 5 years | 1 | 524 | Mean Difference (IV, Random, 95% CI) | 0.0 [‐0.15, 0.15] |
| 66.5 At ≥ 5 years | 1 | 802 | Mean Difference (IV, Random, 95% CI) | 0.0 [‐0.12, 0.12] |
| 67 Infant/child waist circumference (cm) Show forest plot | 2 | Mean Difference (IV, Fixed, 95% CI) | Subtotals only | |
| 67.1 At 2 to < 3 years | 1 | 101 | Mean Difference (IV, Fixed, 95% CI) | ‐0.20 [‐1.29, 0.89] |
| 67.2 At 3 to < 4 years | 2 | 1651 | Mean Difference (IV, Fixed, 95% CI) | 0.28 [‐0.05, 0.60] |
| 67.3 At 4 to < 5 years | 1 | 106 | Mean Difference (IV, Fixed, 95% CI) | 0.70 [‐0.40, 1.80] |
| 67.4 At ≥ 5 years | 2 | 1645 | Mean Difference (IV, Fixed, 95% CI) | 0.15 [‐0.24, 0.55] |
| 68 Infant/child weight‐for‐age Z score (WAZ) Show forest plot | 2 | Mean Difference (IV, Random, 95% CI) | Subtotals only | |
| 68.1 At < 3 months | 2 | 874 | Mean Difference (IV, Random, 95% CI) | ‐0.09 [‐0.30, 0.12] |
| 68.2 At 3 to < 12 months | 2 | 834 | Mean Difference (IV, Random, 95% CI) | ‐0.05 [‐0.18, 0.08] |
| 68.3 At 12 to < 24 months | 2 | 883 | Mean Difference (IV, Random, 95% CI) | ‐0.01 [‐0.13, 0.12] |
| 68.4 At ≥ 60 months | 1 | 802 | Mean Difference (IV, Random, 95% CI) | ‐0.1 [‐0.25, 0.05] |
| 69 Infant/child BMI Z score Show forest plot | 5 | Mean Difference (IV, Random, 95% CI) | Subtotals only | |
| 69.1 At 1 to < 2 years | 2 | 801 | Mean Difference (IV, Random, 95% CI) | ‐0.05 [‐0.09, 0.00] |
| 69.2 At 2 to < 3 years | 1 | 63 | Mean Difference (IV, Random, 95% CI) | ‐0.07 [‐0.25, 0.11] |
| 69.3 At 3 to < 4 years | 1 | 1531 | Mean Difference (IV, Random, 95% CI) | 0.02 [‐0.08, 0.12] |
| 69.4 At 4 to < 5 years | 2 | 587 | Mean Difference (IV, Random, 95% CI) | 0.15 [‐0.16, 0.47] |
| 69.5 At 5 to < 6 years | 3 | 2504 | Mean Difference (IV, Random, 95% CI) | 0.03 [‐0.05, 0.11] |
| 69.6 At 6 to < 7 years | 1 | 115 | Mean Difference (IV, Random, 95% CI) | 0.01 [‐0.02, 0.05] |
| 69.7 At ≥ 7 years | 1 | 250 | Mean Difference (IV, Random, 95% CI) | 0.18 [‐0.10, 0.46] |
| 70 Infant/child weight for length/height Z score (WHZ) Show forest plot | 3 | Mean Difference (IV, Random, 95% CI) | Subtotals only | |
| 70.1 At < 3 months | 2 | 860 | Mean Difference (IV, Random, 95% CI) | ‐0.03 [‐0.41, 0.34] |
| 70.2 At 3 to < 12 months | 3 | 1083 | Mean Difference (IV, Random, 95% CI) | ‐0.00 [‐0.14, 0.14] |
| 70.3 At 12 to < 24 months | 2 | 883 | Mean Difference (IV, Random, 95% CI) | ‐0.02 [‐0.14, 0.10] |
| 71 Infant/child BMI percentile Show forest plot | 1 | Mean Difference (IV, Fixed, 95% CI) | Subtotals only | |
| 71.1 At 24 months | 1 | 118 | Mean Difference (IV, Fixed, 95% CI) | 4.5 [‐5.50, 14.50] |
| 71.2 At 36 months | 1 | 120 | Mean Difference (IV, Fixed, 95% CI) | 8.0 [‐1.09, 17.09] |
| 71.3 At 48 months | 1 | 107 | Mean Difference (IV, Fixed, 95% CI) | 13.0 [3.19, 22.81] |
| 71.4 At 60 months | 1 | 114 | Mean Difference (IV, Fixed, 95% CI) | 4.80 [‐4.70, 14.30] |
| 72 Child/adult BMI Show forest plot | 3 | Mean Difference (IV, Fixed, 95% CI) | Subtotals only | |
| 72.1 At 3 to 4 years | 1 | 1531 | Mean Difference (IV, Fixed, 95% CI) | 0.01 [‐0.14, 0.16] |
| 72.2 At 5 to 6 years | 1 | 1531 | Mean Difference (IV, Fixed, 95% CI) | ‐0.01 [‐0.18, 0.16] |
| 72.3 At 7 to 9 years | 2 | 393 | Mean Difference (IV, Fixed, 95% CI) | 0.16 [‐0.25, 0.57] |
| 72.4 At 19 years | 1 | 243 | Mean Difference (IV, Fixed, 95% CI) | 0.0 [‐0.83, 0.83] |
| 73 Infant/child body fat (%) Show forest plot | 3 | Mean Difference (IV, Fixed, 95% CI) | Subtotals only | |
| 73.1 At 1 year | 1 | 165 | Mean Difference (IV, Fixed, 95% CI) | 0.0 [‐0.88, 0.88] |
| 73.2 At 2 to < 3 years | 1 | 110 | Mean Difference (IV, Fixed, 95% CI) | 0.20 [‐0.68, 1.08] |
| 73.3 At 3 to < 4 years | 2 | 1644 | Mean Difference (IV, Fixed, 95% CI) | ‐0.18 [‐0.74, 0.38] |
| 73.4 At 4 to < 5 years | 1 | 102 | Mean Difference (IV, Fixed, 95% CI) | 0.30 [‐0.79, 1.39] |
| 73.5 At 5 to < 6 years | 3 | 1797 | Mean Difference (IV, Fixed, 95% CI) | 0.01 [‐0.56, 0.58] |
| 73.6 At ≥ 7 years: BIS | 1 | 250 | Mean Difference (IV, Fixed, 95% CI) | 1.44 [‐0.31, 3.19] |
| 73.7 At ≥ 7 years: BOD POD | 1 | 250 | Mean Difference (IV, Fixed, 95% CI) | ‐0.42 [‐2.23, 1.39] |
| 74 Infant/child total fat mass (kg) Show forest plot | 3 | Mean Difference (IV, Fixed, 95% CI) | Subtotals only | |
| 74.1 At 1 year | 1 | 164 | Mean Difference (IV, Fixed, 95% CI) | 0.0 [‐0.07, 0.07] |
| 74.2 At 2 to < 3 years | 1 | 110 | Mean Difference (IV, Fixed, 95% CI) | 0.10 [‐0.09, 0.29] |
| 74.3 At 3 to < 4 years | 2 | 1644 | Mean Difference (IV, Fixed, 95% CI) | ‐0.01 [‐0.12, 0.10] |
| 74.4 At 4 to < 5 years | 1 | 102 | Mean Difference (IV, Fixed, 95% CI) | 0.20 [‐0.05, 0.45] |
| 74.5 At 5 to < 6 years | 3 | 1797 | Mean Difference (IV, Fixed, 95% CI) | 0.05 [‐0.10, 0.21] |
| 74.6 Up to 8 years: BOD POD | 1 | 250 | Mean Difference (IV, Fixed, 95% CI) | 0.08 [‐0.71, 0.87] |
| 74.7 Up to 8 years: BIS | 1 | 250 | Mean Difference (IV, Fixed, 95% CI) | 0.29 [‐0.47, 1.05] |
| 75 Cognition: thresholds Show forest plot | 3 | Risk Ratio (M‐H, Fixed, 95% CI) | Subtotals only | |
| 75.1 BSID III < 85 at 18 months | 1 | 726 | Risk Ratio (M‐H, Fixed, 95% CI) | 0.49 [0.24, 0.98] |
| 75.2 BSID III > 115 at 18 months | 1 | 726 | Risk Ratio (M‐H, Fixed, 95% CI) | 0.84 [0.49, 1.44] |
| 75.3 BSID II < 85 at 18 months | 1 | 730 | Risk Ratio (M‐H, Fixed, 95% CI) | 1.43 [0.97, 2.12] |
| 75.4 BSID III cognitive score (highest quartile): at 18 months | 1 | 154 | Risk Ratio (M‐H, Fixed, 95% CI) | 0.90 [0.49, 1.65] |
| 76 Cognition: scores Show forest plot | 10 | Mean Difference (IV, Fixed, 95% CI) | Subtotals only | |
| 76.1 BSID II score < 24 months | 4 | 1154 | Mean Difference (IV, Fixed, 95% CI) | ‐0.37 [‐1.49, 0.76] |
| 76.2 BSID III score < 24 months | 2 | 809 | Mean Difference (IV, Fixed, 95% CI) | 0.04 [‐1.59, 1.68] |
| 76.3 Fagan novelty preference < 24 months | 2 | 274 | Mean Difference (IV, Fixed, 95% CI) | ‐0.79 [‐1.68, 0.11] |
| 76.4 K‐ABC mental processing composite at 2 to 5 years | 1 | 84 | Mean Difference (IV, Fixed, 95% CI) | 4.10 [‐0.14, 8.34] |
| 76.5 K‐ABC sequential processing at 5 to 6 years | 1 | 96 | Mean Difference (IV, Fixed, 95% CI) | 0.0 [‐1.80, 1.80] |
| 76.6 GMDS general quotient score at 2 to 5 years | 1 | 72 | Mean Difference (IV, Fixed, 95% CI) | 3.70 [‐1.02, 8.42] |
| 76.7 DAS II: General Conceptual Ability Scale at 2 to 5 years | 1 | 646 | Mean Difference (IV, Fixed, 95% CI) | 0.13 [‐1.53, 1.79] |
| 76.8 DAS II: Non‐verbal Reasoning Scale at 2 to 5 years | 1 | 646 | Mean Difference (IV, Fixed, 95% CI) | ‐0.35 [‐2.04, 1.34] |
| 76.9 DAS II: Verbal Scale at 2 to 5 years | 1 | 646 | Mean Difference (IV, Fixed, 95% CI) | ‐0.35 [‐1.74, 1.04] |
| 76.10 DAS II: Spatial Scale at 2 to 5 years | 1 | 646 | Mean Difference (IV, Fixed, 95% CI) | 0.96 [‐0.77, 2.69] |
| 76.11 MCDS: scale index general cognitive at 5 years | 1 | 797 | Mean Difference (IV, Fixed, 95% CI) | ‐0.5 [‐2.35, 1.35] |
| 76.12 WASI full‐scale IQ at 6 to 9 years | 1 | 543 | Mean Difference (IV, Fixed, 95% CI) | 1.0 [‐0.79, 2.79] |
| 76.13 WISC‐IV full scale IQ at > 12 years | 1 | 50 | Mean Difference (IV, Fixed, 95% CI) | 1.0 [‐5.16, 7.16] |
| 77 Attention: scores Show forest plot | 3 | Mean Difference (IV, Fixed, 95% CI) | Subtotals only | |
| 77.1 K‐CPT omissions at 5 years | 1 | 797 | Mean Difference (IV, Fixed, 95% CI) | ‐1.90 [‐3.39, ‐0.41] |
| 77.2 K‐CPT commissions at 5 years | 1 | 797 | Mean Difference (IV, Fixed, 95% CI) | 0.10 [‐1.37, 1.57] |
| 77.3 K‐CPT hit response time at 5 years | 1 | 797 | Mean Difference (IV, Fixed, 95% CI) | ‐0.60 [‐2.06, 0.86] |
| 77.4 Attention: single‐object task: total time looking at toy(s) at 2 to 5 years | 1 | 150 | Mean Difference (IV, Fixed, 95% CI) | ‐7.80 [‐22.59, 6.99] |
| 77.5 Attention: multiple‐object task; # times shifted looks between toys at 2 to 5 years | 1 | 150 | Mean Difference (IV, Fixed, 95% CI) | ‐0.40 [‐4.28, 3.48] |
| 77.6 Attention: distractibility: av latency to look when attention focused (s) at 2 to 5 years | 1 | 150 | Mean Difference (IV, Fixed, 95% CI) | ‐0.30 [‐0.86, 0.26] |
| 77.7 Attention: global speed (ms) at 8.5 years | 1 | 130 | Mean Difference (IV, Fixed, 95% CI) | ‐5.5 [‐47.16, 36.16] |
| 77.8 Attention: interference (ms) at 8.5 years | 1 | 130 | Mean Difference (IV, Fixed, 95% CI) | 6.97 [‐16.42, 30.36] |
| 77.9 Attention: orienting (ms) at 8.5 years | 1 | 130 | Mean Difference (IV, Fixed, 95% CI) | 3.99 [‐16.90, 24.88] |
| 77.10 Attention: alertness (ms) at 8.5 years | 1 | 130 | Mean Difference (IV, Fixed, 95% CI) | ‐5.69 [‐27.88, 16.50] |
| 78 Motor: thresholds Show forest plot | 2 | Risk Ratio (M‐H, Fixed, 95% CI) | Subtotals only | |
| 78.1 BSID II score < 85 at 18 months | 1 | 730 | Risk Ratio (M‐H, Fixed, 95% CI) | 0.88 [0.65, 1.19] |
| 78.2 Fine motor (highest quartile): at 18 months | 1 | 154 | Risk Ratio (M‐H, Fixed, 95% CI) | 1.19 [0.71, 1.99] |
| 78.3 Gross motor (highest quartile): at 18 months | 1 | 154 | Risk Ratio (M‐H, Fixed, 95% CI) | 1.13 [0.68, 1.88] |
| 79 Motor: scores Show forest plot | 6 | Mean Difference (IV, Fixed, 95% CI) | Subtotals only | |
| 79.1 BSID II at < 24 months | 4 | 1153 | Mean Difference (IV, Fixed, 95% CI) | 0.23 [‐0.90, 1.36] |
| 79.2 BSID III at < 24 months | 1 | 726 | Mean Difference (IV, Fixed, 95% CI) | 0.06 [‐1.52, 1.64] |
| 79.3 BSID III fine motor score at < 24 months | 1 | 49 | Mean Difference (IV, Fixed, 95% CI) | 0.05 [‐1.20, 1.30] |
| 79.4 BSID III gross motor score at < 24 months | 1 | 49 | Mean Difference (IV, Fixed, 95% CI) | 0.05 [‐0.68, 0.78] |
| 80 Language: thresholds Show forest plot | 2 | Risk Ratio (M‐H, Fixed, 95% CI) | Subtotals only | |
| 80.1 BSID III < 85 | 1 | 726 | Risk Ratio (M‐H, Fixed, 95% CI) | 1.02 [0.74, 1.40] |
| 80.2 BSID III > 115 | 1 | 726 | Risk Ratio (M‐H, Fixed, 95% CI) | 0.82 [0.52, 1.29] |
| 80.3 Receptive language (highest quartile) | 1 | 154 | Risk Ratio (M‐H, Fixed, 95% CI) | 1.82 [1.07, 3.10] |
| 80.4 Expressive language (highest quartile) | 1 | 154 | Risk Ratio (M‐H, Fixed, 95% CI) | 1.65 [1.02, 2.68] |
| 80.5 Infant CDI: words understood (highest quartile) | 1 | 159 | Risk Ratio (M‐H, Fixed, 95% CI) | 2.42 [1.33, 4.42] |
| 80.6 Infant CDI: words produced (highest quartile) | 1 | 159 | Risk Ratio (M‐H, Fixed, 95% CI) | 2.08 [1.15, 3.74] |
| 80.7 Infant CDI: words understood (highest quartile) | 1 | 134 | Risk Ratio (M‐H, Fixed, 95% CI) | 1.97 [1.11, 3.48] |
| 80.8 Infant CDI: words produced (highest quartile) | 1 | 134 | Risk Ratio (M‐H, Fixed, 95% CI) | 1.97 [1.11, 3.48] |
| 80.9 Toddler CDI: words produced (highest quartile) | 1 | 134 | Risk Ratio (M‐H, Fixed, 95% CI) | 2.09 [1.12, 3.90] |
| 80.10 Non‐native constant contrast discrimination | 1 | 144 | Risk Ratio (M‐H, Fixed, 95% CI) | 0.97 [0.68, 1.40] |
| 81 Language: scores Show forest plot | 5 | Mean Difference (IV, Fixed, 95% CI) | Subtotals only | |
| 81.1 Receptive communication at < 24 months | 1 | 49 | Mean Difference (IV, Fixed, 95% CI) | 0.55 [‐0.77, 1.87] |
| 81.2 Receptive language (Peabody Picture Vocabulary Test IIIA) at 2 to 5 years | 1 | 70 | Mean Difference (IV, Fixed, 95% CI) | 3.90 [‐0.73, 8.53] |
| 81.3 Expressive communication at < 24 months | 1 | 49 | Mean Difference (IV, Fixed, 95% CI) | 0.21 [‐0.86, 1.28] |
| 81.4 BSID III at < 24 months | 2 | 809 | Mean Difference (IV, Fixed, 95% CI) | ‐0.84 [‐2.77, 1.09] |
| 81.5 CELF‐P2 Core Language Score at 2 to 5 years | 1 | 646 | Mean Difference (IV, Fixed, 95% CI) | ‐0.93 [‐2.92, 1.06] |
| 81.6 CELF‐P2 Core Language Score at 6 to 9 years | 1 | 543 | Mean Difference (IV, Fixed, 95% CI) | ‐0.21 [‐2.51, 2.09] |
| 81.7 Peabody Picture Vocabulary Test | 1 | 97 | Mean Difference (IV, Fixed, 95% CI) | 4.0 [‐3.11, 11.11] |
| 82 Behaviour: thresholds Show forest plot | 1 | Risk Ratio (M‐H, Fixed, 95% CI) | Subtotals only | |
| 82.1 Behaviour Rating Scale scores < 26: at < 24 months | 1 | 730 | Risk Ratio (M‐H, Fixed, 95% CI) | 5.0 [0.24, 103.79] |
| 83 Behaviour: scores Show forest plot | 6 | Mean Difference (IV, Fixed, 95% CI) | Subtotals only | |
| 83.1 NBAS habituation | 1 | 27 | Mean Difference (IV, Fixed, 95% CI) | ‐1.45 [‐8.49, 5.59] |
| 83.2 NBAS orienting | 1 | 27 | Mean Difference (IV, Fixed, 95% CI) | 3.65 [‐9.09, 16.39] |
| 83.3 NBAS motor | 1 | 27 | Mean Difference (IV, Fixed, 95% CI) | 2.99 [‐8.23, 14.21] |
| 83.4 NBAS state organisation | 1 | 27 | Mean Difference (IV, Fixed, 95% CI) | 1.63 [‐7.21, 10.47] |
| 83.5 NBAS state regulation | 1 | 27 | Mean Difference (IV, Fixed, 95% CI) | 0.51 [‐14.70, 15.72] |
| 83.6 NBAS autonomic | 1 | 27 | Mean Difference (IV, Fixed, 95% CI) | 3.30 [‐8.75, 15.35] |
| 83.7 NBAS reflexes | 1 | 27 | Mean Difference (IV, Fixed, 95% CI) | 0.68 [‐10.28, 11.64] |
| 83.8 BehavioUr Rating Scale score 12 to < 24 months | 1 | 730 | Mean Difference (IV, Fixed, 95% CI) | 0.0 [‐0.94, 0.94] |
| 83.9 Wolke: approach at < 12 months | 1 | 249 | Mean Difference (IV, Fixed, 95% CI) | ‐0.10 [‐0.42, 0.22] |
| 83.10 Wolke: activity at < 12 months | 1 | 249 | Mean Difference (IV, Fixed, 95% CI) | ‐0.10 [‐0.45, 0.25] |
| 83.11 Wolke: co‐operation at < 12 months | 1 | 249 | Mean Difference (IV, Fixed, 95% CI) | 0.0 [‐0.39, 0.39] |
| 83.12 Wolke: emotional tone at < 12 months | 1 | 249 | Mean Difference (IV, Fixed, 95% CI) | ‐0.10 [‐0.49, 0.29] |
| 83.13 Wolke: vocalisation at < 12 months | 1 | 249 | Mean Difference (IV, Fixed, 95% CI) | ‐0.10 [‐0.52, 0.32] |
| 83.14 BSID III social‐emotional score at < 24 months | 2 | 809 | Mean Difference (IV, Fixed, 95% CI) | ‐0.70 [‐3.04, 1.64] |
| 83.15 BSID III adaptive behaviour score at < 24 months | 2 | 809 | Mean Difference (IV, Fixed, 95% CI) | ‐1.20 [‐3.12, 0.72] |
| 83.16 SDQ Total Difficulties at 2 to 5 years | 1 | 646 | Mean Difference (IV, Fixed, 95% CI) | 0.62 [‐0.00, 1.24] |
| 83.17 SDQ Total Difficulties at 6 to 9 years | 1 | 543 | Mean Difference (IV, Fixed, 95% CI) | 1.08 [0.18, 1.98] |
| 83.18 BASC‐2: Behavioral Symptoms Index (%) at 5 years | 1 | 797 | Mean Difference (IV, Fixed, 95% CI) | ‐0.5 [‐4.54, 3.54] |
| 83.19 CBCL total problem behaviour at 2 ‐ 5 years | 1 | 72 | Mean Difference (IV, Fixed, 95% CI) | ‐1.0 [‐3.41, 1.41] |
| 83.20 CBCL parent report: total behaviours score at 12+ years | 1 | 48 | Mean Difference (IV, Fixed, 95% CI) | ‐0.80 [‐5.23, 3.63] |
| 83.21 CBCL parent report: total competence score at > 12 years | 1 | 48 | Mean Difference (IV, Fixed, 95% CI) | ‐0.20 [‐6.36, 5.96] |
| 84 Vision: visual acuity (cycles/degree) Show forest plot | 2 | Mean Difference (IV, Fixed, 95% CI) | Subtotals only | |
| 84.1 At 2 months | 1 | 135 | Mean Difference (IV, Fixed, 95% CI) | 0.18 [‐0.01, 0.37] |
| 84.2 At 4 months | 1 | 30 | Mean Difference (IV, Fixed, 95% CI) | 0.5 [‐0.43, 1.43] |
| 84.3 At 6 months | 1 | 26 | Mean Difference (IV, Fixed, 95% CI) | 0.5 [‐0.48, 1.48] |
| 85 Vision: VEP acuity Show forest plot | 1 | Mean Difference (IV, Fixed, 95% CI) | Subtotals only | |
| 85.1 Adjusted VEP acuity at 4 months (cpd) | 1 | 182 | Mean Difference (IV, Fixed, 95% CI) | ‐0.18 [‐0.75, 0.39] |
| 85.2 Unadjusted VEP acuity at 4 months (cpd) | 1 | 182 | Mean Difference (IV, Fixed, 95% CI) | ‐0.18 [‐0.76, 0.40] |
| 86 Vision: VEP latency Show forest plot | 3 | Mean Difference (IV, Fixed, 95% CI) | Subtotals only | |
| 86.1 Peak latency N1 at birth | 1 | 9 | Mean Difference (IV, Fixed, 95% CI) | ‐12.60 [‐29.40, 4.20] |
| 86.2 Peak latency P1 at birth | 1 | 14 | Mean Difference (IV, Fixed, 95% CI) | ‐6.80 [‐20.44, 6.84] |
| 86.3 Peak latency N2 at birth | 1 | 49 | Mean Difference (IV, Fixed, 95% CI) | 3.60 [‐12.39, 19.59] |
| 86.4 Peak latency P2 at birth | 1 | 55 | Mean Difference (IV, Fixed, 95% CI) | 0.10 [‐16.28, 16.48] |
| 86.5 Peak latency N3 at birth | 1 | 53 | Mean Difference (IV, Fixed, 95% CI) | ‐6.20 [‐36.15, 23.75] |
| 86.6 Latency N1 (ms) at 3 months | 1 | 679 | Mean Difference (IV, Fixed, 95% CI) | 0.30 [‐2.21, 2.81] |
| 86.7 Latency P1 (ms) at 3 months | 1 | 679 | Mean Difference (IV, Fixed, 95% CI) | ‐0.5 [‐3.19, 2.19] |
| 86.8 Latency N3 (ms) at 3 months | 1 | 679 | Mean Difference (IV, Fixed, 95% CI) | ‐2.30 [‐5.91, 1.31] |
| 86.9 Latency (69 min of arc) at 4 months (ms) | 1 | 182 | Mean Difference (IV, Fixed, 95% CI) | ‐1.0 [‐3.47, 1.47] |
| 86.10 Latency (48 min of arc) at 4 months (ms) | 1 | 182 | Mean Difference (IV, Fixed, 95% CI) | 0.0 [‐3.20, 3.20] |
| 86.11 Latency (20 min of arc) at 4 months (ms) | 1 | 182 | Mean Difference (IV, Fixed, 95% CI) | 0.0 [‐4.22, 4.22] |
| 86.12 Latency N1 (ms) at 6 months | 1 | 817 | Mean Difference (IV, Fixed, 95% CI) | ‐1.40 [‐3.44, 0.64] |
| 86.13 Latency P1 (ms) at 6 months | 1 | 817 | Mean Difference (IV, Fixed, 95% CI) | ‐0.80 [‐2.78, 1.18] |
| 86.14 Latency N3 (ms) at 6 months | 1 | 817 | Mean Difference (IV, Fixed, 95% CI) | ‐0.70 [‐3.45, 2.05] |
| 87 Hearing: brainstem auditory‐evoked responses Show forest plot | 1 | Mean Difference (IV, Fixed, 95% CI) | Subtotals only | |
| 87.1 Latency 1 (ms) at 1 month | 1 | 749 | Mean Difference (IV, Fixed, 95% CI) | ‐0.01 [‐0.03, 0.01] |
| 87.2 Latency 3 (ms) at 1 month | 1 | 749 | Mean Difference (IV, Fixed, 95% CI) | ‐0.01 [‐0.06, 0.04] |
| 87.3 Latency 5 (ms) at 1 month | 1 | 749 | Mean Difference (IV, Fixed, 95% CI) | ‐0.03 [‐0.09, 0.03] |
| 87.4 Interpeak latency 1‐3 (ms) at 1 month | 1 | 749 | Mean Difference (IV, Fixed, 95% CI) | ‐0.01 [‐0.06, 0.04] |
| 87.5 Interpeak latency 3‐5 (ms) at 1 month | 1 | 749 | Mean Difference (IV, Fixed, 95% CI) | 0.0 [‐0.05, 0.05] |
| 87.6 Interpeak latency 1‐5 (ms) at 1 month | 1 | 749 | Mean Difference (IV, Fixed, 95% CI) | ‐0.02 [‐0.07, 0.03] |
| 87.7 Latency 1 (ms) at 3 months | 1 | 664 | Mean Difference (IV, Fixed, 95% CI) | 0.0 [‐0.02, 0.02] |
| 87.8 Latency 3 (ms) at 3 months | 1 | 664 | Mean Difference (IV, Fixed, 95% CI) | 0.01 [‐0.04, 0.06] |
| 87.9 Latency 5 (ms) at 3 months | 1 | 664 | Mean Difference (IV, Fixed, 95% CI) | ‐0.04 [‐0.10, 0.02] |
| 87.10 Interpeak latency 1‐3 (ms) at 3 months | 1 | 664 | Mean Difference (IV, Fixed, 95% CI) | 0.01 [‐0.03, 0.05] |
| 87.11 Interpeak latency 3‐5 (ms) at 3 months | 1 | 664 | Mean Difference (IV, Fixed, 95% CI) | ‐0.03 [‐0.08, 0.02] |
| 87.12 Interpeak latency 1‐5 (ms) at 3 months | 1 | 664 | Mean Difference (IV, Fixed, 95% CI) | ‐0.03 [‐0.09, 0.03] |
| 88 Neurodevelopment: thresholds Show forest plot | 3 | Risk Ratio (M‐H, Fixed, 95% CI) | Subtotals only | |
| 88.1 Hempel: simple minor neurological dysfunction at 18 months | 1 | 114 | Risk Ratio (M‐H, Fixed, 95% CI) | 1.11 [0.80, 1.53] |
| 88.2 Hempel: simple and complex minor neurological dysfunction at 4 years | 1 | 167 | Risk Ratio (M‐H, Fixed, 95% CI) | 1.09 [0.37, 3.23] |
| 88.3 Hempel: complex minor neurological dysfunction at 18 months | 1 | 114 | Risk Ratio (M‐H, Fixed, 95% CI) | 0.68 [0.24, 1.93] |
| 88.4 ASQ total at 6 months (subnormal ‐ below 2 SD less than mean scores) | 1 | 146 | Risk Ratio (M‐H, Fixed, 95% CI) | 0.54 [0.17, 1.77] |
| 88.5 Touwen: simple and complex minor neurological dysfunction at 5.5 years | 1 | 148 | Risk Ratio (M‐H, Fixed, 95% CI) | 1.00 [0.61, 1.63] |
| 88.6 Neonatal neurological classification: mildly/definitely abnormal at 2 weeks | 1 | 119 | Risk Ratio (M‐H, Fixed, 95% CI) | 0.87 [0.38, 1.97] |
| 88.7 General movements: mildly/definitely abnormal at 2 weeks | 1 | 119 | Risk Ratio (M‐H, Fixed, 95% CI) | 1.27 [0.75, 2.14] |
| 88.8 General movements: mildly/definitely abnormal at 12 weeks | 1 | 119 | Risk Ratio (M‐H, Fixed, 95% CI) | 1.54 [0.89, 2.65] |
| 89 Neurodevelopment: scores Show forest plot | 1 | Mean Difference (IV, Fixed, 95% CI) | Subtotals only | |
| 89.1 ASQ gross motor at 4 months | 1 | 148 | Mean Difference (IV, Fixed, 95% CI) | 0.30 [‐2.38, 2.98] |
| 89.2 ASQ gross motor at 6 months | 1 | 146 | Mean Difference (IV, Fixed, 95% CI) | 1.20 [‐2.31, 4.71] |
| 89.3 ASQ fine motor at 4 months | 1 | 148 | Mean Difference (IV, Fixed, 95% CI) | 1.10 [‐2.03, 4.23] |
| 89.4 ASQ fine motor at 6 months | 1 | 146 | Mean Difference (IV, Fixed, 95% CI) | 1.20 [‐1.59, 3.99] |
| 89.5 ASQ problem solving at 4 months | 1 | 148 | Mean Difference (IV, Fixed, 95% CI) | 1.60 [‐0.99, 4.19] |
| 89.6 ASQ problem solving at 6 months | 1 | 146 | Mean Difference (IV, Fixed, 95% CI) | 0.5 [‐1.95, 2.95] |
| 89.7 ASQ personal‐social at 4 months | 1 | 148 | Mean Difference (IV, Fixed, 95% CI) | 1.10 [‐1.64, 3.84] |
| 89.8 ASQ personal‐social at 6 months | 1 | 146 | Mean Difference (IV, Fixed, 95% CI) | 0.80 [‐2.61, 4.21] |
| 89.9 ASQ communication at 4 months | 1 | 148 | Mean Difference (IV, Fixed, 95% CI) | 2.70 [0.41, 4.99] |
| 89.10 ASQ communication at 6 months | 1 | 146 | Mean Difference (IV, Fixed, 95% CI) | 0.40 [‐1.55, 2.35] |
| 90 Child Development Inventory Show forest plot | 1 | Risk Ratio (M‐H, Fixed, 95% CI) | Subtotals only | |
| 90.1 Social | 1 | 130 | Risk Ratio (M‐H, Fixed, 95% CI) | 0.0 [0.0, 0.0] |
| 90.2 Self help | 1 | 130 | Risk Ratio (M‐H, Fixed, 95% CI) | 0.29 [0.01, 6.90] |
| 90.3 Gross motor | 1 | 130 | Risk Ratio (M‐H, Fixed, 95% CI) | 4.30 [0.21, 87.76] |
| 90.4 Fine motor | 1 | 130 | Risk Ratio (M‐H, Fixed, 95% CI) | 4.30 [0.21, 87.76] |
| 90.5 Expressive language | 1 | 130 | Risk Ratio (M‐H, Fixed, 95% CI) | 0.86 [0.05, 13.41] |
| 90.6 Language comprehension | 1 | 130 | Risk Ratio (M‐H, Fixed, 95% CI) | 0.0 [0.0, 0.0] |
| 90.7 Letters | 1 | 130 | Risk Ratio (M‐H, Fixed, 95% CI) | 0.17 [0.01, 3.51] |
| 90.8 Numbers | 1 | 130 | Risk Ratio (M‐H, Fixed, 95% CI) | 0.86 [0.05, 13.41] |
| 90.9 General development | 1 | 130 | Risk Ratio (M‐H, Fixed, 95% CI) | 0.51 [0.13, 2.06] |
| 91 Infant sleep behaviour (%) Show forest plot | 1 | Mean Difference (IV, Fixed, 95% CI) | Subtotals only | |
| 91.1 Arousals in quiet sleep: day 1 | 1 | 46 | Mean Difference (IV, Fixed, 95% CI) | ‐3.19 [‐6.07, ‐0.31] |
| 91.2 Arousals in quiet sleep: day 2 | 1 | 39 | Mean Difference (IV, Fixed, 95% CI) | ‐1.89 [‐4.49, 0.71] |
| 91.3 Quiet sleep: day 1 | 1 | 46 | Mean Difference (IV, Fixed, 95% CI) | 0.74 [‐1.97, 3.45] |
| 91.4 Quiet sleep: day 2 | 1 | 39 | Mean Difference (IV, Fixed, 95% CI) | ‐1.0 [‐4.36, 2.36] |
| 91.5 Active sleep: day 1 | 1 | 46 | Mean Difference (IV, Fixed, 95% CI) | ‐2.42 [‐8.51, 3.67] |
| 91.6 Active sleep: day 2 | 1 | 39 | Mean Difference (IV, Fixed, 95% CI) | ‐0.13 [‐8.23, 7.97] |
| 91.7 Arousals in active sleep: day 1 | 1 | 46 | Mean Difference (IV, Fixed, 95% CI) | ‐3.0 [‐5.66, ‐0.34] |
| 91.8 Arousals in active sleep: day 2 | 1 | 46 | Mean Difference (IV, Fixed, 95% CI) | ‐0.63 [‐4.12, 2.86] |
| 92 Cerebral palsy Show forest plot | 1 | 114 | Risk Ratio (M‐H, Fixed, 95% CI) | 0.0 [0.0, 0.0] |
| Outcome or subgroup title | No. of studies | No. of participants | Statistical method | Effect size |
| 1 Preterm birth (< 37 weeks) Show forest plot | 27 | 10304 | Risk Ratio (M‐H, Fixed, 95% CI) | 0.88 [0.81, 0.97] |
| 1.1 Omega‐3 supplements only | 18 | 7608 | Risk Ratio (M‐H, Fixed, 95% CI) | 0.90 [0.80, 1.01] |
| 1.2 Omega‐3 supplements/enrichment + food/diet advice | 3 | 516 | Risk Ratio (M‐H, Fixed, 95% CI) | 0.73 [0.41, 1.29] |
| 1.3 Omega‐3 food/diet advice | 1 | 48 | Risk Ratio (M‐H, Fixed, 95% CI) | 0.11 [0.01, 2.22] |
| 1.4 Omega‐3 supplements + other agents | 6 | 2132 | Risk Ratio (M‐H, Fixed, 95% CI) | 0.89 [0.76, 1.04] |
| 2 Early preterm birth (< 34 weeks) Show forest plot | 9 | 5204 | Risk Ratio (M‐H, Fixed, 95% CI) | 0.58 [0.44, 0.77] |
| 2.1 Omega‐3 supplements only | 8 | 4234 | Risk Ratio (M‐H, Fixed, 95% CI) | 0.62 [0.46, 0.82] |
| 2.2 Omega‐3 supplements + other agents | 1 | 970 | Risk Ratio (M‐H, Fixed, 95% CI) | 0.19 [0.04, 0.88] |
| 3 Prolonged gestation (> 42 weeks) Show forest plot | 6 | 5141 | Risk Ratio (M‐H, Fixed, 95% CI) | 1.61 [1.11, 2.33] |
| 3.1 Omega‐3 supplements only | 5 | 4953 | Risk Ratio (M‐H, Fixed, 95% CI) | 1.59 [1.09, 2.31] |
| 3.2 Omega‐3 supplements + food/diet advice | 1 | 188 | Risk Ratio (M‐H, Fixed, 95% CI) | 3.13 [0.13, 75.84] |
| 4 Maternal death Show forest plot | 4 | 4830 | Risk Ratio (M‐H, Fixed, 95% CI) | 1.69 [0.07, 39.30] |
| 4.1 Omega‐3 supplements only | 3 | 4782 | Risk Ratio (M‐H, Fixed, 95% CI) | 0.0 [0.0, 0.0] |
| 4.2 Omega‐3 food/diet advice | 1 | 48 | Risk Ratio (M‐H, Fixed, 95% CI) | 1.69 [0.07, 39.30] |
| 5 Pre‐eclampsia (hypertension with proteinuria) Show forest plot | 21 | 8306 | Risk Ratio (M‐H, Fixed, 95% CI) | 0.84 [0.69, 1.01] |
| 5.1 Omega‐3 supplements only | 13 | 5825 | Risk Ratio (M‐H, Fixed, 95% CI) | 0.95 [0.76, 1.19] |
| 5.2 Omega‐3 supplements/enrichment + food/dietary advice | 2 | 328 | Risk Ratio (M‐H, Fixed, 95% CI) | 0.65 [0.25, 1.69] |
| 5.3 Omega‐3 supplements + other agents | 6 | 2153 | Risk Ratio (M‐H, Fixed, 95% CI) | 0.58 [0.39, 0.88] |
| 6 High blood pressure (without proteinuria) Show forest plot | 7 | 4531 | Risk Ratio (M‐H, Fixed, 95% CI) | 1.03 [0.89, 1.20] |
| 6.1 Omega‐3 supplements only | 6 | 4431 | Risk Ratio (M‐H, Fixed, 95% CI) | 1.05 [0.90, 1.22] |
| 6.2 Omega‐3 supplements + other agents | 1 | 100 | Risk Ratio (M‐H, Fixed, 95% CI) | 0.69 [0.33, 1.47] |
| 7 Eclampsia Show forest plot | 1 | 100 | Risk Ratio (M‐H, Fixed, 95% CI) | 0.14 [0.01, 2.70] |
| 7.1 Omega‐3 supplements + other agents | 1 | 100 | Risk Ratio (M‐H, Fixed, 95% CI) | 0.14 [0.01, 2.70] |
| 8 Maternal antepartum hospitalisation Show forest plot | 5 | 2876 | Risk Ratio (M‐H, Fixed, 95% CI) | 0.92 [0.81, 1.04] |
| 8.1 Omega‐3 supplements only | 4 | 2817 | Risk Ratio (M‐H, Fixed, 95% CI) | 0.92 [0.82, 1.04] |
| 8.2 Omega‐3 supplementation + other agents | 1 | 59 | Risk Ratio (M‐H, Fixed, 95% CI) | 0.21 [0.01, 4.13] |
| 9 Mother's length of stay in hospital (days) Show forest plot | 2 | 2290 | Mean Difference (IV, Fixed, 95% CI) | 0.18 [‐0.20, 0.57] |
| 9.1 Omega‐3 supplements only | 2 | 2290 | Mean Difference (IV, Fixed, 95% CI) | 0.18 [‐0.20, 0.57] |
| 10 Maternal anaemia Show forest plot | 1 | 846 | Risk Ratio (M‐H, Fixed, 95% CI) | 1.16 [0.91, 1.48] |
| 10.1 Omega‐3 supplements only | 1 | 846 | Risk Ratio (M‐H, Fixed, 95% CI) | 1.16 [0.91, 1.48] |
| 11 Miscarriage (< 24 weeks) Show forest plot | 9 | 4190 | Risk Ratio (M‐H, Fixed, 95% CI) | 1.07 [0.80, 1.43] |
| 11.1 Omega‐3 supplements only | 8 | 3049 | Risk Ratio (M‐H, Fixed, 95% CI) | 0.95 [0.56, 1.60] |
| 11.2 Omega‐3 supplements + other agents | 1 | 1141 | Risk Ratio (M‐H, Fixed, 95% CI) | 1.14 [0.80, 1.61] |
| 12 Antepartum vaginal bleeding Show forest plot | 2 | 2151 | Risk Ratio (M‐H, Fixed, 95% CI) | 1.01 [0.69, 1.48] |
| 12.1 Omega‐3 supplements only | 2 | 2151 | Risk Ratio (M‐H, Fixed, 95% CI) | 1.01 [0.69, 1.48] |
| 13 Preterm prelabour rupture of membranes Show forest plot | 3 | 925 | Risk Ratio (M‐H, Fixed, 95% CI) | 0.53 [0.25, 1.10] |
| 13.1 Omega‐3 supplements only | 2 | 670 | Risk Ratio (M‐H, Fixed, 95% CI) | 0.61 [0.28, 1.34] |
| 13.2 Omega‐3 supplementation/enrichment + food/diet advice | 1 | 255 | Risk Ratio (M‐H, Fixed, 95% CI) | 0.24 [0.03, 2.15] |
| 14 Prelabour rupture of membranes Show forest plot | 3 | 915 | Risk Ratio (M‐H, Fixed, 95% CI) | 0.41 [0.21, 0.82] |
| 14.1 Omega‐3 supplements only | 1 | 369 | Risk Ratio (M‐H, Fixed, 95% CI) | 0.54 [0.14, 2.11] |
| 14.2 Omega‐3 supplementation/enrichment + food/diet advice | 2 | 546 | Risk Ratio (M‐H, Fixed, 95% CI) | 0.38 [0.17, 0.85] |
| 15 Maternal admission to intensive care Show forest plot | 2 | 2458 | Risk Ratio (M‐H, Fixed, 95% CI) | 0.56 [0.12, 2.63] |
| 15.1 Omega‐3 supplements only | 1 | 2399 | Risk Ratio (M‐H, Fixed, 95% CI) | 1.00 [0.14, 7.12] |
| 15.2 Omega‐3 supplements + other agent | 1 | 59 | Risk Ratio (M‐H, Fixed, 95% CI) | 0.21 [0.01, 4.13] |
| 16 Maternal severe adverse effects (including cessation) Show forest plot | 8 | 4177 | Risk Ratio (M‐H, Fixed, 95% CI) | 1.02 [0.59, 1.75] |
| 16.1 Omega‐3 supplements only | 7 | 3886 | Risk Ratio (M‐H, Fixed, 95% CI) | 1.01 [0.54, 1.87] |
| 16.2 Omega‐3 supplementation/enrichment + food/diet advice | 1 | 291 | Risk Ratio (M‐H, Fixed, 95% CI) | 1.05 [0.35, 3.18] |
| 17 Caesarean section Show forest plot | 29 | 8481 | Risk Ratio (M‐H, Fixed, 95% CI) | 0.97 [0.91, 1.03] |
| 17.1 Omega‐3 supplements only | 19 | 6537 | Risk Ratio (M‐H, Fixed, 95% CI) | 0.98 [0.92, 1.06] |
| 17.2 Omega‐3 supplements/enrichment +food/diet advice | 4 | 574 | Risk Ratio (M‐H, Fixed, 95% CI) | 0.87 [0.63, 1.19] |
| 17.3 Omega‐3 food/diet advice | 1 | 107 | Risk Ratio (M‐H, Fixed, 95% CI) | 0.91 [0.38, 2.17] |
| 17.4 Omega‐3 supplements + other agents | 5 | 1263 | Risk Ratio (M‐H, Fixed, 95% CI) | 0.88 [0.72, 1.08] |
| 18 Induction (post‐term) Show forest plot | 3 | 2900 | Risk Ratio (M‐H, Random, 95% CI) | 0.82 [0.22, 2.98] |
| 18.1 Omega‐3 supplements only | 2 | 2712 | Risk Ratio (M‐H, Random, 95% CI) | 0.82 [0.22, 2.98] |
| 18.2 Omega‐3 supplements + food/diet advice | 1 | 188 | Risk Ratio (M‐H, Random, 95% CI) | 0.0 [0.0, 0.0] |
| 19 Blood loss at birth (mL) Show forest plot | 6 | 2776 | Mean Difference (IV, Fixed, 95% CI) | 11.50 [‐6.75, 29.76] |
| 19.1 Omega‐3 supplements only | 5 | 2588 | Mean Difference (IV, Fixed, 95% CI) | 11.64 [‐8.89, 32.17] |
| 19.2 Omega‐3 supplements + food/diet advice | 1 | 188 | Mean Difference (IV, Fixed, 95% CI) | 11.0 [‐28.91, 50.91] |
| 20 Postpartum haemorrhage Show forest plot | 4 | 4085 | Risk Ratio (M‐H, Fixed, 95% CI) | 1.03 [0.82, 1.30] |
| 20.1 Omega‐3 supplements only | 3 | 3233 | Risk Ratio (M‐H, Fixed, 95% CI) | 0.97 [0.71, 1.34] |
| 20.2 Omega‐3 supplements + other agent | 1 | 852 | Risk Ratio (M‐H, Fixed, 95% CI) | 1.11 [0.79, 1.57] |
| 21 Gestational diabetes Show forest plot | 12 | 5235 | Risk Ratio (M‐H, Fixed, 95% CI) | 1.02 [0.83, 1.26] |
| 21.1 Omega‐3 supplements only | 7 | 3726 | Risk Ratio (M‐H, Fixed, 95% CI) | 1.02 [0.80, 1.30] |
| 21.2 Omega‐3 supplements/enrichment + food/diet advice | 4 | 595 | Risk Ratio (M‐H, Fixed, 95% CI) | 0.66 [0.33, 1.34] |
| 21.3 Omega‐3 supplements + other agents | 2 | 914 | Risk Ratio (M‐H, Fixed, 95% CI) | 1.34 [0.80, 2.24] |
| 22 Maternal insulin resistance (HOMA‐IR) Show forest plot | 3 | 176 | Mean Difference (IV, Random, 95% CI) | ‐0.85 [‐2.50, 0.80] |
| 22.1 Omega‐3 supplements only | 2 | 116 | Mean Difference (IV, Random, 95% CI) | ‐0.25 [‐1.94, 1.44] |
| 22.2 Omega‐3 supplements + other agents | 1 | 60 | Mean Difference (IV, Random, 95% CI) | ‐2.0 [‐3.10, ‐0.90] |
| 23 Excessive gestational weight gain Show forest plot | 1 | 350 | Risk Ratio (M‐H, Fixed, 95% CI) | 1.21 [0.95, 1.55] |
| 23.1 Omega‐3 supplements only | 1 | 350 | Risk Ratio (M‐H, Fixed, 95% CI) | 1.21 [0.95, 1.55] |
| 24 Gestational weight gain (kg) Show forest plot | 11 | 2297 | Mean Difference (IV, Random, 95% CI) | ‐0.05 [‐0.68, 0.59] |
| 24.1 Omega‐3 supplements only | 6 | 955 | Mean Difference (IV, Random, 95% CI) | ‐0.22 [‐1.47, 1.03] |
| 24.2 Omega‐3 supplements/enrichment + food/diet advice | 3 | 313 | Mean Difference (IV, Random, 95% CI) | ‐0.11 [‐0.99, 0.78] |
| 24.3 Omega‐3 supplements + other agents | 2 | 1029 | Mean Difference (IV, Random, 95% CI) | 0.43 [‐0.08, 0.95] |
| 25 Depression during pregnancy: scores Show forest plot | 5 | Mean Difference (IV, Fixed, 95% CI) | Subtotals only | |
| 25.1 Omega‐3 supplements only: BDI | 2 | 104 | Mean Difference (IV, Fixed, 95% CI) | ‐5.86 [‐8.32, ‐3.39] |
| 25.2 Omega‐3 supplements only: HAMD | 3 | 71 | Mean Difference (IV, Fixed, 95% CI) | ‐1.08 [‐3.35, 1.19] |
| 25.3 Omega‐3 supplements only: EPDS | 4 | 122 | Mean Difference (IV, Fixed, 95% CI) | ‐0.15 [‐2.09, 1.79] |
| 25.4 Omega‐3 supplements only: MADRS | 1 | 26 | Mean Difference (IV, Fixed, 95% CI) | ‐1.60 [‐7.80, 4.60] |
| 26 Depression during pregnancy: thresholds Show forest plot | 3 | Risk Ratio (M‐H, Fixed, 95% CI) | Subtotals only | |
| 26.1 Omega‐3 supplements only: HAMD 50% reduction (after 8 weeks) | 1 | 24 | Risk Ratio (M‐H, Fixed, 95% CI) | 2.26 [0.78, 6.49] |
| 26.2 Omega‐3 supplements only: HAMD ≤ 7 | 1 | 24 | Risk Ratio (M‐H, Fixed, 95% CI) | 2.12 [0.51, 8.84] |
| 26.3 Omega‐3 supplements only: unspecified | 1 | 301 | Risk Ratio (M‐H, Fixed, 95% CI) | 2.39 [0.47, 12.11] |
| 26.4 Omega‐3 supplements only: EPDS ≥ 11 | 1 | 34 | Risk Ratio (M‐H, Fixed, 95% CI) | 1.4 [0.55, 3.55] |
| 27 Depressive symptoms postpartum: thresholds Show forest plot | 4 | Risk Ratio (M‐H, Fixed, 95% CI) | Subtotals only | |
| 27.1 Omega‐3 supplements only: PDSS ≥80 | 1 | 42 | Risk Ratio (M‐H, Fixed, 95% CI) | 0.37 [0.04, 3.25] |
| 27.2 Omega‐3 supplements only: EPDS | 2 | 2431 | Risk Ratio (M‐H, Fixed, 95% CI) | 0.89 [0.71, 1.12] |
| 27.3 Omega‐3 supplements only: major depressive disorder | 1 | 118 | Risk Ratio (M‐H, Fixed, 95% CI) | 1.33 [0.27, 6.56] |
| 28 Depressive symptoms postpartum: scores Show forest plot | 2 | Mean Difference (IV, Fixed, 95% CI) | Subtotals only | |
| 28.1 Omega‐3 supplements only: BD: 6‐8 weeks postpartum | 1 | 118 | Mean Difference (IV, Fixed, 95% CI) | 0.25 [‐1.93, 2.43] |
| 28.2 Omega‐3 supplements only: PDSS total (LS over 6 months) | 1 | 42 | Mean Difference (IV, Fixed, 95% CI) | ‐6.08 [‐12.42, 0.26] |
| 29 Length of gestation (days) Show forest plot | 43 | 12517 | Mean Difference (IV, Random, 95% CI) | 1.65 [0.94, 2.37] |
| 29.1 Omega‐3 supplements only | 29 | 9290 | Mean Difference (IV, Random, 95% CI) | 1.67 [0.76, 2.59] |
| 29.2 Omega‐3 supplements/enrichment + food/diet advice | 6 | 680 | Mean Difference (IV, Random, 95% CI) | 2.45 [‐0.14, 5.04] |
| 29.3 Omega‐3 food/diet advice | 1 | 107 | Mean Difference (IV, Random, 95% CI) | 5.00 [0.64, 9.36] |
| 29.4 Omega‐3 supplements + other agents | 8 | 2440 | Mean Difference (IV, Random, 95% CI) | 1.04 [0.05, 2.03] |
| 30 Perinatal death Show forest plot | 10 | 7416 | Risk Ratio (M‐H, Fixed, 95% CI) | 0.75 [0.54, 1.03] |
| 30.1 Omega‐3 supplements only | 8 | 6496 | Risk Ratio (M‐H, Fixed, 95% CI) | 0.71 [0.48, 1.03] |
| 30.2 Omega‐3 supplements + other agents | 2 | 920 | Risk Ratio (M‐H, Fixed, 95% CI) | 0.87 [0.47, 1.62] |
| 31 Stillbirth Show forest plot | 16 | 7880 | Risk Ratio (M‐H, Fixed, 95% CI) | 0.94 [0.62, 1.42] |
| 31.1 Omega‐3 supplements only | 13 | 7693 | Risk Ratio (M‐H, Fixed, 95% CI) | 0.92 [0.60, 1.42] |
| 31.2 Omega‐3 supplements + food/diet advice | 1 | 79 | Risk Ratio (M‐H, Fixed, 95% CI) | 0.33 [0.01, 7.75] |
| 31.3 Omega‐3 food/diet advice | 1 | 48 | Risk Ratio (M‐H, Fixed, 95% CI) | 1.69 [0.07, 39.30] |
| 31.4 Omega‐3 supplements + other agents | 1 | 60 | Risk Ratio (M‐H, Fixed, 95% CI) | 3.0 [0.13, 70.83] |
| 32 Neonatal death Show forest plot | 9 | 7448 | Risk Ratio (M‐H, Fixed, 95% CI) | 0.61 [0.34, 1.11] |
| 32.1 Omega‐3 supplements only | 9 | 7448 | Risk Ratio (M‐H, Fixed, 95% CI) | 0.61 [0.34, 1.11] |
| 33 Infant death Show forest plot | 4 | 3239 | Risk Ratio (M‐H, Fixed, 95% CI) | 0.74 [0.25, 2.19] |
| 33.1 Omega‐3 supplements only | 4 | 3239 | Risk Ratio (M‐H, Fixed, 95% CI) | 0.74 [0.25, 2.19] |
| 34 Large‐for‐gestational age Show forest plot | 5 | 3602 | Risk Ratio (M‐H, Fixed, 95% CI) | 1.20 [1.01, 1.43] |
| 34.1 Omega‐3 supplements only | 2 | 2518 | Risk Ratio (M‐H, Fixed, 95% CI) | 1.19 [0.99, 1.43] |
| 34.2 Omega‐3 supplements + food/diet advice | 1 | 188 | Risk Ratio (M‐H, Fixed, 95% CI) | 1.23 [0.48, 3.17] |
| 34.3 Omega‐3 supplements + other agent | 2 | 896 | Risk Ratio (M‐H, Fixed, 95% CI) | 1.28 [0.72, 2.29] |
| 35 Macrosomia Show forest plot | 7 | 2008 | Risk Ratio (M‐H, Fixed, 95% CI) | 0.69 [0.43, 1.13] |
| 35.1 Omega‐3 supplements only | 5 | 1904 | Risk Ratio (M‐H, Fixed, 95% CI) | 0.80 [0.47, 1.36] |
| 35.2 Omega‐3 supplements + other agent | 2 | 104 | Risk Ratio (M‐H, Fixed, 95% CI) | 0.31 [0.08, 1.23] |
| 36 Low birthweight (< 2500 g) Show forest plot | 15 | 8449 | Risk Ratio (M‐H, Fixed, 95% CI) | 0.90 [0.82, 0.99] |
| 36.1 Omega‐3 supplements only | 10 | 6214 | Risk Ratio (M‐H, Fixed, 95% CI) | 0.96 [0.86, 1.07] |
| 36.2 Omega‐3 supplements/enrichment + food/diet advice | 2 | 328 | Risk Ratio (M‐H, Fixed, 95% CI) | 0.66 [0.34, 1.26] |
| 36.3 Omega‐3 supplements + other agents | 3 | 1907 | Risk Ratio (M‐H, Fixed, 95% CI) | 0.77 [0.62, 0.95] |
| 37 Small‐for‐gestational age/IUGR Show forest plot | 8 | 6907 | Risk Ratio (M‐H, Fixed, 95% CI) | 1.01 [0.90, 1.13] |
| 37.1 Omega‐3 supplements only | 5 | 5041 | Risk Ratio (M‐H, Fixed, 95% CI) | 1.05 [0.93, 1.20] |
| 37.2 Omega‐3 supplements + other agents | 3 | 1866 | Risk Ratio (M‐H, Fixed, 95% CI) | 0.80 [0.59, 1.09] |
| 38 Birthweight (g) Show forest plot | 44 | 11584 | Mean Difference (IV, Random, 95% CI) | 75.74 [38.05, 113.43] |
| 38.1 Omega‐3 supplements only | 31 | 8522 | Mean Difference (IV, Random, 95% CI) | 59.41 [23.23, 95.59] |
| 38.2 Omega‐3 supplements/enrichment + food/diet advice | 6 | 859 | Mean Difference (IV, Random, 95% CI) | 129.42 [49.52, 209.31] |
| 38.3 Omega‐3 food/diet advice | 1 | 107 | Mean Difference (IV, Random, 95% CI) | ‐17.0 [‐190.97, 156.97] |
| 38.4 Omega‐3 supplements + other agents | 6 | 2096 | Mean Difference (IV, Random, 95% CI) | 69.14 [‐72.81, 211.10] |
| 39 Birthweight Z score Show forest plot | 4 | 2792 | Mean Difference (IV, Fixed, 95% CI) | 0.06 [‐0.02, 0.13] |
| 39.1 Omega‐3 supplements only | 3 | 2677 | Mean Difference (IV, Fixed, 95% CI) | 0.06 [‐0.01, 0.14] |
| 39.2 Omega‐3 supplements + other agent | 1 | 115 | Mean Difference (IV, Fixed, 95% CI) | 0.00 [‐0.21, 0.21] |
| 40 Birth length (cm) Show forest plot | 29 | 8008 | Mean Difference (IV, Random, 95% CI) | 0.13 [‐0.08, 0.34] |
| 40.1 Omega‐3 supplements only | 20 | 6010 | Mean Difference (IV, Random, 95% CI) | 0.21 [‐0.03, 0.45] |
| 40.2 Omega‐3 supplements/enrichment + food/diet advice | 4 | 606 | Mean Difference (IV, Random, 95% CI) | 0.42 [‐0.01, 0.85] |
| 40.3 Omega‐3 food/diet advice | 1 | 123 | Mean Difference (IV, Random, 95% CI) | ‐0.10 [‐0.56, 0.36] |
| 40.4 Omega‐3 supplements + other agent | 4 | 1269 | Mean Difference (IV, Random, 95% CI) | ‐0.51 [‐0.78, ‐0.23] |
| 41 Length at birth Z score Show forest plot | 2 | 2462 | Mean Difference (IV, Random, 95% CI) | 0.18 [‐0.18, 0.54] |
| 41.1 Omega‐3 supplements only | 2 | 2462 | Mean Difference (IV, Random, 95% CI) | 0.18 [‐0.18, 0.54] |
| 42 Head circumference at birth (cm) Show forest plot | 23 | 7041 | Mean Difference (IV, Fixed, 95% CI) | 0.10 [0.01, 0.18] |
| 42.1 Omega‐3 supplements only | 16 | 5442 | Mean Difference (IV, Fixed, 95% CI) | 0.07 [‐0.03, 0.17] |
| 42.2 Omega‐3 supplements/enrichment + food/diet advice | 3 | 418 | Mean Difference (IV, Fixed, 95% CI) | 0.34 [0.03, 0.65] |
| 42.3 Omega‐3 food/diet advice only | 1 | 107 | Mean Difference (IV, Fixed, 95% CI) | ‐0.20 [‐0.75, 0.35] |
| 42.4 Omega‐3 supplements + other agent | 3 | 1074 | Mean Difference (IV, Fixed, 95% CI) | 0.15 [‐0.06, 0.35] |
| 43 Head circumference at birth Z score Show forest plot | 2 | 2462 | Mean Difference (IV, Fixed, 95% CI) | ‐0.03 [‐0.14, 0.07] |
| 43.1 Omega‐3 supplementation only | 2 | 2462 | Mean Difference (IV, Fixed, 95% CI) | ‐0.03 [‐0.14, 0.07] |
| 44 Baby admitted to neonatal care Show forest plot | 9 | 6920 | Risk Ratio (M‐H, Fixed, 95% CI) | 0.92 [0.83, 1.03] |
| 44.1 Omega‐3 supplements only | 5 | 5692 | Risk Ratio (M‐H, Fixed, 95% CI) | 0.90 [0.79, 1.02] |
| 44.2 Omega‐3 supplements/enrichment + food/diet advice | 2 | 328 | Risk Ratio (M‐H, Fixed, 95% CI) | 0.89 [0.54, 1.50] |
| 44.3 Omega‐3 supplements + other agents | 2 | 900 | Risk Ratio (M‐H, Fixed, 95% CI) | 1.01 [0.81, 1.26] |
| 45 Infant length of stay in hospital (days) Show forest plot | 1 | 2041 | Mean Difference (IV, Fixed, 95% CI) | 0.11 [‐1.40, 1.62] |
| 45.1 Omega‐3 supplementation only | 1 | 2041 | Mean Difference (IV, Fixed, 95% CI) | 0.11 [‐1.40, 1.62] |
| 46 Congenital anomalies Show forest plot | 3 | 1807 | Risk Ratio (M‐H, Fixed, 95% CI) | 1.08 [0.61, 1.92] |
| 46.1 Omega‐3 supplements only | 3 | 1807 | Risk Ratio (M‐H, Fixed, 95% CI) | 1.08 [0.61, 1.92] |
| 47 Retinopathy of prematurity Show forest plot | 1 | 837 | Risk Ratio (M‐H, Fixed, 95% CI) | 1.20 [0.32, 4.44] |
| 47.1 Omega‐3 supplementation + other agent only | 1 | 837 | Risk Ratio (M‐H, Fixed, 95% CI) | 1.20 [0.32, 4.44] |
| 48 Bronchopulmonary dysplasia Show forest plot | 2 | 3191 | Risk Ratio (M‐H, Fixed, 95% CI) | 1.06 [0.45, 2.48] |
| 48.1 Omega‐3 supplementation only | 1 | 2363 | Risk Ratio (M‐H, Fixed, 95% CI) | 0.50 [0.09, 2.71] |
| 48.2 Omega‐3 supplementation + other agent | 1 | 828 | Risk Ratio (M‐H, Fixed, 95% CI) | 1.42 [0.51, 3.96] |
| 49 Respiratory distress syndrome Show forest plot | 2 | 1129 | Risk Ratio (M‐H, Random, 95% CI) | 1.17 [0.54, 2.52] |
| 49.1 Omega‐3 supplementation only | 1 | 301 | Risk Ratio (M‐H, Random, 95% CI) | 0.72 [0.31, 1.65] |
| 49.2 Omega‐3 supplementation + other agent | 1 | 828 | Risk Ratio (M‐H, Random, 95% CI) | 1.60 [1.08, 2.37] |
| 50 Necrotising enterocolitis (NEC) Show forest plot | 2 | 3198 | Risk Ratio (M‐H, Fixed, 95% CI) | 0.97 [0.26, 3.55] |
| 50.1 Omega‐3 supplementation only | 1 | 2361 | Risk Ratio (M‐H, Fixed, 95% CI) | 2.98 [0.12, 73.13] |
| 50.2 Omega‐3 supplementation + other agent | 1 | 837 | Risk Ratio (M‐H, Fixed, 95% CI) | 0.72 [0.16, 3.20] |
| 51 Neonatal sepsis (proven) Show forest plot | 3 | 3788 | Risk Ratio (M‐H, Fixed, 95% CI) | 0.97 [0.44, 2.14] |
| 51.1 Omega‐3 supplements only | 3 | 3788 | Risk Ratio (M‐H, Fixed, 95% CI) | 0.97 [0.44, 2.14] |
| 52 Convulsion Show forest plot | 1 | 2361 | Risk Ratio (M‐H, Fixed, 95% CI) | 0.09 [0.01, 1.63] |
| 52.1 Omega‐3 supplementation only | 1 | 2361 | Risk Ratio (M‐H, Fixed, 95% CI) | 0.09 [0.01, 1.63] |
| 53 Intraventricular haemorrhage Show forest plot | 3 | 5423 | Risk Ratio (M‐H, Random, 95% CI) | 1.00 [0.29, 3.49] |
| 53.1 Omega‐3 supplements only | 2 | 4586 | Risk Ratio (M‐H, Random, 95% CI) | 0.59 [0.02, 16.16] |
| 53.2 Omega‐3 supplementation + other agent | 1 | 837 | Risk Ratio (M‐H, Random, 95% CI) | 1.07 [0.44, 2.60] |
| 54 Neonatal/infant serious adverse events Show forest plot | 2 | 2690 | Risk Ratio (M‐H, Fixed, 95% CI) | 0.72 [0.53, 0.99] |
| 54.1 Omega‐3 supplementation | 1 | 2399 | Risk Ratio (M‐H, Fixed, 95% CI) | 0.67 [0.44, 1.01] |
| 54.2 Omega‐3 supplements/enrichment + food/diet advice | 1 | 291 | Risk Ratio (M‐H, Fixed, 95% CI) | 0.81 [0.50, 1.31] |
| 55 Neonatal/infant morbidity: cardiovascular Show forest plot | 1 | 291 | Risk Ratio (M‐H, Fixed, 95% CI) | 1.20 [0.85, 1.69] |
| 55.1 Omega‐3 supplements/enrichment + food/diet advice | 1 | 291 | Risk Ratio (M‐H, Fixed, 95% CI) | 1.20 [0.85, 1.69] |
| 56 Neonatal/infant morbidity: respiratory Show forest plot | 1 | 291 | Risk Ratio (M‐H, Fixed, 95% CI) | 1.02 [0.66, 1.57] |
| 56.1 Omega‐3 supplements/enrichment + food/diet advice | 1 | 291 | Risk Ratio (M‐H, Fixed, 95% CI) | 1.02 [0.66, 1.57] |
| 57 Neonatal/infant morbidity: caused by pregnancy/birth Show forest plot | 1 | 291 | Risk Ratio (M‐H, Fixed, 95% CI) | 1.02 [0.67, 1.55] |
| 57.1 Omega‐3 supplements/enrichment + food/diet advice | 1 | 291 | Risk Ratio (M‐H, Fixed, 95% CI) | 1.02 [0.67, 1.55] |
| 58 Ponderal index Show forest plot | 6 | 887 | Mean Difference (IV, Random, 95% CI) | 0.05 [‐0.01, 0.11] |
| 58.1 Omega‐3 supplements only | 5 | 699 | Mean Difference (IV, Random, 95% CI) | 0.04 [‐0.04, 0.11] |
| 58.2 Omega‐3 supplements + food/diet advice | 1 | 188 | Mean Difference (IV, Random, 95% CI) | 0.08 [0.01, 0.15] |
| Outcome or subgroup title | No. of studies | No. of participants | Statistical method | Effect size |
| 1 Preterm birth (< 37 weeks) Show forest plot | 26 | 10294 | Risk Ratio (M‐H, Fixed, 95% CI) | 0.88 [0.80, 0.97] |
| 1.1 Low: < 500 mg/day | 6 | 1604 | Risk Ratio (M‐H, Fixed, 95% CI) | 0.88 [0.65, 1.20] |
| 1.2 Mid: 500 mg‐1 g/day | 9 | 4343 | Risk Ratio (M‐H, Fixed, 95% CI) | 0.79 [0.64, 0.98] |
| 1.3 High: > 1 g/day | 9 | 4240 | Risk Ratio (M‐H, Fixed, 95% CI) | 0.92 [0.83, 1.03] |
| 1.4 Other | 2 | 107 | Risk Ratio (M‐H, Fixed, 95% CI) | 0.66 [0.19, 2.32] |
| 2 Early preterm birth (< 34 weeks) Show forest plot | 9 | 5204 | Risk Ratio (M‐H, Fixed, 95% CI) | 0.58 [0.44, 0.77] |
| 2.1 Low: < 500 mg/day | 1 | 168 | Risk Ratio (M‐H, Fixed, 95% CI) | 0.29 [0.05, 1.51] |
| 2.2 Mid: 500 mg‐1 g/day | 7 | 4176 | Risk Ratio (M‐H, Fixed, 95% CI) | 0.47 [0.30, 0.75] |
| 2.3 High: > 1 g/day | 2 | 860 | Risk Ratio (M‐H, Fixed, 95% CI) | 0.69 [0.49, 0.99] |
| 3 Prolonged gestation (> 42 weeks) Show forest plot | 6 | 5141 | Risk Ratio (M‐H, Fixed, 95% CI) | 1.59 [1.10, 2.30] |
| 3.1 Low: < 500 mg/day | 2 | 303 | Risk Ratio (M‐H, Fixed, 95% CI) | 1.72 [0.07, 41.64] |
| 3.2 Mid: 500 mg‐1 g/day | 2 | 2544 | Risk Ratio (M‐H, Fixed, 95% CI) | 1.92 [0.54, 6.81] |
| 3.3 High: > 1 g/day | 3 | 2294 | Risk Ratio (M‐H, Fixed, 95% CI) | 1.56 [1.05, 2.30] |
| 4 Pre‐eclampsia (hypertension with proteinuria) Show forest plot | 20 | 8306 | Risk Ratio (M‐H, Fixed, 95% CI) | 0.83 [0.69, 1.01] |
| 4.1 Low: < 500 mg/day | 5 | 650 | Risk Ratio (M‐H, Fixed, 95% CI) | 0.59 [0.28, 1.26] |
| 4.2 Mid: 500 mg‐1 g/day | 7 | 4118 | Risk Ratio (M‐H, Fixed, 95% CI) | 0.83 [0.62, 1.11] |
| 4.3 High: > 1 g/day | 8 | 3479 | Risk Ratio (M‐H, Fixed, 95% CI) | 0.87 [0.66, 1.14] |
| 4.4 Other | 1 | 59 | Risk Ratio (M‐H, Fixed, 95% CI) | 2.07 [0.20, 21.60] |
| 5 Caesarean section Show forest plot | 28 | 8481 | Risk Ratio (M‐H, Fixed, 95% CI) | 0.97 [0.91, 1.03] |
| 5.1 Low: < 500 g/day | 8 | 1670 | Risk Ratio (M‐H, Fixed, 95% CI) | 0.94 [0.84, 1.06] |
| 5.2 Mid: 500 mg‐1 g/day | 10 | 4399 | Risk Ratio (M‐H, Fixed, 95% CI) | 0.93 [0.85, 1.02] |
| 5.3 High: > 1 g/day | 8 | 2294 | Risk Ratio (M‐H, Fixed, 95% CI) | 1.15 [0.97, 1.37] |
| 5.4 Other | 2 | 118 | Risk Ratio (M‐H, Fixed, 95% CI) | 0.59 [0.30, 1.15] |
| 6 Length of gestation (days) Show forest plot | 42 | 12517 | Mean Difference (IV, Random, 95% CI) | 1.67 [0.95, 2.39] |
| 6.1 Low: < 500 mg/day | 12 | 2117 | Mean Difference (IV, Random, 95% CI) | 1.05 [0.07, 2.03] |
| 6.2 Mid: 500 mg‐1 g/day | 15 | 4881 | Mean Difference (IV, Random, 95% CI) | 1.97 [0.56, 3.38] |
| 6.3 High: > 1 g/day | 12 | 3364 | Mean Difference (IV, Random, 95% CI) | 1.86 [0.45, 3.27] |
| 6.4 Mixed | 1 | 1998 | Mean Difference (IV, Random, 95% CI) | 0.10 [‐1.00, 1.20] |
| 6.5 Other | 3 | 157 | Mean Difference (IV, Random, 95% CI) | 2.24 [‐0.83, 5.31] |
| 7 Perinatal death Show forest plot | 10 | 7416 | Risk Ratio (M‐H, Fixed, 95% CI) | 0.75 [0.54, 1.03] |
| 7.1 Low: < 500 mg/day | 2 | 1127 | Risk Ratio (M‐H, Fixed, 95% CI) | 0.52 [0.20, 1.33] |
| 7.2 Mid: 500 mg‐1 g/day | 3 | 2566 | Risk Ratio (M‐H, Fixed, 95% CI) | 0.41 [0.16, 1.02] |
| 7.3 High: > 1 g/day | 5 | 3723 | Risk Ratio (M‐H, Fixed, 95% CI) | 0.89 [0.61, 1.29] |
| 8 Stillbirth Show forest plot | 16 | 7880 | Risk Ratio (M‐H, Fixed, 95% CI) | 0.94 [0.62, 1.42] |
| 8.1 Low: < 500 mg/day | 1 | 977 | Risk Ratio (M‐H, Fixed, 95% CI) | 0.67 [0.11, 3.96] |
| 8.2 Mid: 500 mg/day‐1 g/day | 5 | 2783 | Risk Ratio (M‐H, Fixed, 95% CI) | 0.70 [0.27, 1.83] |
| 8.3 High: > 1 g/day | 7 | 3933 | Risk Ratio (M‐H, Fixed, 95% CI) | 1.03 [0.62, 1.69] |
| 8.4 Other | 3 | 187 | Risk Ratio (M‐H, Fixed, 95% CI) | 1.16 [0.23, 5.94] |
| 9 Neonatal death Show forest plot | 9 | 7448 | Risk Ratio (M‐H, Fixed, 95% CI) | 0.61 [0.34, 1.11] |
| 9.1 Low: < 500 mg/day | 2 | 1123 | Risk Ratio (M‐H, Fixed, 95% CI) | 0.47 [0.15, 1.44] |
| 9.2 Mid: 500 mg/day‐1 g/day | 2 | 2700 | Risk Ratio (M‐H, Fixed, 95% CI) | 0.50 [0.12, 1.98] |
| 9.3 High: > 1 g/day | 5 | 3625 | Risk Ratio (M‐H, Fixed, 95% CI) | 0.78 [0.34, 1.78] |
| 10 Low birthweight (< 2500 g) Show forest plot | 15 | 8449 | Risk Ratio (M‐H, Fixed, 95% CI) | 0.90 [0.82, 0.99] |
| 10.1 Low: < 500 mg/day | 5 | 1551 | Risk Ratio (M‐H, Fixed, 95% CI) | 0.74 [0.51, 1.08] |
| 10.2 Mid: 500 mg‐1 g/day | 5 | 3901 | Risk Ratio (M‐H, Fixed, 95% CI) | 0.71 [0.54, 0.92] |
| 10.3 High: > 1 g/day | 5 | 2997 | Risk Ratio (M‐H, Fixed, 95% CI) | 0.97 [0.88, 1.08] |
| 11 Small‐for‐gestational age/IUGR Show forest plot | 8 | 6907 | Risk Ratio (M‐H, Fixed, 95% CI) | 1.01 [0.90, 1.13] |
| 11.1 Low: < 500 mg/day | 1 | 973 | Risk Ratio (M‐H, Fixed, 95% CI) | 1.04 [0.73, 1.48] |
| 11.2 Mid: 500 mg‐1 g/day | 2 | 3369 | Risk Ratio (M‐H, Fixed, 95% CI) | 0.85 [0.66, 1.09] |
| 11.3 High: > 1 g/day | 4 | 2506 | Risk Ratio (M‐H, Fixed, 95% CI) | 1.07 [0.93, 1.23] |
| 11.4 Other | 1 | 59 | Risk Ratio (M‐H, Fixed, 95% CI) | 2.07 [0.20, 21.60] |
| 12 Birthweight (g) Show forest plot | 44 | 11584 | Mean Difference (IV, Random, 95% CI) | 75.30 [38.09, 112.50] |
| 12.1 Low: < 500 mg/day | 12 | 2220 | Mean Difference (IV, Random, 95% CI) | 26.32 [‐12.74, 65.39] |
| 12.2 Mid: 500 mg‐1 g/day | 18 | 5007 | Mean Difference (IV, Random, 95% CI) | 91.49 [24.34, 158.64] |
| 12.3 High: > 1 g/day | 14 | 4298 | Mean Difference (IV, Random, 95% CI) | 88.31 [29.61, 147.01] |
| 12.4 Other | 1 | 59 | Mean Difference (IV, Random, 95% CI) | ‐203.20 [‐456.97, 50.57] |
| Outcome or subgroup title | No. of studies | No. of participants | Statistical method | Effect size |
| 1 Preterm birth (< 37 weeks) Show forest plot | 26 | 10304 | Risk Ratio (M‐H, Fixed, 95% CI) | 0.89 [0.81, 0.97] |
| 1.1 ≤ 20 weeks GA start | 12 | 6563 | Risk Ratio (M‐H, Fixed, 95% CI) | 0.85 [0.76, 0.95] |
| 1.2 > 20 weeks GA start | 13 | 3693 | Risk Ratio (M‐H, Fixed, 95% CI) | 1.01 [0.82, 1.23] |
| 1.3 Mixed | 1 | 48 | Risk Ratio (M‐H, Fixed, 95% CI) | 0.11 [0.01, 2.22] |
| 2 Early preterm birth (< 34 weeks) Show forest plot | 9 | 5204 | Risk Ratio (M‐H, Fixed, 95% CI) | 0.58 [0.44, 0.77] |
| 2.1 ≤ 20 weeks GA start | 8 | 5090 | Risk Ratio (M‐H, Fixed, 95% CI) | 0.56 [0.43, 0.75] |
| 2.2 > 20 weeks GA start | 1 | 114 | Risk Ratio (M‐H, Fixed, 95% CI) | 4.83 [0.24, 98.44] |
| 3 Prolonged gestation (> 42 weeks) Show forest plot | 6 | 5141 | Risk Ratio (M‐H, Fixed, 95% CI) | 1.61 [1.11, 2.33] |
| 3.1 ≤ 20 weeks GA start | 5 | 4608 | Risk Ratio (M‐H, Fixed, 95% CI) | 2.35 [1.29, 4.28] |
| 3.2 > 20 weeks GA start | 1 | 533 | Risk Ratio (M‐H, Fixed, 95% CI) | 1.19 [0.73, 1.93] |
| 4 Pre‐eclampsia (hypertension with proteinuria) Show forest plot | 20 | 8306 | Risk Ratio (M‐H, Fixed, 95% CI) | 0.84 [0.69, 1.01] |
| 4.1 ≤ 20 weeks GA start | 13 | 6296 | Risk Ratio (M‐H, Fixed, 95% CI) | 0.92 [0.74, 1.15] |
| 4.2 > 20 weeks GA start | 6 | 1883 | Risk Ratio (M‐H, Fixed, 95% CI) | 0.79 [0.53, 1.18] |
| 4.3 Not reported | 1 | 127 | Risk Ratio (M‐H, Fixed, 95% CI) | 0.07 [0.01, 0.54] |
| 5 Caesarean section Show forest plot | 28 | 8481 | Risk Ratio (M‐H, Fixed, 95% CI) | 0.97 [0.91, 1.03] |
| 5.1 ≤ 20 weeks GA start | 13 | 4995 | Risk Ratio (M‐H, Fixed, 95% CI) | 0.97 [0.88, 1.07] |
| 5.2 > 20 weeks GA start | 14 | 2617 | Risk Ratio (M‐H, Fixed, 95% CI) | 0.98 [0.87, 1.10] |
| 5.3 Mixed | 1 | 869 | Risk Ratio (M‐H, Fixed, 95% CI) | 0.95 [0.83, 1.08] |
| 6 Length of gestation (days) Show forest plot | 43 | 12517 | Mean Difference (IV, Random, 95% CI) | 1.67 [0.95, 2.39] |
| 6.1 ≤ 20 weeks GA start | 23 | 9396 | Mean Difference (IV, Random, 95% CI) | 1.99 [1.08, 2.90] |
| 6.2 > 20 weeks GA start | 20 | 3121 | Mean Difference (IV, Random, 95% CI) | 1.18 [‐0.05, 2.40] |
| 7 Perinatal death Show forest plot | 10 | 7416 | Risk Ratio (M‐H, Fixed, 95% CI) | 0.75 [0.54, 1.03] |
| 7.1 ≤ 20 weeks GA start | 6 | 5815 | Risk Ratio (M‐H, Fixed, 95% CI) | 0.72 [0.49, 1.07] |
| 7.2 > 20 weeks GA start | 4 | 1601 | Risk Ratio (M‐H, Fixed, 95% CI) | 0.79 [0.46, 1.38] |
| 8 Stillbirth Show forest plot | 16 | 7880 | Risk Ratio (M‐H, Fixed, 95% CI) | 0.94 [0.62, 1.42] |
| 8.1 ≤ 20 weeks GA start | 8 | 5537 | Risk Ratio (M‐H, Fixed, 95% CI) | 0.88 [0.52, 1.48] |
| 8.2 > 20 weeks GA start | 7 | 2295 | Risk Ratio (M‐H, Fixed, 95% CI) | 1.02 [0.50, 2.07] |
| 8.3 Mixed | 1 | 48 | Risk Ratio (M‐H, Fixed, 95% CI) | 1.69 [0.07, 39.30] |
| 9 Neonatal death Show forest plot | 9 | 7448 | Risk Ratio (M‐H, Fixed, 95% CI) | 0.61 [0.34, 1.11] |
| 9.1 ≤ 20 weeks GA start | 6 | 5415 | Risk Ratio (M‐H, Fixed, 95% CI) | 0.60 [0.26, 1.36] |
| 9.2 > 20 weeks GA start | 3 | 2033 | Risk Ratio (M‐H, Fixed, 95% CI) | 0.62 [0.26, 1.49] |
| 10 Low birthweight (< 2500 g) Show forest plot | 15 | 8449 | Risk Ratio (M‐H, Fixed, 95% CI) | 0.90 [0.82, 0.99] |
| 10.1 ≤ 20 weeks GA start | 9 | 6553 | Risk Ratio (M‐H, Fixed, 95% CI) | 0.88 [0.79, 0.97] |
| 10.2 > 20 weeks GA start | 6 | 1896 | Risk Ratio (M‐H, Fixed, 95% CI) | 1.02 [0.81, 1.28] |
| 11 Small‐for‐gestational age/IUGR Show forest plot | 8 | 6907 | Risk Ratio (M‐H, Fixed, 95% CI) | 1.01 [0.90, 1.13] |
| 11.1 ≤ 20 weeks GA start | 5 | 5643 | Risk Ratio (M‐H, Fixed, 95% CI) | 1.00 [0.88, 1.14] |
| 11.2 > 20 weeks GA start | 3 | 1264 | Risk Ratio (M‐H, Fixed, 95% CI) | 1.03 [0.79, 1.34] |
| 12 Birthweight (g) Show forest plot | 43 | 11584 | Mean Difference (IV, Random, 95% CI) | 75.69 [37.84, 113.55] |
| 12.1 ≤ 20 weeks GA start | 25 | 7802 | Mean Difference (IV, Random, 95% CI) | 83.26 [44.09, 122.43] |
| 12.2 > 20 weeks GA start | 17 | 3747 | Mean Difference (IV, Random, 95% CI) | 42.96 [‐34.14, 120.06] |
| 12.3 Not reported | 1 | 35 | Mean Difference (IV, Random, 95% CI) | 200.0 [‐205.07, 605.07] |
| Outcome or subgroup title | No. of studies | No. of participants | Statistical method | Effect size |
| 1 Preterm birth (< 37 weeks) Show forest plot | 26 | 10304 | Risk Ratio (M‐H, Fixed, 95% CI) | 0.89 [0.81, 0.97] |
| 1.1 DHA/largely DHA | 12 | 4744 | Risk Ratio (M‐H, Fixed, 95% CI) | 0.84 [0.69, 1.02] |
| 1.2 Mixed DHA/EPA | 9 | 4172 | Risk Ratio (M‐H, Fixed, 95% CI) | 0.92 [0.83, 1.03] |
| 1.3 Mixed DHA/EPA/other | 5 | 1388 | Risk Ratio (M‐H, Fixed, 95% CI) | 0.71 [0.45, 1.11] |
| 2 Early preterm birth (< 34 weeks) Show forest plot | 9 | 5204 | Risk Ratio (M‐H, Fixed, 95% CI) | 0.58 [0.44, 0.77] |
| 2.1 DHA/largely DHA | 5 | 3260 | Risk Ratio (M‐H, Fixed, 95% CI) | 0.46 [0.28, 0.76] |
| 2.2 Mixed DHA/EPA | 2 | 860 | Risk Ratio (M‐H, Fixed, 95% CI) | 0.69 [0.49, 0.99] |
| 2.3 Mixed DHA/EPA/other | 2 | 1084 | Risk Ratio (M‐H, Fixed, 95% CI) | 0.41 [0.14, 1.25] |
| 3 Prolonged gestation (> 42 weeks) Show forest plot | 6 | 5141 | Risk Ratio (M‐H, Fixed, 95% CI) | 1.61 [1.11, 2.33] |
| 3.1 DHA/largely DHA | 3 | 2847 | Risk Ratio (M‐H, Fixed, 95% CI) | 2.12 [0.60, 7.49] |
| 3.2 Mixed DHA/EPA | 2 | 2106 | Risk Ratio (M‐H, Fixed, 95% CI) | 1.54 [1.04, 2.28] |
| 3.3 Mixed DHA/EPA/other | 1 | 188 | Risk Ratio (M‐H, Fixed, 95% CI) | 3.13 [0.13, 75.84] |
| 4 Pre‐eclampsia (hypertension with proteinuria) Show forest plot | 20 | 8306 | Risk Ratio (M‐H, Fixed, 95% CI) | 0.84 [0.69, 1.01] |
| 4.1 DHA/largely DHA | 6 | 3454 | Risk Ratio (M‐H, Fixed, 95% CI) | 0.98 [0.71, 1.33] |
| 4.2 Mixed DHA/EPA | 9 | 3506 | Risk Ratio (M‐H, Fixed, 95% CI) | 0.90 [0.69, 1.18] |
| 4.3 Mixed DHA/EPA/other | 5 | 1346 | Risk Ratio (M‐H, Fixed, 95% CI) | 0.40 [0.23, 0.71] |
| 5 Caesarean section Show forest plot | 28 | 8481 | Risk Ratio (M‐H, Fixed, 95% CI) | 0.97 [0.91, 1.03] |
| 5.1 DHA/largely DHA | 9 | 4327 | Risk Ratio (M‐H, Fixed, 95% CI) | 0.95 [0.87, 1.03] |
| 5.2 Mixed DHA/EPA | 10 | 2433 | Risk Ratio (M‐H, Fixed, 95% CI) | 1.10 [0.95, 1.27] |
| 5.3 Mixed DHA/EPA/other | 9 | 1721 | Risk Ratio (M‐H, Fixed, 95% CI) | 0.88 [0.75, 1.02] |
| 6 Gestational length (days) Show forest plot | 43 | 12517 | Mean Difference (IV, Random, 95% CI) | 1.67 [0.95, 2.39] |
| 6.1 DHA/largely DHA | 14 | 4791 | Mean Difference (IV, Random, 95% CI) | 2.44 [0.91, 3.98] |
| 6.2 Mixed DHA/EPA | 17 | 5760 | Mean Difference (IV, Random, 95% CI) | 1.23 [0.21, 2.24] |
| 6.3 Mixed DHA/EPA/other | 12 | 1966 | Mean Difference (IV, Random, 95% CI) | 1.42 [0.33, 2.50] |
| 7 Perinatal death Show forest plot | 10 | 7416 | Risk Ratio (M‐H, Fixed, 95% CI) | 0.75 [0.54, 1.03] |
| 7.1 DHA/largely DHA | 3 | 3475 | Risk Ratio (M‐H, Fixed, 95% CI) | 0.44 [0.21, 0.91] |
| 7.2 Mixed DHA/EPA | 6 | 3873 | Risk Ratio (M‐H, Fixed, 95% CI) | 0.88 [0.60, 1.27] |
| 7.3 Mixed DHA/EPA/other | 1 | 68 | Risk Ratio (M‐H, Fixed, 95% CI) | 0.67 [0.12, 3.74] |
| 8 Stillbirth Show forest plot | 16 | 7880 | Risk Ratio (M‐H, Fixed, 95% CI) | 0.94 [0.62, 1.42] |
| 8.1 DHA/largely DHA | 5 | 3639 | Risk Ratio (M‐H, Fixed, 95% CI) | 0.69 [0.28, 1.70] |
| 8.2 Mixed DHA/EPA | 8 | 3987 | Risk Ratio (M‐H, Fixed, 95% CI) | 1.06 [0.65, 1.73] |
| 8.3 Mixed DHA/EPA/other | 3 | 254 | Risk Ratio (M‐H, Fixed, 95% CI) | 0.70 [0.14, 3.51] |
| 9 Neonatal death Show forest plot | 9 | 7448 | Risk Ratio (M‐H, Fixed, 95% CI) | 0.61 [0.34, 1.11] |
| 9.1 DHA/largely DHA | 3 | 3673 | Risk Ratio (M‐H, Fixed, 95% CI) | 0.50 [0.20, 1.23] |
| 9.2 Mixed DHA/EPA | 6 | 3775 | Risk Ratio (M‐H, Fixed, 95% CI) | 0.73 [0.33, 1.62] |
| 10 Low birthweight (< 2500 g) Show forest plot | 15 | 8449 | Risk Ratio (M‐H, Fixed, 95% CI) | 0.90 [0.82, 0.99] |
| 10.1 DHA/largely DHA | 6 | 4118 | Risk Ratio (M‐H, Fixed, 95% CI) | 0.72 [0.56, 0.93] |
| 10.2 Mixed DHA/EPA | 6 | 3147 | Risk Ratio (M‐H, Fixed, 95% CI) | 0.96 [0.87, 1.07] |
| 10.3 Mixed DHA/EPA/other | 3 | 1184 | Risk Ratio (M‐H, Fixed, 95% CI) | 0.78 [0.51, 1.18] |
| 11 Small‐for‐gestational age/IUGR Show forest plot | 8 | 6907 | Risk Ratio (M‐H, Fixed, 95% CI) | 1.01 [0.90, 1.13] |
| 11.1 DHA/largely DHA | 2 | 3372 | Risk Ratio (M‐H, Fixed, 95% CI) | 0.95 [0.75, 1.20] |
| 11.2 Mixed DHA/EPA | 4 | 2506 | Risk Ratio (M‐H, Fixed, 95% CI) | 1.07 [0.93, 1.23] |
| 11.3 Mixed EPA/DHA/other | 2 | 1029 | Risk Ratio (M‐H, Fixed, 95% CI) | 0.78 [0.50, 1.22] |
| 12 Birthweight (g) Show forest plot | 43 | 11584 | Mean Difference (IV, Random, 95% CI) | 75.69 [37.84, 113.55] |
| 12.1 DHA/largely DHA | 17 | 6121 | Mean Difference (IV, Random, 95% CI) | 52.60 [26.96, 78.23] |
| 12.2 Mixed DHA/EPA | 15 | 4429 | Mean Difference (IV, Random, 95% CI) | 72.72 [6.67, 138.78] |
| 12.3 Mixed DHA/EPA/other | 11 | 1034 | Mean Difference (IV, Random, 95% CI) | 113.65 [12.54, 214.75] |
| Outcome or subgroup title | No. of studies | No. of participants | Statistical method | Effect size |
| 1 Preterm birth (< 37 weeks) Show forest plot | 27 | 10304 | Risk Ratio (M‐H, Fixed, 95% CI) | 0.89 [0.81, 0.97] |
| 1.1 Increased/high risk | 12 | 3702 | Risk Ratio (M‐H, Fixed, 95% CI) | 0.92 [0.83, 1.03] |
| 1.2 Low risk | 10 | 3241 | Risk Ratio (M‐H, Fixed, 95% CI) | 0.92 [0.71, 1.20] |
| 1.3 Any/mixed risk | 5 | 3361 | Risk Ratio (M‐H, Fixed, 95% CI) | 0.71 [0.54, 0.93] |
| 2 Early preterm birth (< 34 weeks) Show forest plot | 10 | 5204 | Risk Ratio (M‐H, Fixed, 95% CI) | 0.58 [0.44, 0.77] |
| 2.1 Increased/high risk | 6 | 2104 | Risk Ratio (M‐H, Fixed, 95% CI) | 0.67 [0.49, 0.93] |
| 2.2 Low risk | 3 | 701 | Risk Ratio (M‐H, Fixed, 95% CI) | 0.31 [0.12, 0.79] |
| 2.3 Any/mixed risk | 1 | 2399 | Risk Ratio (M‐H, Fixed, 95% CI) | 0.48 [0.25, 0.93] |
| 3 Prolonged gestation (> 42 weeks) Show forest plot | 6 | 5141 | Risk Ratio (M‐H, Fixed, 95% CI) | 1.61 [1.11, 2.33] |
| 3.1 Increased/high risk | 1 | 1573 | Risk Ratio (M‐H, Fixed, 95% CI) | 2.39 [1.19, 4.80] |
| 3.2 Low risk | 4 | 1201 | Risk Ratio (M‐H, Fixed, 95% CI) | 1.26 [0.79, 2.01] |
| 3.3 Any/mixed risk | 1 | 2367 | Risk Ratio (M‐H, Fixed, 95% CI) | 2.00 [0.50, 7.97] |
| 4 Pre‐eclampsia (hypertension with proteinuria) Show forest plot | 20 | 8306 | Risk Ratio (M‐H, Fixed, 95% CI) | 0.84 [0.69, 1.01] |
| 4.1 Increased/high risk | 12 | 3564 | Risk Ratio (M‐H, Fixed, 95% CI) | 0.76 [0.59, 0.99] |
| 4.2 Low risk | 5 | 1507 | Risk Ratio (M‐H, Fixed, 95% CI) | 0.59 [0.28, 1.24] |
| 4.3 Any/mixed risk | 3 | 3235 | Risk Ratio (M‐H, Fixed, 95% CI) | 1.01 [0.74, 1.37] |
| 5 Caesarean section Show forest plot | 29 | 8481 | Risk Ratio (M‐H, Fixed, 95% CI) | 0.97 [0.91, 1.03] |
| 5.1 Increased/high risk | 12 | 2046 | Risk Ratio (M‐H, Fixed, 95% CI) | 0.92 [0.80, 1.05] |
| 5.2 Low risk | 14 | 3185 | Risk Ratio (M‐H, Fixed, 95% CI) | 0.99 [0.89, 1.09] |
| 5.3 Any/mixed risk | 3 | 3250 | Risk Ratio (M‐H, Fixed, 95% CI) | 0.98 [0.87, 1.10] |
| 6 Length of gestation (days) Show forest plot | 43 | 12517 | Mean Difference (IV, Random, 95% CI) | 1.67 [0.95, 2.39] |
| 6.1 Increased/high risk | 18 | 3707 | Mean Difference (IV, Random, 95% CI) | 2.17 [0.65, 3.68] |
| 6.2 Low risk | 22 | 4330 | Mean Difference (IV, Random, 95% CI) | 1.41 [0.52, 2.29] |
| 6.3 Any/mixed group | 3 | 4480 | Mean Difference (IV, Random, 95% CI) | 1.27 [‐0.36, 2.91] |
| 7 Perinatal death Show forest plot | 10 | 7416 | Risk Ratio (M‐H, Fixed, 95% CI) | 0.75 [0.54, 1.03] |
| 7.1 Increased/high risk | 6 | 3566 | Risk Ratio (M‐H, Fixed, 95% CI) | 0.84 [0.56, 1.26] |
| 7.2 Low risk | 2 | 1127 | Risk Ratio (M‐H, Fixed, 95% CI) | 0.52 [0.20, 1.33] |
| 7.3 Any/mixed risk | 2 | 2723 | Risk Ratio (M‐H, Fixed, 95% CI) | 0.67 [0.35, 1.26] |
| 8 Stillbirth Show forest plot | 16 | 7880 | Risk Ratio (M‐H, Fixed, 95% CI) | 0.94 [0.62, 1.42] |
| 8.1 Increased/high risk | 9 | 3137 | Risk Ratio (M‐H, Fixed, 95% CI) | 1.06 [0.65, 1.72] |
| 8.2 Low risk | 5 | 2296 | Risk Ratio (M‐H, Fixed, 95% CI) | 1.13 [0.40, 3.23] |
| 8.3 Any/mixed risk | 2 | 2447 | Risk Ratio (M‐H, Fixed, 95% CI) | 0.27 [0.06, 1.27] |
| 9 Neonatal death Show forest plot | 9 | 7448 | Risk Ratio (M‐H, Fixed, 95% CI) | 0.61 [0.34, 1.11] |
| 9.1 Increased/high risk | 4 | 2889 | Risk Ratio (M‐H, Fixed, 95% CI) | 0.78 [0.34, 1.78] |
| 9.2 Low risk | 3 | 1424 | Risk Ratio (M‐H, Fixed, 95% CI) | 0.52 [0.19, 1.45] |
| 9.3 Any/mixed risk | 2 | 3135 | Risk Ratio (M‐H, Fixed, 95% CI) | 0.40 [0.08, 2.07] |
| 10 Low birthweight (< 2500 g) Show forest plot | 15 | 8449 | Risk Ratio (M‐H, Fixed, 95% CI) | 0.90 [0.82, 0.99] |
| 10.1 Increased/high risk | 7 | 4081 | Risk Ratio (M‐H, Fixed, 95% CI) | 0.96 [0.87, 1.07] |
| 10.2 Low risk | 6 | 1869 | Risk Ratio (M‐H, Fixed, 95% CI) | 0.73 [0.52, 1.02] |
| 10.3 Any/mixed risk | 2 | 2499 | Risk Ratio (M‐H, Fixed, 95% CI) | 0.63 [0.44, 0.92] |
| 11 Small‐for‐gestational age/IUGR Show forest plot | 8 | 6907 | Risk Ratio (M‐H, Fixed, 95% CI) | 1.01 [0.90, 1.13] |
| 11.1 Increased/high risk | 6 | 3535 | Risk Ratio (M‐H, Fixed, 95% CI) | 1.03 [0.90, 1.18] |
| 11.2 Low risk | 1 | 973 | Risk Ratio (M‐H, Fixed, 95% CI) | 1.04 [0.73, 1.48] |
| 11.3 Any/mixed risk | 1 | 2399 | Risk Ratio (M‐H, Fixed, 95% CI) | 0.89 [0.66, 1.21] |
| 12 Birthweight (g) Show forest plot | 43 | 11584 | Mean Difference (IV, Random, 95% CI) | 75.69 [37.84, 113.55] |
| 12.1 Increased/high risk | 19 | 4848 | Mean Difference (IV, Random, 95% CI) | 105.52 [30.84, 180.21] |
| 12.2 Low risk | 23 | 4337 | Mean Difference (IV, Random, 95% CI) | 46.63 [13.90, 79.36] |
| 12.3 Any/mixed group | 1 | 2399 | Mean Difference (IV, Random, 95% CI) | 68.0 [22.38, 113.62] |
| Outcome or subgroup title | No. of studies | No. of participants | Statistical method | Effect size |
| 1 Early preterm birth < 34 weeks Show forest plot | 1 | 224 | Risk Ratio (M‐H, Fixed, 95% CI) | 0.91 [0.13, 6.38] |
| 2 Prolonged gestation > 42 weeks Show forest plot | 1 | 224 | Risk Ratio (M‐H, Fixed, 95% CI) | 0.91 [0.06, 14.44] |
| 3 Pre‐eclampsia Show forest plot | 1 | 224 | Risk Ratio (M‐H, Fixed, 95% CI) | 0.91 [0.06, 14.44] |
| 4 Induction (post‐term) Show forest plot | 1 | 224 | Risk Ratio (M‐H, Fixed, 95% CI) | 0.10 [0.01, 1.87] |
| 5 PROM Show forest plot | 1 | 224 | Risk Ratio (M‐H, Fixed, 95% CI) | 0.30 [0.03, 2.89] |
| 6 PPROM Show forest plot | 1 | 224 | Risk Ratio (M‐H, Fixed, 95% CI) | 1.22 [0.28, 5.32] |
| 7 Length of gestation Show forest plot | 2 | 1474 | Mean Difference (IV, Fixed, 95% CI) | 0.24 [‐1.16, 1.64] |
| 8 Birthweight (g) Show forest plot | 1 | 224 | Mean Difference (IV, Fixed, 95% CI) | ‐110.35 [‐242.80, 22.10] |
| 9 Length at birth (cm) Show forest plot | 1 | 224 | Mean Difference (IV, Fixed, 95% CI) | 0.05 [‐0.80, 0.90] |
| 10 Head circumference at birth (cm) Show forest plot | 1 | 224 | Mean Difference (IV, Fixed, 95% CI) | ‐0.24 [‐0.87, 0.39] |
| Outcome or subgroup title | No. of studies | No. of participants | Statistical method | Effect size |
| 1 Gestational diabetes Show forest plot | 2 | Risk Ratio (M‐H, Fixed, 95% CI) | Subtotals only | |
| 1.1 DHA versus EPA | 1 | 77 | Risk Ratio (M‐H, Fixed, 95% CI) | 0.15 [0.02, 1.14] |
| 1.2 DHA versus DHA/AA | 1 | 86 | Risk Ratio (M‐H, Fixed, 95% CI) | 0.33 [0.01, 7.96] |
| 2 Caesarean section Show forest plot | 1 | 77 | Risk Ratio (M‐H, Fixed, 95% CI) | 1.23 [0.61, 2.51] |
| 2.1 DHA versus EPA | 1 | 77 | Risk Ratio (M‐H, Fixed, 95% CI) | 1.23 [0.61, 2.51] |
| 3 Adverse events: cessation Show forest plot | 1 | Risk Ratio (M‐H, Fixed, 95% CI) | Subtotals only | |
| 3.1 DHA versus EPA | 1 | 77 | Risk Ratio (M‐H, Fixed, 95% CI) | 0.82 [0.24, 2.83] |
| 4 Pre‐eclampsia Show forest plot | 1 | 77 | Risk Ratio (M‐H, Fixed, 95% CI) | 0.26 [0.06, 1.13] |
| 4.1 DHA versus EPA | 1 | 77 | Risk Ratio (M‐H, Fixed, 95% CI) | 0.26 [0.06, 1.13] |
| 5 Blood loss at birth (mL) Show forest plot | 1 | 77 | Mean Difference (IV, Fixed, 95% CI) | 1.0 [‐181.94, 183.94] |
| 5.1 DHA versus EPA | 1 | 77 | Mean Difference (IV, Fixed, 95% CI) | 1.0 [‐181.94, 183.94] |
| 6 Depressive symptoms postpartum: thresholds Show forest plot | 1 | Risk Ratio (M‐H, Fixed, 95% CI) | Subtotals only | |
| 6.1 Major depressive disorder at 6‐8 weeks | 1 | 77 | Risk Ratio (M‐H, Fixed, 95% CI) | 0.68 [0.12, 3.87] |
| 7 Depressive symptoms postpartum: scores Show forest plot | 1 | Mean Difference (IV, Fixed, 95% CI) | Subtotals only | |
| 7.1 BDI: 6‐8 weeks postpartum | 1 | 77 | Mean Difference (IV, Fixed, 95% CI) | ‐1.40 [‐3.75, 0.95] |
| 8 Length of gestation (days) Show forest plot | 3 | Mean Difference (IV, Fixed, 95% CI) | Subtotals only | |
| 8.1 DHA versus EPA | 1 | 77 | Mean Difference (IV, Fixed, 95% CI) | 9.10 [5.24, 12.96] |
| 8.2 EPA/DHA vs ALA | 1 | 1250 | Mean Difference (IV, Fixed, 95% CI) | ‐0.29 [‐2.33, 1.75] |
| 8.3 DHA versus DHA/AA | 1 | 83 | Mean Difference (IV, Fixed, 95% CI) | 0.0 [‐3.31, 3.31] |
| 9 Baby admitted to neonatal care Show forest plot | 1 | 78 | Risk Ratio (M‐H, Fixed, 95% CI) | 0.35 [0.08, 1.63] |
| 9.1 DHA versus EPA | 1 | 78 | Risk Ratio (M‐H, Fixed, 95% CI) | 0.35 [0.08, 1.63] |
| 10 Birthweight (g) Show forest plot | 2 | Mean Difference (IV, Fixed, 95% CI) | Subtotals only | |
| 10.1 DHA versus EPA | 1 | 78 | Mean Difference (IV, Fixed, 95% CI) | 372.0 [151.90, 592.10] |
| 10.2 DHA versus DHA/AA | 1 | 83 | Mean Difference (IV, Fixed, 95% CI) | ‐79.0 [‐260.22, 102.22] |
| 11 Infant weight (kg) Show forest plot | 1 | Mean Difference (IV, Fixed, 95% CI) | Subtotals only | |
| 11.1 DHA versus DHA/AA | 1 | 80 | Mean Difference (IV, Fixed, 95% CI) | ‐0.20 [‐0.79, 0.39] |
| 12 Infant height (cm) Show forest plot | 1 | Mean Difference (IV, Fixed, 95% CI) | Subtotals only | |
| 12.1 DHA versus DHA/AA | 1 | 80 | Mean Difference (IV, Fixed, 95% CI) | ‐0.80 [‐2.50, 0.90] |
| 13 Infant head circumference (cm) Show forest plot | 1 | Mean Difference (IV, Fixed, 95% CI) | Subtotals only | |
| 13.1 At 18 months | 1 | 80 | Mean Difference (IV, Fixed, 95% CI) | 0.10 [‐0.45, 0.65] |
| 14 Cognition: Scores Show forest plot | 1 | Mean Difference (IV, Fixed, 95% CI) | Subtotals only | |
| 14.1 DHA versus DHA/AA: BSID II | 1 | 80 | Mean Difference (IV, Fixed, 95% CI) | 0.90 [‐4.71, 6.51] |
| 15 Motor: Scores Show forest plot | 1 | Mean Difference (IV, Fixed, 95% CI) | Subtotals only | |
| 15.1 DHA versus DHA/AA: BSID II | 1 | 79 | Mean Difference (IV, Fixed, 95% CI) | 3.40 [‐1.07, 7.87] |
| 16 Neurodevelopment Show forest plot | 1 | Risk Ratio (M‐H, Fixed, 95% CI) | Subtotals only | |
| 16.1 DHA versus DHA/AA: neonatal neurological classification: mildly/definitely abnormal at 2 weeks | 1 | 67 | Risk Ratio (M‐H, Fixed, 95% CI) | 0.73 [0.28, 1.87] |
| 16.2 DHA versus DHA/AA: general movement quality: mildly/definitely abnormal at 2 weeks | 1 | 67 | Risk Ratio (M‐H, Fixed, 95% CI) | 1.08 [0.68, 1.72] |
| 16.3 DHA versus DHA/AA: general movement quality: mildly/definitely abnormal at 12 weeks | 1 | 83 | Risk Ratio (M‐H, Fixed, 95% CI) | 1.81 [1.11, 2.95] |
| 17 Cerebral palsy Show forest plot | 1 | Risk Ratio (M‐H, Fixed, 95% CI) | Subtotals only | |
| 17.1 DHA versus DHA/AA | 1 | 80 | Risk Ratio (M‐H, Fixed, 95% CI) | 0.0 [0.0, 0.0] |
| Outcome or subgroup title | No. of studies | No. of participants | Statistical method | Effect size |
| 1 Preterm birth (< 37 weeks) Show forest plot | 12 | 6718 | Risk Ratio (M‐H, Fixed, 95% CI) | 0.92 [0.83, 1.02] |
| 2 Early preterm birth (< 34 weeks) Show forest plot | 6 | 4073 | Risk Ratio (M‐H, Fixed, 95% CI) | 0.61 [0.46, 0.82] |
| 3 Prolonged gestation (> 42 weeks) Show forest plot | 3 | 4285 | Risk Ratio (M‐H, Fixed, 95% CI) | 2.32 [1.26, 4.28] |
| 4 Pre‐eclampsia (hypertension with proteinuria) Show forest plot | 12 | 6104 | Risk Ratio (M‐H, Fixed, 95% CI) | 1.00 [0.81, 1.25] |
| 5 Caesarean section Show forest plot | 12 | 5239 | Risk Ratio (M‐H, Fixed, 95% CI) | 0.96 [0.89, 1.04] |
| 6 Length of gestation (days) Show forest plot | 16 | 6313 | Mean Difference (IV, Fixed, 95% CI) | 1.42 [0.73, 2.11] |
| 7 Perinatal death Show forest plot | 5 | 4610 | Risk Ratio (M‐H, Fixed, 95% CI) | 0.60 [0.37, 0.97] |
| 8 Stillbirth Show forest plot | 10 | 6193 | Risk Ratio (M‐H, Fixed, 95% CI) | 0.80 [0.49, 1.31] |
| 9 Neonatal death Show forest plot | 6 | 4791 | Risk Ratio (M‐H, Fixed, 95% CI) | 0.56 [0.25, 1.27] |
| 10 Low birthweight (< 2500 g) Show forest plot | 10 | 6839 | Risk Ratio (M‐H, Random, 95% CI) | 0.87 [0.73, 1.04] |
| 11 Small‐for‐gestational age/IUGR Show forest plot | 6 | 5874 | Risk Ratio (M‐H, Fixed, 95% CI) | 1.03 [0.91, 1.16] |
| 12 Birthweight (g) Show forest plot | 18 | 7382 | Mean Difference (IV, Fixed, 95% CI) | 48.84 [22.93, 74.76] |