Ácidos grasos omega 3 durante el embarazo
Resumen
Antecedentes
El mayor consumo de alimentos con ácidos grasos poliinsaturados de cadena larga omega 3 (LCPUFA), como los pescados, durante el embarazo se ha asociado con gestaciones más prolongadas y mejores resultados perinatales. Ésta es una actualización de una revisión publicada por primera vez en 2006.
Objetivos
Evaluar los efectos de AGPICL omega 3, como suplementos o agregados a los alimentos, durante el embarazo en los resultados maternos, perinatales y neonatales y a más largo plazo para la madre y el niño.
Métodos de búsqueda
Para esta actualización, se hicieron búsquedas el registro de ensayos del Grupo Cochrane de Embarazo y Parto (Cochrane Pregnancy and Childbirth’s Trials Register) ClinicalTrials.gov, en la WHO International Clinical Trials Registry Platform (ICTRP) (16 de agosto de 2018) y en listas de referencias de estudios recuperados.
Criterios de selección
Ensayos controlados aleatorios (ECA) que compararon ácidos grasos omega 3 (como suplementos o alimentos, intervenciones independientes o con una cointervención) durante el embarazo con placebo o ningún omega 3, y los estudios o brazos de estudio que compararon directamente dosis o tipos de AGPICL omega 3. Fueron elegibles para inclusión los ensayos publicados en forma de resumen.
Obtención y análisis de los datos
Dos autores de la revisión, de forma independiente, evaluaron la elegibilidad de los estudios, extrajeron los datos, evaluaron el riesgo de sesgo en los ensayos y la calidad de la evidencia para los resultados predefinidos de parto/lactante, maternos, niño/adulto y de los servicios de salud con el uso del enfoque GRADE.
Resultados principales
En esta actualización se incluyeron 70 ECA (con 19 927 pacientes con riesgo bajo, mixto o alto de resultados deficientes del embarazo) que compararon intervenciones con AGPICL omega 3 (suplementos y alimentos) versus placebo o ningún omega 3. El riesgo general de sesgo a nivel de estudio fue mixto, con riesgo de selección y de realización principalmente bajo, pero hubo un alto riesgo de sesgo de desgaste en algunos ensayos. La mayoría de los ensayos se realizaron en países de ingresos medios‐altos o altos; y casi la mitad de los ensayos incluyeron pacientes con riesgo mayor/alto de factores que podrían aumentar el riesgo de resultados adversos maternos y del parto.
El parto prematuro < 37 semanas (13,4% versus 11,9%; cociente de riesgos [CR] 0,89; intervalo de confianza [IC] del 95%: 0,81 a 0,97; 26 ECA, 10 304 participantes; evidencia de alta calidad) y el parto prematuro temprano< 34 semanas (4,6% versus 2,7%; CR 0,58; IC del 95%: 0,44 a 0,77; nueve ECA, 5204 participantes; evidencia de alta calidad) fueron menos frecuentes en las pacientes que recibieron AGPICL omega 3 en comparación con ningún omega 3. El embarazo prolongado > 42 semanas probablemente aumentó del 1,6% al 2,6% en las pacientes que recibieron AGPICL omega 3 en comparación con ningún omega 3 (CR 1,61; IC del 95%: 1,11 a 2,33; 5141 participantes; seis ECA; evidencia de calidad moderada).
En los lactantes, posiblemente se redujo el riesgo de muerte perinatal (CR 0,75; IC del 95%: 0,54 a 1,03; diez ECA, 7416 participantes; evidencia de calidad moderada: 62/3715 versus 83/3701 lactantes) y hubo menos ingresos a cuidados neonatales (CR 0,92; IC del 95%: 0,83 a 1,03; nueve ECA, 6920 participantes; evidencia de calidad moderada ‐ 483/3475 lactantes versus 519/3445 lactantes). Fue menor el riesgo de recién nacidos conbajo peso al nacer (BPN) (15,6% versus 14%; CR 0,90; IC del 95%: 0,82 a 0,99; 15 ensayos, 8449 participantes; evidencia de alta calidad); pero hubo un pequeño aumento posible de recién nacidos grandes para la edad gestacional (GEG) (CR 1,15; IC del 95%: 0,97 a 1,36; (seis ECA, 3722 participantes; evidencia de calidad moderada, para AGPICL omega 3 en comparación con ningún omega 3. Se observó poca o ninguna diferencia en pequeño para la edad gestacional o retraso del crecimiento uterino (CR 1,01; IC del 95%: 0,90 a 1,13; ocho ECA, 6907 participantes; evidencia de calidad moderada).
En el caso de los resultados maternos, no hubo evidencia suficiente para determinar los efectos de los omega 3 en la inducción postérmino (CR promedio 0,82; IC del 95%: 0,22 a 2,98; tres ensayos, 2900 participantes; evidencia de baja calidad), eventos adversos maternos graves (CR 1,04; IC del 95%: 0,40 a 2,72; dos ensayos, 2690 participantes; evidencia de baja calidad), ingreso de la madre a la unidad de cuidados intensivos (CR 0,56; IC del 95%: 0,12 a 2,63; dos ensayos, 2458 participantes; evidencia de baja calidad), o depresión posparto (CR promedio 0,99; IC del 95%: 0,56 a 1,77; dos ensayos, 2431 participantes; evidencia de baja calidad). La media de la duración del embarazo fue mayor en las pacientes que recibieron AGPICL omega 3 (diferencia de medias [DM] 1,67 días; IC del 95%: 0,95 a 2,39; 41 ensayos, 12 517 participantes; evidencia de calidad moderada), y es posible que la preeclampsia se reduzca con AGPICL omega 3 (CR 0,84; IC del 95%: 0,69 a 1,01; 20 ensayos, 8306 participantes; evidencia de baja calidad).
En los resultados del niño/adulto se observaron muy pocas diferencias entre la administración prenatal de suplementos de AGPICL omega 3 y ningún omega 3 en la cognición, el CI, la visión, otros resultados del desarrollo neurológico y el crecimiento, el lenguaje y el comportamiento(por lo general evidencia de baja a muy baja calidad). No estuvo claro el efecto de AGPICL omega 3 sobre el índice de masa corporal a los 19 años (DM 0; IC del 95%: ‐0,83 a 0,83; un ensayo, 243 participantes; evidencia de muy baja calidad). No se informaron datos del desarrollo de diabetes en los niños de las participantes de los estudios.
Conclusiones de los autores
En el análisis general, el parto prematuro < 37 semanas y el parto prematuro temprano < 34 semanas se redujeron en las pacientes que recibieron AGPICL omega 3 en comparación con ningún omega 3. Posiblemente hubo una reducción en el riesgo de muerte perinatal y de ingreso a cuidados neonatales y una reducción en el riesgo de recién nacidos conBPN; y posiblemente un ligero aumento en el riesgo de recién nacidos GEG con AGPICL omega 3.
En las evaluaciones de calidad GRADE, la evidencia de la mayoría de los resultados perinatales importantes se consideró de alta calidad (p.ej., parto prematuro) o de calidad moderada (p.ej., muerte perinatal). En los otros dominios de resultados (resultados maternos, del niño/adulto y de los servicios de salud), las calificaciones GRADE variaron de moderada a muy baja, y más de la mitad obtuvo una calificación baja. Los motivos para disminuir la calificación de la calidad en el dominio se debieron principalmente a las limitaciones en el diseño y la imprecisión.
Los suplementos de AGPICL omega 3 durante el embarazo son una estrategia efectiva para reducir la incidencia de parto prematuro, aunque probablemente aumenta la incidencia de embarazos postérmino. En este momento no se necesitan más estudios que comparen AGPICL omega 3 y placebo (para establecer la causalidad con relación al parto prematuro). Falta el informe de 23 ensayos en curso adicionales sobre más de 5000 pacientes, por lo que no se necesitan más ECA que comparen AGPICL omega 3 con placebo o ninguna intervención. Sin embargo, se necesita un seguimiento adicional de los ensayos finalizados para evaluar los resultados a más largo plazo de la madre y el niño, y así mejorar la comprensión de las vías metabólicas, del crecimiento y del desarrollo neurológico en particular y para establecer si, y cómo, los resultados varían según los distintos tipos de AGPICL omega 3, el momento de administración y las dosis; o según las características de las pacientes.
PICO
Resumen en términos sencillos
Ácidos grasos omega 3 durante el embarazo
¿Cuál es el problema?
¿Los ácidos grasos poliinsaturados de cadena larga (AGPICL) omega 3 tomados durante el embarazo (en suplementos o agregados a alimentos, como algunos tipos de pescado) mejoran los resultados de salud de los recién nacidos y las madres? Ésta es una actualización de una revisión Cochrane publicada por primera vez en el 2006.
¿Por qué es esto importante?
El parto prematuro (el parto del feto antes de las 37 semanas de gestación) es una causa principal de discapacidad o muerte en los primeros cinco años de vida. El pescado y el aceite de pescado contienen AGPICL omega 3 (especialmente, ácido docosahexaenoico [DHA] y ácido eicosapentanoico [EPA]) y se han asociado a embarazos más prolongados. Por lo tanto, se indica que los AGPICL omega 3 adicionales durante el embarazo pueden reducir el número de recién nacidos prematuros y pueden mejorar los resultados de los niños y las madres. Sin embargo, muchas embarazadas ingieren pescado con escasa frecuencia. La salud de los recién nacidos y las madres se puede mejorar si se estimula a las embarazadas a que consuman pescados grasos (que en general contienen niveles bajos de toxinas) o suplementos de AGPICL omega 3. Ésta es una actualización de una revisión Cochrane publicada por primera vez en el 2006.
¿Qué evidencia se encontró?
Se buscó evidencia en agosto de 2018 y se encontraron 70 ensayos controlados aleatorios (ECA); este tipo de ensayo aporta los resultados más confiables) (con 19 927 pacientes). La mayoría de los ensayos evaluaron un grupo de pacientes que recibieron AGPICL omega 3 y lo compararon con un grupo de pacientes que recibieron una sustancia que se parecía a un AGPICL omega 3 pero que no lo contenía (placebo) o no recibieron omega 3. Los ensayos se realizaron principalmente en países de ingresos medios‐altos o altos. Algunos estudios incorporaron pacientes con un mayor riesgo de parto prematuro. La calidad de la evidencia de los estudios incluidos varió de alta a muy baja; este hecho afectó la certeza de los resultados para diferentes hallazgos.
Se encontró que la incidencia de parto prematuro (antes de las 37 semanas) y de parto muy prematuro (antes de las 34 semanas) fue menor en las pacientes que recibieron AGPICL omega 3 en comparación con ningún omega 3 adicional. También hubo menos recién nacidos con bajo peso al nacer. Sin embargo, probablemente el AGPICL omega 3 aumentó la incidencia de embarazos que se extendieron más allá de las 42 semanas, aunque no se identificaron diferencias en la inducción del trabajo de parto de los embarazos postérmino. El riesgo de que el recién nacido muera o presente un cuadro grave y sea ingresado a cuidados intensivos neonatales puede ser menor con el AGPICL omega 3 en comparación con ningún omega 3. No se observaron diferencias entre los grupos en cuanto a los eventos adversos graves de las madres ni en la depresión posnatal. Se observaron muy pocas diferencias entre los grupos de AGPICL omega 3 y ningún omega 3 en el desarrollo y el crecimiento del niño.
Once ensayos informaron que habían recibido financiación de la industria. Cuando se quitaron estos ensayos de los resultados principales (como parto prematuro y parto muy prematuro), los resultados mostraron muy poca o ninguna diferencia.
¿Qué significa esto?
Una mayor ingesta de AGPICL omega 3 durante el embarazo, en forma de suplementos o con los alimentos, puede reducir la incidencia de parto prematuro (antes de las 37 semanas y antes de las 34 semanas) y es menos probable que el recién nacido tenga un bajo peso al nacer. Es más probable que los embarazos sean más prolongados en las pacientes que toman suplementos de AGPICL omega 3 durante el embarazo. Se realizan más estudios y sus resultados se incluirán en una actualización adicional de esta revisión. Los estudios futuros podrían considerar si los resultados pueden variar en poblaciones diferentes de pacientes (y de ser así, cómo) y podrían analizar diferentes maneras de aumentar el consumo de AGPICL omega 3 durante el embarazo.
Conclusiones de los autores
Summary of findings
| Omega‐3 LCPUFA compared with no omega‐3 during pregnancy: birth/infant outcomes | ||||||
| Population: pregnant women and their babies Settings: Angola (1 RCT), Australia (1 RCT), Belgium (1 RCT), Canada (1 RCT), Chile (1 RCT), Croatia (1 RCT), Chile (1 RCT), Denmark (3 RCTs), Egypt (1 RCT), Germany (2 RCTs), India (1 RCT), Iran (3 RCTs), Italy (1 RCT), Mexico (1 RCT), Netherlands (3 RCTs), Norway (1 RCT), Russia (1 RCT), Sweden (1 RCT), Turkey (1 RCT), UK (4 RCTs), USA (8 RCTs) Intervention: omega 3 Comparison: no omega‐3 | ||||||
| Outcomes | Illustrative comparative risks* (95% CI) | Relative effect | No of participants | Quality of the evidence | Comments | |
| Assumed risk | Corresponding risk | |||||
| Risk with no omega‐3 | Risk with omega‐3 | |||||
| Preterm birth < 37 weeks | 134/1000 | 119 per 1000 (109 to 130) | RR 0.89 (0.81 to 0.97) | 10,304 (26 RCTs) | ⊕⊕⊕⊕ HIGH1 | |
| Early preterm birth < 34 weeks | 46/1000 | 27 per 1000 (20 to 35) | RR 0.58 (0.44 to 0.77) | 5204 (9 RCTs) | ⊕⊕⊕⊕ HIGH2 | |
| Perinatal death | 20/1000 | 15 per 1000 (11 to 21) | RR 0.75 (0.54 to 1.03) | 7416 (10 RCTs) | ⊕⊕⊕⊝ MODERATE3 | |
| SGA/IUGR | 129/1000 | 130 per 1000 (116 to 146) | RR 1.01 (0.90 to 1.13) | 6907 (8 RCTs) | ⊕⊕⊕⊝ MODERATE3 | |
| LBW | 156/1000 | 140 (128 to 154) | RR 0.90 (0.82 to 0.99) | 8449 (15 RCTs) | ⊕⊕⊕⊕ HIGH | |
| LGA | 117/1000 | 134 per 1000 (113 to 159) | RR 1.15 (0.97 to 1.36) | 3722 (6 RCTs) | ⊕⊕⊕⊝ MODERATE4 | |
| Serious adverse events for neonate/infant | 63/1000 | 45 per 1000 (37 to 62) | RR 0.72 (0.53 to 0.99) | 2690 (2 RCTs) | ⊕⊕⊝⊝ low:5 | |
| *The basis for the assumed risk (e.g. the median control group risk across studies) is provided in footnotes. The corresponding risk (and its 95% confidence interval) is based on the assumed risk in the comparison group and the relative effect of the intervention (and its 95% CI). | ||||||
| GRADE Working Group grades of evidence | ||||||
| 1 Design limitations: larger studies of high quality, but some smaller studies with unclear risk of selective reporting and some smaller studies with unclear or high attrition bias at the time of birth (not downgraded for study limitations) 2 Design limitations: larger studies of higher quality, but several studies with unclear or high attrition bias at the time of birth, or baseline imbalances (not downgraded for study limitations) 3 Imprecision (‐1): downgraded one level due to crossing line of no effect and/or wide confidence intervals 4 Imprecision (‐1): downgraded one level due to wide confidence intervals 5 Design limitations (‐2): downgraded two levels; one study with unclear allocation concealment and attrition bias; specific adverse events not detailed in this study | ||||||
| Omega‐3 LCPUFA compared with no omega‐3 during pregnancy: maternal outcomes | ||||||
| Population: pregnant women Settings: Angola (1 RCT), Australia (2 RCTs), Belgium (1 RCT), Brazil (1 RCT), Chile (1 RCT), Croatia (1 RCT), Denmark (3 RCTs), Egypt (1 RCT), Germany (3 RCTs), Hungary (1 RCT), Iran (5 RCTs), India (1 RCT), Italy (2 RCTs), Mexico (1 RCT), Netherlands (4 RCTs), Norway (2 RCTs), Russia (1 RCT), Scotland (2 RCTs), Spain (4 RCTs) Sweden (2 RCTs), Turkey (1 RCT), UK (3 RCTs) USA (12 RCTs), Venezuela (1 RCT) Intervention: omega‐3 Comparison: no omega‐3 | ||||||
| Outcomes | Illustrative comparative risks* (95% CI) | Relative effect | No of participants | Quality of the evidence | Comments | |
| Assumed risk | Corresponding risk | |||||
| Risk with no omega‐3 | Risk with omega‐3 | |||||
| Prolonged gestation > 42 weeks | 16/1000 | 26/1000 (18 to 37) | RR 1.61 (1.11 to 2.33) | 5141 (6) | ⊕⊕⊕⊝ MODERATE6 | |
| Induction post‐term | 83/1000 | 68/1000 (18 to 247) | Average RR 0.82 (0.22 to 2.98) | 2900 (3) | ⊕⊕⊝⊝ LOW7 | |
| Pre‐eclampsia | 53/1000 | 44/1000 (37 to 53) | RR 0.84 (0.69 to 1.01) | 8306 (20) | ⊕⊕⊝⊝ LOW7 | Defined as hypertension with proteinuria |
| Gestational length | The mean gestational age in the intervention group was 1.67 days greater (0.95 greater to 2.39 days greater) | Average MD 1.67 days (0.95 to 2.39) | 12,517 (41) | ⊕⊕⊕⊝ MODERATE8 | ||
| Maternal serious adverse events | 6/1000 | 6/1000 (2 to 16) | RR 1.04 (0.40 to 2.72) | 2690 (2) | ⊕⊕⊝⊝ LOW9 | |
| Maternal admission to intensive care | 1/1000 | 1/1000 (0 to 3) | RR 0.56 (0.12 to 2.63) | 2458 (2) | ⊕⊕⊝⊝ LOW9 | |
| Postnatal depression | 112/1000 | 100 (80 to 125) | Average RR 0.99 (0.56 to 1.77) | 2431 (2) | ⊕⊕⊝⊝ LOW10 | |
| *The basis for the assumed risk (e.g. the median control group risk across studies) is provided in footnotes. The corresponding risk (and its 95% confidence interval) is based on the assumed risk in the comparison group and the relative effect of the intervention (and its 95% CI). | ||||||
| GRADE Working Group grades of evidence | ||||||
| 6 Design limitations (‐1): downgraded one level due to some studies with attrition bias and some selective reporting bias; and some imprecision (not downgraded) 7 Design limitations (‐1): downgraded one level for combined study limitations (mostly attrition bias and selective reporting bias); Imprecision (‐1): downgraded one level due to confidence intervals including line of no effect 8 Design limitations (‐1): downgraded one level for study limitations (mainly attrition bias): heterogeneity I2 = 54%, but not downgraded due to use of a random‐effects model 9 Imprecision (‐2): downgraded two levels for wide confidence intervals and only 2 studies 10 Design limitations (‐1): downgraded one level for study limitations (unclear randomisation in 1 study); downgraded one level for imprecision (wide confidence intervals; 2 studies only) | ||||||
| Omega‐3 LCPUFA compared with no omega‐3 during pregnancy: child/adult outcomes | ||||||
| Population: children of women randomised to omega‐3 or no omega‐3 during pregnancy Settings: Australia (2 RCTs), Bangladesh (1 RCT), Canada (1 RCT), Denmark (1 RCT), Hungary (1 RCT), Germany (1 RCT), Spain (2 RCTs), Mexico (1 RCT), Netherlands (1 RCT) Intervention: omega‐3 Comparison: no omega‐3 | ||||||
| Outcomes | Illustrative comparative risks* (95% CI) | Relative effect | No of participants | Quality of the evidence | Comments | |
| Assumed risk | Corresponding risk | |||||
| Risk with no omega‐3 | Risk with omega‐3 | |||||
| Cognition: BSID II score at < 24 months | The mean BSID II score at 24 months in the intervention group was 0.37 points lower in the intervention group (1.47 lower to 0.76 higher) | MD ‐0.37 (‐1.49 to 0.76) | 1154 (4) | ⊕⊕⊝⊝ LOW11 | ||
| Cognition: BSID III score at < 24 months | The mean BSID III score at 24 months in the intervention group was 0.04 points higher (1.59 lower to 1.68 higher) | MD 0.04 (‐1.59 to 1.68) | 809 (2) | ⊕⊕⊝⊝ LOW12 | ||
| IQ: WASI at 7 years | The mean WASI at 7 years in the intervention group was identical to the mean in the control group (0.79 points lower to 2.79 higher) | MD 1.00 (‐0.79 to 2.79) | 543 (1) | ⊕⊕⊝⊝ LOW12 | ||
| IQ: WISC‐IV at 12 years | The WISC‐IV at 12 years in the intervention group was identical to in the control group (5.16 points lower to 7.16 higher) | MD 1.00 (‐5.16 to 7.16) | 50 (1) | ⊕⊝⊝⊝ VERY LOW13 | ||
| Behaviour: BSID III adaptive behaviour score at 12‐18 months | The mean BSID III adaptive behaviour score in the intervention group at 12‐18 months was 1.20 points lower (3.12 lower to 0.72 higher) | MD ‐1.20 (‐3.12 to 0.72) | 809 (2) | ⊕⊕⊝⊝ LOW14 | At 12 months (one study), 18 months (one study) | |
| Behaviour: SDQ Total Difficulties at 7 years | The mean SDQ total difficulties score at 7 years in the intervention group was 1.08 higher (0.18 higher to 1.98 higher) | MD 1.08 (0.18 to 1.98) | 543 (1) | ⊕⊕⊝⊝ LOW12 | ||
| BMI at 19 years | The mean BMI at 19 years in the intervention group was identical to that in the control group (0.83 lower to 0.83 higher) | MD 0 (‐0.83 to 0.83) | 243 (1) | ⊕⊝⊝⊝ VERY LOW15 | ||
| Diabetes | Not reported | |||||
| *The basis for the assumed risk (e.g. the median control group risk across studies) is provided in footnotes. The corresponding risk (and its 95% confidence interval) is based on the assumed risk in the comparison group and the relative effect of the intervention (and its 95% CI). | ||||||
| GRADE Working Group grades of evidence | ||||||
| 11 Design limitations (‐1): downgraded one level due to unclear randomisation in 3 studies (that contributed 40% to meta‐analysis) and some studies at high risk of attrition bias; Imprecision (‐1): downgraded one level for wide confidence intervals including line of no effect 12 Imprecision (‐2): downgraded one level for confidence intervals including line of no effect; and one level for small number of studies/single study 13 Design limitations (‐1): downgraded one level for unclear selection bias (not clear if random sequence generated), possible attrition and/or reporting bias; Imprecision (‐2): downgraded two levels for wide confidence intervals including line of no effect and 1 study with small number of participants 14 Design limitations (‐1): downgraded one level for unclear randomisation (possible lack of allocation concealment), possible attrition and/or selective bias in 1 of the trials (contributing 15% to analysis); Imprecision (‐1): downgraded one level for confidence intervals including line of no effect and few studies Design limitations (‐1): downgraded one level for unclear sequence generation and unclear blinding: Imprecision (‐2): downgraded two levels for confidence intervals including line of no effect and 1 study with small number of participants | ||||||
| Omega‐3 compared with no omega‐3 during pregnancy: health services outcomes | ||||||
| Population: pregnant women and their infants Settings: Australia (1 RCT), Belgium (1 RCT), Denmark (2 RCTs), Egypt (1), Iran (2 RCTs), Italy (1 RCT), Netherlands (1 RCT), Norway (1 RCT), Russia (1 RCT), Scotland (1 RCT), UK (1 RCT), USA (5 RCTs) Intervention: omega‐3 Comparison: no omega‐3 | ||||||
| Outcomes | Illustrative comparative risks* (95% CI) | Relative effect | No of participants | Quality of the evidence | Comments | |
| Assumed risk | Corresponding risk | |||||
| no omega‐3 | omega‐3 | |||||
| Maternal hospital admission (antenatal) | 273/1000 | 251/1000 (221 to 284) | RR 0.92 (0.81 to 1.04) | 2876 (5) | ⊕⊕⊝⊝ LOW 16 | |
| Infant admission to neonatal care | 151/1000 | 139/1000 (125 to 156) | RR 0.92 (0.83 to 1.03) | 6920 (9) | ⊕⊕⊕⊝ MODERATE 17 | |
| Maternal length of hospital stay (days) | The mean length of stay in the intervention group was 0.18 days greater (0.20 less to 0.57 days greater) | MD 0.18 (‐0.20 to 0.57) | 2290 (2) | ⊕⊕⊝⊝ LOW 8 | ||
| Infant length of hospital stay (days) | The mean length of stay in the intervention group was 0.11 days greater (1.40 less to 1.62 days greater) | MD 0.11 (‐1.40 to 1.62) | 2041 (1) | ⊕⊕⊝⊝ LOW 8 | ||
| Costs | Not reported | |||||
| *The basis for the assumed risk (e.g. the median control group risk across studies) is provided in footnotes. The corresponding risk (and its 95% confidence interval) is based on the assumed risk in the comparison group and the relative effect of the intervention (and its 95% CI). | ||||||
| GRADE Working Group grades of evidence | ||||||
| 16 Design limitations (‐1): downgraded one level due to some studies with possible risk of attrition bias; Imprecision (‐1): downgraded one level for confidence intervals including line of no effect 17 Imprecision (‐1): downgraded one level for confidence intervals including line of no effect 18 Imprecision (‐2): downgraded one level for confidence intervals including line of no effect and once for small number of studies | ||||||
Antecedentes
Descripción de la afección
Las complicaciones del embarazo, como el parto prematuro, el retraso del crecimiento fetal, la depresión posnatal y la preeclampsia, son relativamente frecuentes y se asocian con resultados más deficientes en la madre y el niño.
De éstos, el parto prematuro tiene la carga más alta de morbimortalidad. A nivel mundial, cerca de 15 000 000 de lactantes nacen de manera prematura (< 37 semanas completas de gestación) cada año (World Health Organization 2017). Las tasas nacionales varían del 5% al 18%, y continúan en aumento en la mayoría de los países (World Health Organization 2017). El parto prematuro es la causa principal de muerte en los recién nacidos; representa más del 85% de todas las complicaciones perinatales y muertes (Thornton 2008). El parto prematuro es también la causa principal de muerte en niños menores de cinco años de edad, con 1 000 000 de las 5 900 000 muertes de niños cada año debido a complicaciones del parto prematuro (Liu 2016).
Los adelantos en la atención perinatal y neonatal hacen que sobrevivan más recién nacidos prematuros, pero muchos de estos lactantes presentan las consecuencias a corto y largo plazo de nacer antes de que los órganos estén maduros (Saigal 2008). Los lactantes nacidos antes de las 34 semanas a menudo requieren cuidados intensivos y tienen un mayor riesgo de síndrome de dificultad respiratoria, hemorragia intraventricular, enterocolitis necrosante, ceguera y parálisis cerebral (Saigal 2008). En la primera infancia, puede haber dificultades del desarrollo, con repercusiones sociales y económicas posteriores debido al bajo rendimiento académico, el alto desempleo y los déficits en el bienestar social y emocional (Westrupp 2014).
En las madres, la depresión posnatal es el trastorno del estado de ánimo más prevalente asociado con el parto; los síntomas incluyen: trastornos del estado de ánimo, perturbaciones del sueño (no relacionados con el lactante), alteraciones del apetito o pérdida de peso e ideación suicida. Las revisiones sistemáticas informan que alrededor del 20% de las pacientes presentan depresión en el transcurso de las 12 semanas del parto (Gaynes 2005), con síntomas que persisten más allá del primer año en el 8% de las pacientes afectadas (Dennis 2012). La depresión posnatal afecta la funcionalidad materna social y psicológica, con posibles efectos adversos posteriores sobre los resultados del desarrollo del niño (Conroy 2012; Zhu 2014).
El retraso del crecimiento fetal se asocia con mortinatalidad, muerte neonatal y morbilidad perinatal y un aumento en el riesgo de resultados de salud adversos hasta la edad adulta (Stillbirth CRE 2018). La preeclampsia, caracterizada por hipertensión y proteinuria, puede afectar el riñón, el hígado y los sistemas de coagulación, y tener complicaciones graves y potencialmente mortales para la madre, como la eclampsia, y también puede dar lugar a parto prematuro y retraso del crecimiento fetal (Mol 2016).
Descripción de la intervención
La dieta materna, incluido el tipo y la cantidad de grasas consumidas, puede tener efectos significativos sobre los resultados del embarazo (Nordgren 2017). El estado de los ácidos grasos poliinsaturados de cadena larga (AGPICL) omega 3 en el embarazo se vinculó por primera vez con embarazo más prolongado, aumento del peso al nacer y menos parto prematuro por los investigadores que observaron embarazos más prolongados entre residentes de las islas Faroe (cuya dieta tiene un alto contenido de pescado) en comparación con la población danesa (Olsen 1985; Olsen 1986; Olsen 1991).
Un estudio observacional prospectivo de 8729 mujeres danesas mostró que el informe de bajo consumo de pescado durante el embarazo fue un factor de riesgo importante de parto prematuro y prematuro temprano (Olsen 2002; Olsen 2006), especialmente cuando la ingesta baja se produjo durante un período prolongado del embarazo (Olsen 2006). Un estudio subsiguiente que agrupó los resultados de 19 cohortes de partos europeos con más de 150 000 pares de madre‐niño demostró una asociación entre el consumo de pescado más de una vez por semana por la madre y un menor riesgo de parto prematuro (Leventakou 2014), mientras que un estudio posterior de Noruega con más de 67 000 mujeres también ha demostrado una asociación entre el mayor consumo de pescado (especialmente pescado magro) y una menor prevalencia de parto prematuro (Brantsaeter 2017). Brantsaeter 2017 también examinó el efecto de AGPICL omega 3 en forma de suplementos y encontró una asociación con una incidencia más baja de parto prematuro temprano, pero no tardío. En estudios observacionales también se ha revelado la conexión entre el consumo de pescado en el embarazo y el desarrollo neurológico del niño (Hibbeln 2007).
En esta revisión, se ha seguido un enfoque exhaustivo y se consideró elegible cualquier forma o dosis de consumo de ácido graso omega 3, como pescado o suplementos de aceite de algas como alimentos o asesoramiento para consumir alimentos específicos ricos en AGPICL omega 3 (como el pescado). También se consideró elegible cualquier tipo de ácido graso omega 3 (p.ej., ácido docosahexaenoico [DHA]; ácido eicosapentanoico [EPA]); y cualquier combinación de AGPICL omega 3. Con el objetivo de una mayor completitud, también se ha incluido el AGPI omega 3 alfalinolénico, aunque no se trata de un AGPICL.
De qué manera podría funcionar la intervención
Se cree que el consumo de ácidos grasos omega 3 durante el embarazo y la lactancia, en particular las formas derivadas de pescado o fuentes marinas, influye sobre diversos resultados maternos, fetales, neonatales, así como resultados tardíos. Éstos incluyen los resultados de crecimiento y desarrollo del niño (Borge 2017; Jensen 2006), la prevención de la alergia infantil (ver la revisión Cochrane ‐ Gunaratne 2015), la prevención de la preeclampsia, la reducción de la depresión materna y la ansiedad (Golding 2009; Vaz Jdos 2013), y el aumento de la duración del embarazo (como se comentó anteriormente).
Cuando se consume en la dieta, el ácido graso esencial alfalinolénico (ALA; 18:3 omega 3) se puede convertir en derivados biológicamente activos, como el ácido eicosapentanoico (EPA; 20:5 omega 3), el ácido docosapentanoico (DPA; 22:5 omega 3) y el ácido docosahexaenoico (DHA; 22:6 omega 3). Estos ácidos grasos son precursores de diversos compuestos que, según se sabe, minimizan y ayudan en la resolución de las respuestas inflamatorias y el estrés oxidativo (Leghi 2016). Se piensa que los resultados del embarazo con un componente inflamatorio, como el parto prematuro, disminuyen con el aumento de las concentraciones de AGPICL omega 3 a través la incorporación de pescado a la dieta materna o con suplementos de aceite de pescado. Es importante un equilibrio entre los metabolitos de AGPICL omega 3 y el ácido araquidónico omega 6 (que a menudo es proinflamatorio) para mantener la duración normal del embarazo y constituye un elemento crítico para la maduración cervical y el inicio del trabajo de parto (Zhou 2017). Se piensa que los niveles adecuados de DHA, en particular, son esenciales para el desarrollo cerebral fetal y de los primeros días de vida (Shulkin 2018).
El pescado y los mariscos son las fuentes alimentarias más ricas en DHA (Greenberg 2008). Sin embargo, el consumo de pescado es bajo en muchos países, y las pacientes en edad fértil pueden ser renuentes a aumentar la ingesta de pescado porque entienden que el mercurio y otros contaminantes de los pescados pueden afectar al feto (Oken 2018). Por ejemplo, sólo el 10% de las mujeres en edad fértil de Australia cumplen con la ingesta recomendada de ácido docosahexaenoico (DHA) (Koletzko 2007; Meyer 2016), que incluye pescado así como suplementos de aceite de pescado. Es probable que muchas embarazadas presenten concentraciones bajas de AGPICL omega 3 y se puedan beneficiar con un aumento de DHA en la dieta, ya sea a través de fuentes alimentarias o de suplementos.
Por qué es importante realizar esta revisión
En los últimos 40 años, se ha publicado un gran número de estudios observacionales, ensayos aleatorios y revisiones que tratan sobre los ácidos grasos omega 3 y el embarazo (p.ej., Newberry 2016), con un número significativo de pacientes. Sin embargo, muchos de estos estudios y revisiones se concentraron en un tema específico, como la alergia o el desarrollo del niño e informaron sólo una selección de resultados. No siempre se informaron algunos resultados como el parto prematuro, a pesar de que se sabe cada vez más que la administración de suplementos de AGPICL omega 3 puede tener una función en su prevención. Además, los estudios y las revisiones sobre AGPICL omega 3 en el embarazo han diferido en los resultados y las conclusiones (p.ej., Saccone 2016), a veces debido al informe selectivo y a otros problemas metodológicos.
Por lo tanto, se necesita una revisión sistemática exhaustiva de los ácidos grasos omega 3 en el embarazo que comprenda todos los resultados relevantes maternos, perinatales y del niño (excepto la alergia que se trata en Gunaratne 2015), todas las formas de ácidos grasos omega 3 y las comparaciones de las dosis, el momento de administración y los tipos de ácidos grasos omega 3.
Objetivos
Evaluar los efectos de AGPICL omega 3, como suplementos o agregados a los alimentos, durante el embarazo en los resultados maternos, perinatales y neonatales y a más largo plazo para la madre y el niño.
Métodos
Criterios de inclusión de estudios para esta revisión
Tipos de estudios
Fueron elegibles para inclusión en la revisión los ensayos controlados aleatorios (ECA), incluidos los ensayos cuasialeatorios y los ensayos publicados en forma de resumen.
Se buscó incluir ECA que utilizaran un diseño aleatorio grupal, pero no se identificó ninguno para inclusión en esta actualización. Los ensayos cruzados no son elegibles para su inclusión en esta revisión.
Tipos de participantes
Pacientes embarazadas, independientemente del riesgo de preeclampsia, parto prematuro o retraso del crecimiento intrauterino (RCIU).
Tipos de intervenciones
-
Ácidos grasos omega 3 (generalmente pescado o aceites de algas) en comparación con placebo o ningún ácido graso omega 3
-
Ensayos que evaluaron cointervenciones de ácidos grasos omega 3 (p.ej., omega 3 con otro agente)
-
Estudios o brazos de estudios que compararon dosis o tipos de omega 3 (p.ej., DHA versus EPA) directamente
Tipos de medida de resultado
Resultados primarios
-
Parto prematuro < 37 semanas
-
Parto prematuro temprano < 34 semanas
-
Embarazo prolongado (> 42 semanas)
Resultados secundarios
Para la mujer
-
Hipertensión
-
Preeclampsia
-
Eclampsia
-
Ingreso al hospital (prenatal o posnatal)
-
Cesárea
-
Cesárea (postérmino)
-
Inducción (postérmino)
-
Hemorragia; pérdida sanguínea
-
Morbilidad grave/mortalidad
-
Duración del embarazo
-
Efectos adversos
-
Diabetes gestacional
-
Depresión
-
Ansiedad
-
Estrés (escala o respuesta al desafío)
-
Aumento de peso gestacional
-
Aborto espontáneo
Para el recién nacido
-
Mortinatalidad
-
Muertes neonatales
-
Muertes perinatales
-
Peso al nacer
-
Talla al nacer
-
Perímetro cefálico
-
Bajo peso al nacer (< 2,5 kg)
-
Pequeño para la edad gestacional (PEG) (< 10º percentilo)/RCIU
-
Grande para la edad gestacional
-
Hemorragia intraventricular (y grado)
-
Síndrome de dificultad respiratoria
-
Enterocolitis necrosante
-
Ictericia neonatal que requirió fototerapia
-
Sepsis
-
Retinopatía del prematuro
-
Convulsión neonatal
-
Ingreso en la unidad de cuidados intensivos neonatales
Seguimiento a más largo plazo del lactante/niño
-
Crecimiento físico
-
Salud mental y emocional
-
Comportamiento
-
Resultados neurológicos, neurosensoriales y del desarrollo (incluidos los dominios cognitivos: atención, función ejecutiva, lenguaje, memoria, desarrollo motor y visuoespacial)
-
Trastornos neurológicos (p.ej., parálisis cerebral)
Para los recursos de los servicios de salud
-
Ingreso y duración de la estancia en el hospital y en las unidades de cuidados intensivos
-
Uso de los servicios de salud de la comunidad
Métodos de búsqueda para la identificación de los estudios
The following methods section of this review is based on a standard template used by Cochrane Pregnancy and Childbirth.
Búsquedas electrónicas
For this update, we searched Cochrane Pregnancy and Childbirth’s Trials Register by contacting their Information Specialist (16 August 2018)
The Register is a database containing over 25,000 reports of controlled trials in the field of pregnancy and childbirth. It represents over 30 years of searching. For full current search methods used to populate Pregnancy and Childbirth’s Trials Register including the detailed search strategies for CENTRAL, MEDLINE, Embase and CINAHL; the list of handsearched journals and conference proceedings, and the list of journals reviewed via the current awareness service, please follow this link
Briefly, Cochrane Pregnancy and Childbirth’s Trials Register is maintained by their Information Specialist and contains trials identified from:
-
monthly searches of the Cochrane Central Register of Controlled Trials (CENTRAL);
-
weekly searches of MEDLINE (Ovid);
-
weekly searches of Embase (Ovid);
-
monthly searches of CINAHL (EBSCO);
-
handsearches of 30 journals and the proceedings of major conferences;
-
weekly current awareness alerts for a further 44 journals plus monthly BioMed Central email alerts.
Search results are screened by two people and the full text of all relevant trial reports identified through the searching activities described above is reviewed. Based on the intervention described, each trial report is assigned a number that corresponds to a specific Pregnancy and Childbirth review topic (or topics), and is then added to the Register. The Information Specialist searches the Register for each review using this topic number rather than keywords. This results in a more specific search set that has been fully accounted for in the relevant review sections (Included studies; Excluded studies; Studies awaiting classification; Ongoing studies).
In addition, we searched ClinicalTrials.gov and the World Health Organization (WHO) International Clinical Trials Registry Platform (ICTRP) for unpublished, planned and ongoing trial reports (29 August 2017) using the search terms given in Appendix 1.
Búsqueda de otros recursos
We searched the reference lists of retrieved studies.
We did not apply any language or date restrictions.
Obtención y análisis de los datos
Selección de los estudios
Two review authors independently assessed all the potential studies we identified as a result of the search strategy for inclusion. We resolved any disagreement through discussion or, if required, we consulted a third review author.
Extracción y manejo de los datos
We designed a form to extract data. For eligible trials, two review authors extracted the data using the agreed form. We resolved discrepancies through discussion or, if required, we consulted a third review author. We entered data into Review Manager 5 software (Review Manager 2014), and checked for accuracy.
When information regarding any of the above was unclear, we attempted to contact authors of the original reports to request further details.
Evaluación del riesgo de sesgo de los estudios incluidos
Two review authors independently assessed risk of bias for each study using the criteria outlined in the Cochrane Handbook for Systematic Reviews of Interventions (Higgins 2011). We resolved any disagreement by discussion or by involving a third assessor.
(1) Random sequence generation (checking for possible selection bias)
For each included study we described the method used to generate the allocation sequence in sufficient detail to allow an assessment of whether it should produce comparable groups.
We assessed the method as:
-
low risk of bias (any truly random process, e.g. random number table; computer random number generator);
-
high risk of bias (any non‐random process, e.g. odd or even date of birth; hospital or clinic record number);
-
unclear risk of bias.
(2) Allocation concealment (checking for possible selection bias)
For each included study we described the method used to conceal allocation to interventions prior to assignment and assessed whether intervention allocation could have been foreseen in advance of, or during recruitment, or changed after assignment.
We assessed the methods as:
-
low risk of bias (e.g. telephone or central randomisation; consecutively numbered sealed opaque envelopes);
-
high risk of bias (open random allocation; unsealed or non‐opaque envelopes, alternation; date of birth);
-
unclear risk of bias.
(3.1) Blinding of participants and personnel (checking for possible performance bias)
For each included study we described the methods used, if any, to blind study participants and personnel from knowledge of which intervention a participant received. We considered that studies were at low risk of bias if they were blinded, or if we judged that the lack of blinding unlikely to affect results. We assessed blinding separately for different outcomes or classes of outcomes.
We assessed the methods as:
-
low, high or unclear risk of bias for participants;
-
low, high or unclear risk of bias for personnel.
(3.2) Blinding of outcome assessment (checking for possible detection bias)
For each included study we described the methods used, if any, to blind outcome assessors from knowledge of which intervention a participant received. We assessed blinding separately for different outcomes or classes of outcomes.
We assessed methods used to blind outcome assessment as:
-
low, high or unclear risk of bias.
(4) Incomplete outcome data (checking for possible attrition bias due to the amount, nature and handling of incomplete outcome data)
For each included study we described, and for each outcome or class of outcomes, the completeness of data including attrition and exclusions from the analysis. We stated whether attrition and exclusions were reported and the numbers included in the analysis at each stage (compared with the total randomised participants), reasons for attrition or exclusion where reported, and whether missing data were balanced across groups or were related to outcomes. Where sufficient information was reported, or could be supplied by the trial authors, we planned to reinclude missing data in the analyses which we undertook.
We assessed methods as:
-
low risk of bias (e.g. no missing outcome data; missing outcome data balanced across groups);
-
high risk of bias (e.g. numbers or reasons for missing data imbalanced across groups; ‘as treated’ analysis done with substantial departure of intervention received from that assigned at randomisation);
-
unclear risk of bias.
(5) Selective reporting (checking for reporting bias)
For each included study we described how we investigated the possibility of selective outcome reporting bias and what we found.
We assessed the methods as:
-
low risk of bias (where it is clear that all of the study’s prespecified outcomes and all expected outcomes of interest to the review were reported);
-
high risk of bias (where not all the study’s prespecified outcomes were reported; one or more reported primary outcomes was not prespecified; outcomes of interest are reported incompletely and so cannot be used; study failed to include results of a key outcome that would have been expected to have been reported);
-
unclear risk of bias.
(6) Other bias (checking for bias due to problems not covered by (1) to (5) above)
For each included study we described any important concerns we had about other possible sources of bias.
(7) Overall risk of bias
We made explicit judgements about whether studies were at high risk of bias, according to the criteria given in the Handbook (Higgins 2011).
Assessment of the quality of the evidence using the GRADE approach
For this update, we evaluated the quality of the evidence for the outcomes below using the GRADE approach as outlined in the GRADE handbook. The GRADE approach uses five considerations (study limitations, consistency of effect, imprecision, indirectness and publication bias) to assess the quality of the body of evidence for each outcome. In randomised controlled trials, the evidence can be downgraded from 'high quality' by one level for serious (or by two levels for very serious) limitations, depending on assessments for risk of bias, indirectness of evidence, serious inconsistency, imprecision of effect estimates or potential publication bias.
Baby/infant
-
Preterm birth < 37 weeks
-
Preterm birth < 34 weeks
-
Perinatal death
-
SGA/IUGR
-
Low birthweight
-
Large‐for‐gestational age
Mother
-
Prolonged gestation (> 42 weeks)
-
Induction post‐term
-
Pre‐eclampsia
-
Length of gestation
-
Maternal adverse events
-
Maternal morbidity composite (serious morbidity)
-
Depression and/or anxiety (postnatal)
Child/adult
-
Cognition
-
Vision (neurosensory outcome)
-
Neurodevelopment
-
Behaviour
-
BMI (long‐term growth outcome)
-
Diabetes (long‐term development outcome)
Health services
-
Maternal hospital admission (antenatal; postnatal)
-
NICU admission
-
Maternal length of hospital stay
-
Infant length of hospital stay
-
Resource use
'Summary of findings' table
We used the GRADEpro Guideline Development Tool to import data from Review Manager 5 in order to create 'Summary of findings’ tables for maternal, baby/infant, child and health service outcomes (Review Manager 2014). We created 'Summary of findings' tables for the main comparison: omega‐3 LCPUFA versus no omega‐3 (e.g. placebo or no supplement). We have presented summaries of the intervention effect and measures of quality according to the GRADE approach in the 'Summary of findings' tables.
Medidas del efecto del tratamiento
Dichotomous data
For dichotomous data, we have presented results as summary risk ratios with 95% confidence intervals.
Continuous data
For continuous data, we have used the mean differences if outcomes were measured in the same way between trials. In future updates, we plan to use the standardised mean difference to combine trials that measure the same outcome, but use different methods.
Cuestiones relativas a la unidad de análisis
Cluster‐randomised trials
We did not identify any cluster‐randomised trials.
In future updates of this review, if cluster‐randomised trials are included, we will adjust their sample sizes and event rates using the methods described in the Cochrane Handbook for Systematic Reviews of Interventions (Higgins 2011), using an estimate of the intra‐cluster correlation co‐efficient (ICC) derived from the trial (if possible), from a similar trial or from a study of a similar population. If we use ICCs from other sources, we will report this and conduct sensitivity analyses to investigate the effect of variation in the ICC. If we identify both cluster‐randomised trials and individually‐randomised trials, we plan to synthesise the relevant information. We will consider it reasonable to combine the results from both if there is little heterogeneity between the study designs and the interaction between the effect of intervention and the choice of randomisation unit is considered to be unlikely.
We will also acknowledge heterogeneity in the randomisation unit and we will perform a subgroup analysis to investigate the effects of the randomisation unit.
Cross‐over trials
We considered cross‐over designs to be an inappropriate design for this research question.
Multi‐arm trials
For included multi‐arm trials, we used methods described in the Cochrane Handbook for Systematic Reviews of Interventions to overcome possible unit‐of analysis errors (Higgins 2011), by combining groups to make a single pair‐wise comparison (where appropriate), or by splitting the 'shared' group into two (or more) groups with smaller sample sizes, and including the two (or more) comparisons (see Included studies text for details of how this was done for each of the 10 multi‐arm trials we included).
Manejo de los datos faltantes
For included trials, we noted levels of attrition.
For all outcomes, we carried out analyses, as far as possible, on an intention‐to‐treat basis, that is, we have attempted to include all participants randomised to each group in the analyses, and all participants were analysed in the group to which they were allocated, regardless of whether or not they received the allocated intervention. The denominator for each outcome in each trial was the number randomised minus any participants whose outcomes were known to be missing.
Evaluación de la heterogeneidad
We assessed statistical heterogeneity in each meta‐analysis using the Tau², I² and Chi² statistics. We regarded heterogeneity as substantial if I² was greater than 30% and either Tau² was greater than zero, or there was a low P value (less than 0.10) in the Chi² test for heterogeneity.
Evaluación de los sesgos de notificación
Where there were 10 or more trials in a meta‐analysis we investigated reporting biases (such as publication bias) using funnel plots. We assessed funnel plot asymmetry visually.
Síntesis de los datos
We carried out statistical analysis using Review Manager 5 software (Review Manager 2014). We used fixed‐effect meta‐analysis for combining data where it was reasonable to assume that trials were estimating the same underlying treatment effect, that is, where trials were examining the same intervention, and the trials’ populations and methods were judged to be sufficiently similar. Where there was clinical heterogeneity sufficient to expect that the underlying treatment effects differed between trials, or where substantial statistical heterogeneity was detected (I² > 30%), we used random‐effects meta‐analysis to produce an overall summary, if an average treatment effect across trials was considered clinically meaningful. The random‐effects summary was treated as the average of the range of possible treatment effects and we have discussed the implications of treatment effects differing between trials. If the average treatment effect was not clinically meaningful, we would not have combined trials.
Where we have used random‐effects analyses, the results have been presented as the average treatment effect with 95% confidence intervals, and the estimates of T² and I².
Análisis de subgrupos e investigación de la heterogeneidad
We investigated substantial heterogeneity using subgroup analyses and sensitivity analyses.
We carried out the following subgroup analyses.
1. Type of intervention
All the following interventions compared with each other:
-
omega‐3 LCPUFA supplements only;
-
omega‐3 supplements plus omega enriched food or dietary advice;
-
omega enriched food only;
-
omega‐3 LCPUFA supplements plus advice and/or other agents.
2. Dose of omega‐3 LCPUFA
The following doses compared to each other:
-
low (< 500 mg/day);
-
mid (500 mg to 1 g/day);
-
high (> 1 g/day).
3. Timing
Comparison of the following gestational ages when omega‐3 LCPUFA supplements commenced:
-
≤ 20 weeks' gestation;
-
> 20 weeks' gestation.
4. Type of omega‐3
Comparison of the following types of omega‐3:
-
DHA/largely DHA;
-
mixed EPA/DHA;
-
mixed DHA/EPA/other
5. Risk of poorer maternal/perinatal outcomes
Comparison of the following risk levels with each other:
-
increased or high risk
-
low risk
-
any or mixed risk
For subgroup 1 type of intervention (Analysis 2) we did not restrict this analysis to the selected group of outcomes used in the other subgroup analyses. This was done to help readers to see results across all outcomes by type of omega‐3 intervention (except for longer term outcomes or other outcomes reporting multiple time points (analyses 1.63 to 1.92) which were sparsely reported).
The following outcomes were used in the other four subgroup analyses (analyses 2‐5):
-
preterm birth < 37 weeks;
-
early preterm birth < 34 weeks;
-
prolonged gestation (> 42 weeks);
-
pre‐eclampsia;
-
caesarean section;
-
length of gestation;
-
perinatal death;
-
stillbirth;
-
neonatal death;
-
low birthweight;
-
SGA/IUGR;
-
birthweight.
We assessed subgroup differences by interaction tests available within Review Manager 5 (Review Manager 2014). We reported the results of subgroup analyses quoting the Chi² statistic and P value, and the interaction test I² value.
Análisis de sensibilidad
We carried out sensitivity analyses (Analysis 9) to explore the effects of trial quality assessed by sequence generation and concealment of allocation, and inadequate blinding, by omitting trials rated as 'high risk of bias' or 'unclear risk of bias' for any one or more of these sources of bias, to assess whether this made any difference to the overall result. We restricted this analysis to 12 outcomes:
-
preterm birth < 37 weeks;
-
early preterm birth < 34 weeks;
-
prolonged gestation > 42 weeks;
-
pre‐eclampsia;
-
caesarean section;
-
birthweight;
-
perinatal death;
-
stillbirth;
-
neonatal death;
-
gestational age;
-
low birthweight;
-
SGA/IUGR
These outcomes are this review's three primary outcomes, plus nine secondary outcomes that were selected for use in subgroup analyses 3, 4 and 5).
Results
Description of studies
Results of the search
For this update, we assessed 447 trial reports in total. This included 406 new reports, plus we reassessed the six included studies (17 reports), 15 excluded studies (20 reports), three ongoing studies and one awaiting further classification in the previous version of the review (Makrides 2006Makrides 2006).
Where required, we reclassified some of the studies/records which were listed as excluded, ongoing or awaiting classification in the previous version of this review (Makrides 2006).
Overall, we have included 70 trials (374 reports). The six trials originally included are still included. The three trials originally listed as ongoing have reported results and are now included. Eight trials that were previously excluded are now included (either due to the enlarged scope of the review or changes in review methodology (e.g. fulfilling inclusion criteria, even if the trial does not report any of the review's prespecified outcomes)).
As of August 2018, we have:
-
15 excluded studies (25 reports) (Escobar 2008; Fievet 1985; Gholami 2017; Herrera 1993; Herrera 1998; Herrera 2004; Lauritzen 2004; Marangell 2004; Morrison 1984; Morrison 1986; Nishi 2016; Starling 1990; Valentine 2013; Velzing‐Aarts 2001; Yelland 2016).
-
23 ongoing studies (28 reports) (Albert 2017; Carlson 2017 ADORE; Carvajal 2014; de Carvalho 2017; Dos Santos 2018; Dragan 2013; FOPCHIN; Garg 2017; Garmendia 2015; Ghebremeskel 2014; Hegarty 2012; Hendler 2017; Khandelwal 2012; Kodkhany 2017; Li 2013; Makrides 2013 (ORIP); Martini 2014 (CORDHA); Mbayiwa 2016; Murff 2017 (FORTUNE); Nishi 2015 (SYNCHRO); Wang 2018; Zielinsky 2015; Zimmermann 2018).
-
17 studies (20 reports) awaiting further classification (Farahani 2010; Gopalan 2004; Jamilian 2018; Kadiwala 2015; Laitinen 2013; Lazzarin 2009; Parisi 2013; Pavlovich 1999; Sajina‐Stritar 1994; Sajina‐Stritar 1998; Salvig 2009; Salzano 2001; Stoutjesdijk 2014; Vahedi 2018; Vakilian 2010; Valentine 2014; Valenzuela 2017).
See Figure 1 which outlines the study flow.
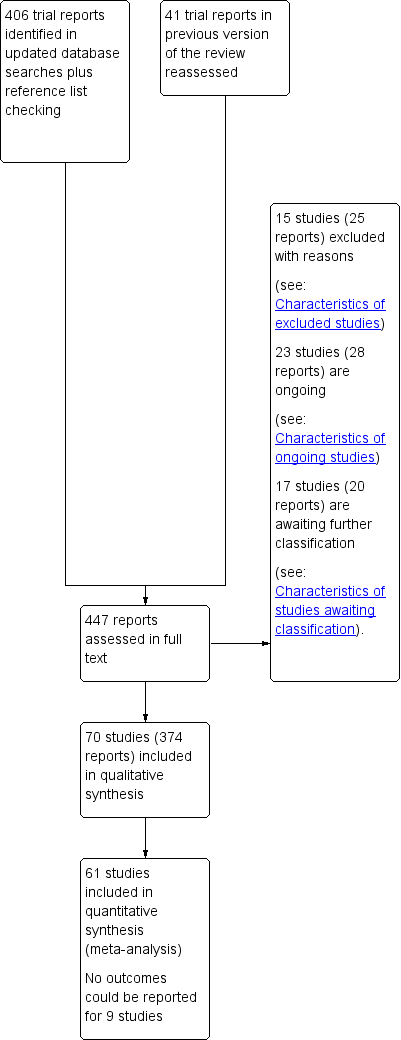
Study flow diagram.
Included studies
Following application of eligibility criteria, we included 70 RCTs comparing an omega‐3 fatty acid intervention (stand‐alone or with a co‐intervention), with placebo or no omega‐3 fatty acids in this review (Ali 2017; Bergmann 2007; Bisgaard 2016; Boris 2004; Bosaeus 2015; Bulstra‐Ramakers 1994; Carlson 2013; Chase 2015; D'Almedia 1992; de Groot 2004; Dilli 2018; Dunstan 2008; England 1989; Freeman 2008; Furuhjelm 2009; Giorlandino 2013; Gustafson 2013; Haghiac 2015; Harper 2010; Harris 2015; Hauner 2012; Helland 2001; Horvaticek 2017; Hurtado 2015; Ismail 2016; Jamilian 2016; Jamilian 2017; Judge 2007; Judge 2014; Kaviani 2014; Keenan 2014; Khalili 2016;. Knudsen 2006; Krauss‐Etschmann 2007; Krummel 2016; Laivuori 1993; Makrides 2010; Malcolm 2003; Mardones 2008; Martin‐Alvarez 2012; Miller 2016; Min 2014; Min 2016; Mozurkewich 2013; Mulder 2014; Noakes 2012; Ogundipe 2016; Oken 2013; Olsen 1992; Olsen 2000; Onwude 1995; Otto 2000; Pietrantoni 2014; Ramakrishnan 2010; Ranjkesh 2011;Razavi 2017; Rees 2008; Ribeiro 2012; Rivas‐Echeverria 2000; Samimi 2015; Sanjurjo 2004; Smuts 2003a; Smuts 2003b; Su 2008; Taghizadeh 2016; Tofail 2006; Valenzuela 2015; Van Goor 2009; Van Winden 2017; Vaz 2017).
All the included trials were individually randomised. Ten were multi‐arm trials (Bergmann 2007; Harris 2015; Jamilian 2017; Knudsen 2006; Krauss‐Etschmann 2007; Laivuori 1993; Mozurkewich 2013; Oken 2013; Razavi 2017; Van Goor 2009).
A total of 19,927 women were involved in the included trials. Knudsen 2006 was the largest trial, randomising 3098 women, followed by Makrides 2010 and Olsen 2000, in which 2399 and 1647 women, respectively, were randomised. Ribeiro 2012 was the smallest trial, randomising 11 women, followed by Van Winden 2017 and Laivuori 1993 (14 and 18 women, respectively). For the majority of the included trials, fewer women were included in analyses than were randomised.
The included trials have been published over nearly three decades ‐ from 1989 to 2018.
Review structure
The analyses in the review are structured as follows.
-
Overall: omega‐3 fatty acids versus placebo or no omega‐3 fatty acids (Analysis 1)
-
Type of intervention subgroups: omega‐3 supplementation alone; combined with food and/or advice; omega‐3 rich food; omega‐3 plus another agent ‐ all versus no omega‐3 (Analysis 2)
-
Dose subgroups (DHA/EPA): low (< 500 mg/day) versus mid (500 mg to 1 g/day) versus high (> 1 g/day) (Analysis 3)
-
Timing subgroups: gestational age when omega‐3 supplements commenced: ≤ 20 weeks' gestation versus > 20 weeks' gestation (Analysis 4)
-
Type of omega‐3: DHA/largely DHA; mixed EPA/DHA; mixed DHA/EPA/other (Analysis 5)
-
Risk subgroups: increased/high risk versus low risk versus any/mixed risk (Analysis 6)
-
Direct comparisons of omega‐3 doses (Analysis 7)
-
Direct comparisons of omega‐3 types (Analysis 8)
-
Sensitivity analysis (Analysis 9)
Further details are given below and in the Characteristics of included studies tables.
Settings
The 70 trials were conducted in a wide range of countries, and most (but not all) in upper‐middle or high‐income countries:
-
16 trials were conducted in the USA (Carlson 2013; Chase 2015; Freeman 2008; Gustafson 2013; Haghiac 2015; Harper 2010; Harris 2015; Judge 2007; Judge 2014; Keenan 2014; Krummel 2016; Miller 2016; Mozurkewich 2013; Oken 2013; Smuts 2003a; Smuts 2003b);
-
eight in Iran (Jamilian 2016; Jamilian 2017; Kaviani 2014; Khalili 2016; Ranjkesh 2011; Razavi 2017; Samimi 2015; Taghizadeh 2016);
-
six in the UK (Malcolm 2003; Min 2014; Min 2016; Noakes 2012; Ogundipe 2016; Onwude 1995);
-
four in the Netherlands (Bulstra‐Ramakers 1994; de Groot 2004; Otto 2000; Van Goor 2009); and four in Demark (Bisgaard 2016; Boris 2004; Knudsen 2006; Olsen 1992);
-
three in Australia (Dunstan 2008; Makrides 2010; Rees 2008); and three in Spain (Hurtado 2015; Martin‐Alvarez 2012; Sanjurjo 2004);
-
two each in Chile (Mardones 2008; Valenzuela 2015); Egypt (Ali 2017; Ismail 2016); Germany (Bergmann 2007; Hauner 2012); Italy (Giorlandino 2013; Pietrantoni 2014); Brazil (Ribeiro 2012; Vaz 2017); and Sweden (Bosaeus 2015; Furuhjelm 2009);
-
and one each in Angola (D'Almedia 1992); Bangladesh (Tofail 2006); Canada (Mulder 2014); Croatia (Horvaticek 2017); Finland (Laivuori 1993); Mexico (Ramakrishnan 2010); Norway (Helland 2001); South Africa (England 1989); Taiwan (Su 2008); Turkey (Dilli 2018) and Venezuela (Rivas‐Echeverria 2000).
Two of the 70 trials were performed in more than one country: Krauss‐Etschmann 2007 (Germany, Spain and Hungary); and Olsen 2000 (Denmark, Scotland, Sweden, United Kingdom, Italy, the Netherlands, Norway, Belgium and Russia). Van Winden 2017 did not report where the study was conducted.
Participants
All participants were pregnant women (and their children). Most pregnancies were singletons, with some studies specifically excluding multiple births. Characteristics of the women are summarised below, including age, parity, eligibility criteria relating to omega‐3 consumption, socioeconomic status, ethnicity, smoking status and risk of adverse pregnancy outcomes. Further details are included in the Additional tables.
Age
Where reported, the mean age of the women ranged from 22 years in Smuts 2003a to 40 years in several studies. The mean age of the women in both groups was at least 30 years in 18 of the included trials (Bergmann 2007; Bisgaard 2016; Bosaeus 2015; Dilli 2018; Dunstan 2008; Furuhjelm 2009; Hauner 2012; Jamilian 2016; Jamilian 2017; Krauss‐Etschmann 2007; Laivuori 1993; Miller 2016; Min 2014 [diabetic women]; Min 2016; Mulder 2014; Rees 2008; Su 2008; Van Goor 2009). Maternal age of women across the included trials is summarised further in Table 1.
| Study ID | Omega‐3 (mean (SD)unless otherwise reported) | No omega‐3 (mean (SD)unless otherwise reported) |
| 27 (4.3) | 27 (4.8) | |
| 30.9 (4.6) for DHA/FOS group | 30.0 (4.62) in vitamin/mineral group; 31 (4.71) for FOS group | |
| 32.3 (4.3) | 32.2 (4.5) | |
| "The three study groups were similar in baseline characteristics with regard to maternal age at delivery (data not shown)". | ||
| 31.4 (3.9) | 31.2 (4.0) | |
| Not reported | ||
| 25.3 (4.9) | 24.8 (4.7) | |
| Not reported | ||
| "Ages ranged from 14‐40 years" | ||
| 30.0 (3.3) | 29.2 (3.8) | |
| 30.9 (5.3) | 32.7 (5.9) | |
| 30.9 (3.7) | 32.6 (3.6) | |
| Not reported | ||
| 31.0 (5.8) | 29.7 (6.2) | |
| 31.1 (4.1) | 31.7 (3.9) | |
| 32.6 (4.6) | 32.2 (4.8) | |
| 25.5 (4.3) | 25.6 (4.8) | |
| 27 (5) | 27 (5) | |
| Median (interquartile range): 28 (23 ‐ 32) | Median (interquartile range): 27 (24‐32) | |
| In high‐dose group 24.5 (12.72); In low‐dose group 24.3 (12.72) | 27.0 (9.05) | |
| 31.9 (4.9) | 31.6 (4.5) | |
| 28.6 (3.4) | 27.6 (3.2) | |
| 29.8 (5.5) | 29.6 (4.8) | |
| 30.5 (4.8) | 29.9 (4.7) | |
| 27.17 (6.34) | 26.71 (5.66) | |
| 30.1 (5.3) | 30.0 (5.5) | |
| 30.7 (3.5) for omega‐3 group 31.2 (4.3) for omega‐3 + vitamin D group | 30.7 (4.1) for placebo group 31.5 (7.0) for vitamin D group | |
| 23.9 (4.3) | 24.7 (4.8) | |
| Not reported | ||
| 26.33 (4.2) | 25.15 (4.2) | |
| Not reported | ||
| 25.9 (4.8) | 26.9 (4.5) | |
| 28.4 for 0.1 g/day EPA + DHA group 28.7 for 0.3 g/day EPA + DHA group 28.4 for 0.7 g/day EPA + DHA group 28.9 for 1.4 g/day EPA + DHA group 28.8 for 2.8 g/day EPA + DHA group 28.8 for 2.2g/day ALA group | 28.5 for no treatment group | |
| Median (range): 30.6 (20.1 ‐ 41.1) for DHA/EPA group Median (range): 31.1 (21.5 ‐ 40.1) for DHA/EPA+folate group | Median (range): 31.1 (18.8 ‐ 40.8) for folate group Median (range): 31.1 (18.4 ‐ 40.3) for no treatment (placebo) group | |
| 27.9 (4.6) | 26.3 (5.0) | |
| Median (IQR): 30.3 (24‐40) | Median (IQR): 30.2 (26‐32) in placebo group; 32.0 (23‐40) in primrose oil group | |
| 28.9 (5.7) | 28.9 (5.6) | |
| Not reported | ||
| 25.06 (5.73) | 25.11 (7.45) | |
| Not reported | ||
| 31.7 (4.4) | 31.2 (4.4) | |
| Median (range): 29 (18 ‐ 42) | Median (range): 29 (18 ‐ 44) | |
| Median (range): 34 (20 ‐ 45) | Median (range): 37 (27‐45) | |
| Median (range): 31.0 (21.0 ‐ 41.0) | Median (range): 32.0 (21.0 ‐ 44.0) | |
| 30.6 (4.5) in DHA rich fish oil group; 29.9 (5.0) in EPA rich fish oil group | 30.4 (5.9) | |
| 32.6 (4.04) | 33.4 (3.61) | |
| 29.5 (3.94) | 28.4 (4.69) | |
| Not reported | ||
| Median (IQR): 32.6 (27.9 ‐ 35.9) advice group; 27.6 (24.5 ‐ 32.0) advice + gift card group | Median (IQR): 32.4 (27.7 to 34.3) | |
| 29.4 (4.4) | olive oil group 29.7 (4.3); placebo/no oil group 29.1 (4.1) | |
| Prophylactic trials PD trial 29.3 (4.87) IUGR trial 30 (4.64) PIH trial 30.3 (7.01) Twins trial 30.2 (6.18) Therapeutic trials Threat‐PE trial 32.1 (11.7) Susp‐IUGR trial 29.3 (7.88) | Prophylactic trials PD trial 30.0 (6.22) IUGR trial 29.0 (3.93) PIH trial 28.9 (5.32) Twins trial 30.2 (6.35) Therapeutic trials Threat‐PE trial 32.9 (14.6) Susp‐IUGR trial 29.8 (10.3) | |
| see Olsen 2000 | ||
| Mean (range): 26.6 (18‐39) | Mean (range): 26.1 (16‐40) | |
| 30.3 (5.2) | 28.3 (4.85) | |
| 30.86 (4.18) | 29.92 (4.80) | |
| 26.2 (4.6) | 26.3 (4.8) | |
| 30.06 (7.59) | 28.96 (6.40) | |
| 29.7 (3.6) for omega‐3 group 29.9 (4.0) for omega‐3 + vitamin D group | 29.2 (3.4) for placebo group 29.9 (5.0) for vitamin D group | |
| 31.2 (4.4) | 34.5 (3.8) | |
| Not reported | ||
| Not reported | ||
| Median (range): 26.8 (18‐39) | Median (range): 26.1 (16‐40) | |
| 34.5 (7.41) | 31.25 (5.18) | |
| 21.7 (4.3) | 21.6 (4.2) | |
| High DHA egg group 19.9 (4.1) | Ordinary egg group 24.8 (7.8) | |
| 30.9 (3.9) | 31.3 (5.7) | |
| 28.6 (6.3) | 29.4 (4.4) | |
| 22.1 (4.2) | 23.4 (4.5) | |
| 29 (4.7) | 28.3 (6.7) | |
| Median (range): 32.3 (22.3 ‐ 43.3) in DHA group; 31.5 (24.8 ‐ 41.4) in DHA + AA group | Median (range): 33.5 (26.0 ‐ 40.3) | |
| Not reported | ||
| Median (IQR): 25.5 (22.0‐34.5) | Median (IQR): 27.0 (21.0 ‐ 31.0) | |
Abbreviations: IQR (interquartile range)
Parity
Five trials specifically reported parity: Rivas‐Echeverria 2000 excluded nulliparous women; Smuts 2003b excluded women with more than four prior pregnancies; Valenzuela 2015 included women with one to four prior births; Van Goor 2009 included women with a first or second pregnancy. Olsen 2000, for the prophylactic trials, included women who in an early pregnancy had experienced preterm birth (before 259 days gestation). Twenty‐eight of the trials did not report baseline information related to parity clearly (Boris 2004; Bulstra‐Ramakers 1994; Chase 2015; D'Almedia 1992; Dilli 2018; England 1989; Furuhjelm 2009; Giorlandino 2013; Gustafson 2013; Harper 2010; Harris 2015; Jamilian 2016; Jamilian 2017; Judge 2014; Kaviani 2014; Keenan 2014; Krummel 2016; Malcolm 2003; Martin‐Alvarez 2012; Miller 2016; Noakes 2012; Ogundipe 2016; Ramakrishnan 2010; Razavi 2017; Ribeiro 2012; Samimi 2015; Taghizadeh 2016; Van Winden 2017). Both nulliparous and multiparous women were included in the remaining 38 trials (Ali 2017; Bergmann 2007; Bisgaard 2016; Bosaeus 2015; Carlson 2013; de Groot 2004; Dunstan 2008; Freeman 2008; Haghiac 2015; Hauner 2012; Helland 2001 (nulliparous and primiparous only); Horvaticek 2017; Hurtado 2015; Ismail 2016; Judge 2007; Khalili 2016; Knudsen 2006; Krauss‐Etschmann 2007; Laivuori 1993; Makrides 2010; Mardones 2008; Min 2014; Min 2016; Mozurkewich 2013; Mulder 2014; Oken 2013; Olsen 1992; Olsen 2000 (therapeutic trials only); Onwude 1995; Otto 2000; Pietrantoni 2014; Ranjkesh 2011; Rees 2008; Sanjurjo 2004; Smuts 2003a; Su 2008; Tofail 2006; Vaz 2017). Detailed information relating to parity is reported in Table 2.
| Study ID | Omega‐3 | No omega‐3 |
| Mean (SD): 2.9 (4.8) | Mean (SD): 2.8 (1.6) | |
| > 1: 22 (45.8%) in DHA/FOS group | > 1: 28 (57.1%) in vitamin/mineral group 24 (51.1%) in FOS group | |
| 1: 155 (44.8%) | 1: 166 (47.6%) | |
| Not reported | ||
| Median (IQR): 0.5 (0,1) | Median (IQR): 0 (0,1) | |
| Not reported | ||
| Prior pregnancies, N Mean (SD): 1.2 (1.3) | Prior pregnancies, N Mean (SD): 1.3 (1.4) | |
| Not reported | ||
| Not reported | ||
| 0: 11 (38%) 1: 15 (52%) 2: 3 (10%) 3: 0 (0%) | 0: 12 (41%) 1: 11 (38%) 2: 5 (17%) 3: 1 (3%) | |
| ≥ 1: 15 (45.5%) | ≥ 1: 21 (53.8%) | |
| Not reported | ||
| Primiparous: 24 (77.4%) | Primiparous: 22 (78.6%) | |
| Not reported | ||
| Not reported | ||
| Not reported | ||
| 0: 7 (28%) 1:18 (72%) | 0: 5 (21%) 1: 19 (79%) | |
| Not reported | ||
| Not reported | ||
| Primiparous: 55.8% | Primiparous: 61.2% | |
| Mean (SD): 0.3 (0.5) | Mean (SD): 0.3 (0.5) | |
| Nulliparous: 25 (53%) Primiparous: 22 (47%) | Nulliparous: 26 (60%) Primiparous: 17 (40%) | |
| Multiparous: 35.6% | Multiparous: 31.8% | |
| Mean (SD): 1.38 (1.67) | Mean (SD): 1.53 (1.55) | |
| Not reported | ||
| Not reported | ||
| Mean (SD): 1.5 (0.8) | Mean (SD): 1.8 (0.8) | |
| Not reported | ||
| Not reported | ||
| Not reported | ||
| 1: 38 (50.7%) 2: 28 (37.3%) ≥ 3: 9 (12.0%) | 1: 37 (49.3%) 2: 27 (36%) ≥ 3: 11 (14.7%) | |
| Primiparous women 0.1 g/day EPA + DHA group: 257 (66.2%) 0.3 g/day EPA + DHA group: 267 (69.5%) 0.7 g/day EPA + DHA group: 244 (63.5%) 1.4 g/day EPA + DHA group: 247 (64.7%) 2.8 g/day EPA + DHA group: 246 (62.9%) 2.2 g/day ALA group: 258 (66.3%) | Primiparous women No treatment group: 513 (66.4%) | |
| < 2: 56 (86%) for DHA/EPA group; 56 (88%) for DHA/EPA+folate group 2: 7 (11%) for DHA/EPA group; 6 (9%) for DHA/EPA+folate group > 2: 2 (3%) for DHA/EPA group; 2 (3%) for DHA/EPA+folate group | < 2: 65 (90%) for folate group; 61 (88%) for placebo group 2: 7 (10%).for folate group; 7 (10%) for placebo group > 2: 0 (0) for folate group; 1 (1%) for placebo group | |
| Not reported | ||
| Nulliparous: 2 (66%) in fish oil group Primiparous: 1 in (33%) fish oil group | Nulliparous: 1 (25%) in primrose oil group; 3 (75%) in placebo group Primiparous: 3 (60%) in primrose oil group; 2 (40%) in placebo group | |
| Primiparous: 471 (39.3%) | Primiparous: 474 (39.4%) | |
| Not reported | ||
| Mean (SD): 1.68 (0.90) | Mean (SD): 1.74 (0.91) | |
| Not reported | ||
| Not reported | ||
| 0: 18 (40%) 1‐3: 26 (57.8%) > 4: 1 (2.2%) | 0: 14 (35.0%) 1‐3: 23 (57.5%) > 4: 2 (5.0%) | |
| 0: 10 (24%) 1‐3: 27 (65.9%) > 4: 3 (7.3%) | 0: 7 (14.9%) 1‐3: 32 (68.1%) > 4: 6 (12.8%) | |
| 0: 33 (50%) 1‐3: 27 (41%) ≥ 4: 6 (9%) | 0: 24 (35%) 1‐3: 40 (57%) ≥ 4: 5 (7%) | |
| Mean (SD): 0.87 (0.83) for EPA rich fish oil group; 1.08 (0.94) for DHA rich fish oil group | Mean (SD): 0.85 (1.2) | |
| 1: 60.6% 2: 30.8% > 2: 8.6% | 1: 47.7% 2: 36.7% > 2: 15.6% | |
| Not reported | ||
| Not reported | ||
| Primiparous: 6 (35%) in advice group; 4 (24%) in advice + gift card group | Primiparous: 6 (30%) in control group | |
| Primiparous: Fish oil group: 56% | Primiparous: Olive oil group: 61% No oil group: 60% | |
| Prophylactic trials: no nulliparous women except for: Twins trial: 52.5% nulliparous Therapeutic trials Threat‐PE trial: 71.4% nulliparous Susp‐IUGR trial: 52.0% nulliparous | Prophylactic trials: no nulliparous women except for: Twins trial: 52.5% nulliparous Therapeutic trials Threat‐PE trial: 65.6% nulliparous Susp‐IUGR trial: 51.9% nulliparous | |
| Included primiparous and multiparous women | ||
| Primiparous: 8 (67%) | Primiparous: 5 (42%) | |
| 0: 46 (36%) 1: 83 (64%) | 0: 50 (40%) 1: 76 (60%) | |
| Not reported | ||
| Mean (SD): 0.46 (0.50) | Mean (SD): 0.40 (0.49) | |
| Not reported | ||
| Mean (SD): 1.4 (0.9) | Mean (SD): 1.6 (1.2) | |
| Not reported | ||
| Excluded nulliparous women | ||
| Not reported | ||
| Mean (SD): 1.63 (0.74) | Mean (SD): 1.38 (0.52) | |
| Nulliparous before study: 68% | Nulliparous before study: 58% | |
| Women were excluded if they had more than 4 previous pregnancies Mean (SD): 1.9 (1.1) | Mean (SD): 2.3 (1.9) | |
| Mean (SD): 1.7 (1.1) | Mean (SD): 1.8 (1.1) | |
| Not reported | ||
| Women with > 2 children: 16.8% | Women with > 2 children: 31.5% | |
| Included women with 1‐4 prior births | ||
| Included women with a first or second pregnancy | ||
| Not reported | ||
| 0‐1: 26 (81.2%) ≥ 2: 6 (18.8%) | 0‐1: 18 (64.3%) ≥ 2: 10 (35.7%) | |
Eligibility criteria relating to omega‐3 intake
Forty of the 70 trials reported eligibility criteria relating to omega‐3 intake, such as excluding women with an allergy to fish or fish products and/or excluding women taking omega‐3, fish oil or DHA supplements or regular/any intake of fish. However in one case, women were required to be consuming fish at least twice a week to be eligible for inclusion in the trial in addition to either omega‐3 LCPUFA supplementation or placebo (Pietrantoni 2014). See Table 3 for further details for each relevant trial.
| Study | Eligibility criteria |
| Excluded women taking ≥ 300 mg DHA a day | |
| Excluded women planning to take DHA during pregnancy | |
| Excluded women consuming fish more than twice a week | |
| Excluded women consuming fish more than twice a week | |
| Excluded women with a previous intolerance to omega‐3 fatty acids | |
| Excluded women with an allergy to fish or undergoing treatment with omega‐3 fatty acid supplements | |
| Excluded women with an allergy to fish or regular intake of fish oil | |
| Excluded women taking more than 200 mg DHA a day | |
| Excluded women with an allergy to fish or fish products; women who do not eat any fish; and women with a regular intake of fish oil (> 500 mg/week in the previous 4 weeks) | |
| Excluded women with an allergy to fish or fish products; and women with a regular intake of fish oil supplements (> 500 mg/week at any time during the preceding month) | |
| Excluded women with allergies to fish or consumption of salmon, mackerel, rainbow trout or sardines at least weekly | |
| Excluded women taking omega‐3 supplementation before randomisation | |
| Excluded women already taking DHA | |
| Did not include women taking DHA supplements in pregnancy | |
| Excluded women taking omega‐3 fatty acid supplements | |
| Excluded women consuming fish more than twice a week | |
| Excluded women consuming ≥ 2 servings of sea fish a week | |
| Excluded women with an allergy to fish oil or fish products; and women consuming fish more than twice a week | |
| Included women with only limited fish intake and who did not use fish oil capsules during pregnancy | |
| Excluded women who had used fish oil supplements since the beginning of their pregnancy | |
| Excluded women who consumed > 1 fish meal/week or who used DHA‐fortified foods or supplements | |
| Excluded women who were already taking DHA supplements | |
| Excluded women with an allergy to fish products | |
| Excluded women with an allergy to seafood or fish oils | |
| Excluded women taking fish oil supplements | |
| Excluded women taking omega‐3 fatty acid supplements and women consuming > 2 fish meals a week | |
| Excluded women taking any lipid or fatty acid supplementation | |
| included women with a diet low in oily fish (excluding canned tuna) ≤ twice per month | |
| Excluded women with an allergy to fish and fish oil and women previously regularly taking a preconception fish oil supplement | |
| Excluded women consuming fish > 3 times a month; or with no contraindications to fish consumption such as allergy, or self‐restrictions such as a vegetarian diet | |
| Excluded women with a fish allergy or regular intake of fish oil | |
| Excluded women with a fish allergy or regular intake of fish oil | |
| Only included women who consumed fish at least twice a week (equivalent to 600 g fish a week) | |
| Excluded women regularly taking fish oil or DHA supplements | |
| Excluded women taking omega‐3 fatty acid supplements | |
| Excluded women taking fish oil supplements or eating more than 3 oily fish portions per week; not showing any signs of intolerance or allergy to fish | |
| Excluded women with any signs of intolerance or allergy to fish or using dietary supplements containing omega‐3 and omega‐6 PUFA | |
| Excluded women with a diet including polyunsaturated fatty acids (PUFA, ALA supplements) or LCPUFA (EPA and or DHA supplements) | |
| Excluded women who were vegetarians or vegans | |
| Excluded women taking any oil supplementation (such as fish oil, flaxseed oil or cod liver oil) |
Socioeconomic status
The socioeconomic status of women at baseline was reported by a range of measures including, education, employment, household income, socioeconomic index, and welfare/benefit dependence. Education measures were reported by 21 trials (Bergmann 2007; Bosaeus 2015; Carlson 2013; de Groot 2004; Dunstan 2008; Freeman 2008; Gustafson 2013; Harper 2010; Hauner 2012; Helland 2001; Judge 2007; Kaviani 2014; Khalili 2016; Krummel 2016; Makrides 2010; Mardones 2008; Pietrantoni 2014; Ramakrishnan 2010; Rees 2008; Tofail 2006; Vaz 2017), with all but seven of these trials suggesting that most women had at least 12 years education ‐ see Table 4. Five trials reported other measures of socio‐economic status ‐ Bisgaard 2016 reported that 10% of participants had low incomes; D'Almedia 1992 reported that 69% of women were employed; Krauss‐Etschmann 2007 stated that 40% of fathers had no training qualifications; Oken 2013 reported that 40% of women worked full‐time and Smuts 2003a reported that "most subjects received government assistance for medical aid". The remaining 42 trials did not report socioeconomic status of participants.
| Study ID | omega‐3 | no omega‐3 |
| Not reported | ||
| Employed: 31 (77.5%) in DHA/folate group 13 years of schooling: 32 (66.7%) in DHA/folate group | Employed: 35 (85.4%) in Vit/Min group; 30 (78.9%) in folate group 13 years of schooling: 28 (57.1%) in Vit/Min group; 32 (68.1%) in folate group | |
| Household annual income: Low: 33 (9.6%) Medium: 179 (51.9%) High: 133 (38.6%) | Household annual income: Low: 34 (9.7%) Medium: 187 (53.6%) High: 128 (36.7%) | |
| Not reported | ||
| 15 or more years of education: 17 (94.4%) | 15 or more years of education: 15 (88.2%) | |
| Not reported | ||
| Maternal education: Mean (SD): 13.69 years (2.67) | Maternal education: Mean (SD): 13.36 years (2.72) | |
| Not reported | ||
| "Sixty‐nine percent were employed; ninety‐four percent of their husbands were employed". | ||
| Education measured on an 8‐point scale: Mean (SD): 4.3 (1.4) | Education measured on an 8‐point scale: Mean (SD): 3.9 (1.5) | |
| Maternal education: 10‐12 years: 10 (30.3%) > 12 years: 23 (69.7%) | Maternal education: 10‐12 years: 9 (23.1%) > 12 years: 30 (76.9%) | |
| Not reported | ||
| Maternal employment: 61.3% employed Maternal education: Mean (SD): 15.5 years ((2.1) | Maternal employment: 60.7% employed Maternal education, Mean (SD): 14.6 years (2.2) | |
| Not reported | ||
| Not reported | ||
| Maternal education: Mean (SD): 14.0 years (3.1) | Maternal education: Mean (SD): 13.9 years (2.7) | |
| Not reported | ||
| Maternal education: Median (IQR): 13 years (12‐16) | Maternal education: Median (IQR): 13 years (12‐16) | |
| Not reported | ||
| Maternal education: 63.8% attended ≥ 12 years of school | Maternal education: 69.9% attended ≥ 12 years of school | |
| Maternal education: < 10 years: 2.9% 10‐12 years: 21.4% > 12 years: 75.7% | Maternal education: < 10 years: 1.8% 10‐12 years: 31.1% > 12 years: 67.1% | |
| Not reported | ||
| Not reported | ||
| Not reported | ||
| Not reported | ||
| Not reported | ||
| Maternal education: Mean (SD): 12.8 years (2.2) | Maternal education; Mean (SD): 12.2 years (1.5) | |
| Not reported | ||
| Maternal education: < 6 years: 7.5% 6 to 9 years: 12.5% 9 to 12 years: 20% | Maternal education: < 6 years: 7.5 % 6 to 9 years: 15% 9 to 12 years: 10% | |
| Not reported | ||
| Maternal education: Primary school (1‐5 years): 14 (18.7%) Seconday school (6‐8 years): 23 (30.7%) High school (9‐12 years): 33 (44.0%) University (> 12 years): 5 (6.7%) Family income: Adequate: 15 (20%) Relatively adequate: 44 (58.7%) Non adequate: 16 (21.3%) | Maternal education: Primary school (1‐5 years): 15 (20.0%) Seconday school (6‐8 years): 14 (18.7%) High school (9‐12 years): 39 (52.0%) University (> 12 years): 7 (9.3%) Family income; Adequate: 13 (17.3%) Relatively adequate: 50 (66.7%) Non adequate: 12 (16.0%) | |
| Not reported | ||
| Job training of father: None: 29 (45%) for DHA/EPA group; 17 (27%) for DHA/EPA+folate group Apprenticeship: 14 (22%) for DHA/EPA group; 19 (31%) for DHA/EPA+folate group University degree: 15 (23%) for DHA/EPA group; 21 (34%) for DHA/EPA+folate group | Job training of father: None: 33 (47%) for folate group; 27 (40%) for placebo group Apprenticeship: 10 (14%) for folate group; 14 (21%) for placebo group University degree: 24 (34%) for folate group; 20 (29%) for placebo group | |
| Education: Mean (SD): 14.8 years (2.1) | Education: Mean (SD): 14.9 years (3.2) | |
| Not reported | ||
| Mother completed secondary education: 755 (63.1%) Mother completed further education: 816 (68.2%) MSSI score: median 28.5, IQR (25.0 ‐ 31.0) | Mother completed secondary education: 760 (63.2%) Mother completed further education: 824 (68.6%) MSSI score: median 29.0, IQR (25.0 ‐ 31.0) | |
| Not reported | ||
| Education: > 8 years: 82.1% ESOMAR classification: AB (high level): 0.5% CA (medium level): 4.4% CB (medium level): 34.9% D (medium ‐ low level): 40.4% E (low level): 19.8% | Education: > 8 years: 80.7% ESOMAR classification: AB (high level): 0.3% CA (medium level): 4.2% CB (medium level): 33.4% D (medium ‐ low level): 44.6% E (low level): 17.5% | |
| Not reported | ||
| Not reported | ||
| Not reported | ||
| Not reported | ||
| Not reported | ||
| Not reported | ||
| Not reported | ||
| Not reported | ||
| Not reported | ||
| Working full time: 6 (35%) for advice to eat fish group; 9 (50%) for advice to eat fish + gift card group | Working full time: 7 (35%) for control group | |
| Not reported | ||
| Not reported | ||
| see Olsen 2000 | ||
| Not reported | ||
| Not reported | ||
| High school or university degree: 129 (100%) Average socioeconomic status (not defined): 129 (100%) | High school or university degree: 126 (100%) Average socioeconomic status (not defined): 126 (100%) | |
| High school education or above: 56.6% | High school education or above: 59.5% | |
| Not reported | ||
| Not reported | ||
| Maternal education: Mean (SD): 14.5 years (3.5) | Maternal education: Mean (SD): 15.3 (2.9) | |
| Not reported | ||
| Not reported | ||
| Not reported | ||
| Not reported | ||
| "Most subjects received government assistance for medical care" | ||
| Not reported | ||
| Not reported | ||
| Not reported | ||
| Mostly low‐income participants Mothers with > 5 years of schooling: 36.8% Working mothers: 16.0 Fathers with stable job: 65.6 Family income (taka/month, 1 USD = 59 taka): 64.0 | Mostly low‐income participants Mothers with > 5 years of schooling: 32.3% Working mothers: 12.1% Fathers with stable job: 65.3% Family income (taka/month, 1 USD = 59 taka): 54.0 | |
| SES assessed using the ESOMAR criteria: High: 5.3% Medium: 73.7% Low: 21.1% | SES assessed using the ESOMAR criteria: High: 19.0% Medium: 66.7% Low: 14.3% | |
| Not reported | ||
| Not reported | ||
| Family income, not further defined: US $263.2 (181.9‐383.0) Maternal education: | Family income (US $) not further defined: US $304.1 (180.7 ‐ 379.8) Maternal education: Median (IQR): 8.0 years (7.5 ‐ 10.5) | |
Abbreviations: DHA: docosahexaenoic acid; EPA: eicosapentaenoic acid; ESOMAR: European Society for Opinion and Marketing Research; IQR: interquartile range; MSSI: maternal social support index; SD: standard deviation; SES: socioeconomic status
Ethnicity or race
Most trials (46) reported no baseline information on ethnicity or race, though they did report the country where the study was conducted (with the exception of Van Winden 2017). Ten trials reported a mix of ethnicities, nine trials reported including only Caucasian women (understood to be white women) or women of similar ethnicities; two trials included African women, and one trial each reported including African‐American women or Hispanic women ‐ see Table 5.
| Study ID | Omega‐3 | No omega‐3 |
| Not reported (study conducted in Egypt) | ||
| "Caucasian women" | ||
| Caucasian: 333 (96.2%) | Caucasian: 332 (95.1%) | |
| Not reported (conducted in Denmark) | ||
| Women of European descent | ||
| Not reported (study conducted in the Netherlands) | ||
| Hispanic: 8% Not Hispanic: 92% | Hispanic: 8% Not Hispanic 92% | |
| African‐American: 38% | ||
| Maternal ethnicity not reported; reported that 98% of included infants were white | Maternal ethnicity not reported; reported that 93% of included infants were white | |
| Not reported (conducted in Angola) | ||
| "White women" | ||
| Caucasian women | ||
| Not reported (conducted in South Africa) | ||
| Not reported (conducted in USA) | ||
| Not reported (conducted in Sweden) | ||
| Not reported (conducted in Italy) | ||
| 28% African‐American (conducted in USA) | ||
| African American: 11 (44%) Caucasian: 10 (40%) Other (e.g. Hispanic or Asian): 4 (16%) | African American: 6 (25%) Caucasian: 11 (46%) Other (e.g. Hispanic or Asian): 7 (29%) | |
| African American: 148 (34.1%) White: 245 (56.5%) Asian: 13 (3.0%) Other: 28 (6.5%) Hispanic/Latina ethnicity: 64 (14.7%) | African American: 145 (34.9%) White: 240 (57.7%) Asian: 5 (1.2%) Other: 26 (6.3%) Hispanic/Latina ethnicity: 57 (13.6%) | |
| Not reported (conducted in USA) | ||
| Not reported (conducted in Germany) | ||
| Not reported (conducted in Norway) | ||
| Not reported (conducted in Croatia) | ||
| Not reported (conducted in Spain) | ||
| Not reported (conducted in Egypt) | ||
| Not reported (conducted in Iran) | ||
| Not reported (conducted in Iran) | ||
| Not reported (conducted in USA) | ||
| Not reported (conducted in USA) | ||
| Not reported (conducted in Iran) | ||
| African American women | ||
| Not reported (conducted in Iran) | ||
| Not reported (conducted in Denmark) | ||
| Not reported (conducted in Spain, Germany or Hungary) | ||
| African American: 12 (37.5%) White: 20 (62.5%) | African American: 15 (53.6%) White: 13 (46.4%) | |
| Not reported (conducted in Finland) | ||
| Not reported (conducted in Australia) | ||
| Not reported (conducted in UK) | ||
| "mainly ethnically mixed (American and Hispanic)" | ||
| Not reported (conducted in Spain) | ||
| African American: 1 (1.7%) Caucasian: 55 (92%) Hispanic: 2 (3%) Asian: 1 (1.67%) Other: 1 (1.67%) | African American: 0 (0%) Caucasian: 52 (95%) Hispanic: 2 (3%) Asian: 1 (2%) Other: 0 (0%) | |
| Asian: 16 (35.6%) African/Afro‐Caribbean: 10 (22.2%) Caucasian: 13 (28.9%) Others: 6 (13.3%) | Asian: 18 (45.0%) African/Afro‐Caribbean: 14 (35.0%) Caucasian: 6 (15.0%) Others: 2 (5.0%) | |
| Asian: 18 (43.9%) African/Afro‐Caribbean: 15 (36.6%) Caucasian: 5 (12.2%) Others: 3 (7.3%) | Asian: 27 (57.5%) African/Afro‐Caribbean: 10 (21.3%) Caucasian: 5 (10.6%) Others: 5 (10.6%) | |
| Asian: 40 (60%) African/Afro‐Caribbean: 18 (27%) Caucasian: 5 (7%) Others: 4 (7%) | Asian: 44 (62%) African/Afro‐Caribbean: 18 (25%) Caucasian: 5 (7%) Others: 4 (6%) | |
| White: 33 (85%) for EPA‐rich group; 29 (76%) for DHA‐rich group African‐American: 4 (10%) for EPA‐rich group; 4 (11%) for DHA‐rich group Hispanic‐Latina: 0 (0%) for EPA‐rich group; 4 (11%) for DHA‐rich group Asian: 1 (3%) for EPA‐rich group; 1 (3%) for DHA‐rich group American Indian or Alaska Native: 0 (0%) for EPA‐rich group; 0 (0) for DHA‐rich group Native Hawaiian or other Pacific ethnicity: 1 (3) for EPA‐rich group; 0 (0%) for DHA‐rich group | White: 34 (83%) African‐American: 2 (5%) Hispanic‐Latina: 3 (7%) Asian: 1 (2%) American Indian or Alaska Native: 1 (2%) Native Hawaiian or other Pacific ethnicity: 0 (0%) | |
| White: 73.1% Non‐white: 26.9% | White: 73.9% Non‐white: 26.1% | |
| Not reported (conducted in UK) | ||
| Not reported (conducted in UK) | ||
| White: 9 (50%) advice only group; 9 (53%) advice+voucher group Black: 2 (11%) advice only group; 2 (12%) advice+voucher group Asian: 2 (11%) advice only group; 1 (6%) advice+voucher group Hispanic/other: 5 (28%) advice only group; 5 (29%) advice+voucher group | White: 9 (45%) Black: 2 (10%) Asian: 3 (15%) Hispanic/other: 6 (30%) | |
| Not reported (conducted in Denmark) | ||
| Not reported (conducted in Denmark, Scotland, Sweden, England, Italy, Netherlands, Norway, Belgium and Russia) | ||
| See Olsen 2000 | ||
| Not reported (conducted in UK) | ||
| Not reported (conducted in the Netherlands) | ||
| Caucasians | ||
| Not reported (conducted in Mexico) | ||
| Not reported (conducted in Iran) | ||
| Not reported (conducted in Iran) | ||
| Not reported (conducted in Australia) | ||
| Not reported (conducted in Brazil) | ||
| Not reported (conducted in Venezuela) | ||
| Not reported (conducted in Iran) | ||
| Not reported (conducted in Spain) | ||
| African:104 (73%) Other: 38 (27%) | African: 109 (73%) Other: 40 (27%) | |
| African: 15 (83%) Other: 3 (17%) | African: 15 (78%) Other: 4 (22%) | |
| Not reported (conducted in Taiwan) | ||
| Not reported (conducted in Iran) | ||
| Not reported (conducted in India) | ||
| Hispanic: 19 (100%) | Hispanic: 21 (100%) | |
| Not reported (conducted in the Netherlands) | ||
| Neither ethnicity, race or country where study conducted reported | ||
| White: 13 (40.6%) Non‐white: 19 (59.4%) | White: 5 (17.9%) Non‐white: 23 (82.1%) | |
Smoking
Thirteen trials reported excluding women who smoked. Twenty‐three trials reported smoking rates in pregnancy ranged from several per cent to nearly 50% in one trial. The remaining 35 trials did not report maternal smoking status, see Table 6.
| Study ID | Omega‐3 | No omega‐3 | |
| Smokers were excluded | |||
| Smokers were excluded | |||
| Smoking during pregnancy: 21 (6.1%) | Smoking during pregnancy: 33 (9.5%) | ||
| "The three study groups were similar in baseline characteristics with regard to... percentage of smokers (data not shown)". | |||
| Not reported | |||
| Not reported | |||
| History of smoking: 41% Smoking during pregnancy: 30% | History of smoking: 45% Smoking during pregnancy: 38% | ||
| Not reported | |||
| Not reported | |||
| Smoking at 14 weeks GA: Yes: 4 (14%) | Smoking at 14 weeks GA: Yes: 10 (34%) | ||
| 15 (28%) | 24 (35%) | ||
| Smokers were excluded | |||
| Not reported | |||
| Not reported | |||
| Exposure to smoke: (at least 1 of immediate family a smoker) 9 (17%) | Exposure to smoke: (at least 1 of immediate family a smoker) 11 (17%) | ||
| Maternal smoking at baseline: 50% | Maternal smoking at baseline: 48% | ||
| Not reported | |||
| Not reported | |||
| Smoking during pregnancy: 64 (15%) | Smoking during pregnancy: 72 (17%) | ||
| Not reported | |||
| Smoking before pregnancy: 16% | Smoking before pregnancy: 24% | ||
| Smoking: 16% | Smoking: 22% | ||
| Not reported | |||
| Not reported | |||
| Not reported | |||
| Smokers were excluded | |||
| Smokers were excluded | |||
| Smokers were excluded | |||
| Not reported | |||
| Smokers were excluded | |||
| Regular smokers were excluded | |||
| Not reported | |||
| Smoked during pregnancy 0.1 g/day EPA + DHA group: 79 (20.3%) 0.3 g/day EPA + DHA group: 78 (20.3%) 0.7 g/day EPA + DHA group: 78 (20.3%) 1.4 g/day EPA + DHA group: 79 (20.6%) 2.8 g/day EPA + DHA group: 78 (19.9%) 2.2g/day ALA group: 79 (20.3%) | Smoked during pregnancy 160 (20.7%) | ||
| Smoking at study entry Yes: 8 (12%) for DHA/EPA group; 9 (14%) for DHA/EPA + Folate group | Smoking at study entry Yes: 5 (7%) for Folate group; 9 (13%) for placebo group | ||
| "Current or previous use of tobacco" an exclusion criteria | |||
| Not reported | |||
| Smoking at trial entry or leading up to pregnancy 358 (29.9%) | Smoking at trial entry or leading up to pregnancy 407 (33.9%) | ||
| Not reported | |||
| Not reported | |||
| Not reported | |||
| Not reported | |||
| Smoker 6 (13%) | Smoker 0 (0%) | ||
| Smoker 2 (4%) | Smoker 0 (0%) | ||
| Smoker 2 (3%) | Smoker 0 (0%) | ||
| Not reported | |||
| Not reported | |||
| Not reported | |||
| Not reported | |||
| Never smoker 14 (78%) in advice group; 12 (71%) in advice+gift card group | Never smoker 14 (70%) in control group | ||
| Smokers Fish oil group: 33% | Smokers Olive oil group: 29% No oil group: 33% | ||
| Smoker Prophylactic trials Earl‐PD trial 45% Earl‐IUGR trial 52% Earl‐PIH trial 19% Twins trial 33% Therapeutic trials Threat‐PE trial 18% Susp‐IUGR trial 31% | Smoker Prophylactic trials Earl‐PD trial 41% Earl‐IUGR 52% Earl‐PIH trial 24% Twins trial 29% Therapeutic trials Threat‐PE trial 21% Susp‐IUGR trial 30% | ||
| Current smoker 42 (37%) | Current smoker 32 (27%) | ||
| Not reported | |||
| Smokers were excluded | |||
| Not reported | |||
| Not reported | |||
| Smokers were excluded | |||
| Smoker 0 (0%) | Smoker 3 (23%) | ||
| Not reported | |||
| Not reported | |||
| Smokers were excluded | |||
| Smoker 1 (13%) | Smoker 2 (25%) | ||
| Smoker before pregnancy: 46.8% Smoker during pregnancy: 27.0% | Smoker before pregnancy: 38.2% Smoker during pregnancy: 21.5% | ||
| Not reported | |||
| Not reported | |||
| Smokers were excluded | |||
| Not reported | |||
| Not reported | |||
| Not reported | |||
| Not reported | |||
| Not reported | |||
Women at risk
We defined increased/high risk as any factors which might increase the risk of adverse maternal and birth outcomes; these baseline risks included being at risk of pre‐eclampsia, having a previous preterm birth, gestational diabetes mellitus (GDM), being overweight/obese or underweight, or being at risk of poor mental health ‐ see Table 7.We classified trials into increased/high risk (34 trials); any or mixed risk (8 trials) and low risk (29 trials). One trial reported women with GDM and low risk women separately (Min 2014). We also performed a subgroup analysis based on risk (see Analysis 6 and results text).
| Study ID | All women included in the study |
| Increased/high‐risk (pregnancy complicated with asymmetrical IUGR) | |
| Low‐risk (healthy women) | |
| Any/mixed risk (not reported) | |
| Low‐risk (healthy women) | |
| Low‐risk (healthy women) | |
| Increased/high‐risk (women with a history of IUGR with or without PIH in the previous pregnancy) | |
| Low‐risk (healthy women) | |
| Increased/high‐risk (Infants at risk of T1D (e.g. mothers with T1D) | |
| Mixed risk (21% of all included women had a history of PIH, and 4% a history of preterm birth) | |
| Low‐risk (healthy women) | |
| Increased/high risk (women with GDM) | |
| Low‐risk (history of physician‐diagnosed allergic rhinitis and/or asthma and 1 or more positive skin prick test to common allergens, but who were otherwise healthy) | |
| Increased/high‐risk (women with severe gestational proteinuric hypertension | |
| Increased/high‐risk (pregnant and postpartum women with a major depressive order) | |
| Low‐risk (pregnant women affected by allergy themselves, of having a husband or previous child with allergies, otherwise healthy) | |
| Increased/high‐risk (pregnancy women with a history of IUGR, fetal demise or pre‐eclampsia) | |
| Low‐risk (healthy women) | |
| Increased/high‐risk: (overweight or obese (BMI ≥ 25) | |
| Increased/high‐risk (women with at least 1 prior spontaneous preterm birth) | |
| Low‐risk (healthy women) | |
| Low‐risk (healthy women) | |
| Low‐risk (healthy women) | |
| Increased/high‐risk (pregnant women with T1D) | |
| Low‐risk (healthy women) | |
| Increased/high‐risk (oligohydramnios at 30‐34 weeks GA) | |
| Increased/high‐risk (women with GDM) | |
| Increased/high‐risk (women with GDM) | |
| Low‐risk (healthy women) | |
| Low‐risk (healthy women) | |
| Increased/high‐risk (women diagnosed with mild depression) | |
| Increased/high‐risk (women living in urban low‐income environments) | |
| Low‐risk (healthy women) | |
| Any/mixed risk (not reported) | |
| Low‐risk (healthy women) | |
| Increased/high‐risk (all women overweight or obese) | |
| Increased/high‐risk (women with pre‐eclampsia) | |
| Any/mixed risk | |
| Low‐risk (healthy women) for final outcomes (any/mixed risk for preterm birth outcome) | |
| Increased/high‐risk (all included women underweight (BMI ≤ 21.2kg/m 2 at 10 weeks GA)) | |
| Any/mixed risk (not reported) | |
| Any/mixed risk | |
| Low‐risk (healthy women) | |
| Increased/high‐risk (women diagnosed with Type 2 diabetes) | |
| Increased/high‐risk (women with GDM) | |
| Increased/high‐risk (women with a history of depression) | |
| Low‐risk (healthy women) | |
| Low‐risk (women with a history of allergy, atopy or asthma) | |
| Increased/high‐risk: (women at risk of developing pre‐eclampsia, fetal growth restriction, gestational diabetes) | |
| Any/mixed risk | |
| Low‐risk (healthy women) | |
| Increased/high‐risk (previous preterm birth or IUGR in previous pregnancy or pregnancy‐induced hypertension or twins in current pregnancy; threatening pre‐eclampsia or ultrasonically estimated fetal weight below the 10th centile) | |
| See Olsen 2000 | |
| Increased/high‐risk (primigravida with abnormal Doppler blood flow, previous birthweight < 3rd centile, PIH, previous unexplained stillbirth) | |
| Low‐risk (healthy women) | |
| Low‐risk (healthy women) | |
| Low‐risk (healthy women) | |
| Increased/high‐risk (women at high risk for pre‐eclampsia) | |
| Increased/high‐risk (women diagnosed with GDM) | |
| Increased/high‐risk (current episode of major depression or dysthymia) | |
| Any/mixed (not reported) | |
| Increased/high‐risk (women at risk of pre‐eclampsia) | |
| Increased/high‐risk (women with GDM) | |
| Low‐risk (healthy women) | |
| Low‐risk (healthy women) | |
| Low‐risk (healthy women) | |
| Increased/high‐risk (women diagnosed with major depressive disorder between 16 weeks and 32 weeks GA) | |
| Increased/high‐risk (women with GDM) | |
| Increased/high‐risk (low income; 28% women undernourished) | |
| Low‐risk ("women free from any known diseases that could affect fetal growth") | |
| Low‐risk (healthy women) | |
| Increased/high‐risk (women with GDM) | |
| Increased/high‐risk (pregnant women classified at risk for postpartum depression) |
Abbreviations: ADA: American Diabetes Association; BMI: body mass index; GA: gestational age; GDM: gestational diabetes mellitus; IUGR: intrauterine growth restriction; OGTT: oral glucose tolerance test; PIH: pregnancy‐induced hypertension; PPD: postpartum depression
Interventions
Overall analysis (Analysis 1)
Each of the 70 included trials compared an omega‐3 fatty acid intervention (stand‐alone or with a co‐intervention); including 10 trials with a food or dietary advice component), with placebo or no omega‐3 fatty acids, with 60 trials contributing data for this review.
Intervention type subgroup (Analysis 2)
As there was considerable variation between trials, we have subgrouped results by four main types of intervention (in addition to the overall analysis):
-
I ntervention type 1: Omega‐3 supplements only versus placebo or no omega‐3 fatty acids (50 trials) (Bisgaard 2016; Boris 2004; Bulstra‐Ramakers 1994; Carlson 2013; Chase 2015; Dilli 2018; Dunstan 2008; England 1989; Freeman 2008; Furuhjelm 2009; Giorlandino 2013; Gustafson 2013; Haghiac 2015; Harris 2015; Helland 2001; Horvaticek 2017; Ismail 2016; Jamilian 2016; Jamilian 2017*; Judge 2007; Judge 2014; Kaviani 2014; Keenan 2014; Khalili 2016; Knudsen 2006; Krummel 2016; Laivuori 1993; Makrides 2010; Malcolm 2003; Miller 2016; Min 2014; Min 2016; Mozurkewich 2013; Mulder 2014; Olsen 1992; Olsen 2000; Onwude 1995; Ramakrishnan 2010; Ranjkesh 2011; Razavi 2017*; Rees 2008; Ribeiro 2012; Samimi 2015; Sanjurjo 2004; Su 2008; Tofail 2006; Valenzuela 2015; Van Goor 2009; Van Winden 2017; Vaz 2017)
-
-
Most of these trials compared oral DHA and/or EPA (or mainly DHA/EPA) supplements with placebo or no omega‐3 treatment. Four trials compared unspecified or other oral omega‐3 fatty acid supplements with placebo or no omega‐3 (Laivuori 1993; Ribeiro 2012; Samimi 2015; Valenzuela 2015), and one trial compared vaginal omega‐3 supplementation with placebo (Giorlandino 2013). Some trials reported including small amounts of other agents in the intervention arm (e.g. vitamin E) but we judged these to have minimal effect on outcomes.
-
-
Intervention type 2: Omega‐3 supplements/enrichment plus food/dietary advice versus placebo or no omega‐3 fatty acids (7 trials) (de Groot 2004; Hauner 2012; Hurtado 2015; Martin‐Alvarez 2012; Pietrantoni 2014; Smuts 2003a; Smuts 2003b)
-
Intervention type 3: Omega‐3 food/dietary advice only versus placebo or no omega‐3 fatty acids (3 trials): (Bosaeus 2015; Noakes 2012; Oken 2013)
-
Intervention type 4: Omega‐3 supplements plus other agents versus placebo or no omega‐3 fatty acids (12 trials): the other agents used in these 12 trials were as follows.
-
-
arachidonic acid (AA) (Otto 2000; Van Goor 2009)
-
Aspirin (Ali 2017)
-
Aspirin + vitamins C + E (Rivas‐Echeverria 2000)
-
Folate (Krauss‐Etschmann 2007)
-
Gamma‐linolenic acid (GLA) (D'Almedia 1992)
-
multiple micronutrients (Mardones 2008)
-
Prebiotics (Bergmann 2007)
-
Progesterone (Harper 2010)
-
Vitamin D (Jamilian 2017*; Razavi 2017*)
-
Vitamin E (high amounts) Taghizadeh 2016.
-
Jamilian 2017* and Razavi 2017* are multi‐arm trials that span two of the above four intervention categories.
Multi‐arm trials
Ten trials had multi‐arm designs. We combined relevant groups in the multi‐arm trials to create appropriate single pair‐wise comparisons for inclusion in the main comparison, avoiding unit of analysis errors, specifically:
-
Bergmann 2007: three arms (DHA/EPA + prebiotic versus prebiotic + vitamin/mineral versus vitamin/mineral); analysed as DHA/EPA + prebiotic versus the other two arms combined (prebiotic/vitamin/mineral and vitamin/mineral) in the overall comparison (Analysis 1).
-
Harris 2015: three arms (300 g/day DHA versus 600 g/day DHA versus placebo); analysed as 300 g/day + 600 g/day combined versus placebo for the overall comparison (Analysis 1); we split doses in the dose subgroups (Analysis 3), and compared 300 g/day and 600 g/day directly in Analysis 8.
-
Krauss‐Etschmann 2007: four arms (DHA + EPA versus DHA + EPA + folate versus folate versus placebo, all using milk‐based sachets); analysed as DHA + EPA and DHA + EPA + folate groups combined, compared with placebo and folate only combined.
-
Jamilian 2017: four arms (DHA + EPA versus DHA + EPA + vitamin D versus vitamin D + placebo) ‐ data from this trial were not included (no review outcomes reported).
-
Knudsen 2006: seven arms (five different doses of DHA + EPA versus ALA versus no treatment/flax oil); analysed as six omega‐3 groups combined versus no treatment/flax oil for the overall comparison (Analysis 1); omega‐3 groups combined in two dose groups, < 1 g/day and ≥ 1 g/day in the direct dose comparison (Analysis 7); DHA + EPA versus ALA in the omega‐3 supplement type direct comparison (Analysis 8).
-
Laivuori 1993: three arms (DHA + EPA + other omega‐3 versus linoleic acid (LA)/GLA versus placebo) ‐ data from this trial were not included (no outcomes able to be used).
-
Mozurkewich 2013: three arms (mainly DPA versus mainly EPA versus placebo); DPA + EPA groups pooled in analysis 1; DPA versus mainly EPA groups included in omega‐3 supplement type comparison (Analysis 8).
-
Oken 2013: three arms (voucher to purchase fish plus advice on which fish to consume versus advice on fish consumption only versus generic dietary advice only); analysed as intervention arms pooled versus generic dietary advice only.
-
Razavi 2017 four arms (DHA + EPA versus DHA + EPA + vitamin D versus vitamin D versus placebo); two arms (DPA + EPA and DHA + EPA + vitamin D) pooled and compared with placebo in analysis.
-
Van Goor 2009: three arms (DHA + AA versus DHA versus placebo); intervention arms pooled and compared with placebo for overall comparison (Analysis 1) and other analyses except for DHA + AA versus DHA for direct omega‐3 supplement type comparison (Analysis 8).
For additional details on the omega‐3 fatty acid interventions and how they varied across the trials see Characteristics of included studies.
Comparisons
Most comparisons were between omega‐3 LCPUFA and placebo/no omega‐3. As well as contributing to the main omega‐3 versus no omega‐3 comparison in Analysis 1, five of the multi‐arm trials contributed outcomes from direct comparisons of omega‐3 supplement doses or omega‐3 supplements for inclusion in the meta‐analysis:
-
Omega‐3 supplement dose comparisons: two trials: Harris 2015 compared 600 mg versus 300 mg DHA/day; Knudsen 2006 compared six different doses which we collapsed into a comparison of < 1 g/day versus ≥ 1 g/day (see Analysis 7).
-
Omega‐3 supplements versus other omega‐3 supplements: three trials: Knudsen 2006 compared EPA/DHA (five doses combined) versus ALA; Mozurkewich 2013 compared DHA versus EPA; and Van Goor 2009 compared DHA versus DHA/AA combined (see Analysis 8).
Subgroup analyses
Dose subgroup ‐ DHA + EPA (Analysis 3)
-
Low (< 500 mg/day): 24 trials (Ali 2017; Bergmann 2007; D'Almedia 1992; Harris 2015*; Hurtado 2015; Ismail 2016; Jamilian 2016; Judge 2007; Judge 2014; Khalili 2016; Knudsen 2006*; Malcolm 2003; Martin‐Alvarez 2012; Miller 2016; Mulder 2014; Noakes 2012 (as fish); Ogundipe 2016; Pietrantoni 2014; Ramakrishnan 2010; Samimi 2015; Sanjurjo 2004; Smuts 2003a; Smuts 2003b; Van Goor 2009)
-
Mid (500 mg/day to 1 g/day): 21 trials (Carlson 2013; Chase 2015; Dilli 2018; Giorlandino 2013; Gustafson 2013; Harris 2015*; Horvaticek 2017; Kaviani 2014#; Keenan 2014; Krauss‐Etschmann 2007; Knudsen 2006*; Krummel 2016; Makrides 2010; Mardones 2008#; Min 2014; Min 2016; Otto 2000; Ranjkesh 2011; Razavi 2017; Rees 2008; Ribeiro 2012)
-
-
Of these 21 trials, 14 clearly reported doses of ≥ 500 mg DHA/day (Carlson 2013; Chase 2015; Giorlandino 2013; Gustafson 2013; Harris 2015 (one arm); Horvaticek 2017; Krauss‐Etschmann 2007; Krummel 2016; Makrides 2010; Min 2014; Min 2016; Otto 2000; Rees 2008; Ribeiro 2012).
-
-
High (> 1 g/day): 23 trials (Bisgaard 2016; Boris 2004; Bulstra‐Ramakers 1994; Dunstan 2008; England 1989; Freeman 2008; Furuhjelm 2009; Haghiac 2015; Harper 2010; Hauner 2012; Helland 2001; Jamilian 2017; Knudsen 2006*; Laivuori 1993; Mozurkewich 2013; Olsen 1992; Olsen 2000; Onwude 1995; Rivas‐Echeverria 2000; Su 2008; Tofail 2006; Van Winden 2017; Vaz 2017).
-
Other: in five trials it was not possible to estimate DHA/EPA dose, or the omega‐3 supplement was clearly not DHA or EPA (Bosaeus 2015; Oken 2013 (advice to consume fish); de Groot 2004 (margarine enriched to give 2.82 g/day ALA); Taghizadeh 2016 (ALA 400 mg/day (flax oil)); Valenzuela 2015 (10.1 g/day ALA).
*trials had more than one omega‐3 group with different doses
#only specified as omega‐3 and not DHA and/or EPA.
Timing subgroup ‐ gestational age when omega‐3 supplements commenced (Analysis 4)
-
> 20 weeks' gestation: 33 trials (Ali 2017; Bergmann 2007; Bisgaard 2016; Boris 2004; Furuhjelm 2009; Giorlandino 2013; Hurtado 2015; Ismail 2016; Jamilian 2016; Jamilian 2017; Judge 2007; Judge 2014; Kaviani 2014; Knudsen 2006; Krummel 2016; Laivuori 1993; Martin‐Alvarez 2012; Miller 2016; Min 2016; Olsen 1992; Onwude 1995; Ramakrishnan 2010; Razavi 2017; Rees 2008; Ribeiro 2012; Samimi 2015; Sanjurjo 2004; Smuts 2003a; Smuts 2003b; Taghizadeh 2016; Tofail 2006; Valenzuela 2015; Van Winden 2017)
-
≤ 20 weeks' gestation: 33 trials (Bosaeus 2015; Bulstra‐Ramakers 1994; Carlson 2013; Chase 2015; D'Almedia 1992; de Groot 2004; Dilli 2018; Dunstan 2008; Gustafson 2013; Haghiac 2015; Harper 2010; Harris 2015; Hauner 2012; Helland 2001; Horvaticek 2017; Keenan 2014; Khalili 2016; Krauss‐Etschmann 2007; Makrides 2010; Malcolm 2003; Mardones 2008; Min 2014; Mozurkewich 2013; Mulder 2014; Noakes 2012; Ogundipe 2016; Olsen 2000; Otto 2000; Pietrantoni 2014; Ranjkesh 2011; Su 2008; Van Goor 2009; Vaz 2017)
-
Mixed: two trials (Freeman 2008; Oken 2013)
-
Not reported: two trials (England 1989; Rivas‐Echeverria 2000)
DHA/mixed subgroup (Analysis 5)
-
DHA/largely DHA: 27 trials (Carlson 2013; Chase 2015; Dunstan 2008; Giorlandino 2013; Gustafson 2013; Harris 2015; Hauner 2012; Horvaticek 2017; Hurtado 2015; Judge 2007; Judge 2014; Keenan 2014; Krummel 2016; Makrides 2010; Malcolm 2003; Martin‐Alvarez 2012; Miller 2016; Min 2014; Min 2014 [diabetic women]; Min 2016; Mulder 2014; Ogundipe 2016; Pietrantoni 2014; Ramakrishnan 2010; Rees 2008; Sanjurjo 2004; Smuts 2003a; Smuts 2003b)
-
Mixed EPA + DHA: 25 trials (Bisgaard 2016; Boris 2004; Bulstra‐Ramakers 1994; Dilli 2018; England 1989; Freeman 2008; Furuhjelm 2009; Haghiac 2015; Harper 2010; Helland 2001; Ismail 2016; Jamilian 2016; Jamilian 2017; Khalili 2016; Knudsen 2006; Mozurkewich 2013; Noakes 2012; Olsen 1992; Olsen 2000; Olsen 2000 [twins]; Onwude 1995; Ranjkesh 2011; Su 2008; Tofail 2006; Van Winden 2017; Vaz 2017)
-
Mixed DHA + EPA + other: 18 trials: (Ali 2017; Bergmann 2007; Bosaeus 2015; D'Almedia 1992; de Groot 2004; Kaviani 2014; Krauss‐Etschmann 2007; Laivuori 1993; Mardones 2008; Oken 2013; Otto 2000; Razavi 2017; Ribeiro 2012; Rivas‐Echeverria 2000; Samimi 2015; Taghizadeh 2016; Valenzuela 2015; Van Goor 2009)
Risk subgroup: women at increased/high risk, any/mixed risk or low risk (Analysis 6)
Increased or high baseline risk of adverse maternal and birth outcomes included being at risk of pre‐eclampsia, having a previous preterm birth, GDM, being overweight/obese or underweight, or being at risk of poor mental health ‐ see Table 7.
-
Increased or high risk: 34 trials (Ali 2017; Bulstra‐Ramakers 1994; Chase 2015; Dilli 2018; England 1989; Freeman 2008; Giorlandino 2013; Haghiac 2015; Harper 2010; Horvaticek 2017; Ismail 2016; Jamilian 2016; Jamilian 2017; Kaviani 2014; Keenan 2014; Krummel 2016; Laivuori 1993; Mardones 2008; Min 2014 [diabetic women]*; Min 2016; Mozurkewich 2013; Ogundipe 2016; Olsen 2000; Onwude 1995; Ranjkesh 2011; Razavi 2017; Rees 2008; Rivas‐Echeverria 2000; Samimi 2015; Su 2008; Taghizadeh 2016; Tofail 2006; Van Winden 2017; Vaz 2017)
-
Any or mixed risk: eight trials (Bisgaard 2016; D'Almedia 1992; Knudsen 2006; Makrides 2010; Martin‐Alvarez 2012; Miller 2016; Oken 2013; Ribeiro 2012)
-
Low risk: 29 trials (Bergmann 2007; Boris 2004; Bosaeus 2015; Carlson 2013; de Groot 2004; Dunstan 2008; Furuhjelm 2009; Gustafson 2013; Harris 2015; Hauner 2012; Helland 2001; Hurtado 2015; Judge 2007; Judge 2014; Khalili 2016; Krauss‐Etschmann 2007; Malcolm 2003; Min 2014; Mulder 2014; Noakes 2012; Olsen 1992; Otto 2000; Pietrantoni 2014; Ramakrishnan 2010; Sanjurjo 2004; Smuts 2003a; Smuts 2003b; Valenzuela 2015; Van Goor 2009)
*Min 2014 reported diabetic women separately.
Outcomes
Primary outcomes were reported in a format suitable for meta‐analysis as follows:
-
preterm birth < 37 weeks reported by 26 trials;
-
preterm birth < 34 weeks reported by nine trials;
-
prolonged gestation > 42 weeks reported by six trials.
Most of our secondary outcomes were reported in at least some of the trials.
We were unable to include any outcomes from 10 trials in our meta‐analysis (Boris 2004; Bosaeus 2015; Chase 2015; Ismail 2016; Jamilian 2017; Laivuori 1993; Martin‐Alvarez 2012; Ogundipe 2016; Ribeiro 2012; Van Winden 2017). Of these, Boris 2004, Chase 2015, Ismail 2016, Jamilian 2017, Martin‐Alvarez 2012 and Ribeiro 2012 did not report on any of our prespecified review outcomes. Bosaeus 2015 and Laivuori 1993 reported review outcomes, however, the data were not suitable for inclusion in the meta‐analysis. Ogundipe 2016 only reported review outcomes overall, not separately by intervention and control group. Van Winden 2017 did report on maternal adverse effects, but narratively.
Sources of trial funding
Funding sources were reported by 56 of the 70 included trials (Bergmann 2007; Bisgaard 2016; Boris 2004; Bosaeus 2015; Carlson 2013; Chase 2015; D'Almedia 1992; de Groot 2004; Dilli 2018; Dunstan 2008; Freeman 2008; Furuhjelm 2009; Giorlandino 2013; Gustafson 2013; Haghiac 2015; Harper 2010; Harris 2015; Hauner 2012; Helland 2001; Hurtado 2015; Jamilian 2016; Jamilian 2017; Judge 2007; Judge 2014; Keenan 2014; Khalili 2016; Knudsen 2006; Krauss‐Etschmann 2007; Krummel 2016; Laivuori 1993; Makrides 2010; Malcolm 2003; Mardones 2008; Min 2014; Min 2016; Mozurkewich 2013; Mulder 2014; Ogundipe 2016; Oken 2013; Olsen 1992; Olsen 2000; Otto 2000; Pietrantoni 2014; Ramakrishnan 2010; Razavi 2017; Rees 2008; Rivas‐Echeverria 2000; Samimi 2015; Sanjurjo 2004; Smuts 2003a; Smuts 2003b; Su 2008; Taghizadeh 2016; Tofail 2006; Van Goor 2009; Vaz 2017). Funding bodies listed by the trials were mostly non‐commercial organisations (e.g. government funding bodies, universities, health services and other not‐for‐profit foundations, including the World Health Organization). However, commercial organisations ‐ mainly pharmaceutical companies ‐ were reported as the only or main funding sources in 11 trials (Bergmann 2007; de Groot 2004; Giorlandino 2013; Helland 2001; Laivuori 1993; Mardones 2008; Otto 2000; Sanjurjo 2004; Smuts 2003a; Smuts 2003b; Van Goor 2009). Thirteen trials did not report any funding (Ali 2017; Bulstra‐Ramakers 1994; England 1989; Horvaticek 2017; Ismail 2016; Kaviani 2014; Martin‐Alvarez 2012; Miller 2016; Ranjkesh 2011; Ribeiro 2012; Rivas‐Echeverria 2000; Valenzuela 2015; Van Winden 2017).
Trial authors' declarations of interest
Eleven trials of the 70 trials reported information related to potential conflicts of interests for the trial authors, primarily related to income received from pharmaceutical and other commercial organisations (Carlson 2013; Freeman 2008; Harper 2010; Hauner 2012; Helland 2001; Hurtado 2015; Krauss‐Etschmann 2007; Makrides 2010; Mozurkewich 2013; Noakes 2012; Olsen 1992). A further 31 trials reported having no interests to declare (Ali 2017; Bergmann 2007; Bosaeus 2015; de Groot 2004; Dilli 2018; Dunstan 2008; Furuhjelm 2009; Haghiac 2015; Horvaticek 2017; Ismail 2016; Jamilian 2016; Jamilian 2017; Judge 2014; Kaviani 2014; Khalili 2016; Krummel 2016; Malcolm 2003; Mardones 2008; Min 2014; Min 2016; Mulder 2014; Oken 2013; Pietrantoni 2014; Ramakrishnan 2010; Razavi 2017; Ribeiro 2012; Taghizadeh 2016; Valenzuela 2015; Van Goor 2009; Van Winden 2017; Vaz 2017).
The remaining 28 trials did not report any information regarding declarations of interest (Bisgaard 2016; Boris 2004; Bulstra‐Ramakers 1994; Chase 2015; D'Almedia 1992; England 1989; Giorlandino 2013; Gustafson 2013; Harris 2015; Judge 2007; Keenan 2014; Knudsen 2006; Laivuori 1993; Martin‐Alvarez 2012; Miller 2016; Ogundipe 2016; Olsen 2000; Onwude 1995; Otto 2000; Ranjkesh 2011; Rees 2008; Rivas‐Echeverria 2000; Samimi 2015; Sanjurjo 2004; Smuts 2003a; Smuts 2003b; Su 2008; Tofail 2006). For further details of the reported declarations, see Characteristics of included studies.
Excluded studies
We excluded 15 studies (Escobar 2008; Fievet 1985; Gholami 2017; Herrera 1993; Herrera 1998; Herrera 2004; Lauritzen 2004; Marangell 2004; Morrison 1984; Morrison 1986; Nishi 2016; Starling 1990; Valentine 2013; Velzing‐Aarts 2001; Yelland 2016). Four trials assessed the effects of an omega‐6 fatty acid intervention (linoleic acid) (Herrera 1993; Herrera 1998; Herrera 2004; Morrison 1984), and one trial assessed evening primrose oil (Fievet 1985). In Escobar 2008, participants were registered, but none were recruited. In five trials participants were not randomised (Gholami 2017; Marangell 2004; Nishi 2016; Starling 1990; Velzing‐Aarts 2001), and in another it did not appear as if participants were randomised (Morrison 1986). In Lauritzen 2004 and Valentine 2013 women were supplemented with omega‐3 during lactation only. The remaining trial was a methodological study that assessed aspects of several trials (Yelland 2016).
Risk of bias in included studies
For a summary of the risk of bias across the included trials, see Figure 2 and Figure 3.

Risk of bias summary: review authors' judgements about each risk of bias item for each included study.

Risk of bias graph: review authors' judgements about each risk of bias item presented as percentages across all included studies.
Allocation
Random sequence generation
We judged the methods used to generate the random sequence to be adequate in 37 of the 70 included trials (Ali 2017; Bergmann 2007; Bisgaard 2016; Bosaeus 2015; Carlson 2013; D'Almedia 1992; Giorlandino 2013; Gustafson 2013; Haghiac 2015; Harper 2010; Harris 2015; Hauner 2012; Helland 2001; Hurtado 2015; Ismail 2016; Jamilian 2016; Jamilian 2017; Keenan 2014; Khalili 2016; Krummel 2016; Makrides 2010; Miller 2016; Min 2014; Min 2016; Mozurkewich 2013; Mulder 2014; Noakes 2012; Oken 2013; Olsen 2000; Onwude 1995; Ramakrishnan 2010; Razavi 2017; Rees 2008; Samimi 2015; Sanjurjo 2004; Smuts 2003a; Taghizadeh 2016), with all trials using computer‐generated methods or likely to have done so. We judged the risk of selection bias associated with sequence generation to be unclear in 32 trials, as many did not report how the random sequence was generated or provide sufficient information (Boris 2004; Bulstra‐Ramakers 1994; Chase 2015; de Groot 2004; Dilli 2018; Dunstan 2008; England 1989; Freeman 2008; Furuhjelm 2009; Horvaticek 2017; Judge 2007; Judge 2014; Kaviani 2014; Knudsen 2006; Krauss‐Etschmann 2007; Laivuori 1993; Malcolm 2003; Martin‐Alvarez 2012; Ogundipe 2016; Olsen 1992; Otto 2000; Pietrantoni 2014; Ranjkesh 2011; Ribeiro 2012; Rivas‐Echeverria 2000; Smuts 2003b; Su 2008; Tofail 2006; Valenzuela 2015; Van Goor 2009; Van Winden 2017; Vaz 2017). We judged one trial to be at high risk of selection bias, as alternation was used (odd and even numbers) (Mardones 2008).
Allocation concealment
We judged that 29 of the 70 trials had used adequate methods for allocation concealment (Ali 2017; Bisgaard 2016; Bulstra‐Ramakers 1994; Carlson 2013; D'Almedia 1992; Dunstan 2008; Gustafson 2013; Haghiac 2015; Harper 2010; Harris 2015; Ismail 2016; Jamilian 2016; Judge 2014; Keenan 2014; Khalili 2016; Krummel 2016; Makrides 2010; Min 2014; Min 2016; Mozurkewich 2013; Oken 2013; Olsen 1992; Olsen 2000; Onwude 1995; Ramakrishnan 2010; Razavi 2017; Rees 2008; Samimi 2015; Taghizadeh 2016). Four of these reported using sequentially numbered, opaque sealed envelopes (Ali 2017; Ismail 2016; Oken 2013; Olsen 1992). Three reported computer driven telephone or centre based randomisation (Harper 2010; Makrides 2010; Olsen 2000); 21 reported third party (pharmacy, health provider, supplement provider or external investigator) controlled randomisation (Bisgaard 2016; Bulstra‐Ramakers 1994; Carlson 2013; D'Almedia 1992; Dunstan 2008; Gustafson 2013; Haghiac 2015; Harris 2015; Jamilian 2016; Judge 2014; Keenan 2014; Khalili 2016; Krummel 2016; Min 2014; Min 2016; Mozurkewich 2013; Ramakrishnan 2010; Razavi 2017; Rees 2008; Samimi 2015; Taghizadeh 2016), and one used sequentially numbered opaque sealed envelopes and third party (pharmacy) controlled randomisation (Onwude 1995).
Selection bias
We judged that the risk of selection bias associated with allocation concealment was unclear for 40 trials (Bergmann 2007; Boris 2004; Bosaeus 2015; Chase 2015; de Groot 2004; Dilli 2018; England 1989; Freeman 2008; Furuhjelm 2009; Giorlandino 2013; Hauner 2012; Helland 2001; Horvaticek 2017; Hurtado 2015; Jamilian 2017; Judge 2007; Kaviani 2014; Knudsen 2006; Krauss‐Etschmann 2007; Laivuori 1993; Malcolm 2003; Martin‐Alvarez 2012; Miller 2016; Mulder 2014; Noakes 2012; Ogundipe 2016; Otto 2000; Pietrantoni 2014; Ranjkesh 2011; Ribeiro 2012; Rivas‐Echeverria 2000; Sanjurjo 2004; Smuts 2003a; Smuts 2003b; Su 2008; Tofail 2006; Valenzuela 2015; Van Goor 2009; Van Winden 2017; Vaz 2017), with either no methods of concealment detailed, or the methods described lacking sufficient detail. We judged one trial to be at high risk of selection bias, as alternation was used (odd and even numbers) (Mardones 2008).
Blinding
Blinding of participants and personnel
We judged blinding of participants and personnel to be adequate in 52 of the 70 included trials (Bergmann 2007; Bisgaard 2016; Bulstra‐Ramakers 1994; Carlson 2013; D'Almedia 1992; Dilli 2018; Dunstan 2008; Freeman 2008; Furuhjelm 2009; Giorlandino 2013; Gustafson 2013; Haghiac 2015; Harper 2010; Harris 2015; Helland 2001; Horvaticek 2017; Hurtado 2015; Ismail 2016; Jamilian 2016; Jamilian 2017; Judge 2007; Judge 2014; Kaviani 2014; Keenan 2014; Khalili 2016; Krauss‐Etschmann 2007; Krummel 2016; Laivuori 1993; Makrides 2010; Malcolm 2003; Miller 2016; Min 2014; Min 2016; Mozurkewich 2013; Mulder 2014; Oken 2013; Olsen 2000; Onwude 1995; Ramakrishnan 2010; Ranjkesh 2011; Razavi 2017; Rees 2008; Rivas‐Echeverria 2000; Samimi 2015; Sanjurjo 2004; Smuts 2003a; Su 2008; Taghizadeh 2016; Tofail 2006; Van Goor 2009; Van Winden 2017; Vaz 2017). We judged the risk of performance bias to be high in three trials, due to inadequate blinding of women and/or trial personnel (Bosaeus 2015; Hauner 2012; Otto 2000). For the remaining 15 trials, we judged the risk of performance bias to be unclear (Ali 2017; Boris 2004; Chase 2015; de Groot 2004; England 1989; Knudsen 2006; Mardones 2008; Martin‐Alvarez 2012; Noakes 2012; Ogundipe 2016; Olsen 1992; Pietrantoni 2014; Ribeiro 2012; Smuts 2003b; Valenzuela 2015). Eleven of these trials did not provide sufficient information to allow confident assessment of blinding (Ali 2017; Chase 2015; de Groot 2004; England 1989; Knudsen 2006; Martin‐Alvarez 2012; Noakes 2012; Ogundipe 2016; Pietrantoni 2014; Ribeiro 2012; Valenzuela 2015). Two trials reported that blinding of participants was partial (the no‐treatment groups were aware of this) (Boris 2004; Olsen 1992), and another two trials used food interventions which could not be fully blinded (Mardones 2008; Smuts 2003b).
Blinding of outcome assessors
Thirty‐nine trials clearly indicated that blinded trial personnel were involved in outcome assessment or data collection, and we judged them to be at low risk of detection bias (Bergmann 2007; Bisgaard 2016; Bulstra‐Ramakers 1994; Carlson 2013; D'Almedia 1992; Dunstan 2008; Freeman 2008; Furuhjelm 2009; Giorlandino 2013; Haghiac 2015; Harper 2010; Harris 2015; Helland 2001; Hurtado 2015; Ismail 2016; Jamilian 2016; Judge 2014; Keenan 2014; Khalili 2016; Krauss‐Etschmann 2007; Krummel 2016; Laivuori 1993; Makrides 2010; Miller 2016; Min 2014; Min 2016; Mulder 2014; Noakes 2012; Oken 2013; Olsen 2000; Onwude 1995; Ramakrishnan 2010; Razavi 2017; Rees 2008; Samimi 2015; Smuts 2003a; Su 2008; Taghizadeh 2016; Tofail 2006). One trial reported that, except for ultrasound measurements (e.g. for fat mass measurements), assessors were not blinded and we judged to be at high risk of detection bias (Hauner 2012). For the remaining trials, we judged the risk of detection bias to be unclear, as most of them provided insufficient details about whether assessors and/or data collectors were blinded (Ali 2017; Boris 2004; Bosaeus 2015; Chase 2015; de Groot 2004; Dilli 2018; England 1989; Gustafson 2013; Horvaticek 2017; Jamilian 2017; Judge 2007; Kaviani 2014; Knudsen 2006; Malcolm 2003; Mardones 2008; Martin‐Alvarez 2012; Mozurkewich 2013; Ogundipe 2016; Olsen 1992; Otto 2000; Pietrantoni 2014; Ranjkesh 2011; Ribeiro 2012; Rivas‐Echeverria 2000; Sanjurjo 2004; Valenzuela 2015; Van Goor 2009; Van Winden 2017; Vaz 2017).
Incomplete outcome data
We judged 13 trials to be at low risk of attrition bias, with minimal losses to follow‐up, and similar numbers/reasons for losses to follow‐up in each group (Bisgaard 2016; Harper 2010; Jamilian 2017; Makrides 2010; Mozurkewich 2013; Olsen 1992; Olsen 2000; Onwude 1995; Otto 2000; Ranjkesh 2011; Razavi 2017; Samimi 2015; Valenzuela 2015).
We judged 27 trials to be at a high risk of attrition bias (Boris 2004; Bosaeus 2015; de Groot 2004; Dilli 2018; Freeman 2008; Haghiac 2015; Harris 2015; Hauner 2012; Helland 2001; Horvaticek 2017; Hurtado 2015; Judge 2007; Judge 2014; Knudsen 2006; Krauss‐Etschmann 2007; Krummel 2016; Laivuori 1993; Malcolm 2003; Mardones 2008; Min 2014; Rees 2008; Smuts 2003b; Su 2008; Tofail 2006; Van Goor 2009; Van Winden 2017; Vaz 2017). See Characteristics of included studies for further details.
We judged the remaining 30 trials to be at an unclear risk of attrition bias, often due to incomplete or unclear reporting, and complexity in some of the trials with several periods of childhood follow‐up (Ali 2017; Bergmann 2007; Bulstra‐Ramakers 1994; Carlson 2013; Chase 2015; D'Almedia 1992; Dunstan 2008; England 1989; Furuhjelm 2009; Giorlandino 2013; Gustafson 2013; Ismail 2016; Jamilian 2016; Judge 2007; Kaviani 2014; Keenan 2014; Khalili 2016; Martin‐Alvarez 2012; Miller 2016; Min 2016; Mulder 2014; Noakes 2012; Ogundipe 2016; Oken 2013; Pietrantoni 2014; Ramakrishnan 2010; Rivas‐Echeverria 2000; Smuts 2003a; Taghizadeh 2016; Van Goor 2009).
Selective reporting
We judged 13 trials to be at a low risk of reporting bias, as they provided data for the prespecified and/or expected outcomes (including from the published protocols) (Bergmann 2007; Bisgaard 2016; Carlson 2013; Harper 2010; Khalili 2016; Jamilian 2016; Makrides 2010; Mozurkewich 2013; Olsen 1992; Smuts 2003a; Taghizadeh 2016; Tofail 2006; Van Goor 2009). We judged 45 trials to be at an unclear risk of reporting bias (Ali 2017; Boris 2004; Bosaeus 2015; Bulstra‐Ramakers 1994; Chase 2015; D'Almedia 1992; de Groot 2004; Dilli 2018; Dunstan 2008; England 1989; Furuhjelm 2009; Giorlandino 2013; Haghiac 2015; Harris 2015; Hauner 2012; Helland 2001; Hurtado 2015; Ismail 2016; Jamilian 2017; Judge 2007; Keenan 2014; Krauss‐Etschmann 2007; Krummel 2016; Laivuori 1993; Malcolm 2003; Mardones 2008; Martin‐Alvarez 2012; Miller 2016; Min 2014; Min 2016; Mulder 2014; Noakes 2012; Ogundipe 2016; Oken 2013; Olsen 2000; Ramakrishnan 2010; Ranjkesh 2011; Razavi 2017; Ribeiro 2012; Samimi 2015; Sanjurjo 2004; Smuts 2003b; Valenzuela 2015; Van Winden 2017; Vaz 2017). For the majority of these trials there was insufficient information to permit us to assess selective reporting confidently (i.e. no access to a published trial protocol). We judged the remaining 12 trials to be at a high risk of reporting bias (Freeman 2008; Gustafson 2013; Horvaticek 2017; Judge 2014; Kaviani 2014; Knudsen 2006; Onwude 1995; Otto 2000; Pietrantoni 2014; Rees 2008; Rivas‐Echeverria 2000; Su 2008).
Kaviani 2014; Knudsen 2006; Pietrantoni 2014 and Rivas‐Echeverria 2000 each reported only one of the expected or prespecified outcomes. Freeman 2008, Gustafson 2013; Judge 2014; Otto 2000; and Rees 2008 reported few of the prespecified or expected outcomes. Onwude 1995 reported a limited range of expected outcomes and incomplete data (no standard deviations) for two of the continuous outcomes (length of gestation and birthweight). Su 2008 reported few of the expected outcomes, and data were incomplete for birth outcomes.
Other potential sources of bias
We judged 34 trials to be at a low risk of other potential sources of bias (Ali 2017; Bergmann 2007; Bisgaard 2016; Boris 2004; Carlson 2013; England 1989; Furuhjelm 2009; Giorlandino 2013; Gustafson 2013; Harper 2010; Harris 2015; Hurtado 2015; Ismail 2016; Jamilian 2016; Jamilian 2017; Khalili 2016; Knudsen 2006; Krauss‐Etschmann 2007; Makrides 2010; Mozurkewich 2013; Noakes 2012; Olsen 1992; Olsen 2000; Onwude 1995; Otto 2000; Pietrantoni 2014; Ramakrishnan 2010; Ranjkesh 2011; Razavi 2017; Samimi 2015; Smuts 2003a; Taghizadeh 2016; Valenzuela 2015; Van Goor 2009). We judged another 34 trials to be at an unclear risk of other potential sources of bias (Bosaeus 2015; Bulstra‐Ramakers 1994; Chase 2015; D'Almedia 1992; de Groot 2004; Dilli 2018; Dunstan 2008; Freeman 2008; Haghiac 2015; Hauner 2012; Helland 2001; Horvaticek 2017; Judge 2007; Judge 2014; Kaviani 2014; Keenan 2014; Krummel 2016; Malcolm 2003; Mardones 2008; Martin‐Alvarez 2012; Miller 2016; Min 2014; Min 2016; Mulder 2014; Ogundipe 2016; Oken 2013; Ribeiro 2012; Rivas‐Echeverria 2000; Sanjurjo 2004; Smuts 2003b; Su 2008; Tofail 2006; Van Winden 2017; Vaz 2017). We judged the remaining two trials, Laivuori 1993 and Rees 2008, to be at a high risk of other bias. In Laivuori 1993 there were substantial differences in the median length of supplementation between the three groups, which was a significant source of other bias, while in Rees 2008 women in the placebo group were more likely to have a co‐morbid anxiety disorder (9/13 versus 3/13), which introduced significant baseline imbalance between groups that was relevant to all reported outcomes.
Effects of interventions
See: Summary of findings for the main comparison Birth/infant outcomes; Summary of findings 2 Maternal outcomes; Summary of findings 3 Child/adult outcomes; Summary of findings 4 Health service outcomes
Omega‐3 supplementation versus no omega‐3
Primary outcomes
Preterm birth (< 37 weeks)
There was an 11% reduced risk of preterm birth (< 37 weeks) for omega‐3 LCPUFA compared with no omega‐3 (risk ratio (RR) 0.89, 95% confidence interval (CI) 0.81 to 0.97; 26 trials, 10,304 participants; high‐quality evidence; Analysis 1.1). Some asymmetry was observed on visual assessment of a funnel plot for this outcome, suggesting an absence of some small negative studies (Figure 4), with little likely impact on the overall result.

Funnel plot of comparison: 1 Omega‐3 versus placebo/no omega‐3: OVERALL, outcome: 1.7 Preterm birth (< 37 weeks).
Early preterm birth (< 34 weeks)
There was a 42% lower risk of early preterm birth (< 34 weeks) for omega‐3 LCPUFA compared with no omega‐3 (RR 0.58, 95% CI 0.44 to 0.77; 9 trials, 5204 participants; high‐quality evidence; Analysis 1.2).
Mother: secondary outcomes
Maternal death
Only four trials reported on maternal death (Bisgaard 2016; Makrides 2010; Oken 2013; Olsen 2000), with one maternal death reported in the omega‐3 group in Oken 2013. There was no evidence of a difference in the risk of maternal death for omega‐3 compared with no omega‐3 (RR 1.69, 95% CI 0.07 to 39.30; 4 trials, 4830 participants; Analysis 1.4).
Pre‐eclampsia (hypertension with proteinuria)
Pre‐eclampsia (hypertension with proteinuria) may be reduced for omega‐3 LCPUFA compared with no omega‐3 group (RR 0.84, 95% CI 0.69 to 1.01, 20 trials, 8306 participants; low‐quality evidence; Analysis 1.5). No obvious asymmetry was observed on visual assessment of a funnel plot for this outcome (Figure 5).
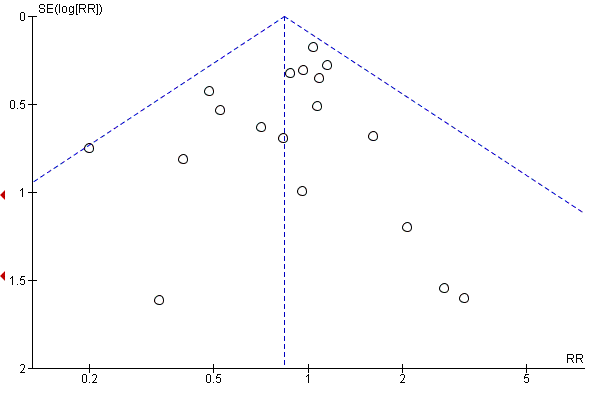
Funnel plot of comparison: 1 Omega‐3 versus placebo/no omega‐3: OVERALL, outcome: 1.4 Pre‐eclampsia (hypertension with proteinuria).
High blood pressure (without proteinuria)
There was no evidence of a difference in the risk of high blood pressure (without proteinuria) for omega‐3 LCPUFA compared with no omega‐3 (RR 1.03, 95% CI 0.89 to 1.20; 7 trials, 4531 participants; Analysis 1.6).
Eclampsia
Only one trial reported on eclampsia (D'Almedia 1992), and indicated no clear difference between omega‐3 LCPUFA and no omega‐3 (RR 0.14, 95% CI 0.01 to 2.70; 1 trial; 100 participants; Analysis 1.7).
Maternal antepartum hospitalisation
There was no evidence of a difference in risk of maternal antepartum hospitalisation between omega‐3 LCPUFA and no omega‐3 overall (RR 0.92, 95% CI 0.81 to 1.04; 5 trials, 2876 participants; Analysis 1.8).
Mother's length of stay in hospital (days)
Bisgaard 2016 and Olsen 2000 were the only trials to report data on the mother's length of stay in hospital, and showed no clear differences between omega‐3 LCPUFA and no omega‐3 (MD 0.18 days, 95% CI ‐0.20 to 0.57; 2 trials, 2290 participants; Analysis 1.9).
Maternal anaemia
Only Olsen 2000 reported on maternal anaemia and no difference was seen between omega‐3 LCPUFA and no omega‐3 (RR 1.16, 95% CI 0.91 to 1.48; 846 participants; Analysis 1.10).
Miscarriage (< 24 weeks)
There was no clear difference in miscarriage risk (< 24 weeks) for omega‐3 LCPUFA compared with no omega‐3 (RR 1.07, 95% CI 0.80 to 1.43; 9 trials, 4190 participants; Analysis 1.11).
Antepartum vaginal bleeding
There was no evidence of a difference in risk of antepartum vaginal bleeding for omega‐3 LCPUFA compared with no omega‐3 overall (RR 1.01, 95% CI 0.69 to 1.48; 2 trials, 2151 participants; Analysis 1.12).
Rupture of membranes
Carlson 2013, Harris 2015, Pietrantoni 2014 and Smuts 2003a reported on rupture of membranes (prelabour and preterm prelabour), and showed a lower risk overall with omega‐3 LCPUFA compared with no omega‐3 (RR 0.46, 95% CI 0.28 to 0.76; 4 trials, 1281 participants. The separate results for prelabour and preterm prelabour rupture are shown in Analysis 1.13.
Maternal admission to intensive care
Two trials reported on maternal admission to intensive care (Makrides 2010; Taghizadeh 2016), and saw no evidence of a difference in risk between omega‐3 LCPUFA and no omega‐3 (RR 0.56, 95% CI 0.12 to 2.63; 2 trials, 2458 participants; low‐quality evidence; Analysis 1.14).
Maternal adverse events
Overall 16 trials reported on one or more maternal adverse effects. Using a random‐effects model, there was no evidence of a difference in the risk of: severe adverse events (RR 1.04, 95% CI 0.40 to 2.72; 2 trials, 2690 participants; low‐quality evidence), adverse events severe enough for cessation (RR 1.01, 95% CI 0.53 to 1.93; 6 trials, 1487 participants), any adverse effects (RR 1.38, 95% CI 1.16 to 1.65; I2 = 88%; 5 trials, 1480 participants), possibly due to higher reports of belching/burping in the omega‐3 LCPUFA group of Olsen 2000, and fewer reports of labour‐related complications in the omega‐3 LCPUFA group of Smuts 2003a (Analysis 1.15).
Very few differences were seen for individual adverse events, although unpleasant taste and belching/burping were more likely to be reported with omega‐3 LCPUFA than with no omega‐3 (Analysis 1.15).
Caesarean section
There was no evidence of a difference in the risk of caesarean section in omega‐3 LCPUFA compared with no omega‐3 (RR 0.97, 95% CI 0.91 to 1.03; 28 trials, 8481 participants; Analysis 1.16). No clear asymmetry was observed on visual assessment of a funnel plot for this outcome, although there was some indication that small negative trials may be missing (Figure 6). However this would be unlikely to affect the null findings.

Funnel plot of comparison: 1 Omega‐3 versus placebo/no omega‐3: OVERALL, outcome: 1.16 Caesarean section.
Induction (post‐term)
Three trials reported on induction post‐term (Harris 2015; Hauner 2012; Makrides 2010). The effect of omega‐3 on post‐term induction is uncertain due to the wide confidence intervals and variation between the results of the studies (average RR 0.82, CI 0.22 to 2.98; 2900 participants, 3 trials; Tau2 = 0.70, P = 0.04, I2 = 77%; low‐quality evidence; Analysis 1.17).
Blood loss at birth (mL)
There was no evidence of a difference in maternal blood loss at birth between omega‐3 LCPUFA and no omega‐3 (MD 11.50 mL, 95% CI ‐6.75 to 29.76; 6 trials, 2776 participants; Analysis 1.18).
Postpartum haemorrhage
Four trials reported on postpartum haemorrhage (Carlson 2013;Harper 2010; Makrides 2010; Olsen 1992), and found no evidence of a difference between omega‐3 LCPUFA and no omega‐3 (RR 1.03, 95% CI 0.82 to 1.30; 4 trials, 4085 participants; Analysis 1.19).
Gestational diabetes
There was no evidence of a difference in the risk of GDM for omega‐3 LCPUFA compared with no omega‐3 (RR 1.02, 95% CI 0.83 to 1.26; 12 trials, 5235 participants; Analysis 1.20). No obvious asymmetry was observed on visual assessment of a funnel plot for this outcome (Figure 7).

Funnel plot of comparison: 1 Omega‐3 versus placebo/no omega‐3: OVERALL, outcome: 1.20 Gestational diabetes.
Maternal insulin resistance (HOMA‐IR)
Only three trials reported on maternal insulin resistance (HOMA‐IR) (Krummel 2016; Samimi 2015; Taghizadeh 2016), and showed no clear differences overall for omega‐3 LCPUFA compared with no omega‐3 (average MD ‐0.85, 95% CI ‐2.50 to 0.80; Tau² = 1.82; P = 0.0008; I² = 86%; 176 participants; Analysis 1.21). The high statistical heterogeneity may be due to different populations (overweight/obese women in Krummel 2016 and women with GDM in the other two trials).
Excessive gestational weight gain
Only Carlson 2013 reported on excessive gestational weight gain, and observed no evidence of a difference in the risk between omega‐3 LCPUFA and no omega‐3 groups (RR 1.21, 95% CI 0.95 to 1.55; 350 participants; Analysis 1.22).
Gestational weight gain (kg)
There was no evidence of a difference in gestational weight gain for omega‐3 LCPUFA compared with no omega‐3 (MD ‐0.50 kg, 95% CI ‐0.68 to 0.59; 11 trials; random effects; Tau² = 0.60; P = 0.0006; I² = 59%; 2297 participants; Analysis 1.23). The funnel plot was not markedly asymmetric (Figure 8). Dilli 2018 contributed to the high statistical heterogeneity, with a 3 kg lower gain in the omega‐3 LCPUFA group compared with placebo.

Funnel plot of comparison: 1 Overall: omega‐3 versus no omega‐3, outcome: 1.23 Gestational weight gain (kg).
Depression during pregnancy: thresholds
Carlson 2013, Su 2008 and Vaz 2017 reported on different thresholds for depression during pregnancy (using the Hamilton Rating Scale for Depression (HAM‐D), Edinburgh Postnatal Depression Scale (EPDS) and not specified), and showed no evidence of a difference between omega‐3 LCPUFA and no omega‐3 for each trial (Analysis 1.24).
Depression during pregnancy: scores
Depression scores during pregnancy were reported by five trials using four different methods (Beck Depression Inventory (BDI), HAM‐D, EPDS and the Montgomery–Åsberg Depression Rating Scale (MADRS)). Only BDI showed a result favouring omega‐3 LCPUFA over no omega‐3 (MD ‐5.86 points 95% CI ‐8.32 to ‐3.39; 2 trials, 104 participants) with the other three comparisons showing no evidence of an effect (Analysis 1.25).
Anxiety during pregnancy
Only Carlson 2013 reported on anxiety during pregnancy, and observed no evidence of a difference between omega‐3 LCPUFA and no omega‐3 (RR 0.95, 95% CI 0.06 to 15.12; 301 participants; Analysis 1.26).
Difficult life circumstances (maternal)
Only Keenan 2014 reported on difficult life circumstances (maternal), indicating no evidence of a difference between omega‐3 LCPUFA and no omega‐3 (MD 0.32, 95% CI ‐0.15 to 0.79; 51 participants; Analysis 1.27).
Stress (maternal)
Keenan 2014 was also the only trial to report on maternal stress, showing no important difference between omega‐3 LCPUFA and no omega‐3 as measured by the perceived stress scale (MD ‐1.82 points, 95% CI ‐3.68 to 0.04; 51 participants; Analysis 1.28).
Depressive symptoms postpartum: thresholds
Postpartum depression scores were reported by four trials using three different methods (Postpartum Depression Screening Scale (PDSS) ≥ 80, EPDS, and major depressive disorder), with none of the trials showing clear differences between omega‐3 LCPUFA and no omega‐3 (Analysis 1.29).
Depressive symptoms postpartum: scores
Only two trials reported on scores for postpartum depressive symptoms (Judge 2014; Mozurkewich 2013), and found no clear differences between omega‐3 LCPUFA and no omega‐3 for either BDI, PDSS overall or components of PDSS up to six months postpartum (Analysis 1.30).
Length of gestation (days)
There was an increase in length of gestation with omega‐3 LCPUFA compared with no omega‐3 (average MD 1.67 days, 95% CI 0.95 to 2.39; Tau² = 2.33; P < 0.0001; I² = 52%; 41 trials, 12,517 participants; moderate‐quality evidence; Analysis 1.31). Reasons for the high statistical heterogeneity are not readily apparent, although there were wide variations in populations, inclusion criteria and doses of omega‐3. Additionally, it was not always clear how length of gestation was determined and this may have varied across studies. No obvious asymmetry was observed on visual assessment of a funnel plot for this outcome (Figure 9).

Funnel plot of comparison: 1 OVERALL omega‐3 versus placebo/no omega‐3, outcome: 1.31 Length of gestation (days).
Baby/infant/child
Perinatal death
There were fewer perinatal deaths in the omega‐3 LCPUFA groups than the no omega‐3 groups, though this did not reach conventional statistical significance (RR 0.75, 95% CI 0.54 to 1.03; 10 trials, 7416 participants; moderate‐quality evidence; Analysis 1.32). No obvious asymmetry was observed on visual assessment of a funnel plot for this outcome (Figure 10).

Funnel plot of comparison: 1 OVERALL omega‐3 versus no omega‐3, outcome: 1.32 Perinatal death.
Stillbirth
No clear differences in stillbirth were seen between omega‐3 LCPUFA and no omega‐3 (RR 0.94, 95% CI 0.62 to 1.42; 16 trials, 7880 participants; Analysis 1.33). No obvious asymmetry was observed on visual assessment of a funnel plot for this outcome (Figure 11).

Funnel plot of comparison: 1 Omega‐3 versus placebo/no omega‐3: OVERALL, outcome: 1.32 Stillbirth.
Neonatal death
No clear difference between omega‐3 LCPUFA and no omega‐3 was seen for neonatal death (RR 0.61, 95% CI 0.34 to 1.11; 9 trials, 7448 participants; Analysis 1.34).
Infant death
Four trials reported on infant death (Carlson 2013; Makrides 2010; Mulder 2014; Tofail 2006), and observed no evidence of a difference in risk between the omega‐3 LCPUFA and no omega‐3 groups (RR 0.74, 95% CI 0.25 to 2.19; 3239 participants; Analysis 1.35).
Large‐for‐gestational age
Six trials reported on large‐for‐gestational age (generally defined as greater than the 90th percentile) (Dilli 2018; Harper 2010; Hauner 2012; Makrides 2010; Min 2014; Taghizadeh 2016), with a possible small increase in risk with omega‐3 LCPUFA than no omega‐3 (RR 1.15, 95% CI 0.97 to 1.03; 3722 participants; moderate‐quality evidence; Analysis 1.36). This outcome was not prespecified in the protocol.
Macrosomia
For macrosomia (generally defined as birthweight < 4000 g), no clear differences were seen between omega‐3 LCPUFA and no omega‐3 (RR 0.69, 95% CI 0.43 to 1.13; 6 trials, 2008 participants; Analysis 1.37). This outcome was not prespecified in the protocol.
Low birthweight (< 2500 g)
Rates of low birthweight (< 2500 g) showed a 10% relative risk reduction with omega‐3 LCPUFA compared with no omega‐3 (RR 0.90, 95% CI 0.82 to 0.99; 15 trials, 8449 participants; high‐quality evidence Analysis 1.38). No obvious asymmetry was observed on visual assessment of a funnel plot for this outcome (Figure 12).
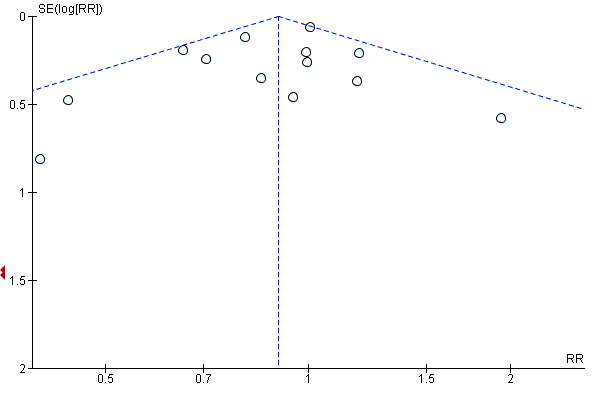
Funnel plot of comparison: 1 Omega‐3 versus placebo/no omega‐3: OVERALL, outcome: 1.38 Low birthweight (< 2500 g).
Small‐for‐gestational age or intrauterine growth restriction (IUGR)
There was little or no evidence of a difference in risk of small‐for‐gestational age or IUGR between omega‐3 LCPUFA and no omega‐3 (RR 1.01, 95% CI 0.90 to 1.13; 8 trials, 6907 participants; moderate‐quality evidence; Analysis 1.39).
Birthweight (g)
Birthweight was higher in the omega‐3 LCPUFA group than the no omega‐3 group (average MD 75.74 g, 95% CI 38.05 to 113.43; Tau² = 7943.10; P < 0.00001; I² = 66%; 42 trials, 11,584 participants; Analysis 1.40). Reasons for the high statistical heterogeneity were not readily apparent, although there was a wide variation in birthweights between studies and inclusion criteria. No obvious asymmetry was observed on visual assessment of a funnel plot for this outcome (Figure 13).

Funnel plot of comparison: 1 Omega‐3 versus placebo/no omega‐3: OVERALL, outcome: 1.41 Birthweight (g).
Birthweight Z score
Four trials reported on birthweight Z score (Bergmann 2007; Krummel 2016; Makrides 2010; Mulder 2014), and there was no evidence of a difference between omega‐3 LCPUFA and no omega‐3 (MD 0.06, 95% CI ‐0.02 to 0.13; 2792 participants; Analysis 1.41).
Birth length (cm)
There was no evidence of a difference in birth length for omega‐3 LCPUFA compared with no omega‐3 (MD 0.11 cm, 95% CI ‐0.10 to 0.31; Tau² = 0.13; P = 0.0001, I² = 57%; 28 trials, 8128 participants; Analysis 1.42). No clear asymmetry was observed on visual assessment of a funnel plot for this outcome (Figure 14).

Funnel plot of comparison: 1 Omega‐3 versus placebo/no omega‐3: OVERALL, outcome: 1.43 Birth length (cm).
Head circumference at birth (cm)
There was no evidence of a difference in head circumference at birth for omega‐3 LCPUFA compared with no omega‐3 (average MD 0.07 cm, 95% CI ‐0.05 to 0.19; 22 trials, 7161 participants; Tau² 0.02, P = 0.06, I² = 33%, Analysis 1.43). No clear asymmetry was observed on visual assessment of a funnel plot for this outcome (Figure 15).

Funnel plot of comparison: 1 Omega‐3 versus placebo/no omega‐3: OVERALL, outcome: 1.45 Head circumference at birth (cm).
Head circumference at birth Z score
Only two trials reported on head circumference at birth Z score (Krummel 2016; Makrides 2010), and there was no evidence of a difference between the omega‐3 LCPUFA and no omega‐3 groups (MD ‐0.03, 95% CI ‐0.14 to 0.07; 2462 participants; Analysis 1.44).
Length at birth Z score
Only two trials reported on length at birth Z score (Krummel 2016; Makrides 2010), and observed no clear difference between omega‐3 LCPUFA and no omega‐3 (average MD 0.18, 95% CI ‐0.18 to 0.54; Tau² = 0.05; P = 0.12; I² = 59%; 2462 participants; Analysis 1.45).
Baby admitted to neonatal care
There was an 8% relative reduced risk of a baby being admitted to neonatal care with omega‐3 LCPUFA compared with no omega‐3, although this did not reach conventional statistical significance (RR 0.92, 95% CI 0.83 to 1.03; 9 trials, 6920 participants; Analysis 1.46).
Infant length of stay in hospital (days)
Only Olsen 2000 reported on infant length of stay in hospital and observed no evidence of a difference in length between the omega‐3 LCPUFA and no omega‐3 groups (MD 0.11 days, 95% CI ‐1.40 to 1.62; 2014 participants; Analysis 1.47).
Congenital anomalies
Three trials reported on congenital anomalies (Carlson 2013; Olsen 1992; Ramakrishnan 2010), and observed no clear difference between the omega‐3 LCPUFA and no omega‐3 groups (RR 1.08, 95% CI 0.61 to 1.92; 1807 participants; Analysis 1.48).
Retinopathy of prematurity
Only one trial reported on retinopathy of prematurity (Harper 2010), and there was no clear difference between the omega‐3 LCPUFA and no omega‐3 groups (RR 1.20, 95% CI 0.32 to 4.44; 837 participants; Analysis 1.49).
Bronchopulmonary dysplasia
Only Harper 2010 and Makrides 2010 reported on bronchopulmonary dysplasia, and there was no clear difference between the omega‐3 LCPUFA and no omega‐3 groups (RR 1.06, 95% CI 0.45 to 2.48; 3191 participants; Analysis 1.50).
Respiratory distress syndrome
Two trials reported on respiratory distress syndrome (Carlson 2013; Harper 2010), and found no clear difference between the omega‐3 LCPUFA and no omega‐3 groups (average RR 1.17, 95% CI 0.54 to 2.52; Tau² = 0.21; P = 0.09; I² = 66%; 1129 participants; Analysis 1.51). Reasons for the statistical heterogeneity were not readily apparent although all the women in Harper 2010 had experienced a previous preterm birth and were treated with weekly intramuscular progesterone injections.
Necrotising enterocolitis (NEC)
Only Harper 2010 and Makrides 2010 reported on NEC, and found no clear difference between the omega‐3 LCPUFA and no omega‐3 groups (RR 0.97, 95% CI 0.26 to 3.55; 3198 participants; Analysis 1.52).
Neonatal sepsis (proven)
Harper 2010, Helland 2001 and Makrides 2010 reported on proven neonatal sepsis, and found no evidence of a difference in risk between the omega‐3 LCPUFA and no omega‐3 groups (RR 0.97, 95% CI 0.44 to 2.14; 3788 participants; Analysis 1.53).
Convulsion
Only Makrides 2010 reported on convulsion, and observed no clear difference between the omega‐3 LCPUFA and no omega‐3 groups (RR 0.09, 95% CI 0.01 to 1.63; 2361 participants; Analysis 1.54).
Intraventricular haemorrhage
Three trials reported on intraventricular haemorrhage (Harper 2010; Makrides 2010; Olsen 2000), and found no evidence of a difference in risk between the omega‐3 LCPUFA and no omega‐3 groups in any intraventricular haemorrhage (RR 1.00, 95% CI 0.29 to 3.49; random effects; Tau² = 0.63; P = 0.12, I² = 53%; 5423 participants). Although Makrides 2010 showed a marked reduction in intraventricular haemorrhage, reasons for the statistical heterogeneity were not clear. Harper 2010 also reported Grade 3 or 4 intraventricular haemorrhage, finding no clear differences between omega‐3 LCPUFA and no omega‐3 (RR 1.60, 95% CI 0.38 to 6.65; 837 participants; Analysis 1.55).
Neonatal/infant adverse events
There was possibly a small decrease for any adverse events in neonates/infants with omega‐3 LCPUFA compared with no omega‐3 (RR 0.92, 95% CI 0.82 to 1.02; 2 trials, 592 participants; Analysis 1.56). For serious neonatal/infant adverse events, there was a reduced risk with omega‐3 LCPUFA compared with no omega‐3 (RR 0.72, 95% CI 0.53 to 0.99; 2 trials, 2690 participants; low‐quality evidence; Analysis 1.56).
Neonatal/infant morbidity
One trial of 291 infants reported on neonatal/infant cardiovascular, respiratory or morbidity caused by pregnancy/birth (Smuts 2003a), and found no evidence of difference between omega‐3 LCPUFA and no omega‐3 (Analysis 1.57; Analysis 1.58 and Analysis 1.59 respectively).
Another trial with 834 participants reported on neonatal/infant morbidity (Ramakrishnan 2010), and found no important differences in rates between omega‐3 LCPUFA and no omega‐3 for colds, fevers, rash, respiratory illnesses, vomiting, diarrhoea or other illnesses up to six months of age (Analysis 1.60).
Infant/child morbidity
Makrides 2010 reported on infant/child morbidity, and found a potentially reduced risk of ICU admissions for omega‐3 LCPUFA compared with no omega‐3 (RR 0.58, 95% CI 0.31 to 1.06; 1396 participants, but no clear differences for medical diagnosis of attention deficit hyperactivity disorder; autism spectrum disorder; other learning/behavioural disorders or other chronic health conditions; Analysis 1.61).
Ponderal index (g/m³ x 100)
There was no evidence of a difference in ponderal index between the omega‐3 LCPUFA and no omega‐3 groups (MD 0.05 g/m³ x 100, 95% CI ‐0.01 to 0.11; random effects, Tau² = 0.00, P = 0.07, I² = 50%, 6 trials, 887 participants; Analysis 1.62).
Infant/child weight (kg)
A total of 10 trials reported on infant/child weight at various time points, and there was no evidence of a difference between the omega‐3 LCPUFA and no omega‐3 groups at any of the time points from six weeks to seven years of age (Analysis 1.63).
Infant/child length/height (cm)
Ten trials reported on length/height at various time points, and there was no evidence of a difference between the omega‐3 and no omega‐3 groups from six weeks to five years. However there was evidence of child height being lower in the omega‐3 LCPUFA compared with no omega‐3 groups at seven years (MD ‐1.22 cm 95% CI ‐2.29 to ‐0.16; 2 trials, 393 participants; Analysis 1.64).
Infant/child head circumference (cm)
A total of 10 trials reported on infant/child head circumference at various time points, and there was no evidence of a difference between the omega‐3 LCPUFA and no omega‐3 groups at any of the time points from six weeks to six years of age (Analysis 1.65).
Infant/child length/height for age Z score (LAZ/HAZ)
Three trials reported on infant/child length/height for age Z score (LAZ/HAZ) at various time points (Mulder 2014; Ramakrishnan 2010; Tofail 2006), and observed no evidence of a difference between the omega‐3 LCPUFA and no omega‐3 groups at any of the time points from two months to five years (Analysis 1.66).
Infant/child waist circumference (cm)
Hauner 2012 and Makrides 2010 reported on infant/child waist circumference at various time points, and observed no evidence of a difference between the omega‐3 LCPUFA and no omega‐3 groups at any of the time points from two to five years (Analysis 1.67).
Infant/child weight‐for‐age Z score (WAZ)
Mulder 2014 and Ramakrishnan 2010 reported on infant/child weight‐for‐age Z score (WAZ) at various time points, and observed no evidence of a difference between the omega‐3 LCPUFA and no omega‐3 groups at any of the time points from one month to five years (Analysis 1.68).
Infant/child BMI Z score
Five trials reported on infant/child BMI Z score at various time points (Bergmann 2007; Carlson 2013; Ramakrishnan 2010; Krummel 2016; Makrides 2010), and found no evidence of a difference between the omega‐3 LCPUFA and no omega‐3 groups between any of the time points from 18 months to seven years of age (Analysis 1.69).
Infant/child weight for length/height Z score (WHZ)
Mulder 2014, Ramakrishnan 2010 and Tofail 2006 reported on infant/child weight for length/height Z score (WHZ) at various time points and there was no evidence of a difference between the omega‐3 LCPUFA and no omega‐3 groups at any of the time points from two months to 18 months old (Analysis 1.70).
Infant/child BMI percentile
Only Hauner 2012 reported on infant/child BMI percentile and there was no evidence of a difference between the omega‐3 LCPUFA and no omega‐3 groups at two, three and five years of age. However a higher infant/child BMI percentile was observed in the omega‐3 LCPUFA compared with the no omega‐3 group at 48 months (MD 13.00%; 95% CI 3.19 to 22.81; 107 participants; Analysis 1.71).
Child/adult BMI
Helland 2001, Makrides 2010; and Olsen 1992 reported on child/adult BMI at various time points and there was no evidence of a difference between the omega‐3 LCPUFA and no omega‐3 groups at any of the time points from three to 19 years of age (Analysis 1.72).
Infant/child body fat (%)
Carlson 2013, Hauner 2012 and Makrides 2010 reported on infant/child body fat at various time points, and found no evidence of differences at any points from one to seven years of age between the omega‐3 LCPUFA and no omega‐3 groups (Analysis 1.73).
Infant/child total fat mass (kg)
Hauner 2012 and Makrides 2010 reported on infant/child total fat mass at various time points, and found no evidence of differences at any points from one to seven years of age between the omega‐3 LCPUFA and no omega‐3 groups (Analysis 1.74).
Cognition: thresholds
Makrides 2010, Mulder 2014 and Ramakrishnan 2010 reported Bayley Scales of Infant Development (BSID) II or III cognition thresholds at 18 months, and found no evidence of differences between the omega‐3 LCPUFA and no omega‐3 groups, except for BSID III < 85, which favoured omega‐3 LCPUFA, in Makrides 2010 (RR 0.49, 95% CI 0.24 to 0.98; 726 participants; Analysis 1.75).
Cognition: scores
Nine trials reported cognition scores at various time points. There was no evidence of a difference in cognition scores between the omega‐3 LCPUFA and no omega‐3 groups at any time point from nine months to 12 years of age, as measured by BSID II or III, Fagan novelty preference, Kaufman Assessment Battery for Children (K‐ABC) mental processing composite, Griffith Mental Development Scale (GMDS) general quotient score, Differential Ability Scales (DAS) II, Wechsler Abbreviated Scale of Intelligence (WASI) full‐scale intelligence quotient (IQ) or Wechsler Intelligence Scale for Children (WISC) IV full scale IQ (Analysis 1.76).
Attention: scores
Three trials reported on attention scores at various time points and used different assessment measures (Krauss‐Etschmann 2007, Makrides 2010; Ramakrishnan 2010). There was no evidence of a difference between omega‐3 LCPUFA and no omega‐3 groups at any time point or with any measure from 27 months to 8.5 years except in Ramakrishnan 2010, where lower attention scores were seen at five years as measured by K‐CPT omissions (MD ‐1.90, 95% CI ‐3.39 to ‐0.41; 797 participants; Analysis 1.77).
Motor: thresholds
Two trials reported thresholds for motor scores (Mulder 2014; Ramakrishnan 2010), and observed no differences between omega‐3 LCPUFA and no omega‐3 groups at 18 months of age (Analysis 1.78).
Motor: scores
No difference was observed in motor scores between the omega‐3 LCPUFA and no omega‐3 groups, as measured by BSID III or II at 4 to 18 months of age across six trials (Analysis 1.79).
Language: thresholds
In one trial with 726 participants there was no evidence of a difference in BSID III language score thresholds between the omega‐3 LCPUFA and no omega‐3 groups at 18 months (Makrides 2010). Howevever in Mulder 2014 (154 participants), most Communicative Development Inventories (CDI) language thresholds were higher with omega‐3 LCPUFA in children at 14 and 18 months (Analysis 1.80).
Language: scores
No differences between omega‐3 LCPUFA and no omega‐3 were seen in any communication or language scores in children from four months to seven years of age, across four trials (Analysis 1.81).
Behaviour: thresholds
In one trial with 730 participants no differences between omega‐3 LCPUFA and no omega‐3 were seen in behaviour thresholds for children at 18 months of age (Analysis 1.82) (Ramakrishnan 2010).
Behaviour: scores
There were few differences between omega‐3 LCPUFA and no omega‐3 in behaviour scores in children measured with different tools and over different time points from birth to 12 years. However, there was evidence of less difficult behaviour in the placebo compared with the omega‐3 LCPUFA group as measured by the Strengths and Difficulties Questionnaire (SDQ) Total Difficulties at six to nine years in Makrides 2010 (MD 1.08, 95% CI 0.18 to 1.98; 543 participants; Analysis 1.83).
Vision: visual acuity (cycles/degree)
Only Mulder 2014 and Judge 2007 reported on visual acuity, observing no evidence of a difference between groups at two, four or six months (Analysis 1.84).
Vision: visual evoked potential
Three trials reported visual evoked potential at various time points from birth to six months, with no important differences seen between omega‐3 and no omega‐3 (Analysis 1.85).
Hearing: brainstem auditory‐evoked responses
Only one trial reported on various ways of measuring brainstem auditory‐evoked responses from one to three months (Ramakrishnan 2010), and found no evidence of differences between the omega‐3 LCPUFA and no omega‐3 groups (Analysis 1.87).
Neurodevelopment (overall): thresholds
Three trials reported various measures of overall neurodevelopment from six months to five years, and observed no clear differences between the omega‐3 LCPUFA and no omega‐3 groups (Analysis 1.88).
Neurodevelopment (overall): scores
One trial reported components of the Ages and Stages Questionnaire (ASQ) at four and six months (Khalili 2016), and found no clear differences except for improved communication with omega‐3 LCPUFA at four months (MD 2.70 95% CI 0.41 to 4.99; 148 participants; Analysis 1.89).
Child Development Inventory
Only Hauner 2012 reported on the child development inventory (parent‐reported), and observed no clear differences between the omega‐3 LCPUFA and no omega‐3 groups, across a range of measures when children were five years old (Analysis 1.90).
Infant sleep behaviour
Only Judge 2007 reported on infant sleep behaviour, and found fewer arousals in quiet and active sleep with omega‐3 LCPUFA compared with no omega, but with no other differences between groups; 39 participants (Analysis 1.91).
Cerebral palsy
A single trial with 114 participants reported no cases of cerebral palsy in either the omega‐3 LCPUFA or the placebo group (Van Goor 2009) (Analysis 1.92).
None of the trials reported caesarean section (post‐term), jaundice, or use of community health services.
Subgroup analyses
By intervention type (Analysis 2)
Analyses were performed (where possible) based on type of omega‐3 intervention (omega‐3 LCPUFA supplements only; omega‐3 LCPUFA supplements, omega‐3 rich food and/or dietary advice; omega‐3 LCPUFA supplements and other agents; and omega‐3 supplements, omega‐3 LCPUFA rich food and other agents). No clear or important subgroup differences were revealed for any outcome except for:
-
birth length, where birth length was higher with omega‐3 LCPUFA supplements alone, or with omega‐3 rich food and/or diet advice; and lower when the intervention was omega‐3 LCPUFA combined with another non‐omega‐3 agent (Analysis 2.40).
However the small increase is not likely to be clinically meaningful.
By dose of DHA and EPA supplements (Analysis 3)
Subgroup analysis based on dose of omega‐3 supplements for low dose (≤ 500 mg/day) versus mid dose (500 mg to 1 g/day) versus high dose (> 1 g/day) revealed no clear or important difference for any of the 12 prespecified outcomes except for:
-
low birthweight, where the effect of low and mid doses of omega‐3 LCPUFA (500 mg to 1 g/day) appeared more pronounced in reducing low birthweight than high dose (Analysis 3.10); Chi² 6.17, P = 0.05, I² 67.6%; and
-
birthweight (Analysis 3.12); Chi² 8.34, P = 0.04, I² 64%, which appears to be driven by a single trial of flaxseed oil. When this trial is omitted, the subgroup analysis is no longer statistically significant.
Timing of intervention: gestational age when omega‐3 supplements commenced (Analysis 4)
Subgroup analysis based on the time when omega‐3 LCPUFA supplements started (≤ 20 weeks' gestation or > 20 weeks' gestation) revealed no clear or important differences for any of the 12 prespecified outcomes except for pre‐eclampsia (Analysis 4.4). However as the single trial contributing to the heterogeneity did not report timing of intervention (Rivas‐Echeverria 2000), this does not help elucidate the influence of timing start of supplement on this outcome.
Type of supplements (Analysis 5)
Subgroup analysis based on type of supplements (DHA/largely DHA versus mixed DHA/EPA versus mixed DHA/EPA/other) revealed no clear subgroup differences for the outcomes, except for:
-
pre‐eclampsia (likely due to the influence of a single study, Rivas‐Echeverria 2000), in the mixed DHA/EPA/other subgroup (Analysis 5.4); Chi² 7.58, P = 0.02, I² = 73.6%; and
-
caesarean section where incidence was higher in the mixed DHA/EPA subgroup (Analysis 5.5); Chi² 6.29, P = 0.04, I² = 68.2% than for the other DHA or EPA subgroups.
Risk (Analysis 6)
Analyses were performed based on risk of women ‐ low risk (healthy women or health condition unlikely to affect birth outcomes, e.g. allergy) versus increased/high risk (e.g. women with hypertension, gestational diabetes mellitus, depression, a history of preterm birth) versus mixed risk (no inclusion criteria related to maternal health risk, or health risk not reported). No clear or important subgroup differences were seen for any of the outcomes except low birthweight where studies with women at low or any risk showed a reduction compared with the studies involving women at increased or higher risk (Analysis 6.10); Chi² 6.24, P = 0.04, I² 67.9%.
Omega‐3 dose direct comparisons (Analysis 7)
One trial reported outcomes in 224 participants from a direct comparison of 600 mg and 300 mg DHA a day (Harris 2015); and another trial reported five different doses of DHA/EPA from 0.1 g/day to 2.8 g/day (which we collapsed into ≤ 1 g/day and > 1 g/day DHA/EPA) (Knudsen 2006). Knudsen 2006 only reported gestational length.
Primary outcomes
In one trial, no difference between doses was seen for:
-
early preterm birth (< 34 weeks) (RR 0.91, 95% CI 0.13 to 6.38; Analysis 7.1); or
-
prolonged gestation (> 42 weeks) (RR 0.91, 95% CI 0.06 to 14.44; Analysis 7.2) (Harris 2015).
Mother: secondary outcomes
One trial (Harris 2015), observed no evidence of a difference between women who received 600 mg DHA/day compared with 300 mg DHA/day for:
-
pre‐eclampsia (RR 0.91, 95% CI 0.06 to 14.44; Analysis 7.3);
-
induction post term (RR 0.10; 95% CI 0.01 to 1.87; Analysis 7.4);
-
premature rupture of membranes (RR 0.30, 95% CI 0.03 to 2.89; Analysis 7.5); or
-
premature prelabour rupture of membranes (RR 1.22, 95% CI 0.28 to 5.32; Analysis 7.6).
Two trials (Harris 2015; Knudsen 2006), observed no difference in length of gestation between women who received higher and lower doses of omega‐3 LCPUFA daily (MD 0.24 days, 95% CI ‐1.16 to 1.64; 1475 participants; Analysis 7.7).
Baby/infant/child
Harris 2015 observed no difference in women who received 600 mg DHA/day versus 300 mg DHA/day for:
-
birthweight (‐110.35 g, 95% CI ‐242.80 to 22.10; Analysis 7.8);
-
length at birth (MD 0.05 cm, 95% CI ‐0.80 to 0.90; Analysis 7.9); or
-
head circumference at birth (‐0.24 cm, 95% CI 0.87 to 0.39) (Analysis 7.10).
Omega‐3 type direct comparisons (Analysis 8)
Three trials reported direct comparisons of different types of omega‐3 supplements (Knudsen 2006; Mozurkewich 2013; Van Goor 2009).
Primary outcomes
None of the three trials reported any of the review's primary outcomes.
Mother: secondary outcomes
Mozurkewich 2013 observed no evidence of a difference between women who received DHA compared with EPA for:
-
caesarean section (RR 1.23, 95% CI 0.61 to 2.51; 77 participants; Analysis 8.2);
-
cessation due to adverse events (RR 0.82, 95% CI 0.24 to 2.83; 77 participants; Analysis 8.3).
-
blood loss at birth (MD 1.00 mL, 95% CI ‐181.94 to 183.94; 77 participants; Analysis 8.5);
-
major depressive disorder at six to eight weeks postpartum (RR 0.68, 95% CI 0.12 to 3.87; Analysis 8.6); or in
-
depressive symptoms postpartum as measured by the BDI at six to eight weeks (MD ‐1.40, 95% CI ‐3.75 to 0.95; Analysis 8.7).
In Mozurkewich 2013, there was a reduction in pre‐eclampsia in women who received DHA compared with EPA (RR 0.26, 95% CI 0.06 to 1.13; 77 participants; Analysis 8.4), though this did not reach statistical significance.
Two trials reported on gestational diabetes (Mozurkewich 2013; Van Goor 2009); in Mozurkewich 2013 there was a reduction in gestational diabetes when women received DHA compared with EPA (RR 0.15, 95% CI 0.02 to 1.14; 77 participants), though this did not reach statistical significance. Van Goor 2009 observed no evidence of difference between women who received DHA versus DHA/AA (RR 0.33, 95% CI 0.01 to 7.96; 86 participants; Analysis 8.1).
Length of gestation was reported by three trials, two of which found no difference between different types of omega‐3 supplements. Knudsen 2006 observed no evidence of a difference in length of gestation between women who received EPA/DHA compared with ALA (MD ‐0.29 days, 95% CI ‐2.33 to 1.75; 1250 participants). Van Goor 2009 found no evidence of a difference in this outcome between women who received DHA compared with DHA/AA (MD 0.00, 95% CI ‐3.31 to 3.31; 83 participants). However, Mozurkewich 2013 observed a greater length of gestation in women who received DHA compared with EPA (MD 9.10 days, 95% CI 5.24 to 12.96; 77 participants; Analysis 8.8).
Baby/infant/child
Mozurkewich 2013 observed no evidence of a difference between infants of women who received DHA and EPA in admission to neonatal care (RR 0.35, 95% CI 0.08 to 1.63; 78 participants; Analysis 8.9).
In Van Goor 2009, there was no evidence of a difference in birthweight between infants of women who received DHA compared with DHA/AA (MD ‐79.00 g, 95% CI ‐260.22 to 102.22; 83 participants). However, in Mozurkewich 2013 there was evidence of a higher birthweight in infants of mothers who received DHA compared with EPA (MD 372.00 g, 95% CI 151.90 to 592.10; 78 participants; Analysis 8.10).
Van Goor 2009 observed no evidence of a difference in infants of women who received DHA compared with infants of women who received DHA/AA for:
-
weight (MD ‐0.20 kg, 95% CI ‐0.79 to 0.39; 80 participants; Analysis 8.11);
-
height (MD ‐0.80 cm, 95% CI ‐2.50 to 0.90; 80 participants; Analysis 8.12);
-
infant head circumference (MD 0.10, 95% CI ‐0.45 to 0.65; 80 participants; Analysis 8.13).
-
cognition as measured by the BSID II (MD 0.90, 95% CI ‐4.71 to 6.51; 80 participants; Analysis 8.14); or
-
motor development as measured by the BSID II (MD 3.40, 95% CI ‐1.07 to 7.87; 79 participants; Analysis 8.15).
One trial, Van Goor 2009, reported on neurodevelopment from a direct comparison of omega‐3 (DHA versus DHA/AA). No differences between infants of mothers assigned to the two groups were observed for the neonatal neurological classification of mildly/definitely abnormal at two weeks (RR 0.73 95% CI 0.28 to 1.87; 67 participants), or for general movement quality that was mildly/definitely abnormal at two weeks (RR 1.08 95% CI 0.68 to 1.72; 67 participants), However, there was a higher risk of general movement quality being mildly or definitely abnormal at 12 weeks in infants of mothers in the DHA group (RR 1.81 95% CI 1.11 to 2.95; 83 participants; Analysis 8.16).
Van Goor 2009 observed no evidence of any difference between the infants of women who received DHA and infants of women who received DHA/AA in cerebral palsy (not estimable) (Analysis 8.17).
Sensitivity analyses (Analysis 9)
We included just over a third of the trials (24/70) that we considered to be at low risk of selection and performance bias in sensitivity analyses (Bisgaard 2016; Carlson 2013; D'Almedia 1992; Gustafson 2013; Haghiac 2015; Harper 2010; Harris 2015; Ismail 2016; Jamilian 2016; Keenan 2014; Khalili 2016; Krummel 2016; Makrides 2010; Min 2014; Min 2016; Mozurkewich 2013; Oken 2013; Olsen 2000; Onwude 1995; Ramakrishnan 2010; Razavi 2017; Rees 2008; Samimi 2015; Taghizadeh 2016). The 12 outcomes assessed in subgroup analyses 3 to 6 were included in these sensitivity analyses.
For preterm birth (< 37 weeks), the sensitivity analysis was similar to the overall analysis, although it lost conventional statistical significance (RR 0.92 95% CI 0.83 to 1.02; Analysis 9.1). Sensitivity analyses for early preterm birth (< 34 weeks) (RR 0.61 95% CI 0.46 to 0.82; Analysis 9.2) and prolonged pregnancy (> 42 weeks) (RR 2.32, 95% CI 1.26 to 4.28; Analysis 9.3) were very similar to the overall analyses.
The sensitivity analysis for pre‐eclampsia indicated a null result (RR 1.00 95% CI 0.81 to 1.25; Analysis 9.4), in contrast to a possible benefit seen with omega‐3 LCPUFA in the overall analysis.
For caesarean section, there was very little difference between the sensitivity analysis (RR 0.96 95% CI 0.89 to 1.04; Analysis 9.5) and the overall analysis. Length of gestation also showed similar results in the sensitivity analysis (1.42 more days with omega‐3, 95% CI 0.73 to 2.11; Analysis 9.6, now as a fixed‐effect model due to much lower statistical heterogeneity) and the overall findings.
The sensitivity analysis for perinatal death (RR 0.60, 95% CI 0.37 to 0.97; Analysis 9.7) now reached conventional statistical significance, but had a similar magnitude to the overall borderline analysis (Analysis 1.32).
In contrast, the sensitivity analysis for low birthweight lost statistical significance (RR 0.85 95% CI 0.68 to 1.06; Analysis 9.10) but was similar to the overall analysis which reached conventional statistical significance.
The sensitivity analyses for stillbirth (RR 0.72, 95% CI 0.35 to 1.52; Analysis 9.8), neonatal death (RR 0.56, 95% CI 0.25 to 1.27; Analysis 9.9), and small‐for‐gestational age (RR 0.94, 95% CI 0.78 to 1.12; Analysis 9.11) showed similar findings to their corresponding overall analyses (Analysis 1.33; Analysis 1.34; Analysis 1.39).
The sensitivity analysis for birthweight (MD 48.84 g; 95% CI 22.93 to 74.76; 17 trials, 7382 participants; Analysis 9.12) also showed a similar (but lower) result to the overall analysis (Analysis 1.40) (and had lower statistical heterogeneity).
Discusión
Resumen de los resultados principales
En esta actualización se incluyeron 70 ensayos con 19 927 pacientes. La mayoría de los ensayos evaluaron intervenciones con ácidos grasos poliinsaturados omega 3 de cadena larga (AGPICL) en comparación con placebo o ningún omega 3. Se les agrupó como: suplementos de AGPICL omega 3 (50 ensayos); suplementos de AGPICL omega 3 combinados con alimentos o agregados a la dieta (siete ensayos); agregados a la dieta/alimentos (tres ensayos); e intervenciones de ácidos grasos omega 3 combinados con otros agentes (12 ensayos).
Para los resultados primarios de la revisión, hubo una reducción del riesgo del 11% (intervalo de confianza [IC] del 95%: 3% a 19%) de parto prematuro < 37 semanas (evidencia de alta calidad) y una reducción del riesgo del 42% (IC del 95%: 23% a 56%) de parto prematuro temprano < 34 semanas (evidencia de alta calidad) en las pacientes que recibieron AGPICL omega 3 en comparación con ningún omega 3. El número necesario a tratar para lograr un resultado beneficioso adicional (NNTB) y evitar un parto prematuro < 37 semanas es 68 (IC del 95%: 39 a 238) y el NNTB para prevenir un parto prematuro < 34 semanas es 52 (IC del 95%: 39 a 95). Por el contrario, para el embarazo prolongado, hubo un aumento probable del 61% (IC del 95%: 11% a 233%) con AGPICL omega 3 (evidencia de calidad moderada), y el número necesario a tratar para lograr un resultado perjudicial adicional (NNTH) de un embarazo adicional prolongado más allá de las 42 semanas es 102 (IC del 95%: 47 a 568). En el análisis de sensibilidad del parto prematuro < 37 semanas, se perdió la significación estadística convencional, aunque los resultados fueron similares. Los análisis de sensibilidad del parto prematuro temprano < 34 semanasy el embarazo prolongado > 42 semanas fueron similares a los análisis generales.
El AGPICL omega 3 probablemente reduce el riesgo de muerte perinatal(evidencia de calidad moderada) y el ingreso a cuidados neonatales (evidencia de calidad moderada); y reduce el riesgo de recién nacidos con bajo peso al nacer (evidencia de alta calidad). Se observó poca o ninguna diferencia en pequeño para la edad gestacional ( (PEG) o retraso del crecimiento intrauterino (evidencia de calidad moderada) con un posible aumento pequeño de los recién nacidos grandes para la edad gestacional (evidencia de calidad moderada). En la mayoría de los resultados maternos, no se observó diferencias entre los grupos. La media de la duración del embarazo fue mayor en las pacientes que recibieron AGPICL omega 3 y también se pudo haber reducido la incidencia de preeclampsia (evidencia de baja calidad). Para los resultados del niño/adulto, se observaron escasas diferencias entre los grupos de AGPICL omega 3 prenatal y ningún omega 3, lo que indica que no hay certeza con respecto a la repercusión del AGPICL omega 3 sobre el desarrollo y el crecimiento del niño.
Los análisis de subgrupos (según tipo de intervención [p.ej., la administración de suplementos, alimentos o asesoramiento], la dosis de ácido docosahexaenoico [DHA] o ácido eicosapentanoico [EPA], el momento de administración, el tipo de AGPICL omega 3 y el grado de riesgo para las pacientes) revelaron pocas diferencias. En los análisis de subgrupos por intervención, los suplementos de AGPICL omega 3 y los alimentos ricos en omega 3 y el asesoramiento dietético indicaron un mayor efecto positivo sobre la duración del parto en comparación con otros tipos de intervención. En el análisis de subgrupos de dosis, hubo un efecto positivo de las dosis más bajas (< 1 g/día) para el bajo peso al nacer. Para el análisis de subgrupos del riesgo, los estudios con pacientes con riesgo bajo o cualquier riesgo mostraron una mayor reducción del bajo peso al nacer en comparación con los estudios que incorporaron pacientes en riesgo aumentado o alto.
Las comparaciones directas de dosis y tipos de AGPICL omega 3 mostraron un embarazo más prolongado y un peso al nacer mayor para el DHA en comparación con el EPA. Hubo pocas otras diferencias aparte de una reducción posible de la preeclampsia y de la diabetes mellitus gestacional para DHA en comparación con EPA.
El análisis de sensibilidad (limitado a los ensayos en bajo riesgo de selección y sesgo de realización) apoyó en gran parte los resultados observados en los análisis principales, excepto la preeclampsia (que no mostró una reducción con AGPICL omega 3 en comparación con ningún omega 3).
Compleción y aplicabilidad general de las pruebas
De los 70 ensayos incluidos en esta actualización, los tres resultados primarios (parto prematuro, parto prematuro temprano y embarazo prolongado) se informaron en solo 26, nueve y seis ensayos respectivamente, aunque se podrían haber informado en la mayoría de los ensayos (p.ej., como parte de la recopilación habitual de los datos perinatales). El peso al nacer fue el resultado informado de modo más exhaustivo (41 ensayos). Los resultados del niño a más largo plazo no se informaron de modo exhaustivo, y se utilizaron muchas medidas de evaluación diferentes, por ejemplo, en el desarrollo neurológico.
En general, los ensayos más grandes informaron la mayoría de los resultados predefinidos como importantes y, por lo tanto, el grupo de evidencia de esta revisión está razonablemente completo. Sin embargo, algunos ensayos se realizaron por razones específicas, como la evaluación de los efectos de los suplementos de AGPICL omega 3 sobre los resultados de alergia y no siempre informaron otros resultados perinatales de modo exhaustivo. (Los resultados de alergia de estos ensayos se incluyen en otra revisión [Gunaratne 2015]). Algunos ensayos incluso excluyeron el total de partos prematuros, lo que puede haber subestimado las diferencias observadas en el parto prematuro en esta revisión. Para algunos de estos ensayos, se pudieron deducir resultados como el parto prematuro de los diagramas de flujo. La exclusión de los casos de parto prematuro también puede haber llevado al informe incompleto de los resultados vinculados, como la edad gestacional.
En esta actualización, se amplió el alcance de la revisión para asegurar que se pudiera seguir la evolución de los beneficios percibidos del omega 3 y presentar una única revisión exhaustiva de los efectos de AGPICL omega 3 durante el embarazo. Por ejemplo, en la versión de 2006 de esta revisión, se pensó que el beneficio principal de AGPICL omega 3 era la prevención de la preeclampsia y el aumento de la duración del embarazo. En la década siguiente, hubo un énfasis en la evaluación de la función de la administración de suplementos de AGPICL omega 3 en la cognición y el crecimiento del niño. Recientemente, se ha renovado el interés sobre la función del AGPICL omega 3 en la prevención del parto prematuro.
También se incluyeron los ensayos que evaluaron el AGPICL omega 3 de las fuentes alimentarias y el AGPICL omega 3 con cointervenciones, aunque la mayoría de los 63 ensayos que se agregaron a esta actualización comparan los suplementos de omega 3 (sobre todo, DHA y EPA) con placebo. Se presentaron análisis generales, así como análisis de las diferentes comparaciones. Aunque los ensayos se realizaron en una variedad amplia de países, la mayoría fueron en ámbitos de ingresos altos (aunque algunos de estos estudios sólo incorporaron mujeres en situación desfavorable). El informe de las características de las pacientes fue limitado y variable, por ejemplo, para el valor inicial de las concentraciones de AGPICL omega 3, que pueden influir en el embarazo y en resultados a más largo plazo.
Calidad de la evidencia
El riesgo de sesgo general a nivel del estudio fue mixto, con riesgo de selección y de realización principalmente bajo, pero hubo un alto riesgo de sesgo de desgaste en algunos ensayos en algunos momentos.
Para la mayoría de los resultados perinatales importantes evaluados con los criterios GRADE se obtuvo una calificación de alta calidad (p.ej., parto prematuro) o evidencia de calidad moderada (p.ej., muerte perinatal) (Resumen de los hallazgos, tabla 1). Para los resultados del parto, sólo se disminuyó la calificación por el sesgo de desgaste si hubo pérdidas significativas cerca del momento del parto, debido a que las pérdidas tardías no son relevantes para esta revisión. Para los otros dominios de resultado, la calificación según los criterios GRADE varió de moderada a muy baja, con más de la mitad evaluada como baja (Resumen de los hallazgos maternos, tabla 2; Resumen de los hallazgos del niño/adulto, tabla 3; y Resumen de los hallazgos de los servicios de salud, tabla 4). Los motivos para disminuir la calificación de la calidad se debieron principalmente a las limitaciones del diseño (en gran parte por el alto riesgo de sesgo de desgaste y de selección; y la asignación al azar y cegamiento poco claros) y la imprecisión. En particular en los resultados del niño a más largo plazo (Resumen de los hallazgos, tabla 3), el número de estudios fue con frecuencia bajo y, por lo tanto, hubo imprecisión. Debido al gran número de estudios que siguieron a las participantes o subgrupos de participantes, a menudo por períodos prolongados, con frecuencia fue evidente el sesgo de desgaste en estos resultados a más largo plazo.
Sesgos potenciales en el proceso de revisión
Debido a los rigurosos métodos utilizados (búsqueda exhaustiva, revisión y extracción de los datos por duplicado, así como una evaluación y análisis cuidadosos), es probable que los sesgos sean bajos. Fue posible incluir 12 gráficos en embudo, la mayoría sin evidencia de sesgo de publicación.
Aunque se aplicaron criterios amplios de inclusión en la revisión, algunos estudios tenían criterios muy restrictivos (p.ej., excluir los partos prematuros, como se trató anteriormente) y un número reducido de resultados informados, si bien un mayor número (p.ej., muerte perinatal) habría estado disponible y podría haber sido informado por los autores de ensayos.
Acuerdos y desacuerdos con otros estudios o revisiones
Una revisión sistemática grande de la Agency for Healthcare Research and Quality (AHRQ) de los EE.UU. sobre los efectos de los ácidos grasos omega 3 sobre la salud materna e infantil concluyó que, excepto en los efectos beneficiosos pequeños sobre los lactantes, los ensayos controlados aleatorios (ECA) que informaron el parto prematuro < 37 semanas, no encontraron diferencias significativas entre omega 3 y ningún omega 3 (odds ratio [OR] 0,87; IC del 95%: 0,66 a 1,15 para DHA y OR 0,86; IC del 95%: 0,65 a 1,15 para DHA/EPA, efectos aleatorios). Se incluyeron 26 ECA en este resultado y se encontró un resultado claro a favor de omega 3 (cociente de riesgos [CR] 0,89; IC del 95%: 0,81 a 0,97; efectos fijos). Para la comparación, el resultado de la presente revisión se modifica a OR 0,85; IC del 95%: 0,74 a 0,99; efectos aleatorios. La revisión AHRQ no informó sobre parto prematuro temprano, que en la presente revisión mostró una reducción evidente con el AGPICL omega 3 (CR 0,58; IC del 95%: 0,44 a 0,77).
Imhoff‐Kunsch 2012 examinó 15 ECA y encontró, al igual que los autores de esta revisión, una reducción evidente del parto prematuro temprano, aunque sólo indicios de una reducción del parto prematuro general. En la revisión sistemática Kar 2016 de nueve estudios incluidos, se observó una reducción clara en el parto prematuro y prematuro temprano. Otra revisión sistemática de AGPICL omega 3 que se centró en los resultados del parto también fue en gran parte consistente con los resultados de la presente revisión (p.ej., reducción en el riesgo de parto prematuro y parto prematuro temprano [aunque los autores utilizaron una definición más amplia de parto prematuro temprano y un modelo de efectos fijos en toda la revisión]) (Chen 2016). Los mismos autores realizaron una revisión de AGPICL omega 3 y analizaron la diabetes gestacional, la hipertensión del embarazo y la preeclampsia y no encontraron evidencia de diferencias (Chen 2015). Nuevamente, los resultados fueron en su mayoría consistentes con los de la presente revisión, aunque se encontró una posible disminución en la preeclampsia con AGPICL omega 3.
La revisión sistemática Saccone 2016 incluyó 34 estudios, que comprendían 17 ensayos de AGPICL omega 3. No encontraron diferencias evidentes en el parto prematuro en siete ensayos con 3493 embarazos únicos asintomáticos (CR 0,90; IC del 95%: 0,72 a 1,11) y encontraron una disminución del 11% en el parto prematuro < 37 semanas (CR 0,89; IC del 95%: 0,81 a 0,97; 24 ensayos, 10 121 participantes). (Saccone 2016 excluyó los ensayos con pacientes con antecedentes de partos prematuros. Cuando se omitieron estos dos ensayos, se obtuvo una diferencia mínima en los resultados.) Para la muerte perinatal, Saccone 2016 no encontró diferencias generales entre AGPICL omega 3 y ningún AGPICL omega 3 en seis ensayos (CR 0,61; IC del 95%: 0,30 a 1,24) mientras que en la presente revisión se encontró una posible reducción (CR 0,75; IC del 95%: 0,54 a 1,03; diez ensayos, 7416 mujeres). Saccone 2016 también señaló que cuando la administración de suplementos AGPICL omega 3 comenzó a las 20 semanas o menos de gestación, se observó una disminución significativa (73%) de la muerte perinatal con AGPICL omega 3 en comparación con placebo en embarazos únicos, pero los autores no utilizaron métodos de interacción de subgrupos aceptados para examinar este hallazgo (Higgins 2011). La prueba de interacción de subgrupos para la muerte perinatal de la presente revisión no mostró una diferencia en el tiempo de gestación; la muerte perinatal se redujo en cualquier momento en el que se inició la administración de suplementos (≤ gestación de 20 semanas o más tarde) (Análisis 4.7).
Saccone y colegas también han publicado tres revisiones sistemáticas previas que se centraron en resultados específicos: Saccone 2015a: crecimiento intrauterino recurrente (tres ensayos); Saccone 2015b: parto prematuro previo (dos ensayos); y Saccone 2015c: prevención del parto prematuro (nueve ensayos). La revisión Saccone 2016 incluye todos los estudios de Saccone 2015a y Saccone 2015c, pero no Saccone 2015b, que incluyó dos ensayos con pacientes con partos prematuros previos. Todos los estudios relevantes en las cuatro revisiones de Saccone se incluyen en esta revisión (Saccone 2015a; Saccone 2015b; Saccone 2015c; Saccone 2016).
Gould y colegas examinaron 11 ECA con 5272 participantes y concluyeron que este grupo de evidencia no apoyó ni refutó de manera concluyente la función de la administración de suplementos de AGPICL omega 3 en el embarazo para mejorar el desarrollo cognitivo o visual (Gould 2013). Otras revisiones recientes del crecimiento y desarrollo del niño son consistentes con los resultados de la presente revisión de la pequeña repercusión de la administración de suplementos de AGPICL omega 3 durante el embarazo (Campoy 2012; Li 2017; Rangel‐Huerta 2018).

Study flow diagram.

Risk of bias summary: review authors' judgements about each risk of bias item for each included study.
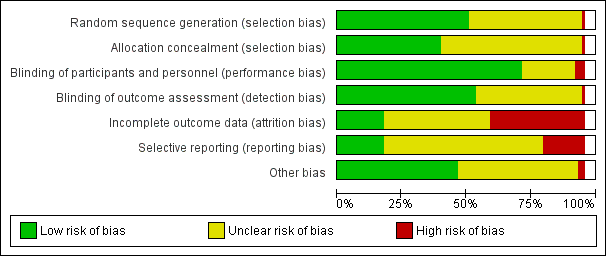
Risk of bias graph: review authors' judgements about each risk of bias item presented as percentages across all included studies.
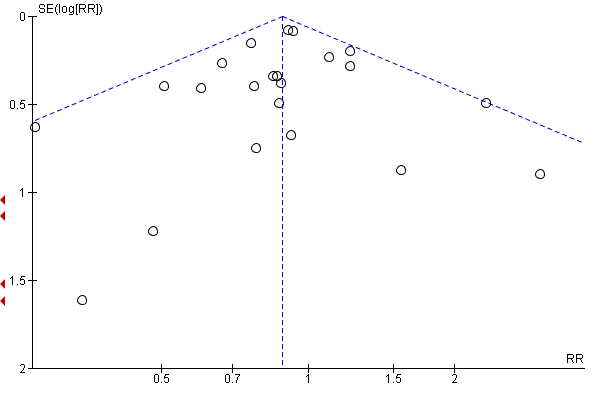
Funnel plot of comparison: 1 Omega‐3 versus placebo/no omega‐3: OVERALL, outcome: 1.7 Preterm birth (< 37 weeks).

Funnel plot of comparison: 1 Omega‐3 versus placebo/no omega‐3: OVERALL, outcome: 1.4 Pre‐eclampsia (hypertension with proteinuria).

Funnel plot of comparison: 1 Omega‐3 versus placebo/no omega‐3: OVERALL, outcome: 1.16 Caesarean section.

Funnel plot of comparison: 1 Omega‐3 versus placebo/no omega‐3: OVERALL, outcome: 1.20 Gestational diabetes.
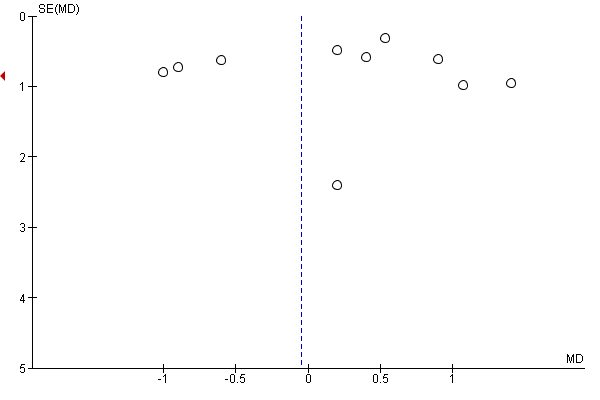
Funnel plot of comparison: 1 Overall: omega‐3 versus no omega‐3, outcome: 1.23 Gestational weight gain (kg).
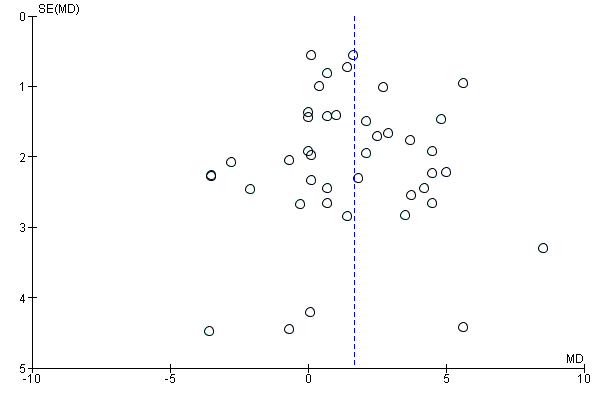
Funnel plot of comparison: 1 OVERALL omega‐3 versus placebo/no omega‐3, outcome: 1.31 Length of gestation (days).

Funnel plot of comparison: 1 OVERALL omega‐3 versus no omega‐3, outcome: 1.32 Perinatal death.

Funnel plot of comparison: 1 Omega‐3 versus placebo/no omega‐3: OVERALL, outcome: 1.32 Stillbirth.

Funnel plot of comparison: 1 Omega‐3 versus placebo/no omega‐3: OVERALL, outcome: 1.38 Low birthweight (< 2500 g).
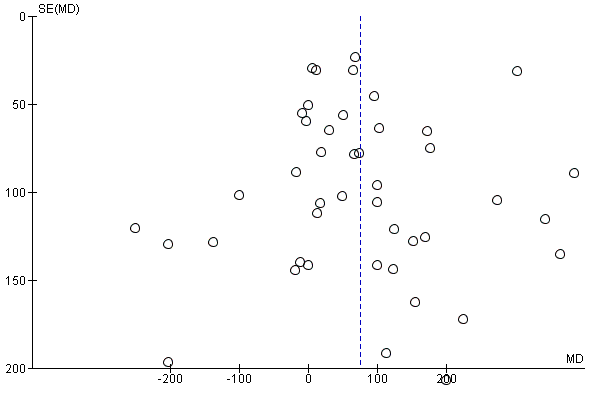
Funnel plot of comparison: 1 Omega‐3 versus placebo/no omega‐3: OVERALL, outcome: 1.41 Birthweight (g).
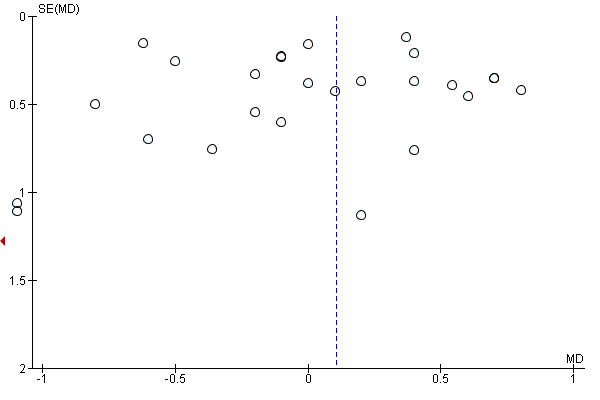
Funnel plot of comparison: 1 Omega‐3 versus placebo/no omega‐3: OVERALL, outcome: 1.43 Birth length (cm).

Funnel plot of comparison: 1 Omega‐3 versus placebo/no omega‐3: OVERALL, outcome: 1.45 Head circumference at birth (cm).

Comparison 1 Overall: omega‐3 versus no omega‐3, Outcome 1 Preterm birth (< 37 weeks).
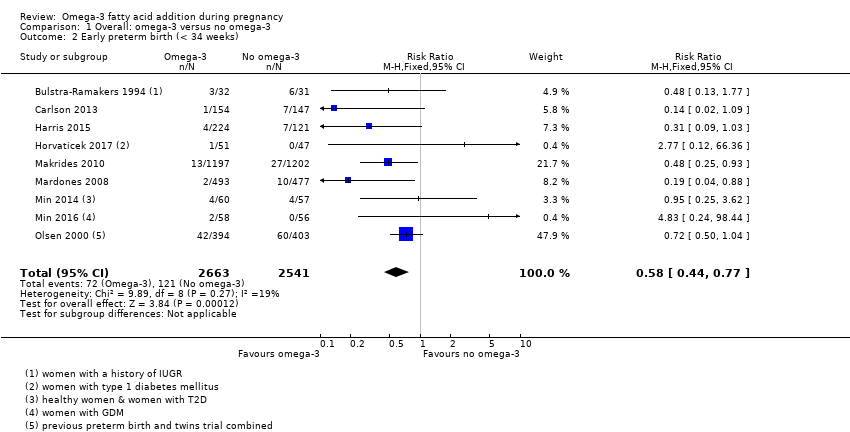
Comparison 1 Overall: omega‐3 versus no omega‐3, Outcome 2 Early preterm birth (< 34 weeks).

Comparison 1 Overall: omega‐3 versus no omega‐3, Outcome 3 Prolonged gestation (> 42 weeks).
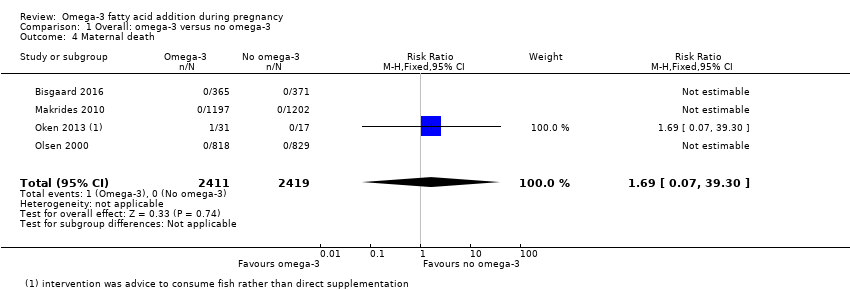
Comparison 1 Overall: omega‐3 versus no omega‐3, Outcome 4 Maternal death.
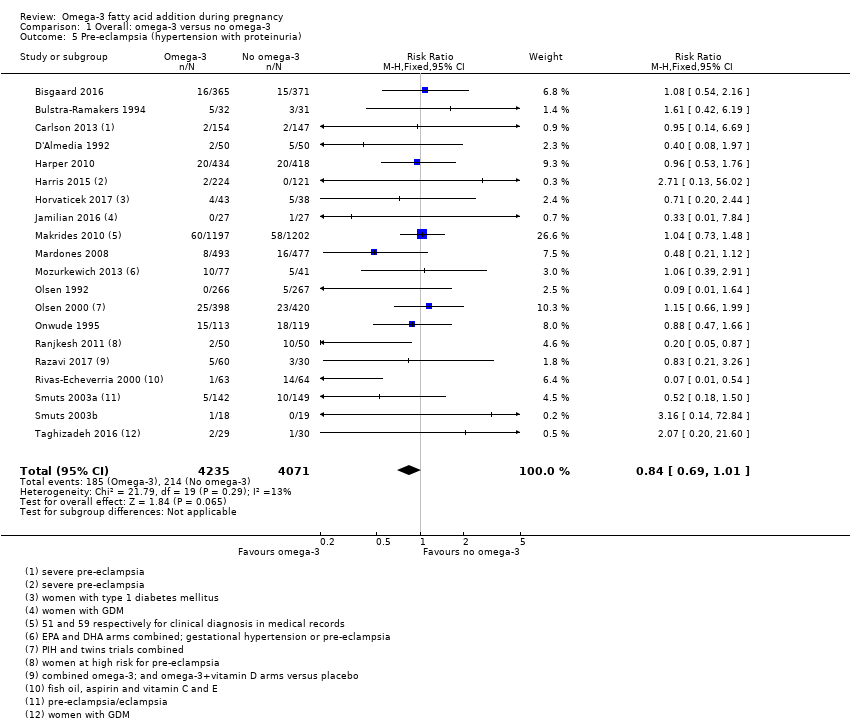
Comparison 1 Overall: omega‐3 versus no omega‐3, Outcome 5 Pre‐eclampsia (hypertension with proteinuria).
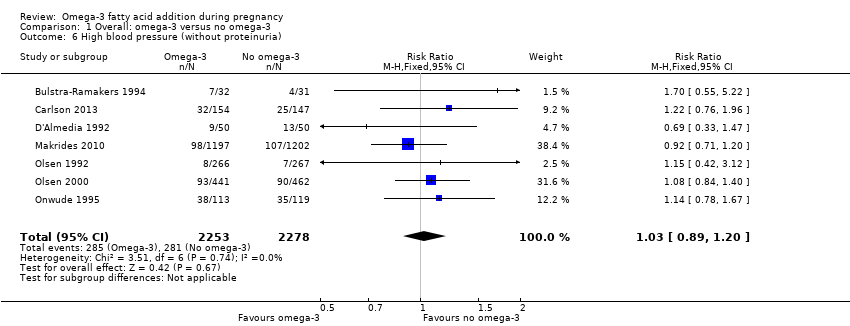
Comparison 1 Overall: omega‐3 versus no omega‐3, Outcome 6 High blood pressure (without proteinuria).
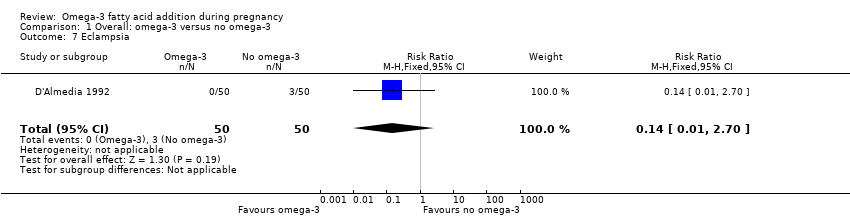
Comparison 1 Overall: omega‐3 versus no omega‐3, Outcome 7 Eclampsia.
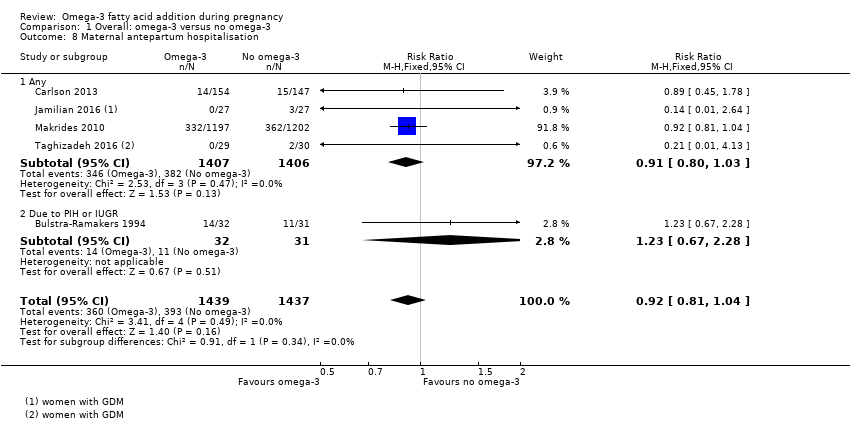
Comparison 1 Overall: omega‐3 versus no omega‐3, Outcome 8 Maternal antepartum hospitalisation.

Comparison 1 Overall: omega‐3 versus no omega‐3, Outcome 9 Mother's length of stay in hospital (days).

Comparison 1 Overall: omega‐3 versus no omega‐3, Outcome 10 Maternal anaemia.
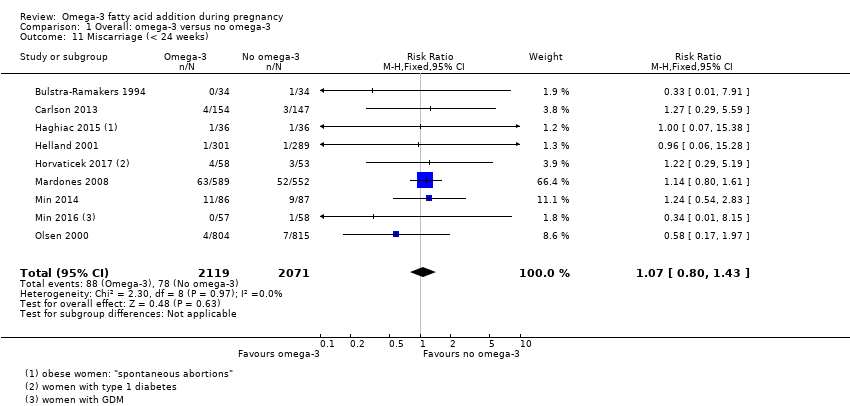
Comparison 1 Overall: omega‐3 versus no omega‐3, Outcome 11 Miscarriage (< 24 weeks).
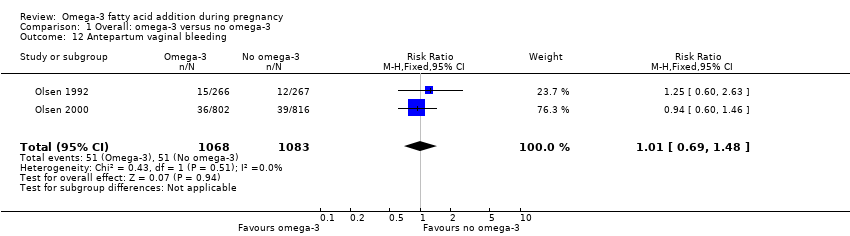
Comparison 1 Overall: omega‐3 versus no omega‐3, Outcome 12 Antepartum vaginal bleeding.

Comparison 1 Overall: omega‐3 versus no omega‐3, Outcome 13 Rupture of membranes (PPROM; PROM).

Comparison 1 Overall: omega‐3 versus no omega‐3, Outcome 14 Maternal admission to intensive care.

Comparison 1 Overall: omega‐3 versus no omega‐3, Outcome 15 Maternal adverse events.

Comparison 1 Overall: omega‐3 versus no omega‐3, Outcome 16 Caesarean section.

Comparison 1 Overall: omega‐3 versus no omega‐3, Outcome 17 Induction (post‐term).

Comparison 1 Overall: omega‐3 versus no omega‐3, Outcome 18 Blood loss at birth (mL).

Comparison 1 Overall: omega‐3 versus no omega‐3, Outcome 19 Postpartum haemorrhage.

Comparison 1 Overall: omega‐3 versus no omega‐3, Outcome 20 Gestational diabetes.

Comparison 1 Overall: omega‐3 versus no omega‐3, Outcome 21 Maternal insulin resistance (HOMA‐IR).

Comparison 1 Overall: omega‐3 versus no omega‐3, Outcome 22 Excessive gestational weight gain.

Comparison 1 Overall: omega‐3 versus no omega‐3, Outcome 23 Gestational weight gain (kg).

Comparison 1 Overall: omega‐3 versus no omega‐3, Outcome 24 Depression during pregnancy: thresholds.
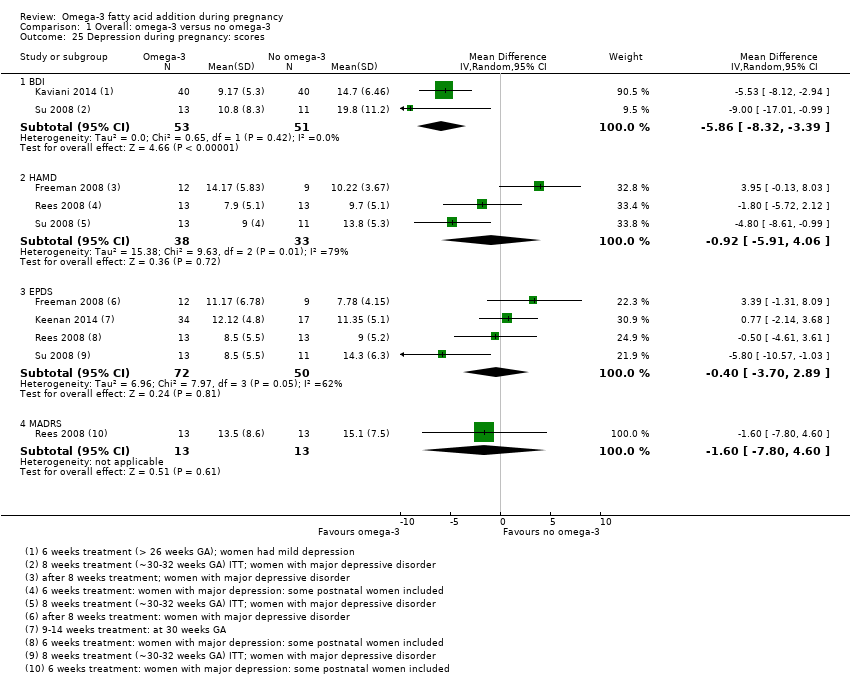
Comparison 1 Overall: omega‐3 versus no omega‐3, Outcome 25 Depression during pregnancy: scores.

Comparison 1 Overall: omega‐3 versus no omega‐3, Outcome 26 Anxiety during pregnancy.
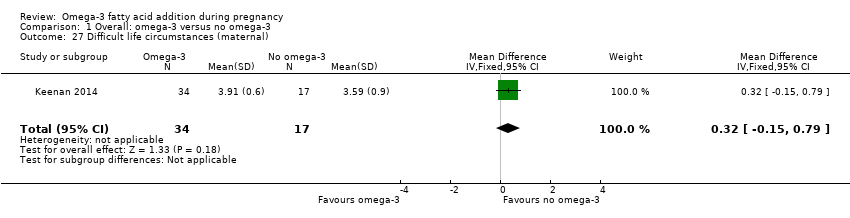
Comparison 1 Overall: omega‐3 versus no omega‐3, Outcome 27 Difficult life circumstances (maternal).
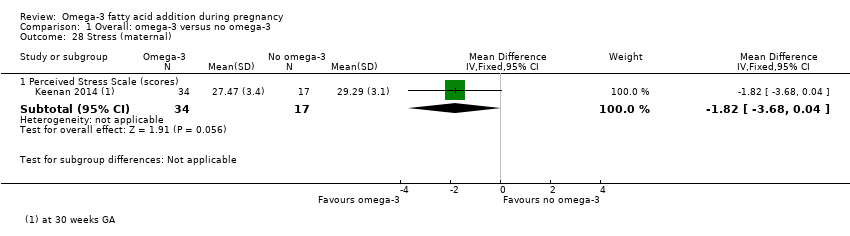
Comparison 1 Overall: omega‐3 versus no omega‐3, Outcome 28 Stress (maternal).
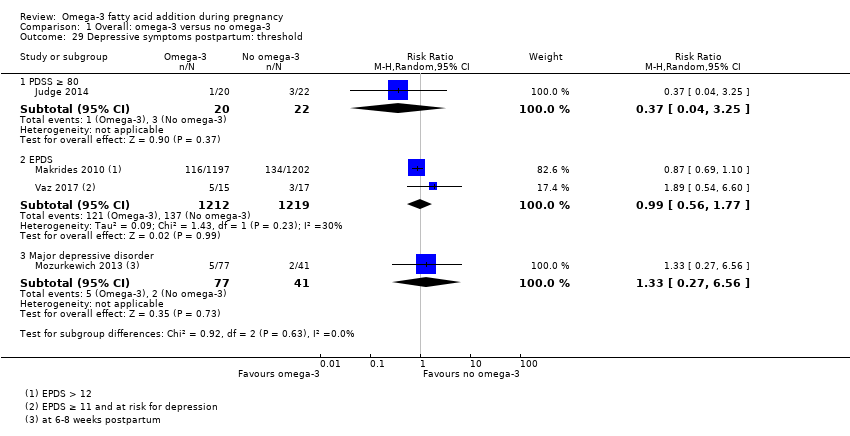
Comparison 1 Overall: omega‐3 versus no omega‐3, Outcome 29 Depressive symptoms postpartum: threshold.

Comparison 1 Overall: omega‐3 versus no omega‐3, Outcome 30 Depressive symptoms postpartum: scores.
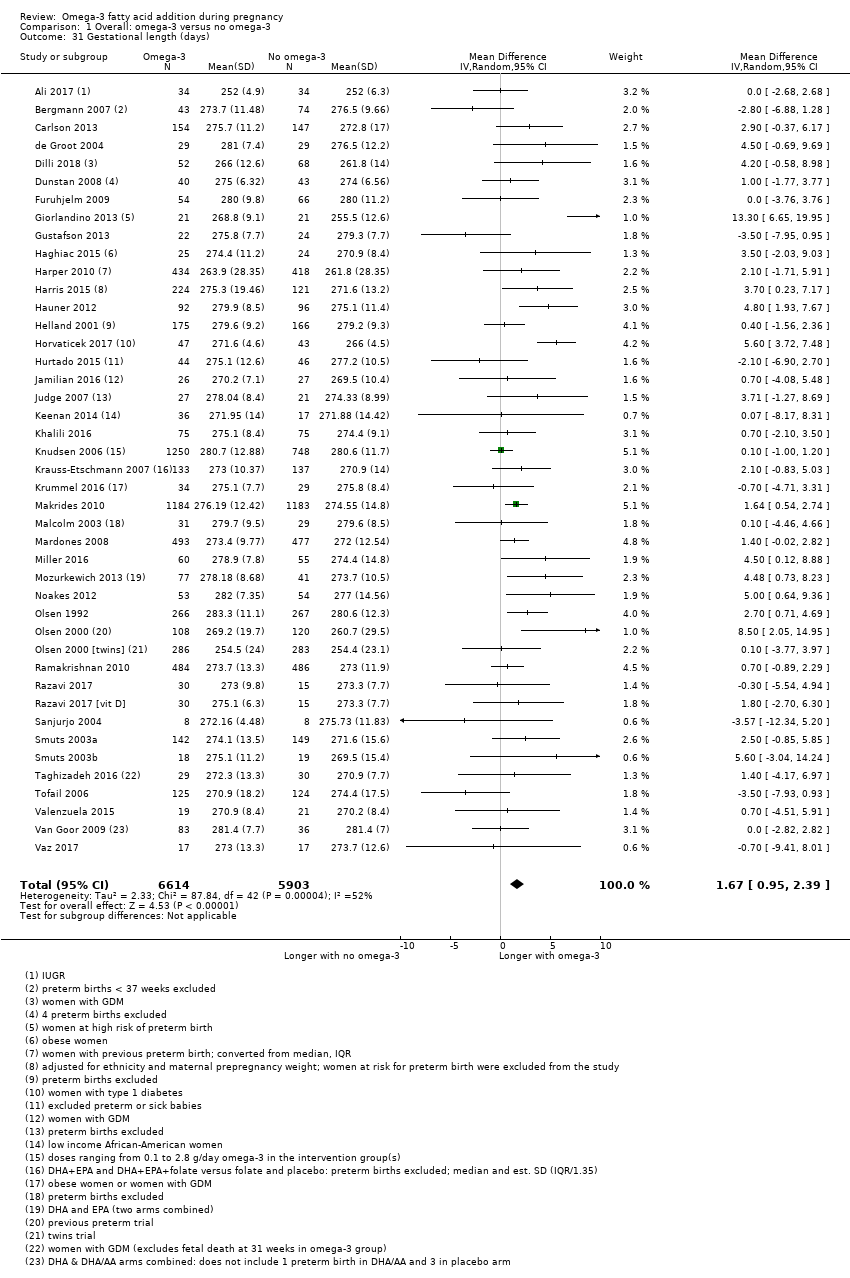
Comparison 1 Overall: omega‐3 versus no omega‐3, Outcome 31 Gestational length (days).
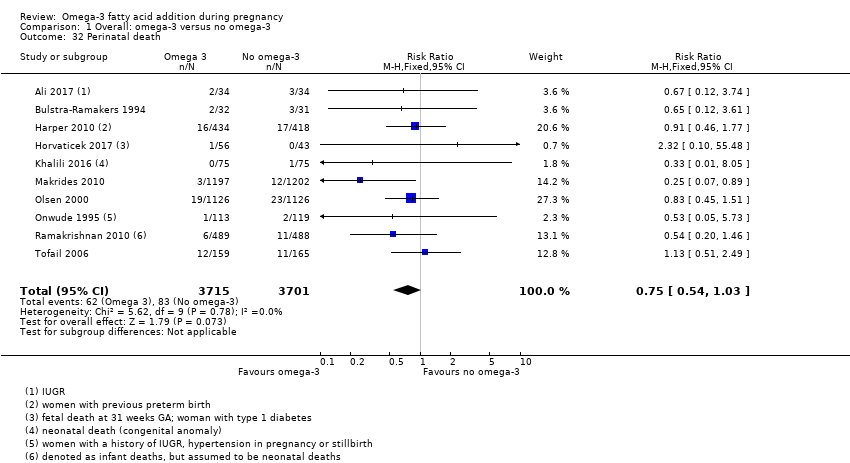
Comparison 1 Overall: omega‐3 versus no omega‐3, Outcome 32 Perinatal death.
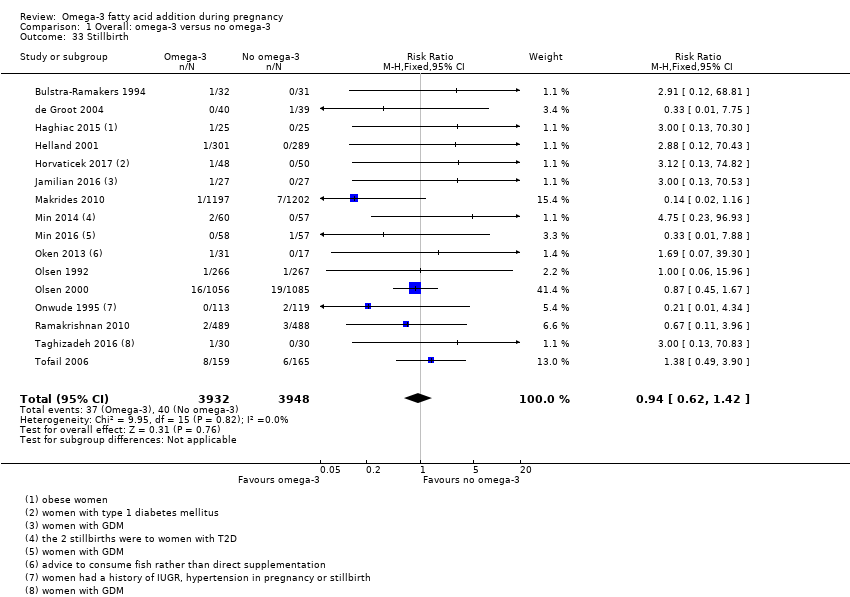
Comparison 1 Overall: omega‐3 versus no omega‐3, Outcome 33 Stillbirth.
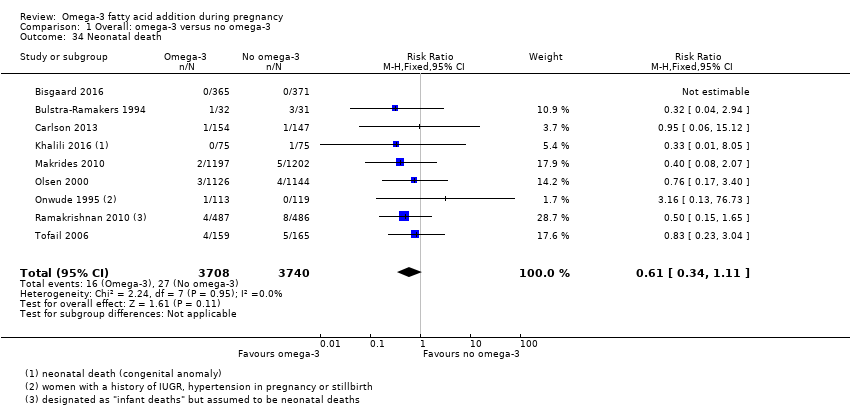
Comparison 1 Overall: omega‐3 versus no omega‐3, Outcome 34 Neonatal death.
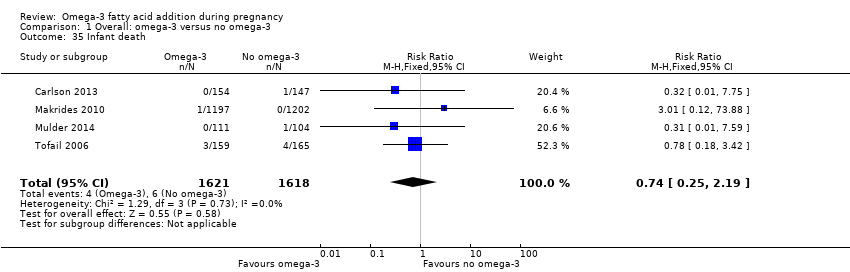
Comparison 1 Overall: omega‐3 versus no omega‐3, Outcome 35 Infant death.

Comparison 1 Overall: omega‐3 versus no omega‐3, Outcome 36 Large‐for‐gestational age.

Comparison 1 Overall: omega‐3 versus no omega‐3, Outcome 37 Macrosomia.
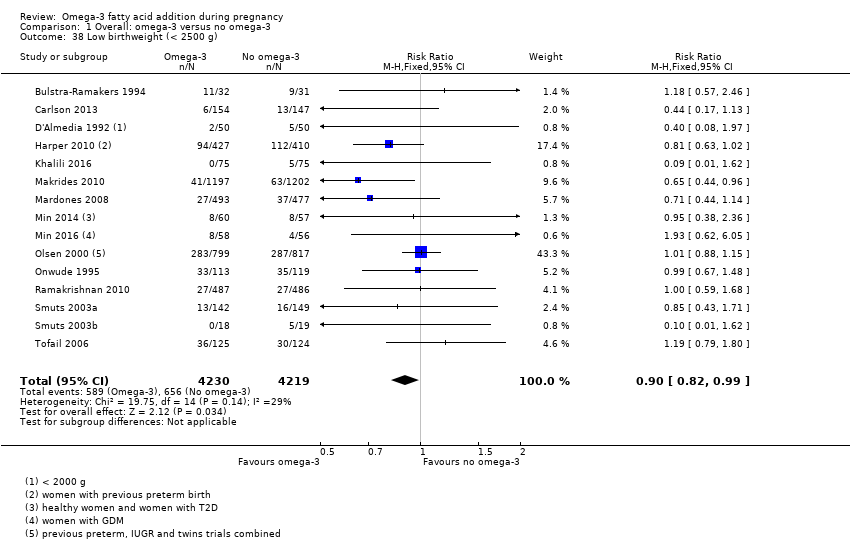
Comparison 1 Overall: omega‐3 versus no omega‐3, Outcome 38 Low birthweight (< 2500 g).

Comparison 1 Overall: omega‐3 versus no omega‐3, Outcome 39 Small‐for‐gestational age/IUGR.
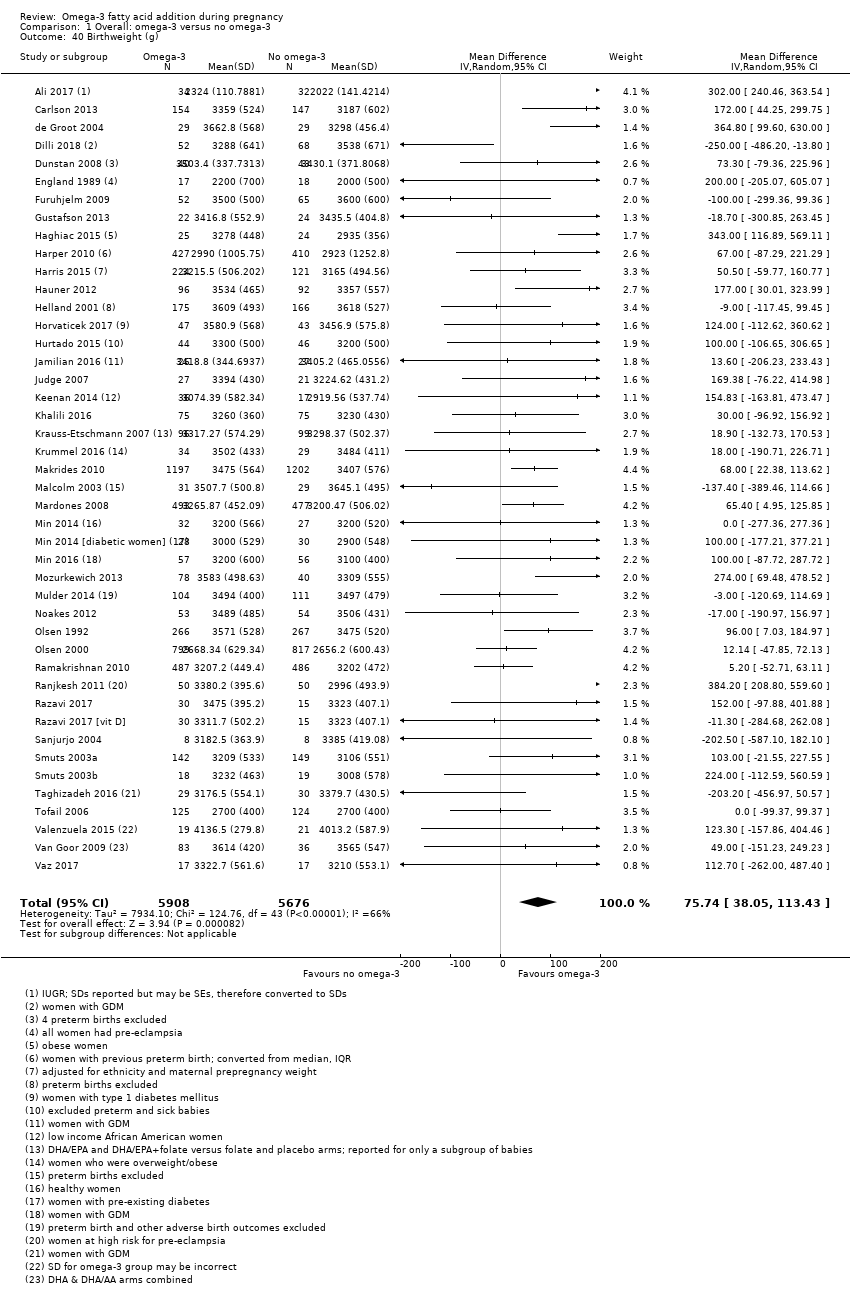
Comparison 1 Overall: omega‐3 versus no omega‐3, Outcome 40 Birthweight (g).

Comparison 1 Overall: omega‐3 versus no omega‐3, Outcome 41 Birthweight Z score.
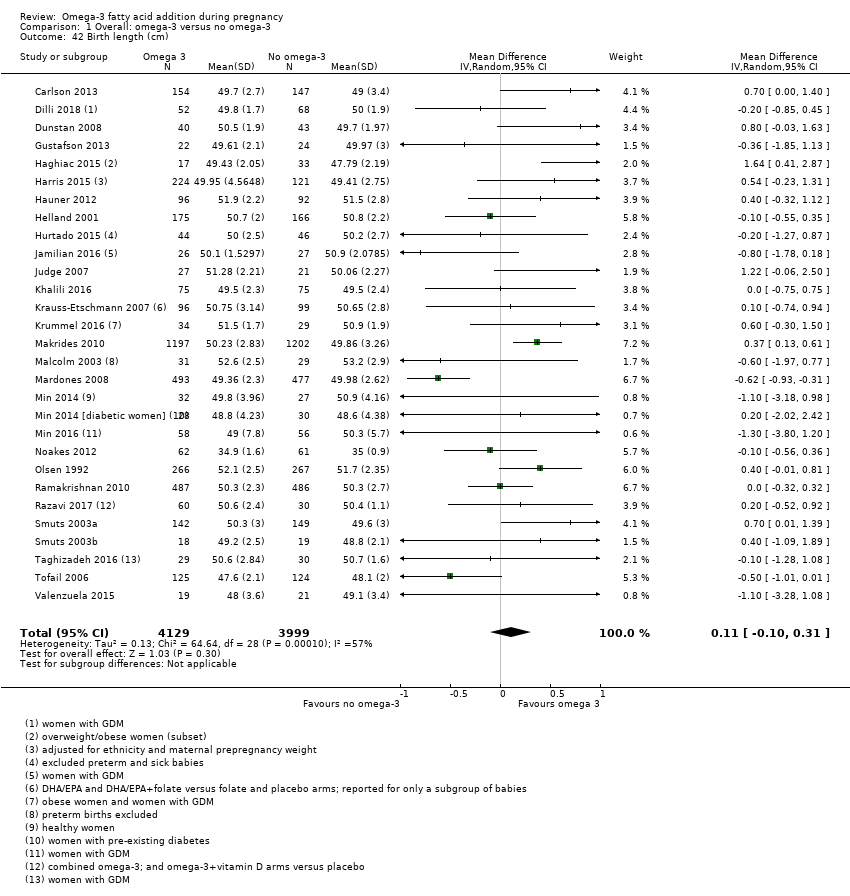
Comparison 1 Overall: omega‐3 versus no omega‐3, Outcome 42 Birth length (cm).

Comparison 1 Overall: omega‐3 versus no omega‐3, Outcome 43 Head circumference at birth (cm).
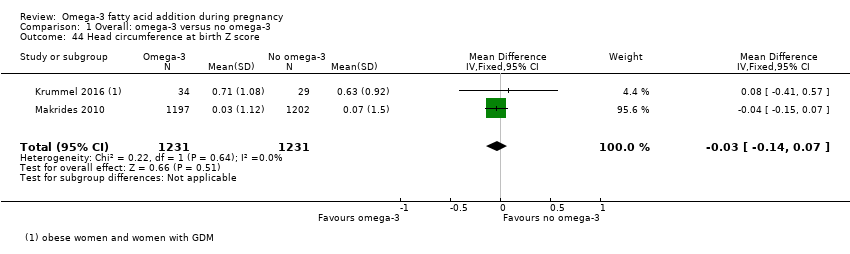
Comparison 1 Overall: omega‐3 versus no omega‐3, Outcome 44 Head circumference at birth Z score.

Comparison 1 Overall: omega‐3 versus no omega‐3, Outcome 45 Length at birth Z score.

Comparison 1 Overall: omega‐3 versus no omega‐3, Outcome 46 Baby admitted to neonatal care.
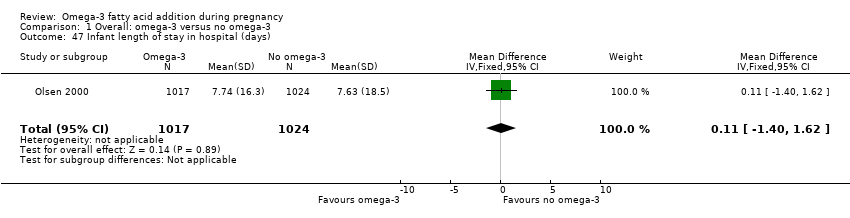
Comparison 1 Overall: omega‐3 versus no omega‐3, Outcome 47 Infant length of stay in hospital (days).

Comparison 1 Overall: omega‐3 versus no omega‐3, Outcome 48 Congenital anomalies.
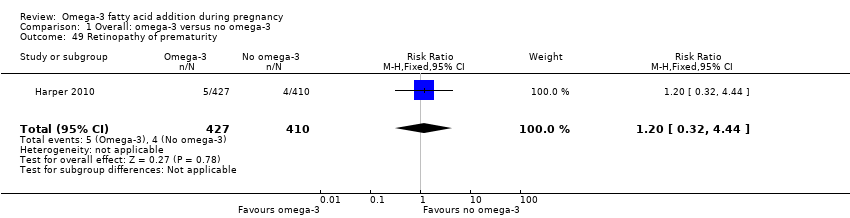
Comparison 1 Overall: omega‐3 versus no omega‐3, Outcome 49 Retinopathy of prematurity.

Comparison 1 Overall: omega‐3 versus no omega‐3, Outcome 50 Bronchopulmonary dysplasia.

Comparison 1 Overall: omega‐3 versus no omega‐3, Outcome 51 Respiratory distress syndrome.
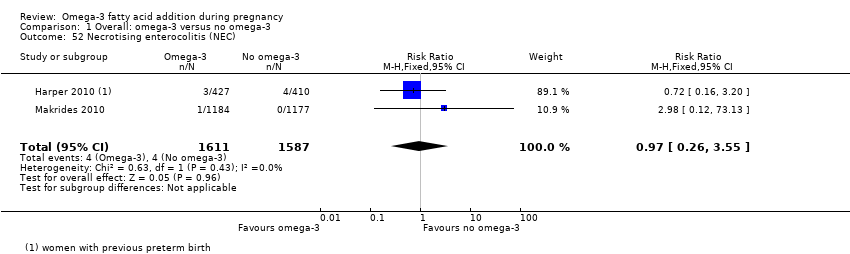
Comparison 1 Overall: omega‐3 versus no omega‐3, Outcome 52 Necrotising enterocolitis (NEC).

Comparison 1 Overall: omega‐3 versus no omega‐3, Outcome 53 Neonatal sepsis (proven).

Comparison 1 Overall: omega‐3 versus no omega‐3, Outcome 54 Convulsion.

Comparison 1 Overall: omega‐3 versus no omega‐3, Outcome 55 Intraventricular haemorrhage.
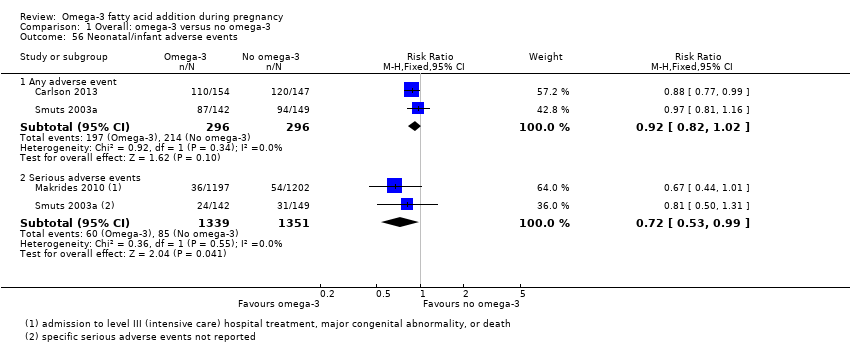
Comparison 1 Overall: omega‐3 versus no omega‐3, Outcome 56 Neonatal/infant adverse events.
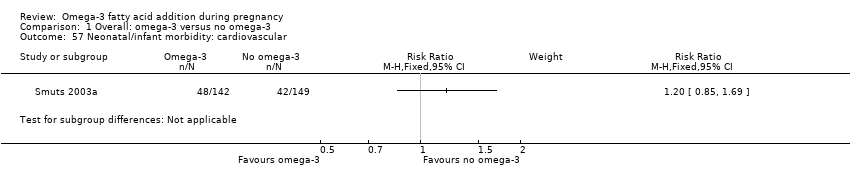
Comparison 1 Overall: omega‐3 versus no omega‐3, Outcome 57 Neonatal/infant morbidity: cardiovascular.

Comparison 1 Overall: omega‐3 versus no omega‐3, Outcome 58 Neonatal/infant morbidity: respiratory.

Comparison 1 Overall: omega‐3 versus no omega‐3, Outcome 59 Neonatal/infant morbidity: due to pregnancy/birth events.

Comparison 1 Overall: omega‐3 versus no omega‐3, Outcome 60 Neonatal/infant morbidity: other.

Comparison 1 Overall: omega‐3 versus no omega‐3, Outcome 61 Infant/child morbidity.

Comparison 1 Overall: omega‐3 versus no omega‐3, Outcome 62 Ponderal index.
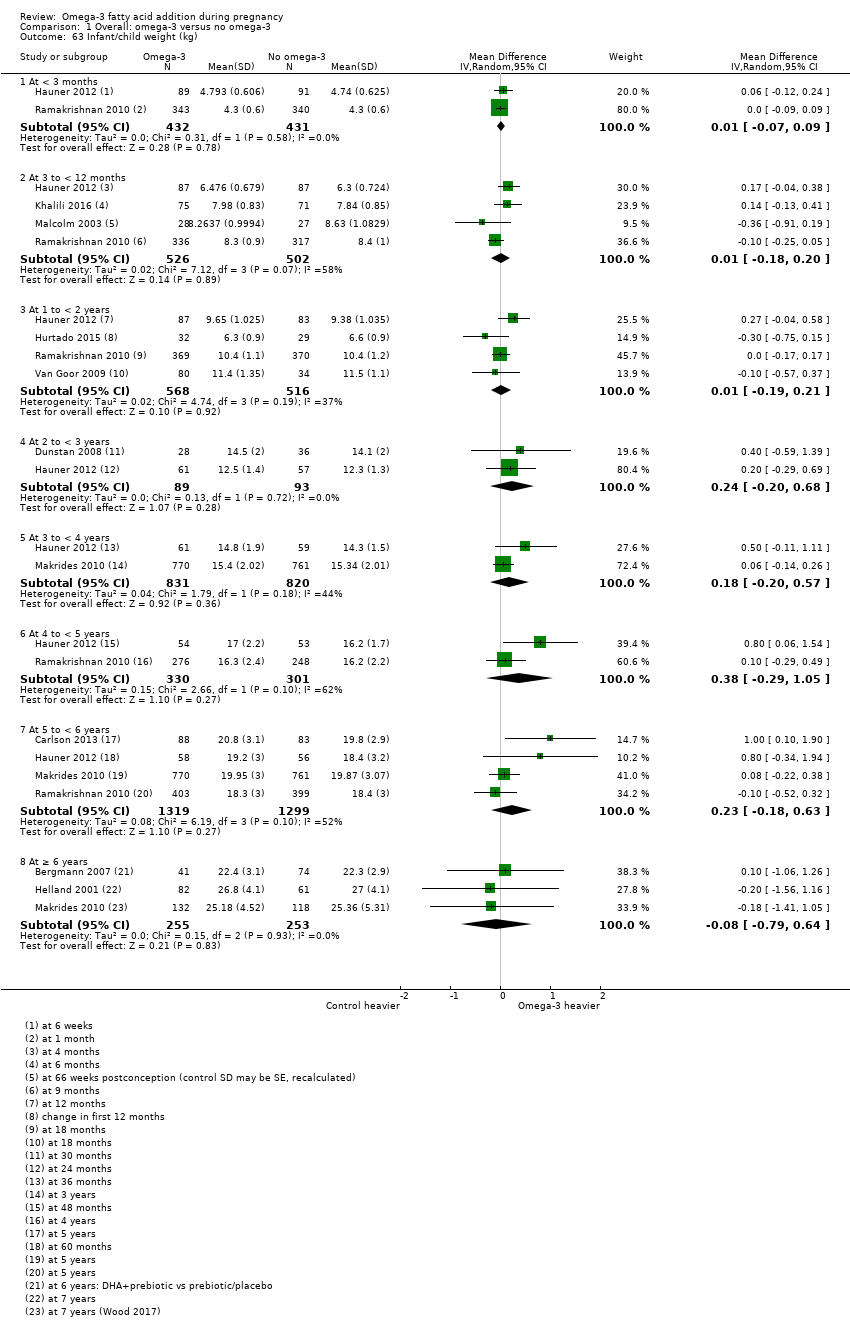
Comparison 1 Overall: omega‐3 versus no omega‐3, Outcome 63 Infant/child weight (kg).

Comparison 1 Overall: omega‐3 versus no omega‐3, Outcome 64 Infant/child length/height (cm).

Comparison 1 Overall: omega‐3 versus no omega‐3, Outcome 65 Infant/child head circumference (cm).
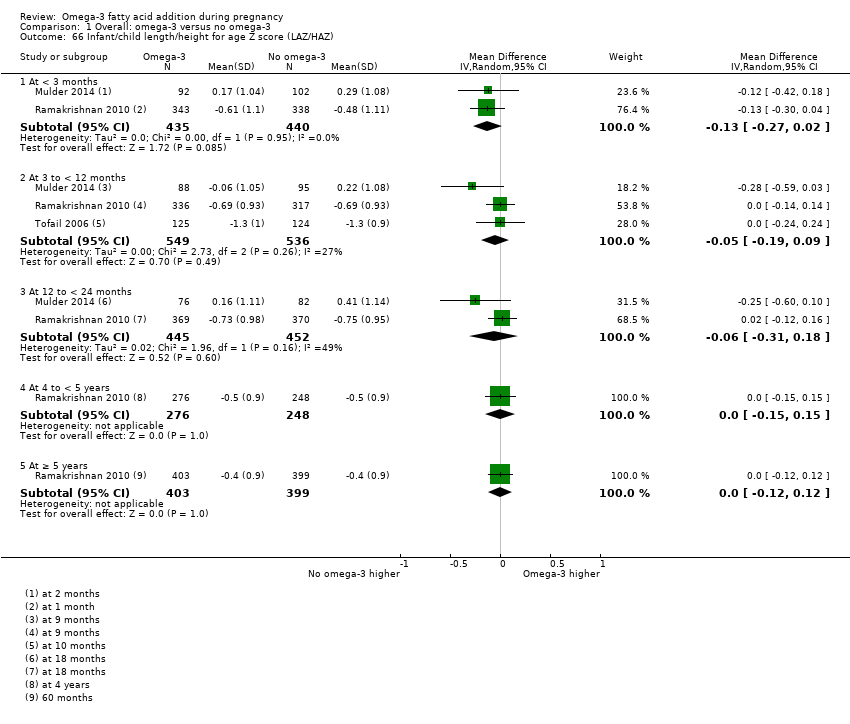
Comparison 1 Overall: omega‐3 versus no omega‐3, Outcome 66 Infant/child length/height for age Z score (LAZ/HAZ).
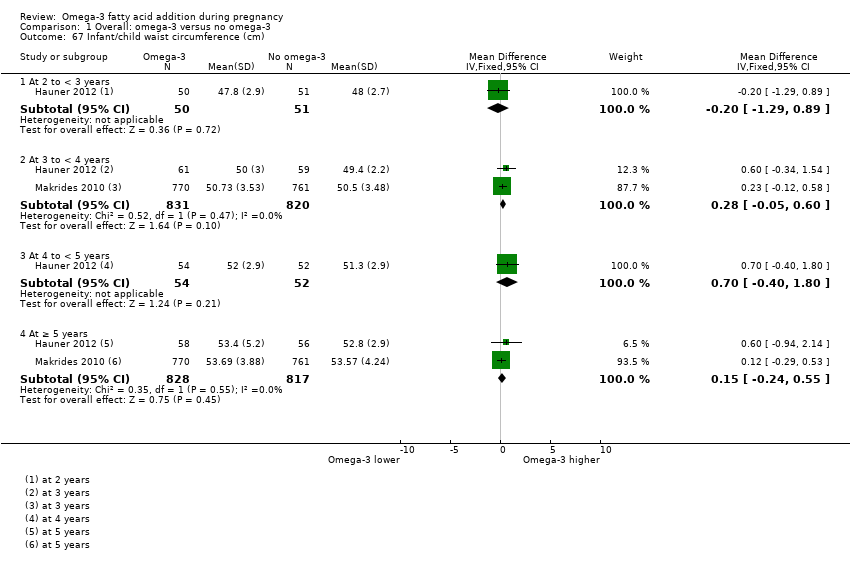
Comparison 1 Overall: omega‐3 versus no omega‐3, Outcome 67 Infant/child waist circumference (cm).

Comparison 1 Overall: omega‐3 versus no omega‐3, Outcome 68 Infant/child weight‐for‐age Z score (WAZ).
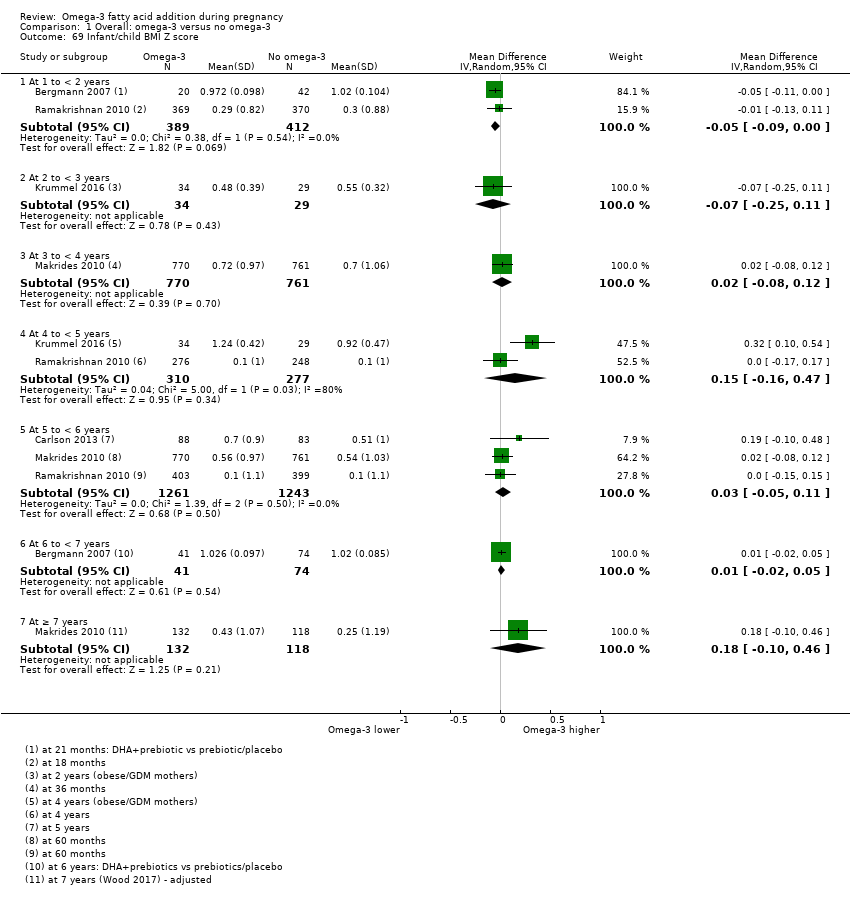
Comparison 1 Overall: omega‐3 versus no omega‐3, Outcome 69 Infant/child BMI Z score.

Comparison 1 Overall: omega‐3 versus no omega‐3, Outcome 70 Infant/child weight for length/height Z score (WHZ).

Comparison 1 Overall: omega‐3 versus no omega‐3, Outcome 71 Infant/child BMI percentile.

Comparison 1 Overall: omega‐3 versus no omega‐3, Outcome 72 Child/adult BMI.

Comparison 1 Overall: omega‐3 versus no omega‐3, Outcome 73 Infant/child body fat (%).

Comparison 1 Overall: omega‐3 versus no omega‐3, Outcome 74 Infant/child total fat mass (kg).
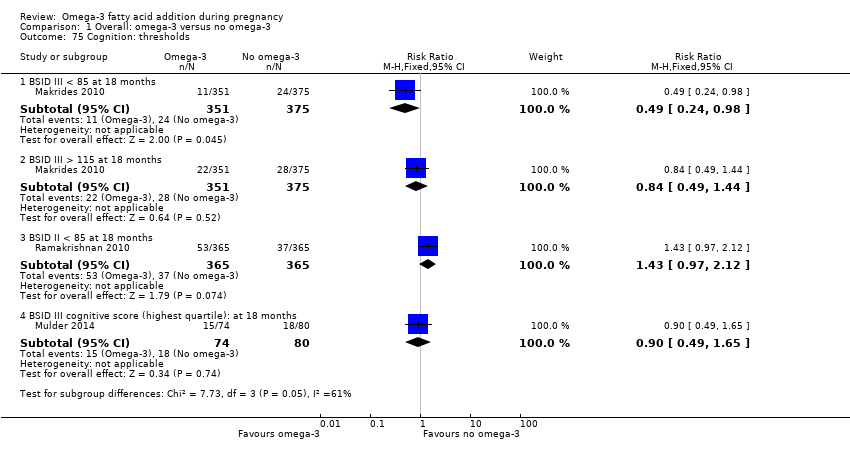
Comparison 1 Overall: omega‐3 versus no omega‐3, Outcome 75 Cognition: thresholds.
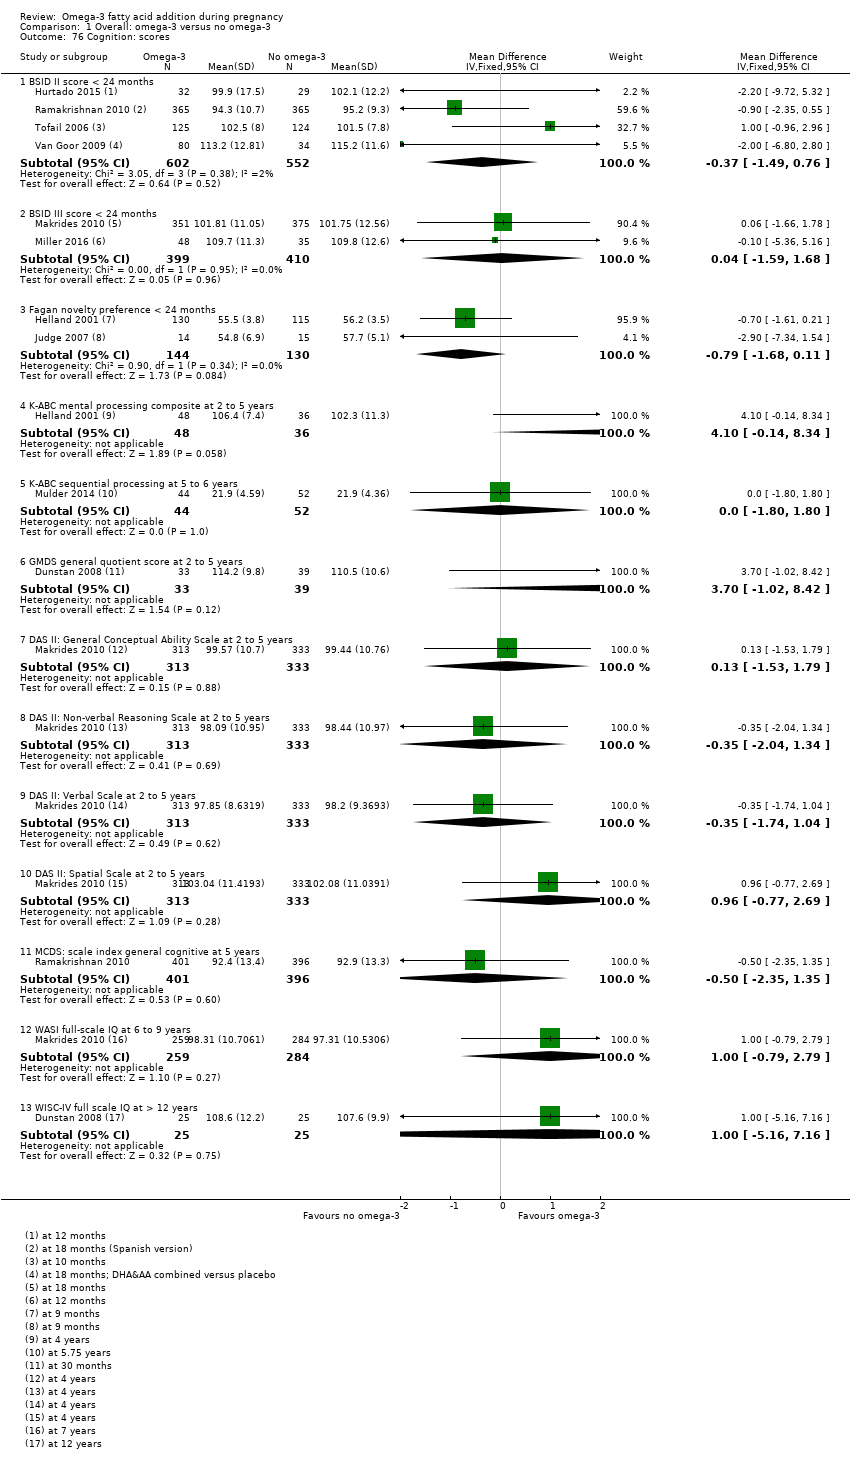
Comparison 1 Overall: omega‐3 versus no omega‐3, Outcome 76 Cognition: scores.
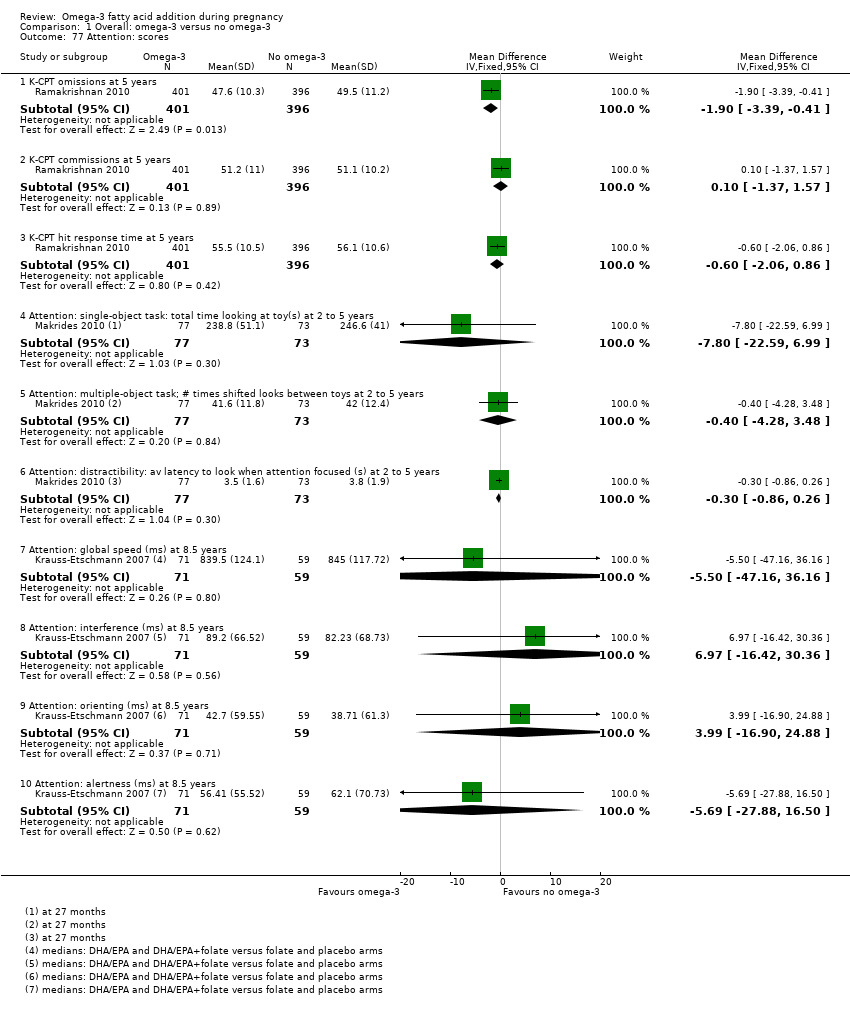
Comparison 1 Overall: omega‐3 versus no omega‐3, Outcome 77 Attention: scores.
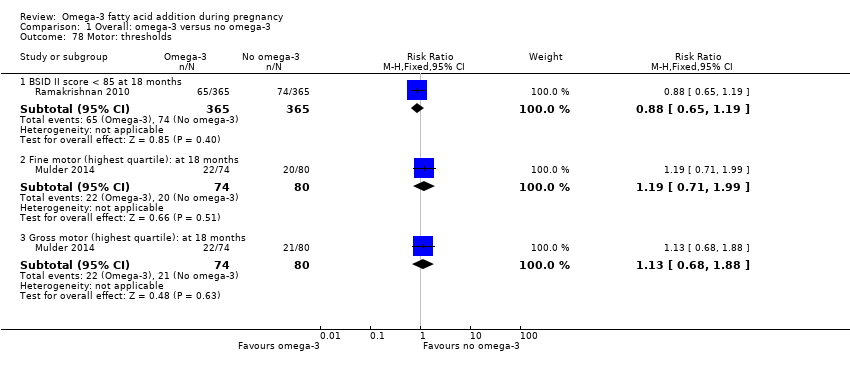
Comparison 1 Overall: omega‐3 versus no omega‐3, Outcome 78 Motor: thresholds.
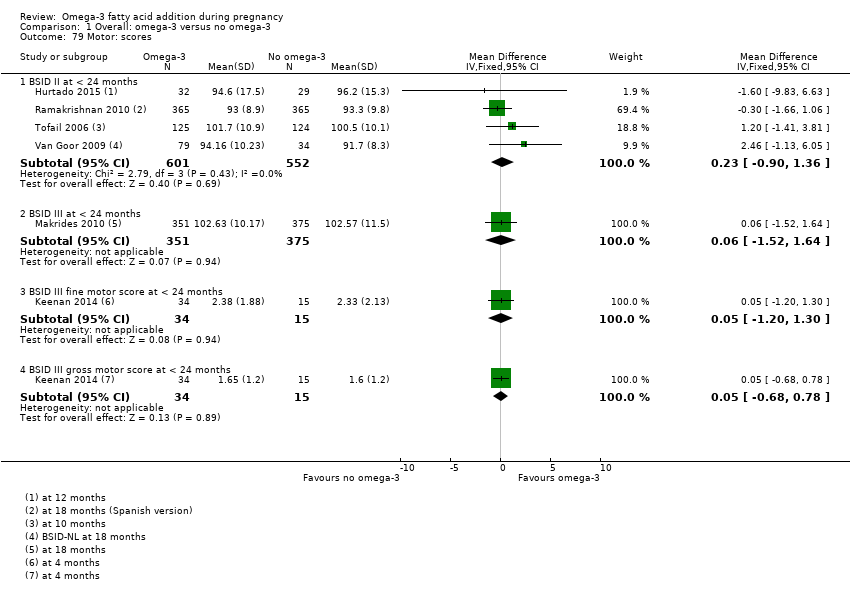
Comparison 1 Overall: omega‐3 versus no omega‐3, Outcome 79 Motor: scores.

Comparison 1 Overall: omega‐3 versus no omega‐3, Outcome 80 Language: thresholds.

Comparison 1 Overall: omega‐3 versus no omega‐3, Outcome 81 Language: scores.
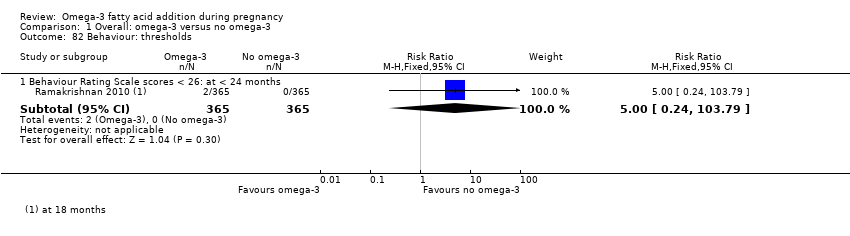
Comparison 1 Overall: omega‐3 versus no omega‐3, Outcome 82 Behaviour: thresholds.

Comparison 1 Overall: omega‐3 versus no omega‐3, Outcome 83 Behaviour: scores.

Comparison 1 Overall: omega‐3 versus no omega‐3, Outcome 84 Vision: visual acuity (cycles/degree).
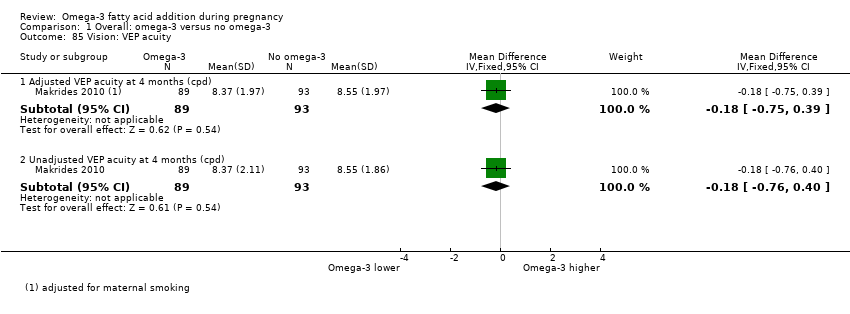
Comparison 1 Overall: omega‐3 versus no omega‐3, Outcome 85 Vision: VEP acuity.

Comparison 1 Overall: omega‐3 versus no omega‐3, Outcome 86 Vision: VEP latency.
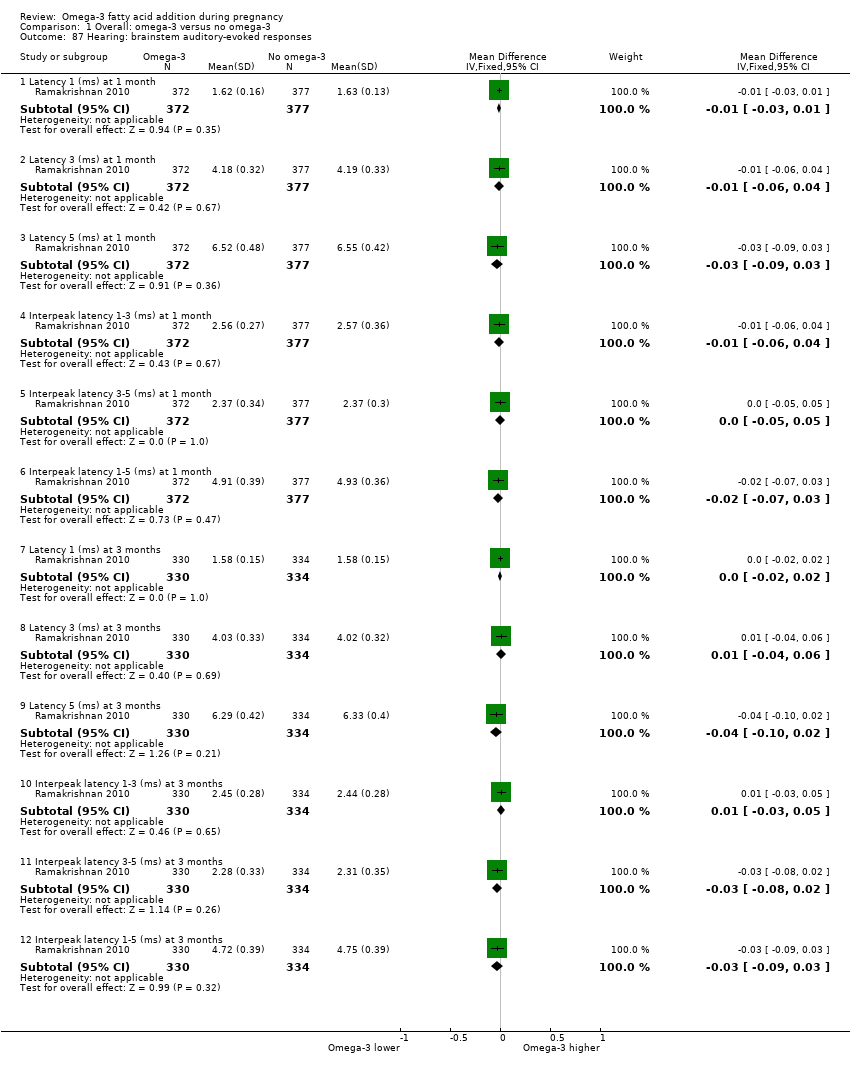
Comparison 1 Overall: omega‐3 versus no omega‐3, Outcome 87 Hearing: brainstem auditory‐evoked responses.

Comparison 1 Overall: omega‐3 versus no omega‐3, Outcome 88 Neurodevelopment: thresholds.

Comparison 1 Overall: omega‐3 versus no omega‐3, Outcome 89 Neurodevelopment: scores.
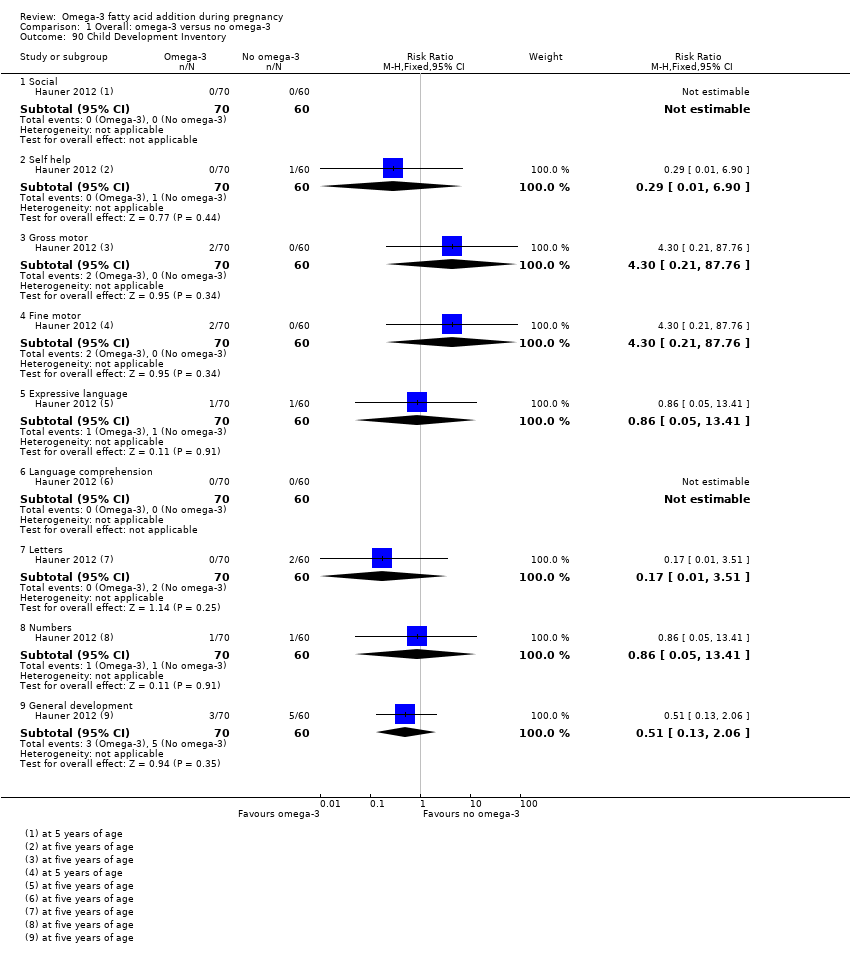
Comparison 1 Overall: omega‐3 versus no omega‐3, Outcome 90 Child Development Inventory.
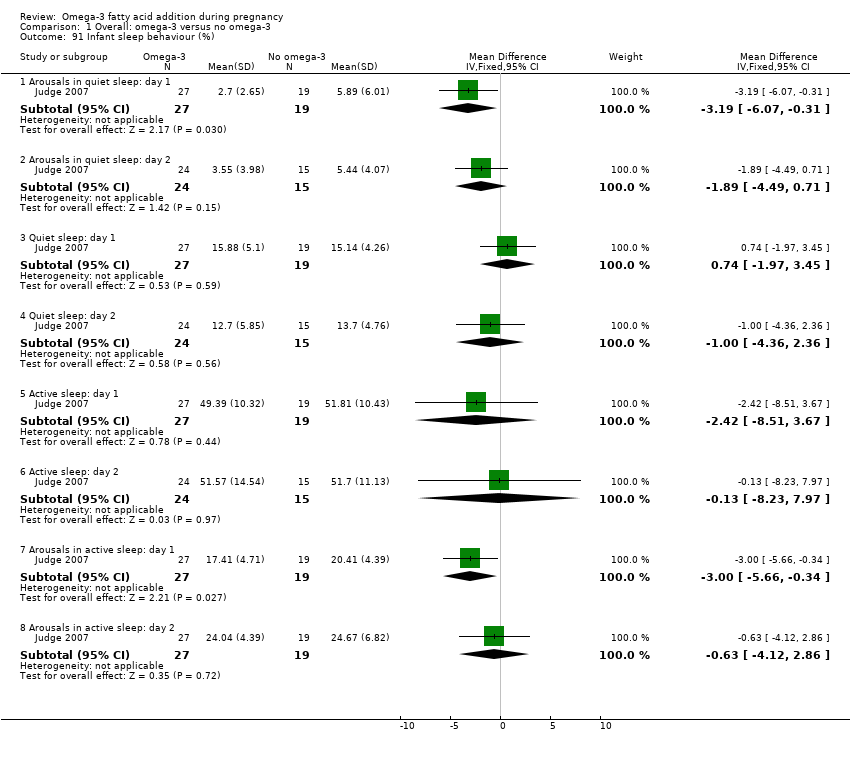
Comparison 1 Overall: omega‐3 versus no omega‐3, Outcome 91 Infant sleep behaviour (%).

Comparison 1 Overall: omega‐3 versus no omega‐3, Outcome 92 Cerebral palsy.

Comparison 2 Type of omega‐3 intervention, Outcome 1 Preterm birth (< 37 weeks).

Comparison 2 Type of omega‐3 intervention, Outcome 2 Early preterm birth (< 34 weeks).
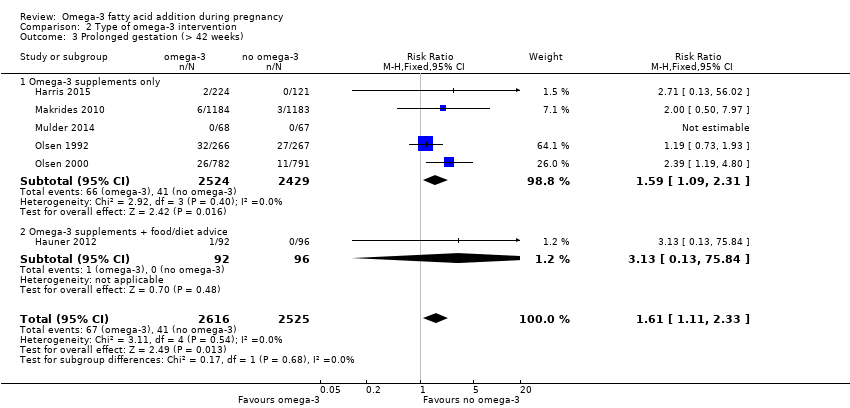
Comparison 2 Type of omega‐3 intervention, Outcome 3 Prolonged gestation (> 42 weeks).

Comparison 2 Type of omega‐3 intervention, Outcome 4 Maternal death.

Comparison 2 Type of omega‐3 intervention, Outcome 5 Pre‐eclampsia (hypertension with proteinuria).

Comparison 2 Type of omega‐3 intervention, Outcome 6 High blood pressure (without proteinuria).

Comparison 2 Type of omega‐3 intervention, Outcome 7 Eclampsia.

Comparison 2 Type of omega‐3 intervention, Outcome 8 Maternal antepartum hospitalisation.

Comparison 2 Type of omega‐3 intervention, Outcome 9 Mother's length of stay in hospital (days).
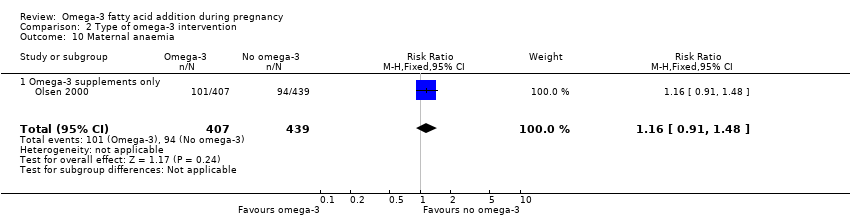
Comparison 2 Type of omega‐3 intervention, Outcome 10 Maternal anaemia.
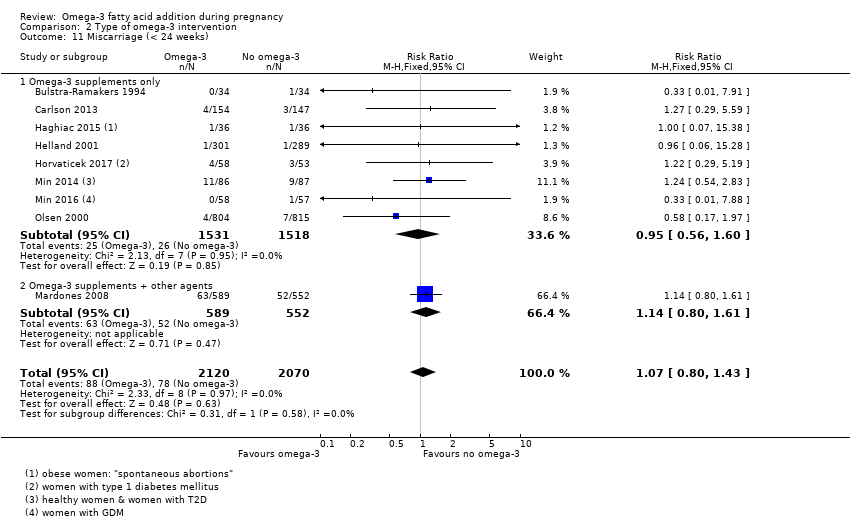
Comparison 2 Type of omega‐3 intervention, Outcome 11 Miscarriage (< 24 weeks).

Comparison 2 Type of omega‐3 intervention, Outcome 12 Antepartum vaginal bleeding.

Comparison 2 Type of omega‐3 intervention, Outcome 13 Preterm prelabour rupture of membranes.

Comparison 2 Type of omega‐3 intervention, Outcome 14 Prelabour rupture of membranes.
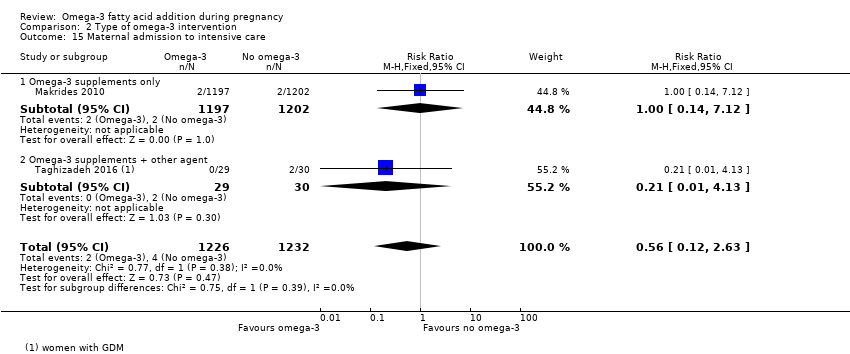
Comparison 2 Type of omega‐3 intervention, Outcome 15 Maternal admission to intensive care.
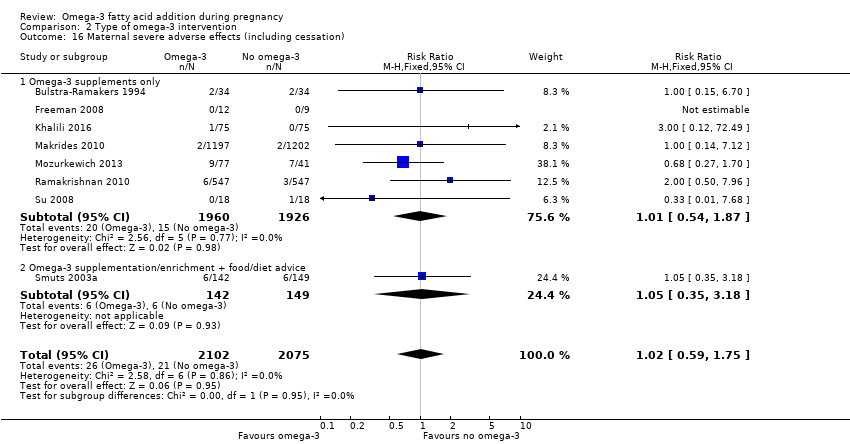
Comparison 2 Type of omega‐3 intervention, Outcome 16 Maternal severe adverse effects (including cessation).

Comparison 2 Type of omega‐3 intervention, Outcome 17 Caesarean section.

Comparison 2 Type of omega‐3 intervention, Outcome 18 Induction (post‐term).

Comparison 2 Type of omega‐3 intervention, Outcome 19 Blood loss at birth (mL).

Comparison 2 Type of omega‐3 intervention, Outcome 20 Postpartum haemorrhage.

Comparison 2 Type of omega‐3 intervention, Outcome 21 Gestational diabetes.

Comparison 2 Type of omega‐3 intervention, Outcome 22 Maternal insulin resistance (HOMA‐IR).

Comparison 2 Type of omega‐3 intervention, Outcome 23 Excessive gestational weight gain.

Comparison 2 Type of omega‐3 intervention, Outcome 24 Gestational weight gain (kg).

Comparison 2 Type of omega‐3 intervention, Outcome 25 Depression during pregnancy: scores.
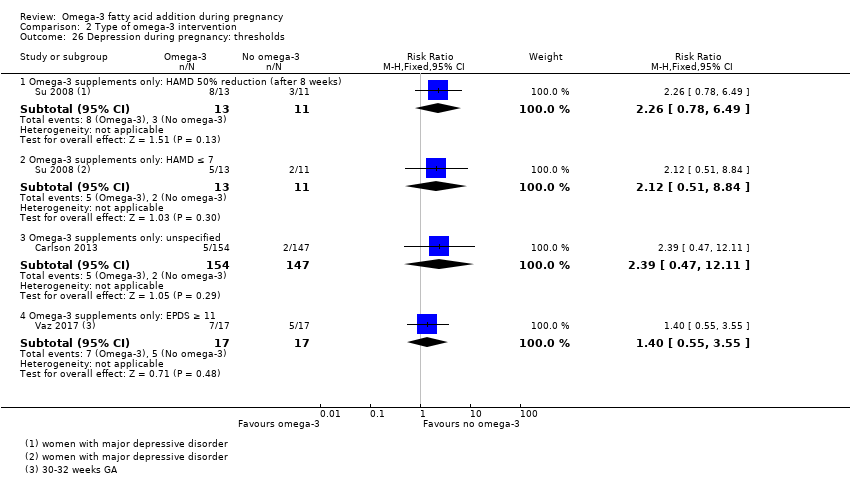
Comparison 2 Type of omega‐3 intervention, Outcome 26 Depression during pregnancy: thresholds.
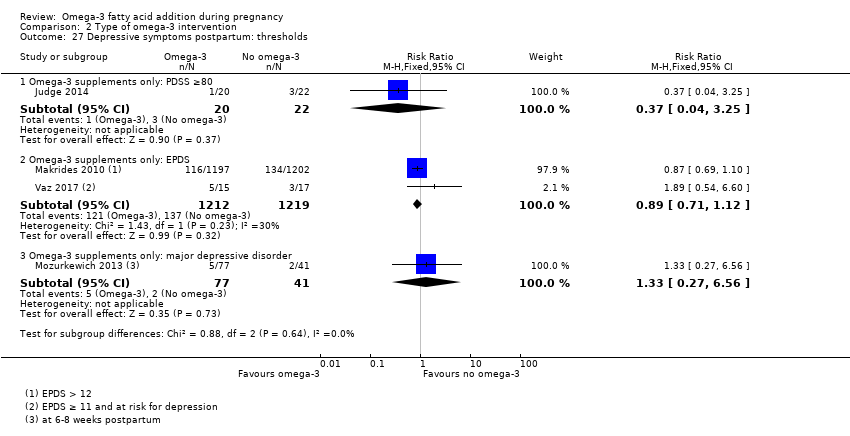
Comparison 2 Type of omega‐3 intervention, Outcome 27 Depressive symptoms postpartum: thresholds.
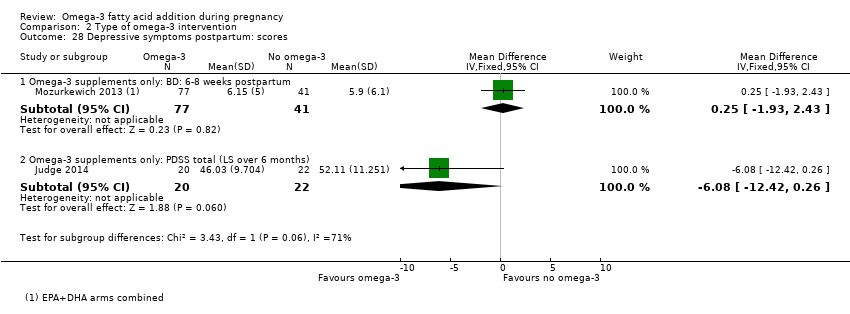
Comparison 2 Type of omega‐3 intervention, Outcome 28 Depressive symptoms postpartum: scores.
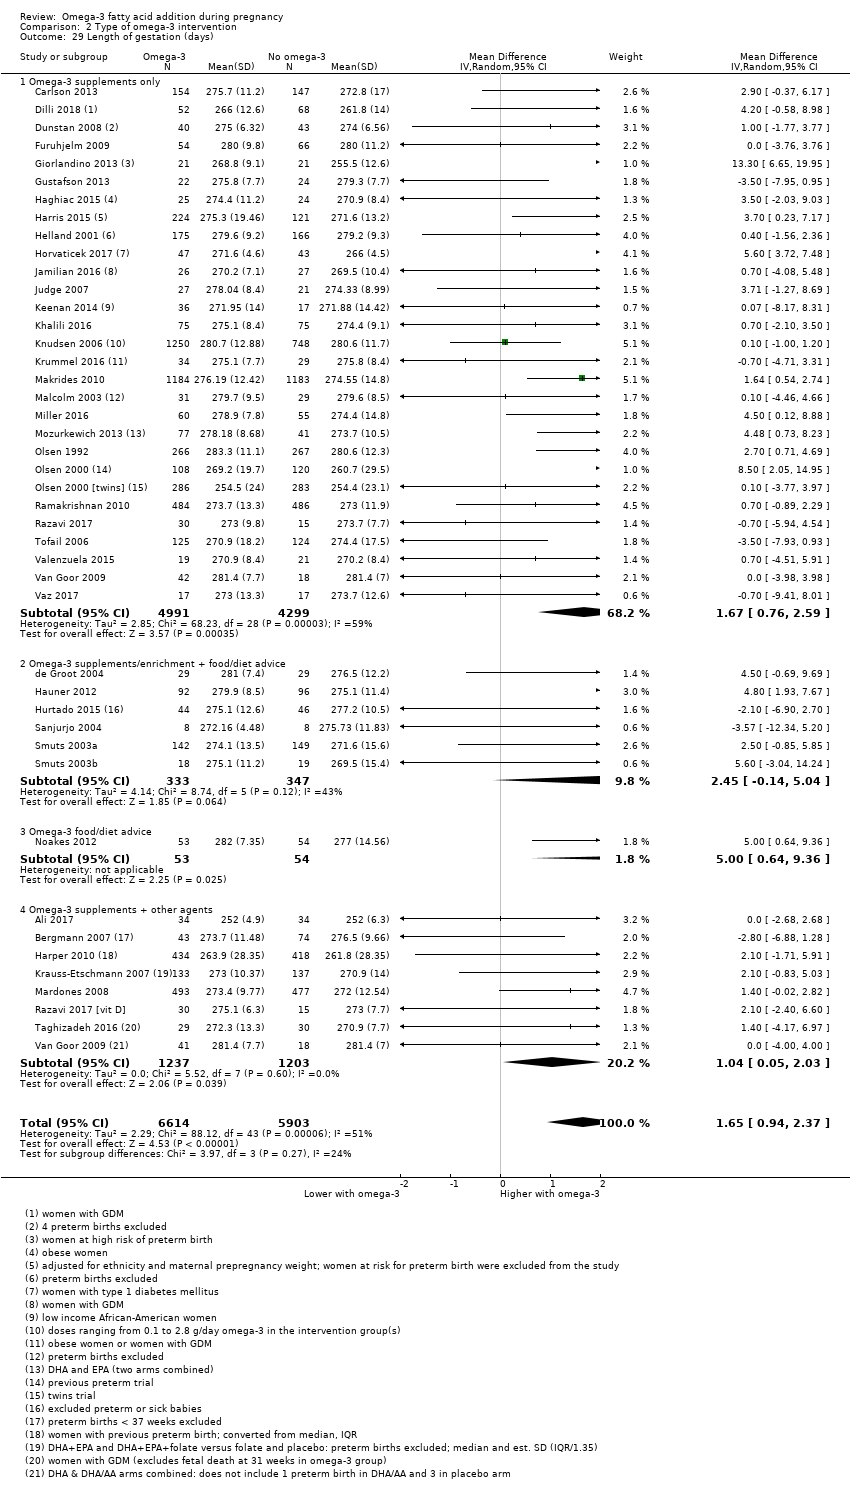
Comparison 2 Type of omega‐3 intervention, Outcome 29 Length of gestation (days).

Comparison 2 Type of omega‐3 intervention, Outcome 30 Perinatal death.

Comparison 2 Type of omega‐3 intervention, Outcome 31 Stillbirth.

Comparison 2 Type of omega‐3 intervention, Outcome 32 Neonatal death.

Comparison 2 Type of omega‐3 intervention, Outcome 33 Infant death.

Comparison 2 Type of omega‐3 intervention, Outcome 34 Large‐for‐gestational age.

Comparison 2 Type of omega‐3 intervention, Outcome 35 Macrosomia.

Comparison 2 Type of omega‐3 intervention, Outcome 36 Low birthweight (< 2500 g).
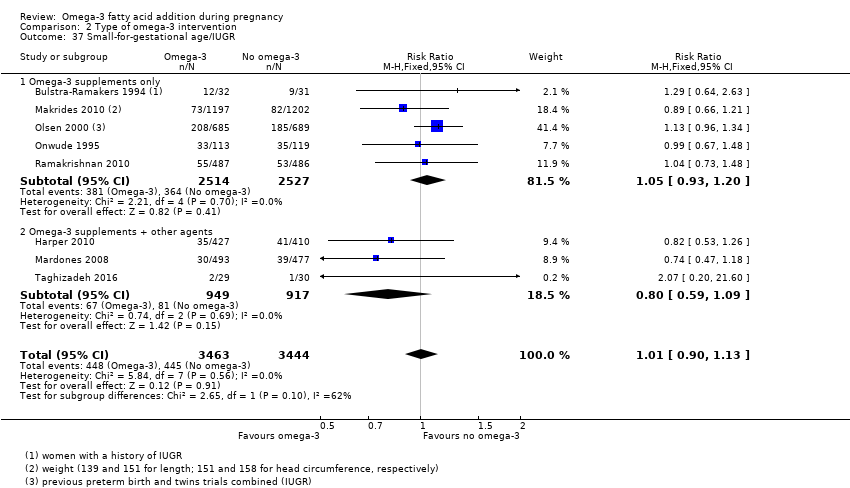
Comparison 2 Type of omega‐3 intervention, Outcome 37 Small‐for‐gestational age/IUGR.
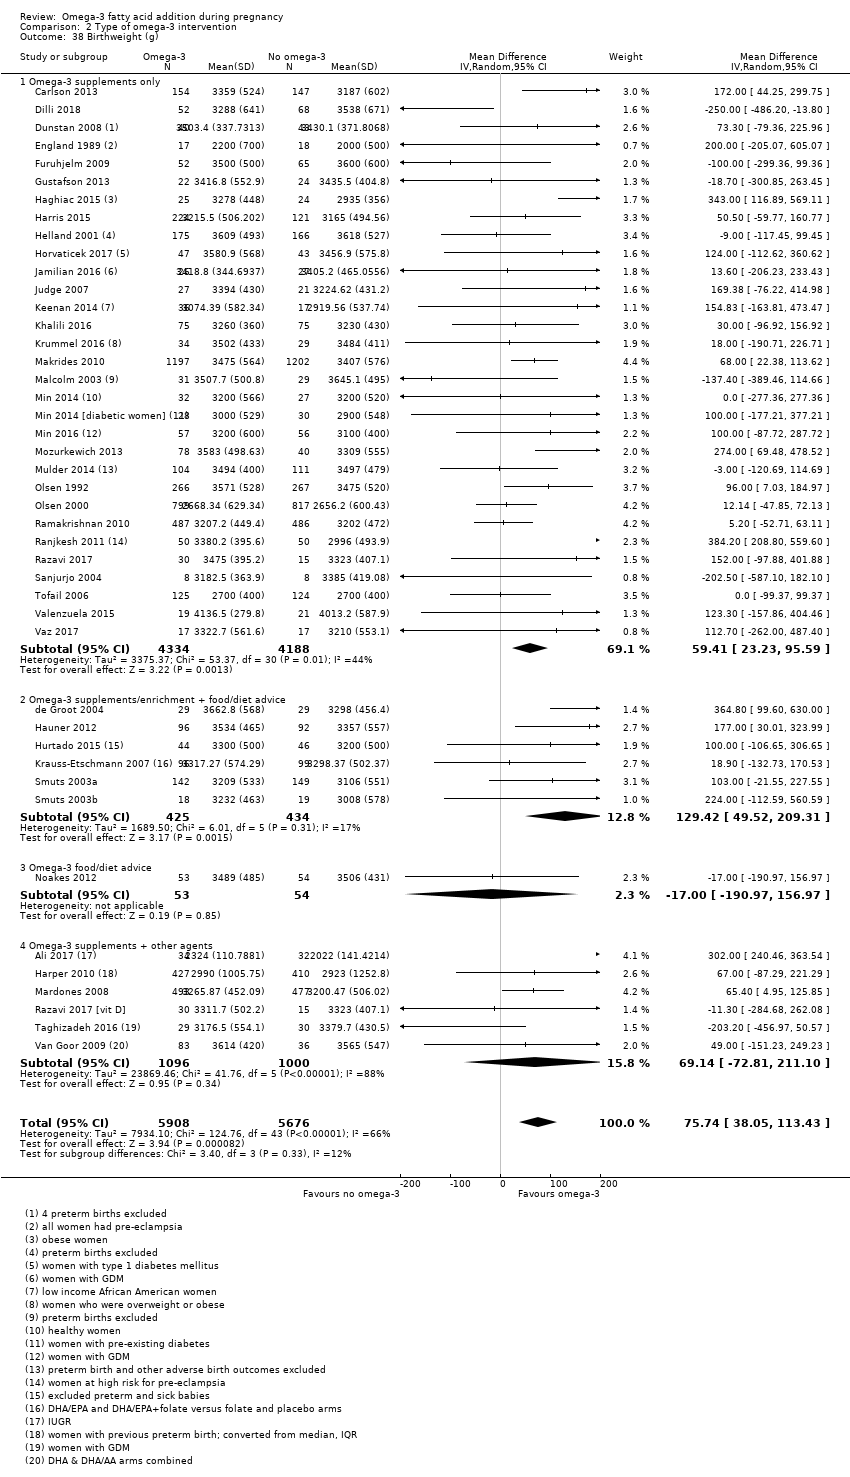
Comparison 2 Type of omega‐3 intervention, Outcome 38 Birthweight (g).
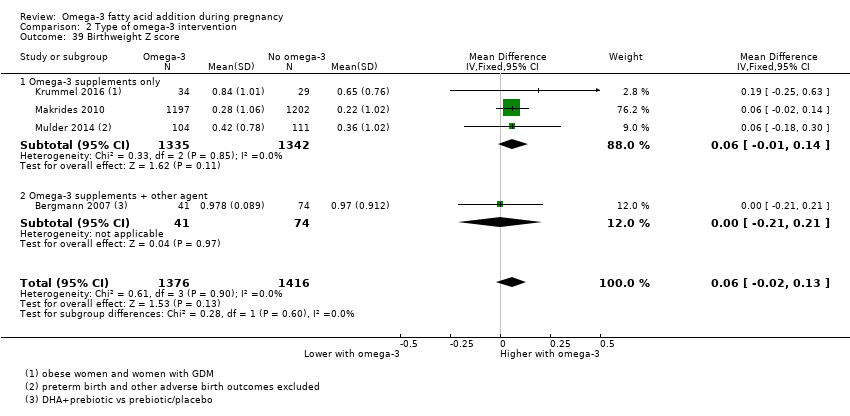
Comparison 2 Type of omega‐3 intervention, Outcome 39 Birthweight Z score.
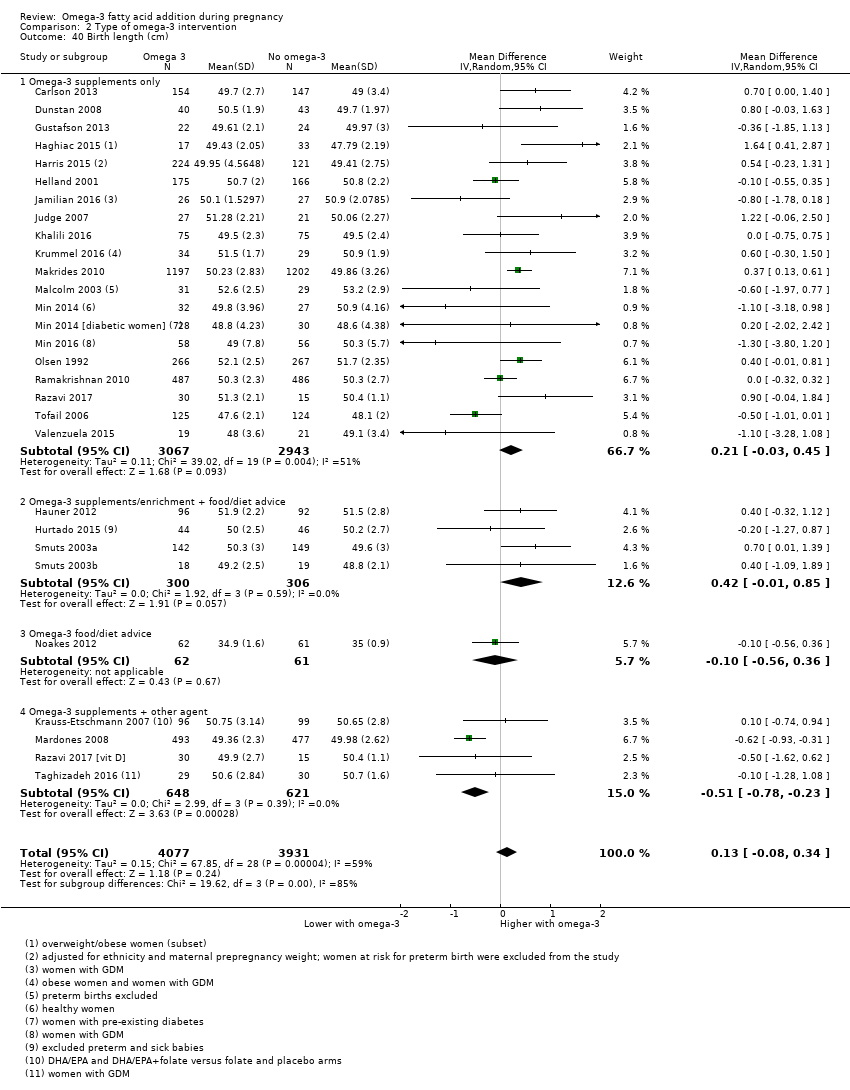
Comparison 2 Type of omega‐3 intervention, Outcome 40 Birth length (cm).

Comparison 2 Type of omega‐3 intervention, Outcome 41 Length at birth Z score.

Comparison 2 Type of omega‐3 intervention, Outcome 42 Head circumference at birth (cm).

Comparison 2 Type of omega‐3 intervention, Outcome 43 Head circumference at birth Z score.

Comparison 2 Type of omega‐3 intervention, Outcome 44 Baby admitted to neonatal care.
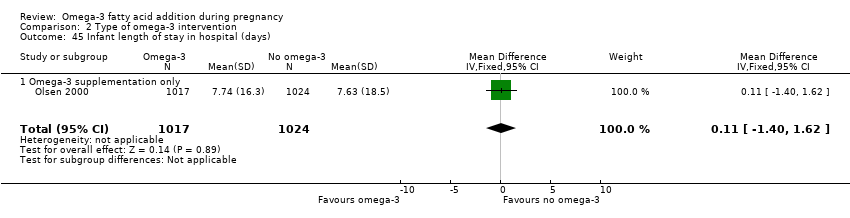
Comparison 2 Type of omega‐3 intervention, Outcome 45 Infant length of stay in hospital (days).

Comparison 2 Type of omega‐3 intervention, Outcome 46 Congenital anomalies.
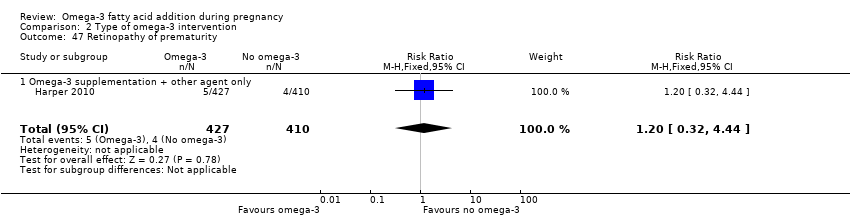
Comparison 2 Type of omega‐3 intervention, Outcome 47 Retinopathy of prematurity.
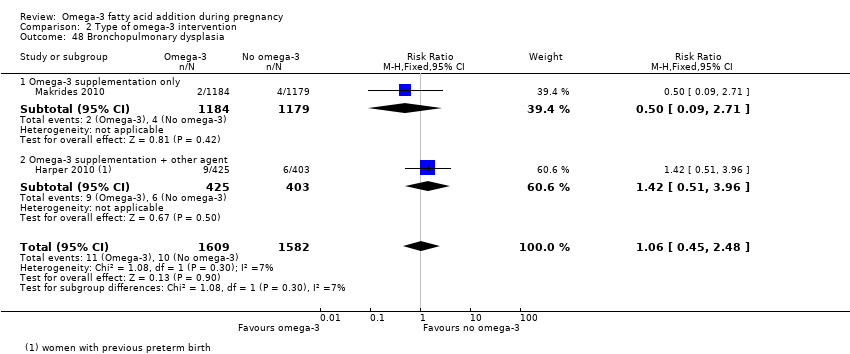
Comparison 2 Type of omega‐3 intervention, Outcome 48 Bronchopulmonary dysplasia.

Comparison 2 Type of omega‐3 intervention, Outcome 49 Respiratory distress syndrome.

Comparison 2 Type of omega‐3 intervention, Outcome 50 Necrotising enterocolitis (NEC).
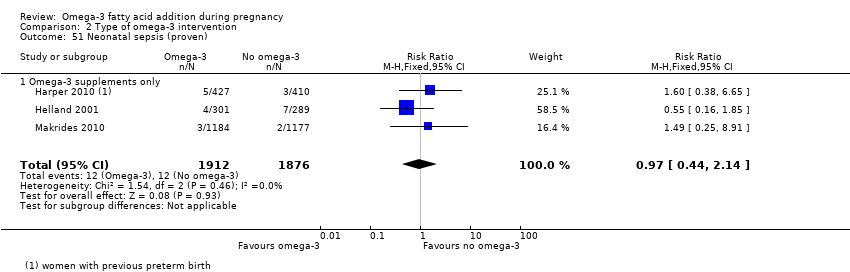
Comparison 2 Type of omega‐3 intervention, Outcome 51 Neonatal sepsis (proven).

Comparison 2 Type of omega‐3 intervention, Outcome 52 Convulsion.
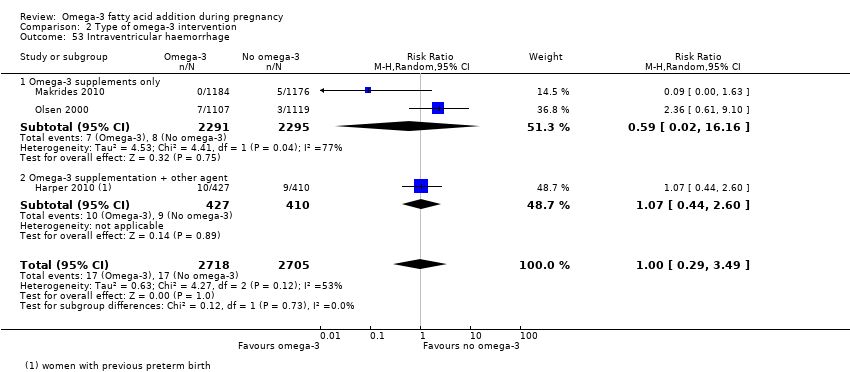
Comparison 2 Type of omega‐3 intervention, Outcome 53 Intraventricular haemorrhage.

Comparison 2 Type of omega‐3 intervention, Outcome 54 Neonatal/infant serious adverse events.

Comparison 2 Type of omega‐3 intervention, Outcome 55 Neonatal/infant morbidity: cardiovascular.

Comparison 2 Type of omega‐3 intervention, Outcome 56 Neonatal/infant morbidity: respiratory.

Comparison 2 Type of omega‐3 intervention, Outcome 57 Neonatal/infant morbidity: caused by pregnancy/birth.

Comparison 2 Type of omega‐3 intervention, Outcome 58 Ponderal index.
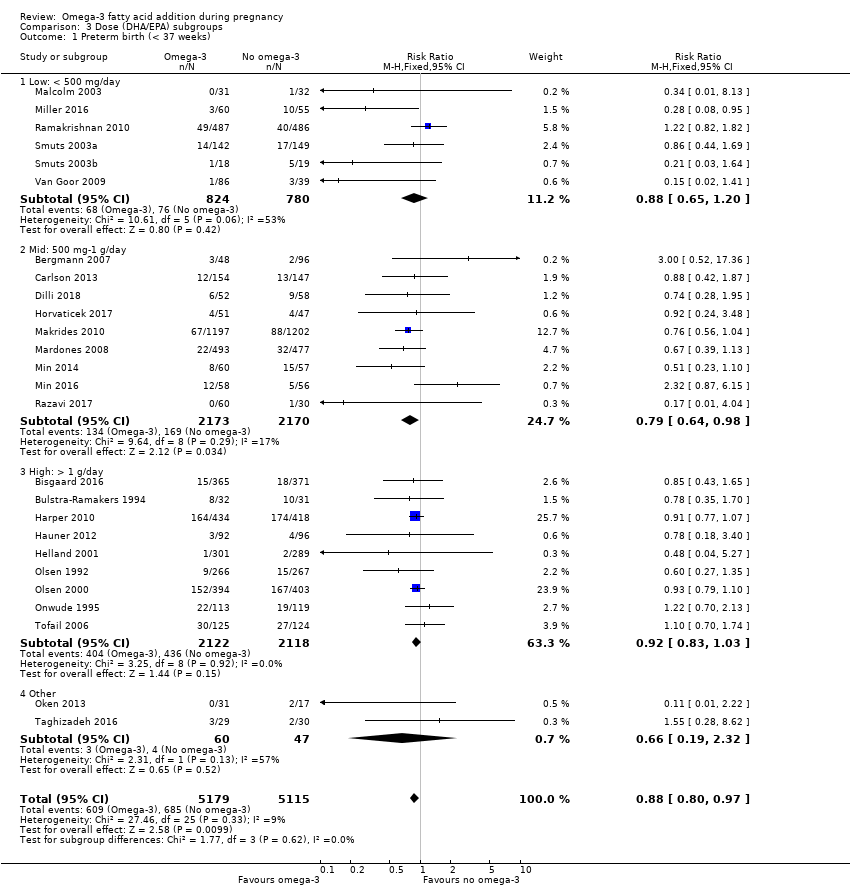
Comparison 3 Dose (DHA/EPA) subgroups, Outcome 1 Preterm birth (< 37 weeks).
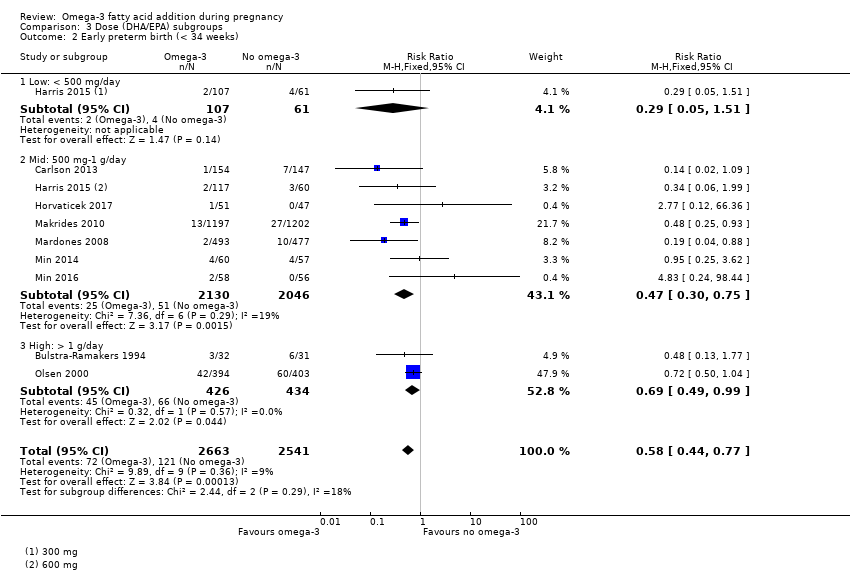
Comparison 3 Dose (DHA/EPA) subgroups, Outcome 2 Early preterm birth (< 34 weeks).
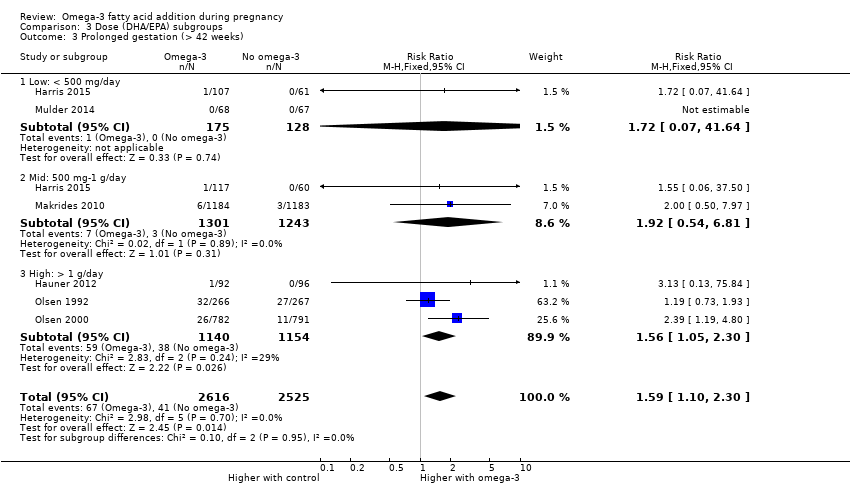
Comparison 3 Dose (DHA/EPA) subgroups, Outcome 3 Prolonged gestation (> 42 weeks).
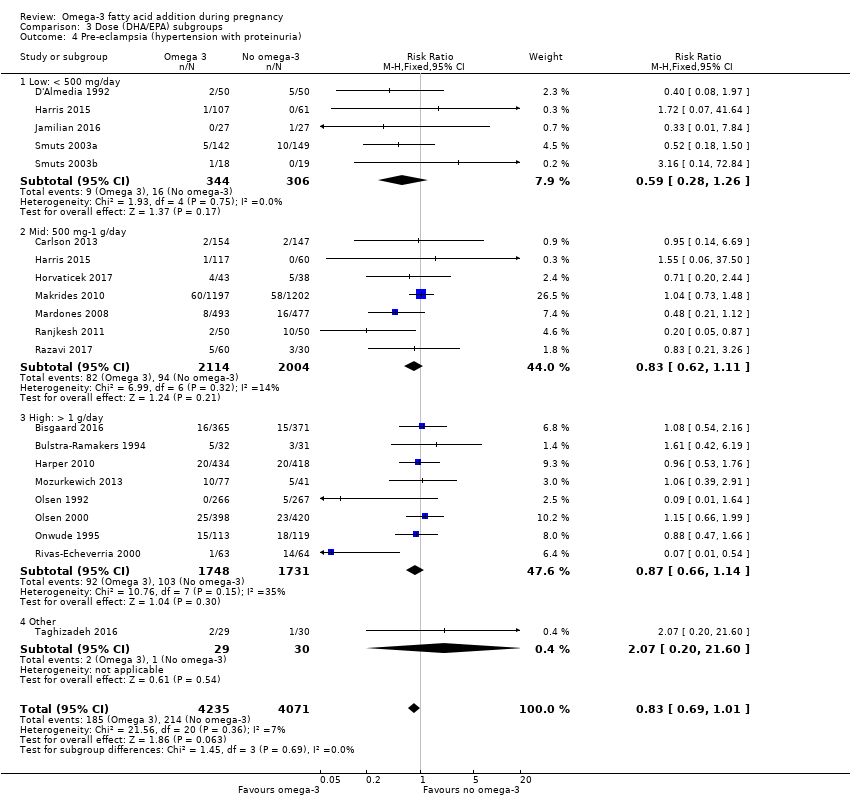
Comparison 3 Dose (DHA/EPA) subgroups, Outcome 4 Pre‐eclampsia (hypertension with proteinuria).

Comparison 3 Dose (DHA/EPA) subgroups, Outcome 5 Caesarean section.

Comparison 3 Dose (DHA/EPA) subgroups, Outcome 6 Length of gestation (days).

Comparison 3 Dose (DHA/EPA) subgroups, Outcome 7 Perinatal death.

Comparison 3 Dose (DHA/EPA) subgroups, Outcome 8 Stillbirth.
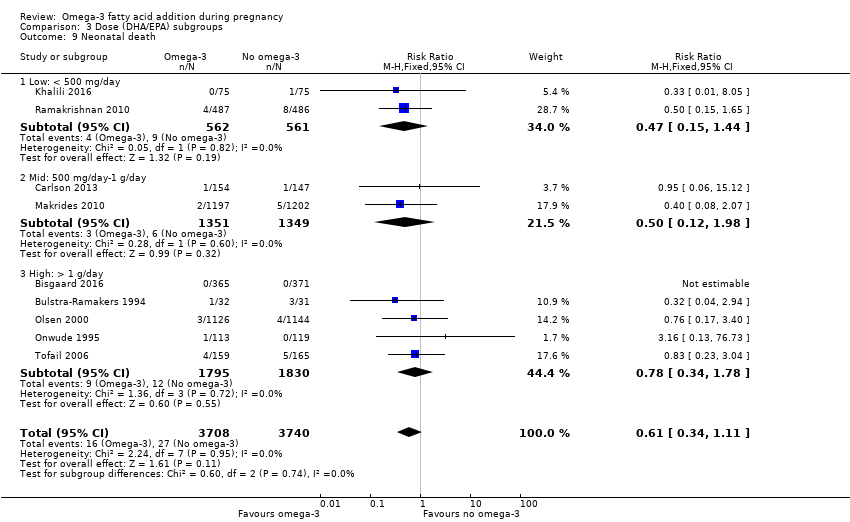
Comparison 3 Dose (DHA/EPA) subgroups, Outcome 9 Neonatal death.
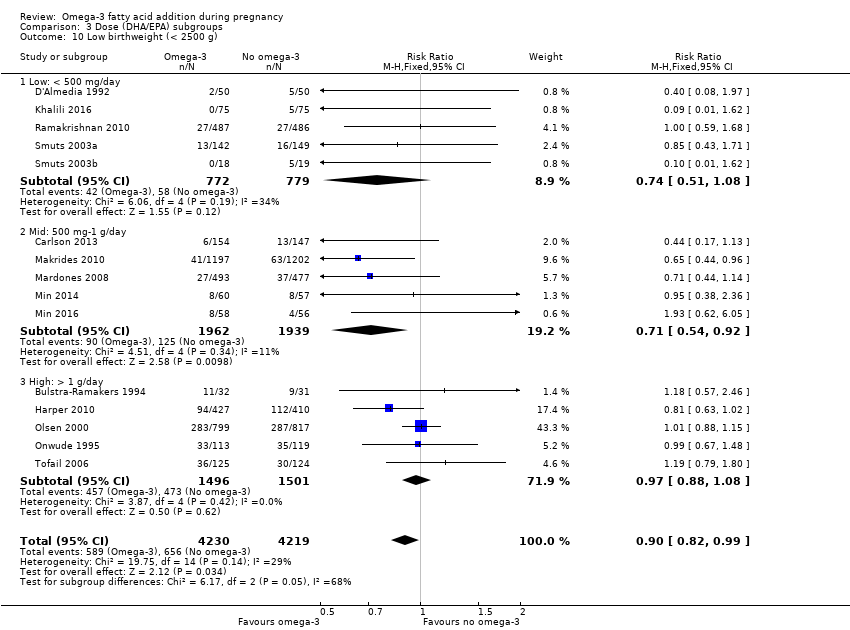
Comparison 3 Dose (DHA/EPA) subgroups, Outcome 10 Low birthweight (< 2500 g).

Comparison 3 Dose (DHA/EPA) subgroups, Outcome 11 Small‐for‐gestational age/IUGR.

Comparison 3 Dose (DHA/EPA) subgroups, Outcome 12 Birthweight (g).

Comparison 4 Timing subgroups, Outcome 1 Preterm birth (< 37 weeks).
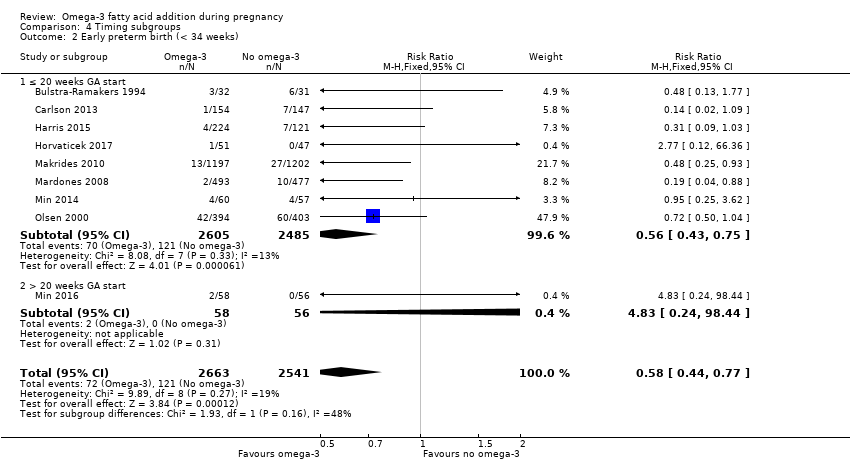
Comparison 4 Timing subgroups, Outcome 2 Early preterm birth (< 34 weeks).
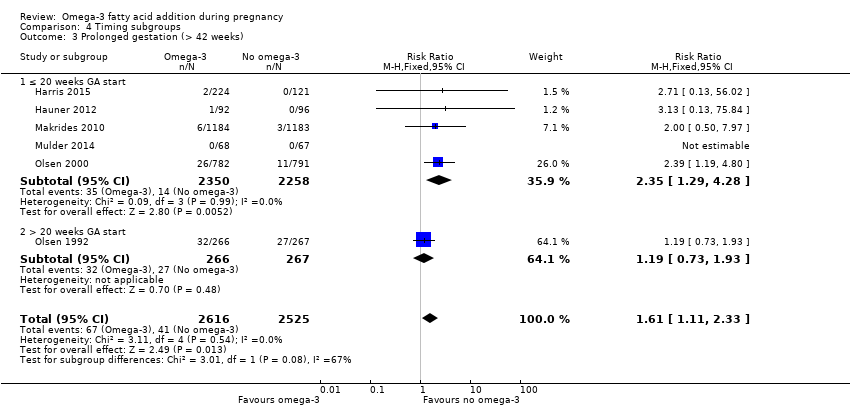
Comparison 4 Timing subgroups, Outcome 3 Prolonged gestation (> 42 weeks).

Comparison 4 Timing subgroups, Outcome 4 Pre‐eclampsia (hypertension with proteinuria).

Comparison 4 Timing subgroups, Outcome 5 Caesarean section.
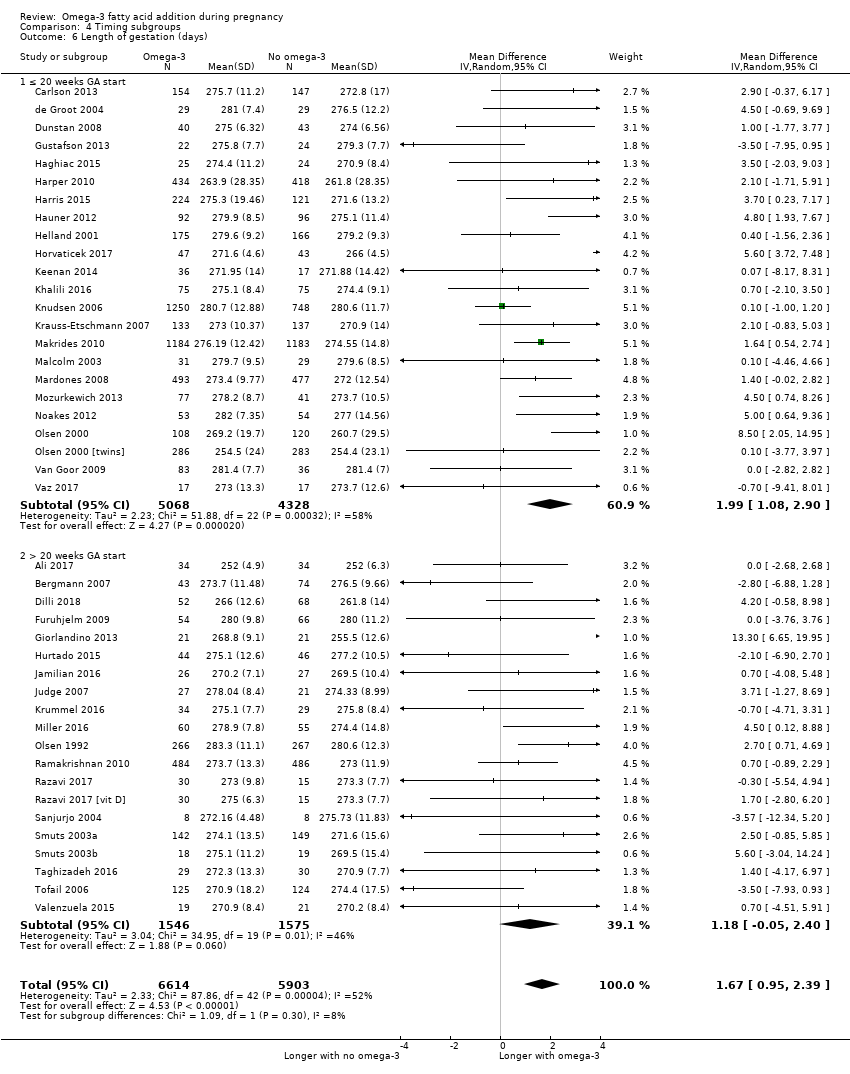
Comparison 4 Timing subgroups, Outcome 6 Length of gestation (days).
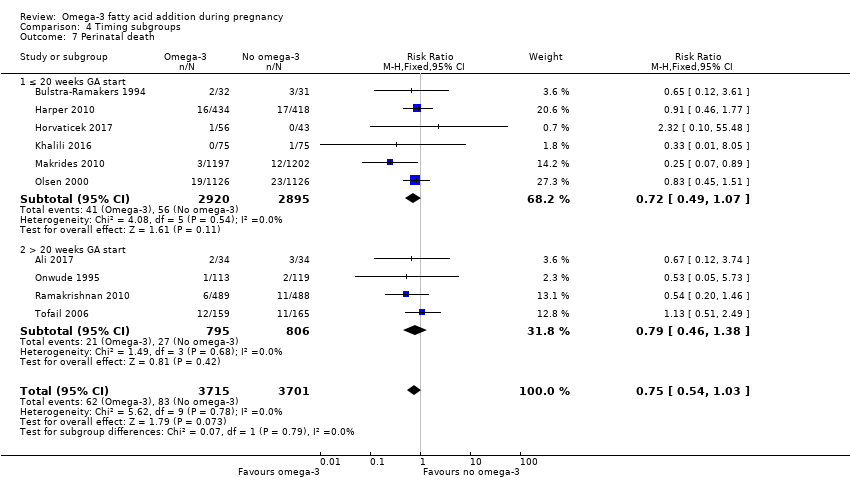
Comparison 4 Timing subgroups, Outcome 7 Perinatal death.

Comparison 4 Timing subgroups, Outcome 8 Stillbirth.
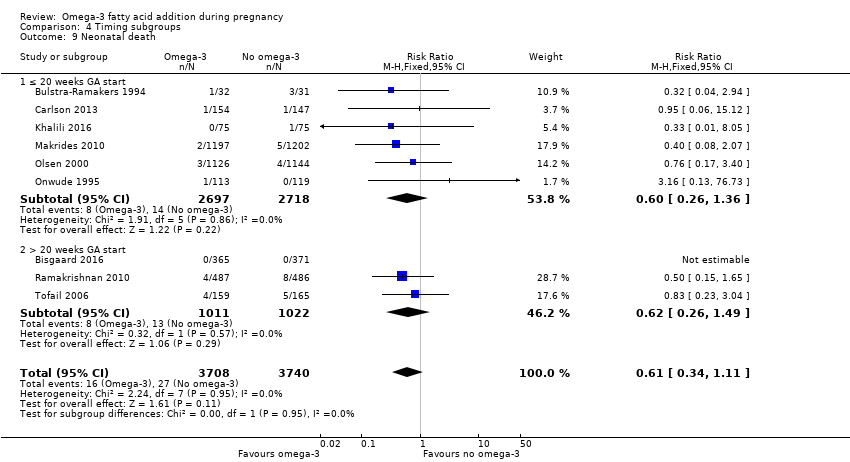
Comparison 4 Timing subgroups, Outcome 9 Neonatal death.
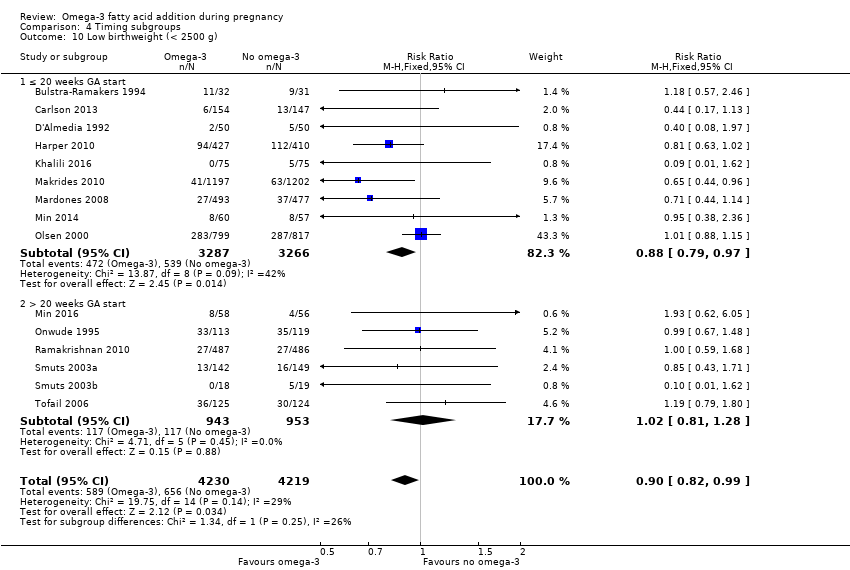
Comparison 4 Timing subgroups, Outcome 10 Low birthweight (< 2500 g).

Comparison 4 Timing subgroups, Outcome 11 Small‐for‐gestational age/IUGR.
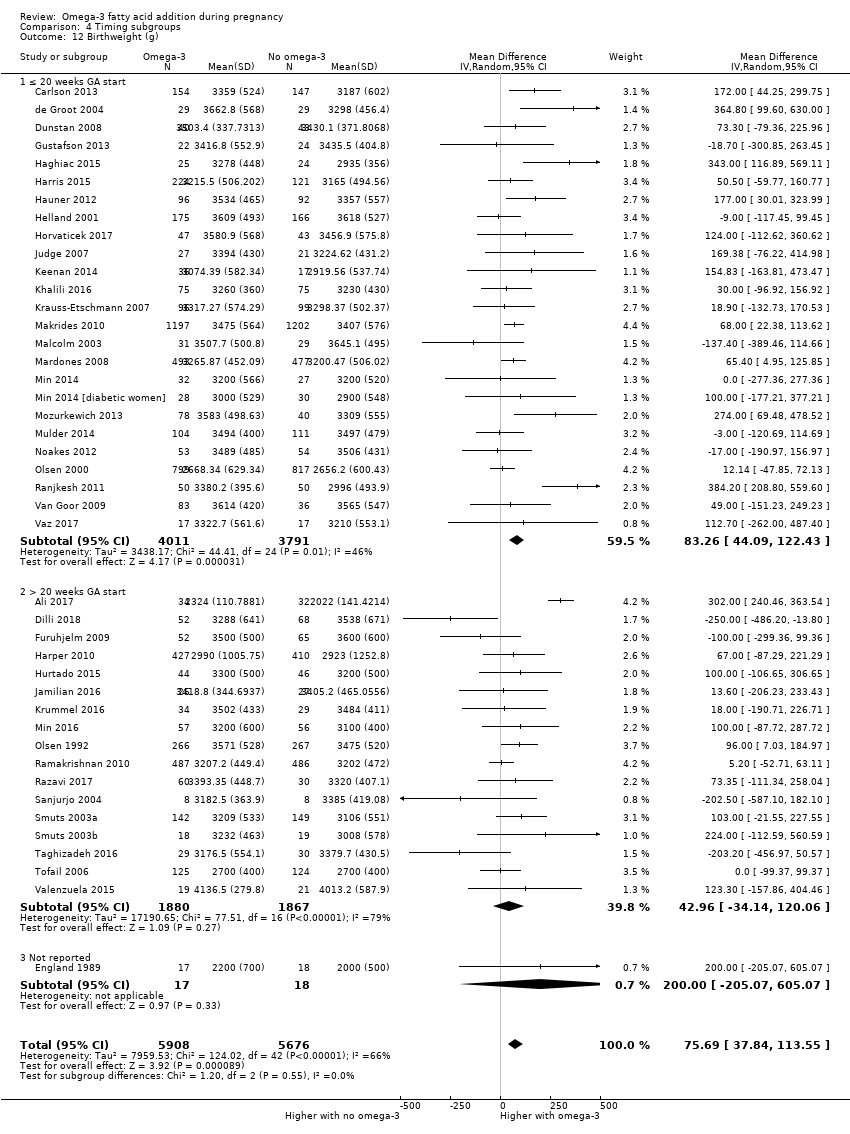
Comparison 4 Timing subgroups, Outcome 12 Birthweight (g).

Comparison 5 DHA/mixed subgroups, Outcome 1 Preterm birth (< 37 weeks).

Comparison 5 DHA/mixed subgroups, Outcome 2 Early preterm birth (< 34 weeks).
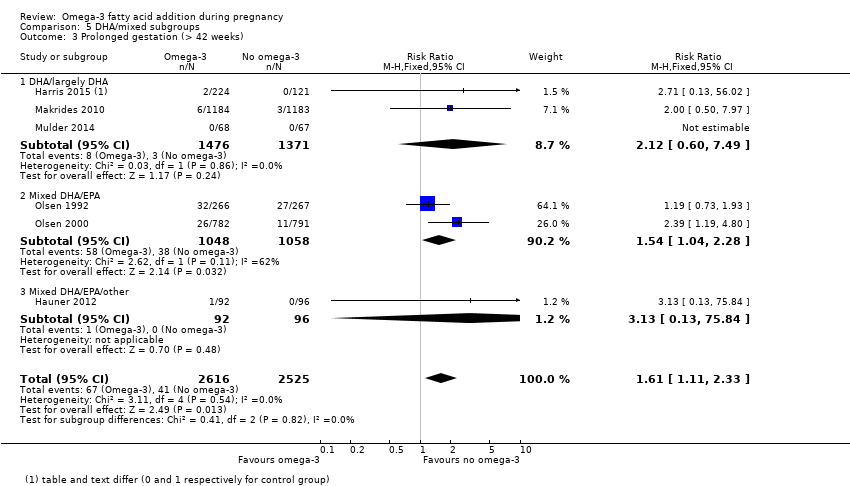
Comparison 5 DHA/mixed subgroups, Outcome 3 Prolonged gestation (> 42 weeks).
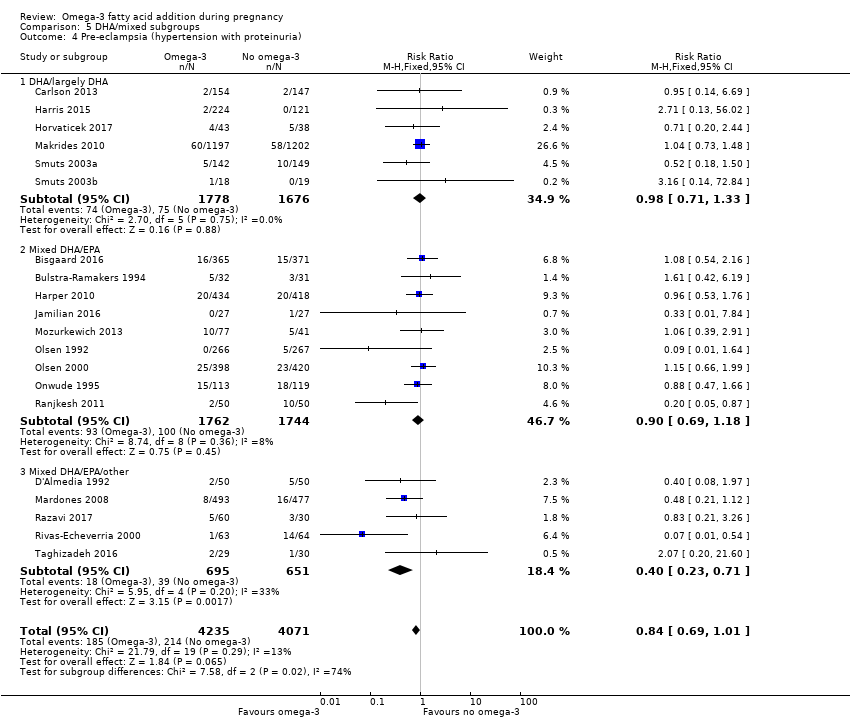
Comparison 5 DHA/mixed subgroups, Outcome 4 Pre‐eclampsia (hypertension with proteinuria).

Comparison 5 DHA/mixed subgroups, Outcome 5 Caesarean section.
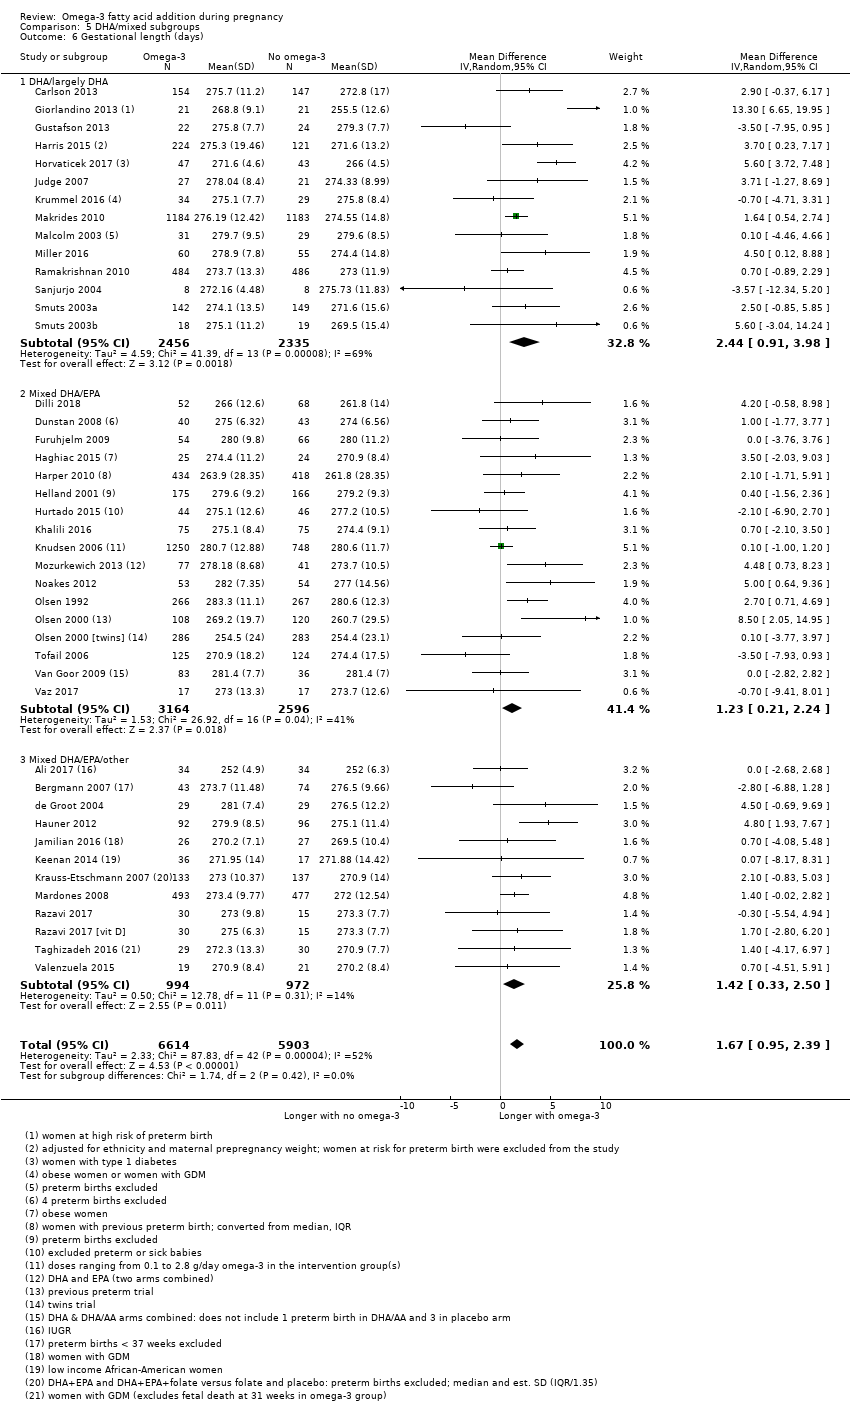
Comparison 5 DHA/mixed subgroups, Outcome 6 Gestational length (days).
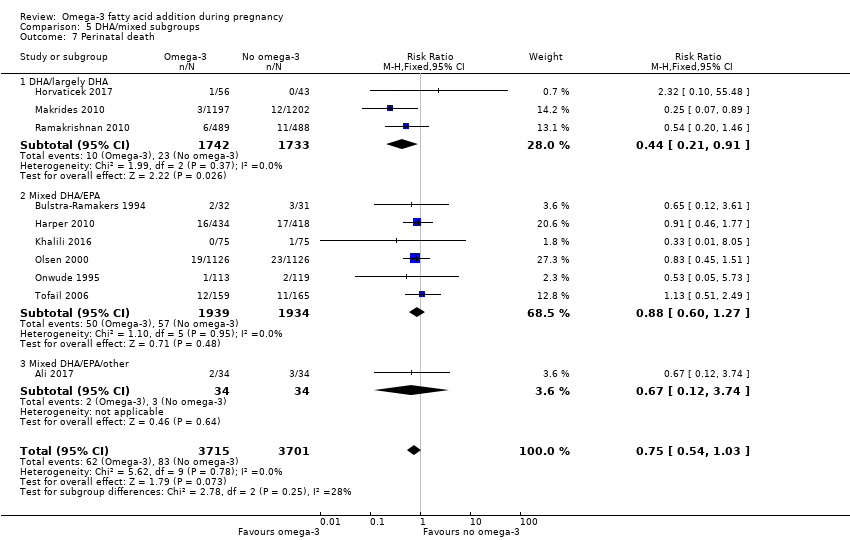
Comparison 5 DHA/mixed subgroups, Outcome 7 Perinatal death.
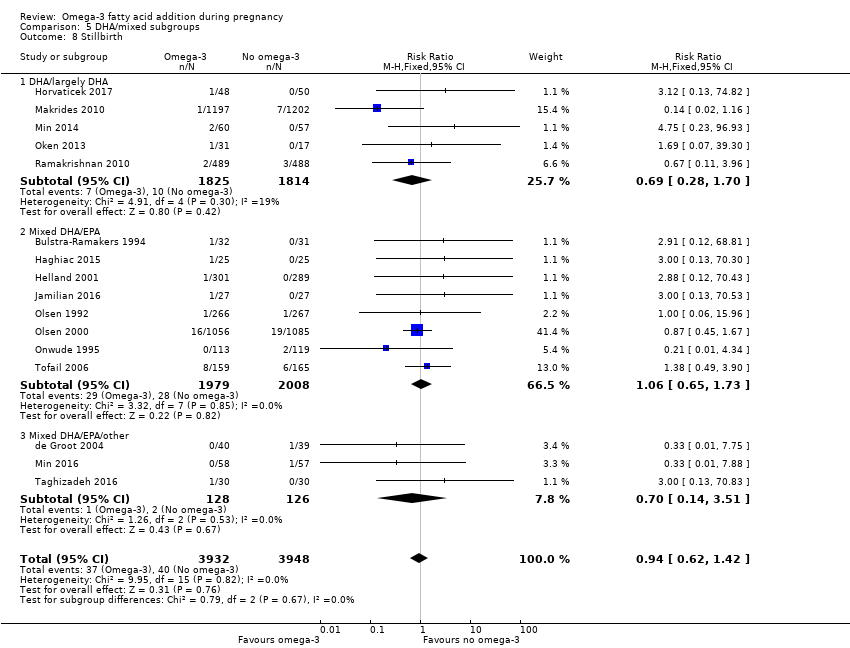
Comparison 5 DHA/mixed subgroups, Outcome 8 Stillbirth.
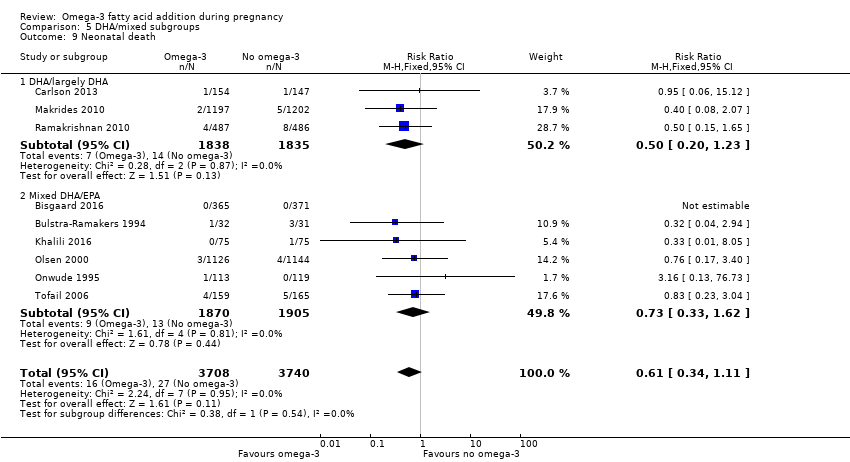
Comparison 5 DHA/mixed subgroups, Outcome 9 Neonatal death.
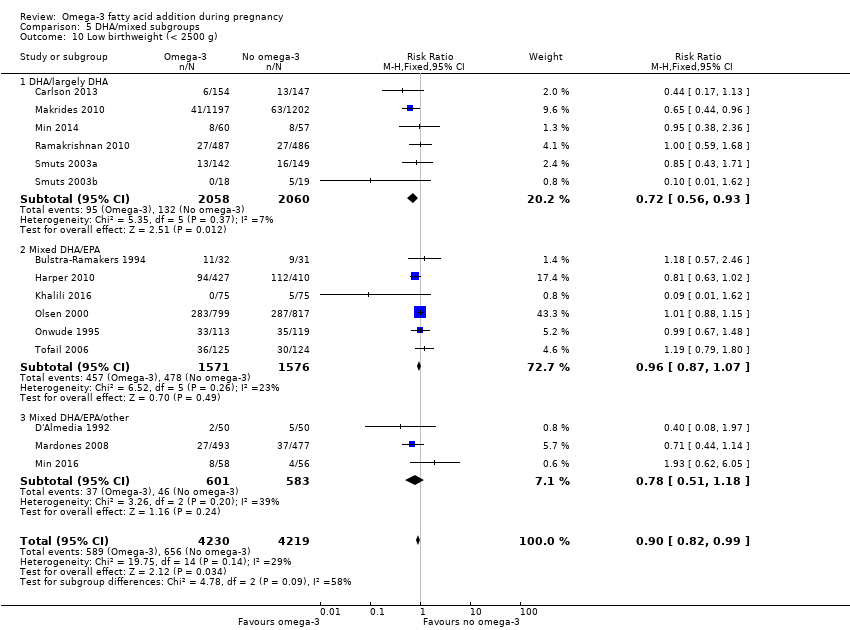
Comparison 5 DHA/mixed subgroups, Outcome 10 Low birthweight (< 2500 g).
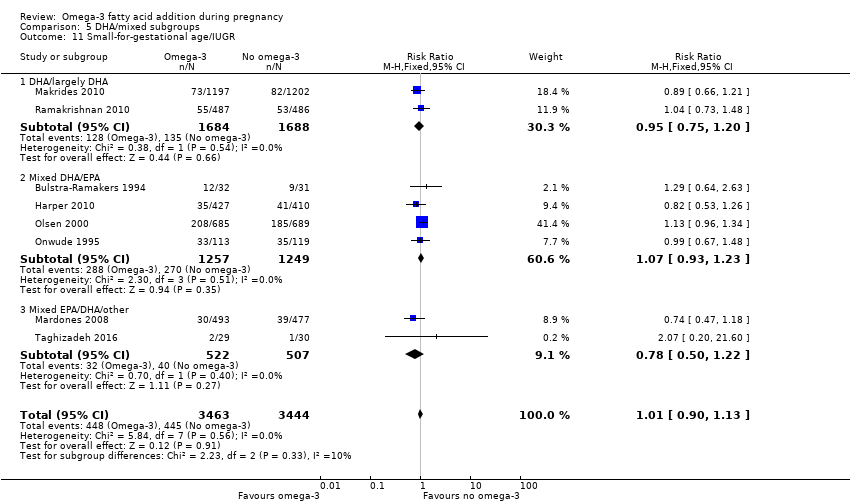
Comparison 5 DHA/mixed subgroups, Outcome 11 Small‐for‐gestational age/IUGR.

Comparison 5 DHA/mixed subgroups, Outcome 12 Birthweight (g).

Comparison 6 Risk subgroups, Outcome 1 Preterm birth (< 37 weeks).

Comparison 6 Risk subgroups, Outcome 2 Early preterm birth (< 34 weeks).

Comparison 6 Risk subgroups, Outcome 3 Prolonged gestation (> 42 weeks).

Comparison 6 Risk subgroups, Outcome 4 Pre‐eclampsia (hypertension with proteinuria).

Comparison 6 Risk subgroups, Outcome 5 Caesarean section.

Comparison 6 Risk subgroups, Outcome 6 Length of gestation (days).

Comparison 6 Risk subgroups, Outcome 7 Perinatal death.

Comparison 6 Risk subgroups, Outcome 8 Stillbirth.

Comparison 6 Risk subgroups, Outcome 9 Neonatal death.
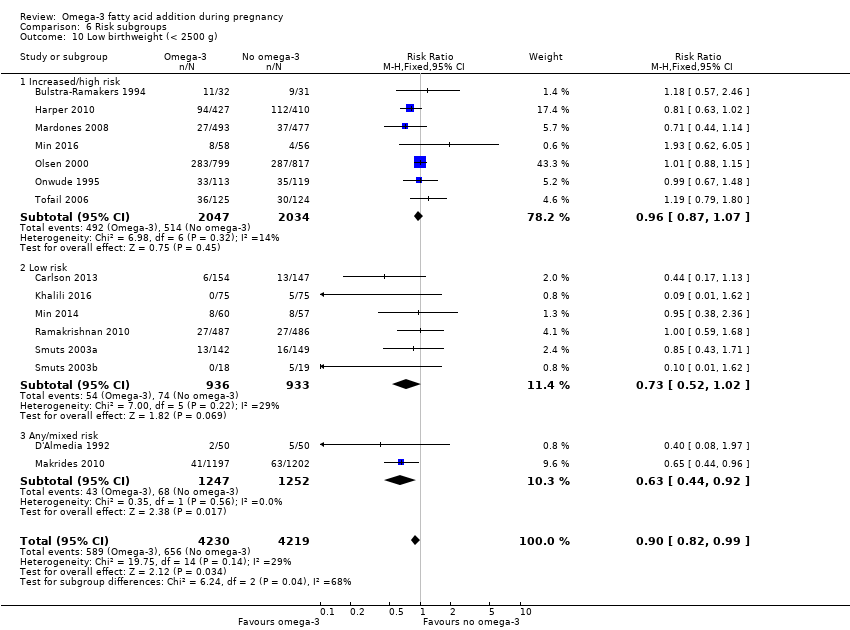
Comparison 6 Risk subgroups, Outcome 10 Low birthweight (< 2500 g).

Comparison 6 Risk subgroups, Outcome 11 Small‐for‐gestational age/IUGR.

Comparison 6 Risk subgroups, Outcome 12 Birthweight (g).
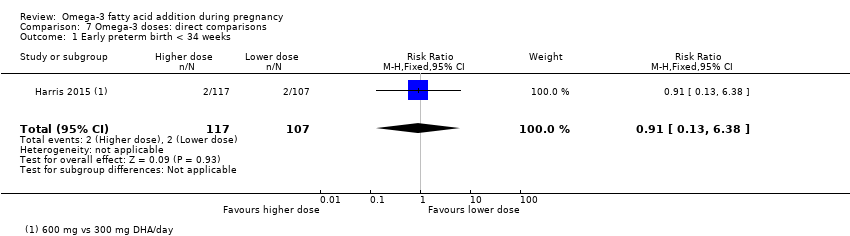
Comparison 7 Omega‐3 doses: direct comparisons, Outcome 1 Early preterm birth < 34 weeks.
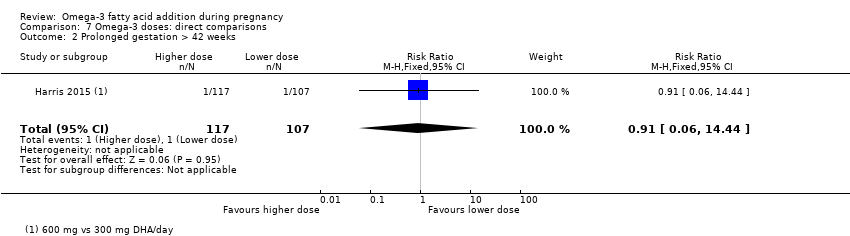
Comparison 7 Omega‐3 doses: direct comparisons, Outcome 2 Prolonged gestation > 42 weeks.

Comparison 7 Omega‐3 doses: direct comparisons, Outcome 3 Pre‐eclampsia.

Comparison 7 Omega‐3 doses: direct comparisons, Outcome 4 Induction (post‐term).
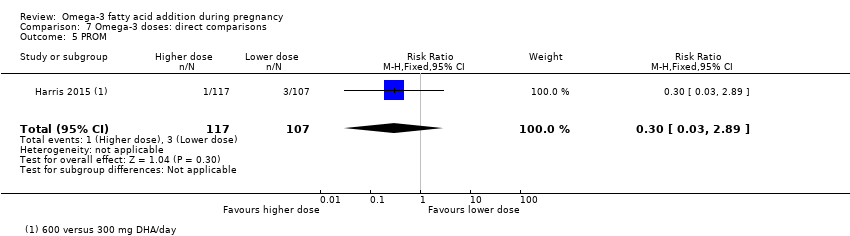
Comparison 7 Omega‐3 doses: direct comparisons, Outcome 5 PROM.

Comparison 7 Omega‐3 doses: direct comparisons, Outcome 6 PPROM.
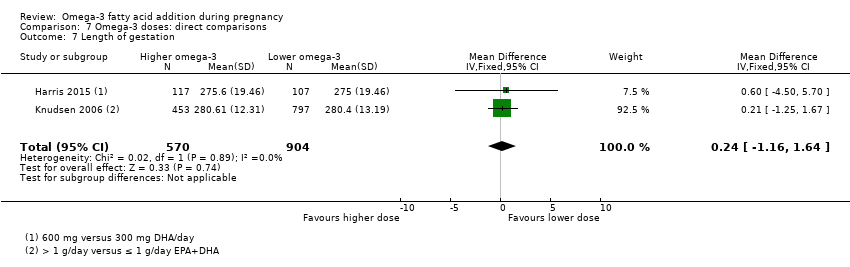
Comparison 7 Omega‐3 doses: direct comparisons, Outcome 7 Length of gestation.
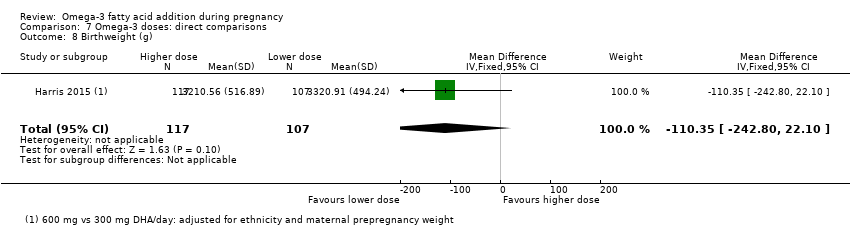
Comparison 7 Omega‐3 doses: direct comparisons, Outcome 8 Birthweight (g).

Comparison 7 Omega‐3 doses: direct comparisons, Outcome 9 Length at birth (cm).

Comparison 7 Omega‐3 doses: direct comparisons, Outcome 10 Head circumference at birth (cm).

Comparison 8 Omega‐3 type: direct comparisons, Outcome 1 Gestational diabetes.
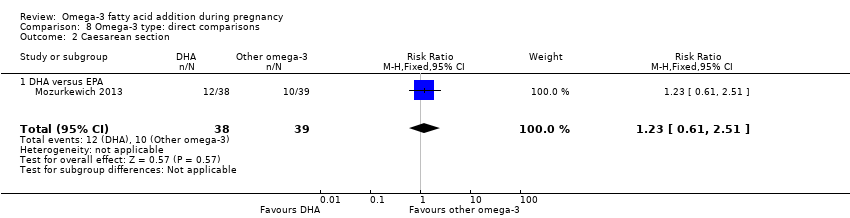
Comparison 8 Omega‐3 type: direct comparisons, Outcome 2 Caesarean section.
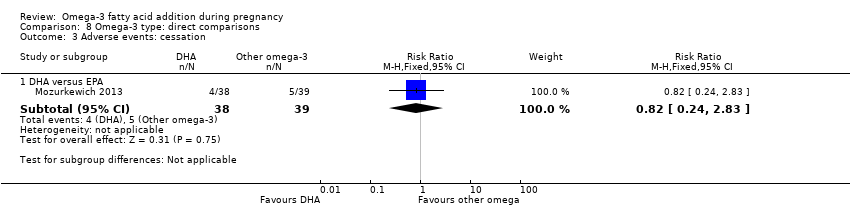
Comparison 8 Omega‐3 type: direct comparisons, Outcome 3 Adverse events: cessation.

Comparison 8 Omega‐3 type: direct comparisons, Outcome 4 Pre‐eclampsia.

Comparison 8 Omega‐3 type: direct comparisons, Outcome 5 Blood loss at birth (mL).
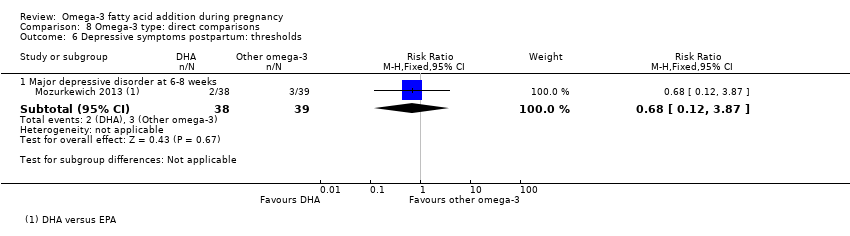
Comparison 8 Omega‐3 type: direct comparisons, Outcome 6 Depressive symptoms postpartum: thresholds.

Comparison 8 Omega‐3 type: direct comparisons, Outcome 7 Depressive symptoms postpartum: scores.
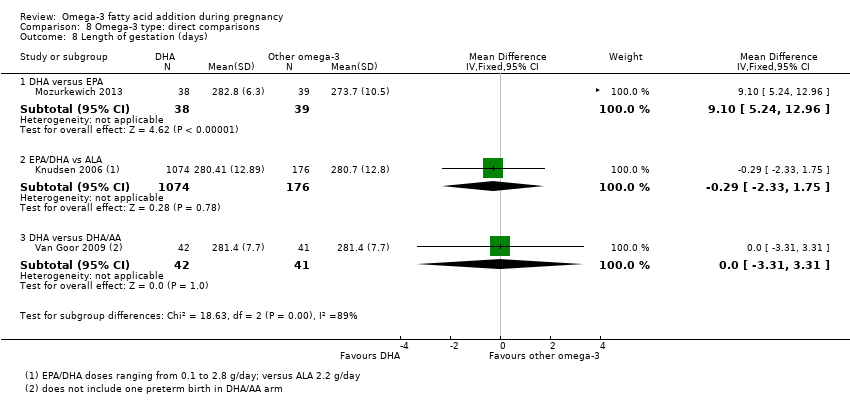
Comparison 8 Omega‐3 type: direct comparisons, Outcome 8 Length of gestation (days).
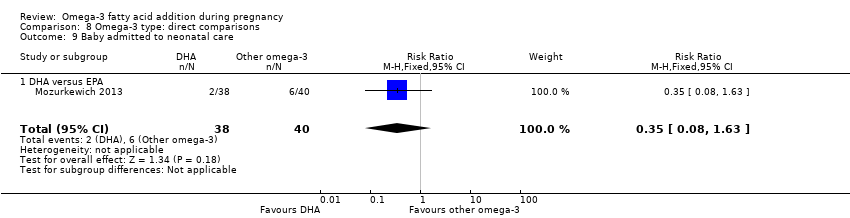
Comparison 8 Omega‐3 type: direct comparisons, Outcome 9 Baby admitted to neonatal care.

Comparison 8 Omega‐3 type: direct comparisons, Outcome 10 Birthweight (g).

Comparison 8 Omega‐3 type: direct comparisons, Outcome 11 Infant weight (kg).
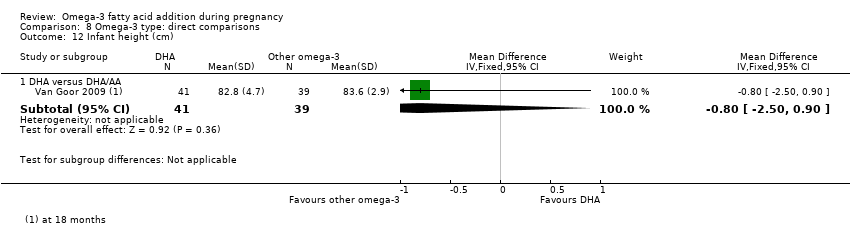
Comparison 8 Omega‐3 type: direct comparisons, Outcome 12 Infant height (cm).
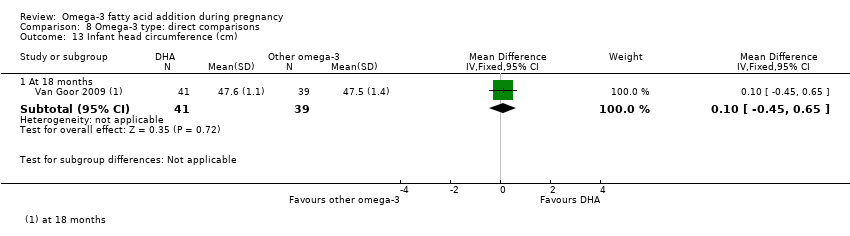
Comparison 8 Omega‐3 type: direct comparisons, Outcome 13 Infant head circumference (cm).

Comparison 8 Omega‐3 type: direct comparisons, Outcome 14 Cognition: Scores.
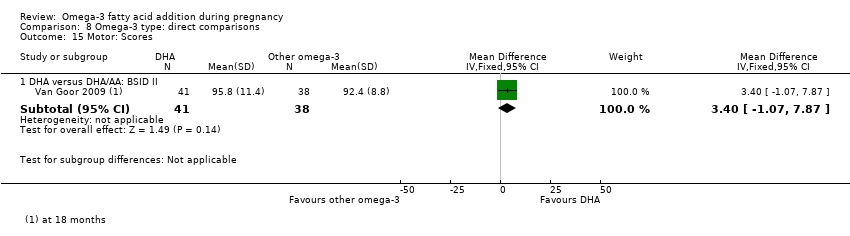
Comparison 8 Omega‐3 type: direct comparisons, Outcome 15 Motor: Scores.
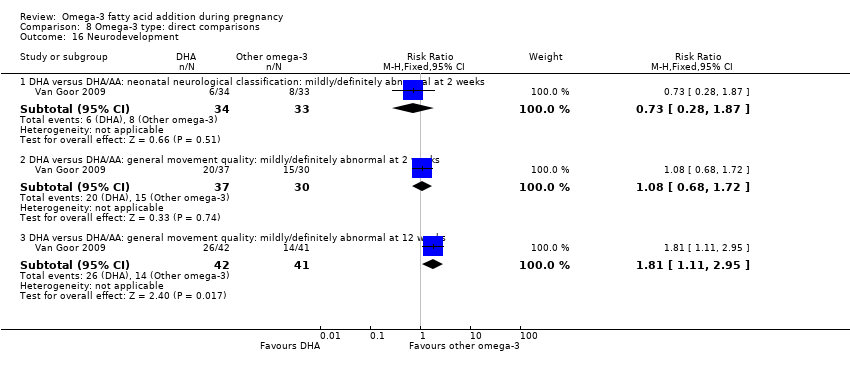
Comparison 8 Omega‐3 type: direct comparisons, Outcome 16 Neurodevelopment.

Comparison 8 Omega‐3 type: direct comparisons, Outcome 17 Cerebral palsy.
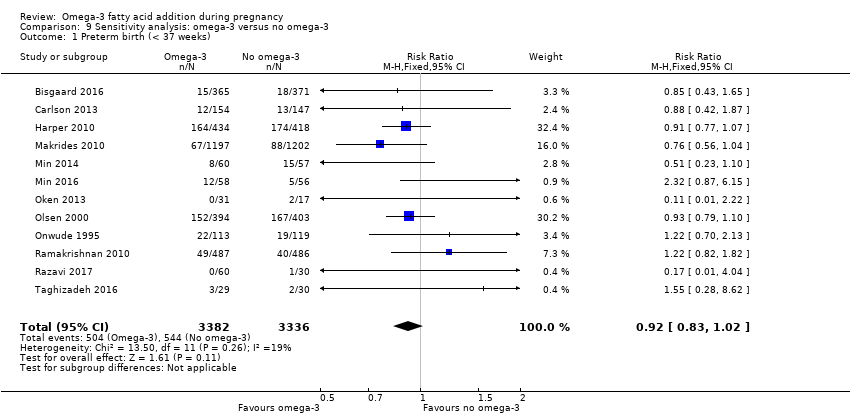
Comparison 9 Sensitivity analysis: omega‐3 versus no omega‐3, Outcome 1 Preterm birth (< 37 weeks).

Comparison 9 Sensitivity analysis: omega‐3 versus no omega‐3, Outcome 2 Early preterm birth (< 34 weeks).
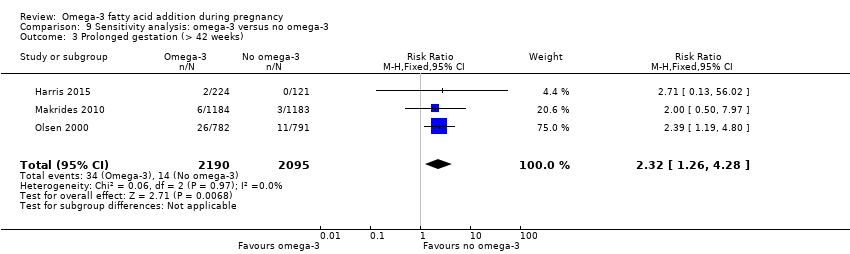
Comparison 9 Sensitivity analysis: omega‐3 versus no omega‐3, Outcome 3 Prolonged gestation (> 42 weeks).
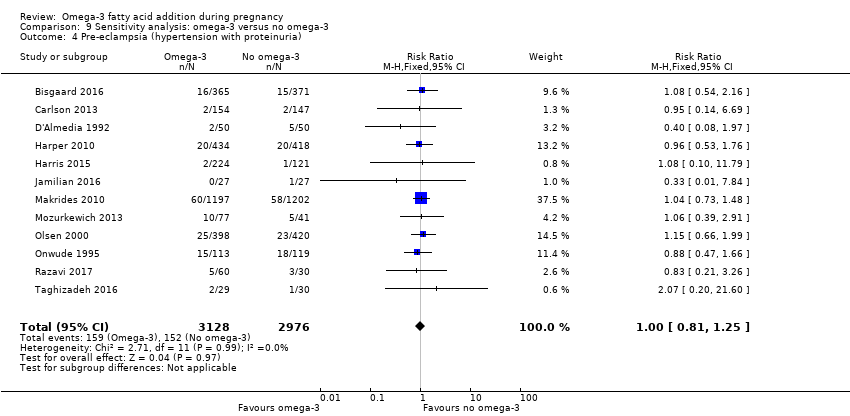
Comparison 9 Sensitivity analysis: omega‐3 versus no omega‐3, Outcome 4 Pre‐eclampsia (hypertension with proteinuria).

Comparison 9 Sensitivity analysis: omega‐3 versus no omega‐3, Outcome 5 Caesarean section.
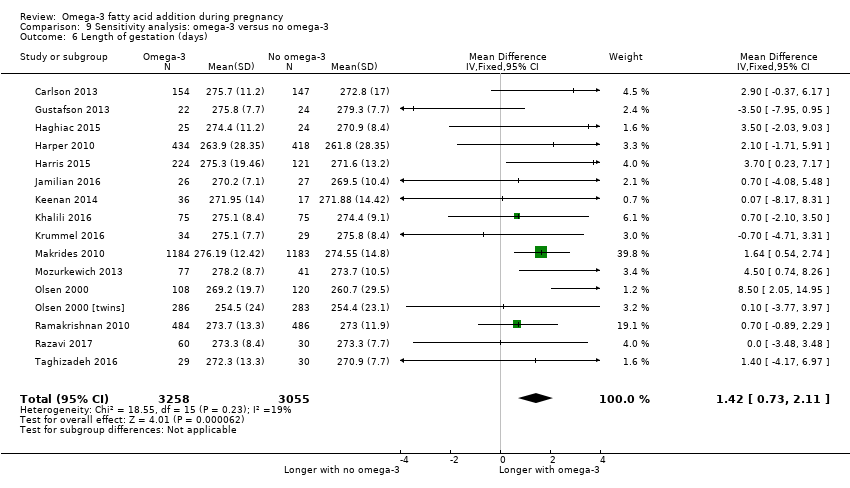
Comparison 9 Sensitivity analysis: omega‐3 versus no omega‐3, Outcome 6 Length of gestation (days).

Comparison 9 Sensitivity analysis: omega‐3 versus no omega‐3, Outcome 7 Perinatal death.
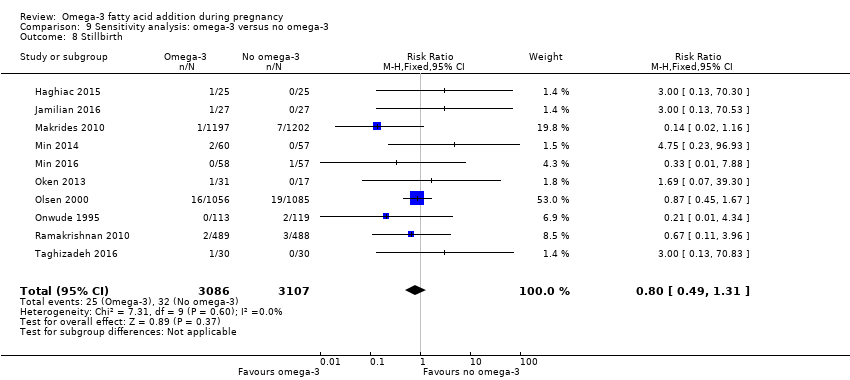
Comparison 9 Sensitivity analysis: omega‐3 versus no omega‐3, Outcome 8 Stillbirth.
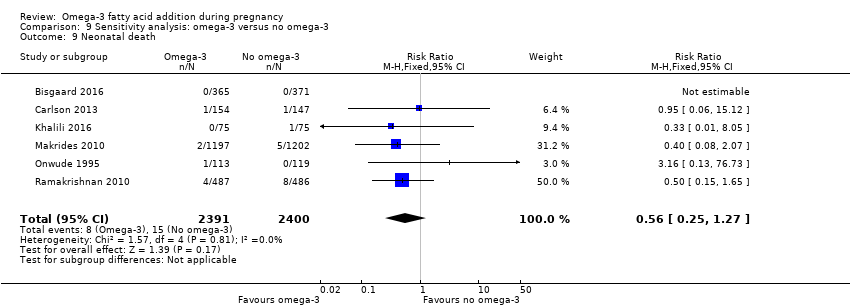
Comparison 9 Sensitivity analysis: omega‐3 versus no omega‐3, Outcome 9 Neonatal death.
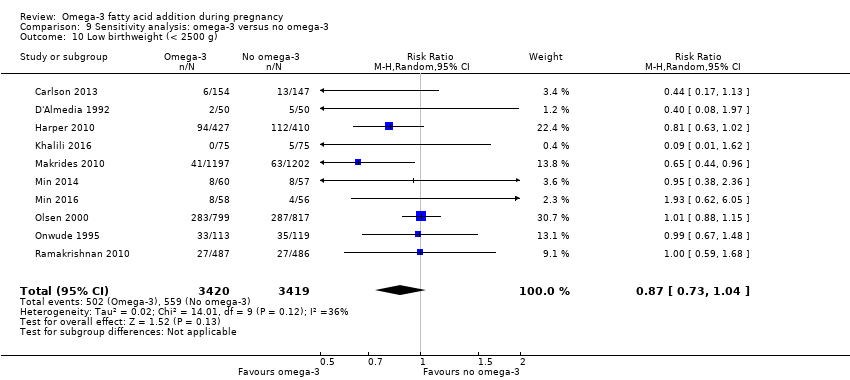
Comparison 9 Sensitivity analysis: omega‐3 versus no omega‐3, Outcome 10 Low birthweight (< 2500 g).
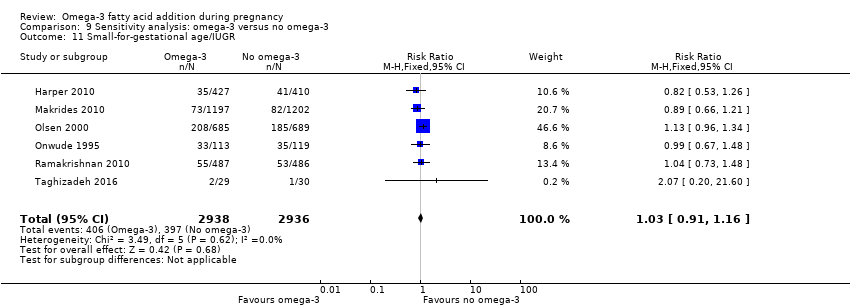
Comparison 9 Sensitivity analysis: omega‐3 versus no omega‐3, Outcome 11 Small‐for‐gestational age/IUGR.

Comparison 9 Sensitivity analysis: omega‐3 versus no omega‐3, Outcome 12 Birthweight (g).
| Omega‐3 LCPUFA compared with no omega‐3 during pregnancy: birth/infant outcomes | ||||||
| Population: pregnant women and their babies Settings: Angola (1 RCT), Australia (1 RCT), Belgium (1 RCT), Canada (1 RCT), Chile (1 RCT), Croatia (1 RCT), Chile (1 RCT), Denmark (3 RCTs), Egypt (1 RCT), Germany (2 RCTs), India (1 RCT), Iran (3 RCTs), Italy (1 RCT), Mexico (1 RCT), Netherlands (3 RCTs), Norway (1 RCT), Russia (1 RCT), Sweden (1 RCT), Turkey (1 RCT), UK (4 RCTs), USA (8 RCTs) Intervention: omega 3 Comparison: no omega‐3 | ||||||
| Outcomes | Illustrative comparative risks* (95% CI) | Relative effect | No of participants | Quality of the evidence | Comments | |
| Assumed risk | Corresponding risk | |||||
| Risk with no omega‐3 | Risk with omega‐3 | |||||
| Preterm birth < 37 weeks | 134/1000 | 119 per 1000 (109 to 130) | RR 0.89 (0.81 to 0.97) | 10,304 (26 RCTs) | ⊕⊕⊕⊕ HIGH1 | |
| Early preterm birth < 34 weeks | 46/1000 | 27 per 1000 (20 to 35) | RR 0.58 (0.44 to 0.77) | 5204 (9 RCTs) | ⊕⊕⊕⊕ HIGH2 | |
| Perinatal death | 20/1000 | 15 per 1000 (11 to 21) | RR 0.75 (0.54 to 1.03) | 7416 (10 RCTs) | ⊕⊕⊕⊝ MODERATE3 | |
| SGA/IUGR | 129/1000 | 130 per 1000 (116 to 146) | RR 1.01 (0.90 to 1.13) | 6907 (8 RCTs) | ⊕⊕⊕⊝ MODERATE3 | |
| LBW | 156/1000 | 140 (128 to 154) | RR 0.90 (0.82 to 0.99) | 8449 (15 RCTs) | ⊕⊕⊕⊕ HIGH | |
| LGA | 117/1000 | 134 per 1000 (113 to 159) | RR 1.15 (0.97 to 1.36) | 3722 (6 RCTs) | ⊕⊕⊕⊝ MODERATE4 | |
| Serious adverse events for neonate/infant | 63/1000 | 45 per 1000 (37 to 62) | RR 0.72 (0.53 to 0.99) | 2690 (2 RCTs) | ⊕⊕⊝⊝ low:5 | |
| *The basis for the assumed risk (e.g. the median control group risk across studies) is provided in footnotes. The corresponding risk (and its 95% confidence interval) is based on the assumed risk in the comparison group and the relative effect of the intervention (and its 95% CI). | ||||||
| GRADE Working Group grades of evidence | ||||||
| 1 Design limitations: larger studies of high quality, but some smaller studies with unclear risk of selective reporting and some smaller studies with unclear or high attrition bias at the time of birth (not downgraded for study limitations) 2 Design limitations: larger studies of higher quality, but several studies with unclear or high attrition bias at the time of birth, or baseline imbalances (not downgraded for study limitations) 3 Imprecision (‐1): downgraded one level due to crossing line of no effect and/or wide confidence intervals 4 Imprecision (‐1): downgraded one level due to wide confidence intervals 5 Design limitations (‐2): downgraded two levels; one study with unclear allocation concealment and attrition bias; specific adverse events not detailed in this study | ||||||
| Omega‐3 LCPUFA compared with no omega‐3 during pregnancy: maternal outcomes | ||||||
| Population: pregnant women Settings: Angola (1 RCT), Australia (2 RCTs), Belgium (1 RCT), Brazil (1 RCT), Chile (1 RCT), Croatia (1 RCT), Denmark (3 RCTs), Egypt (1 RCT), Germany (3 RCTs), Hungary (1 RCT), Iran (5 RCTs), India (1 RCT), Italy (2 RCTs), Mexico (1 RCT), Netherlands (4 RCTs), Norway (2 RCTs), Russia (1 RCT), Scotland (2 RCTs), Spain (4 RCTs) Sweden (2 RCTs), Turkey (1 RCT), UK (3 RCTs) USA (12 RCTs), Venezuela (1 RCT) Intervention: omega‐3 Comparison: no omega‐3 | ||||||
| Outcomes | Illustrative comparative risks* (95% CI) | Relative effect | No of participants | Quality of the evidence | Comments | |
| Assumed risk | Corresponding risk | |||||
| Risk with no omega‐3 | Risk with omega‐3 | |||||
| Prolonged gestation > 42 weeks | 16/1000 | 26/1000 (18 to 37) | RR 1.61 (1.11 to 2.33) | 5141 (6) | ⊕⊕⊕⊝ MODERATE6 | |
| Induction post‐term | 83/1000 | 68/1000 (18 to 247) | Average RR 0.82 (0.22 to 2.98) | 2900 (3) | ⊕⊕⊝⊝ LOW7 | |
| Pre‐eclampsia | 53/1000 | 44/1000 (37 to 53) | RR 0.84 (0.69 to 1.01) | 8306 (20) | ⊕⊕⊝⊝ LOW7 | Defined as hypertension with proteinuria |
| Gestational length | The mean gestational age in the intervention group was 1.67 days greater (0.95 greater to 2.39 days greater) | Average MD 1.67 days (0.95 to 2.39) | 12,517 (41) | ⊕⊕⊕⊝ MODERATE8 | ||
| Maternal serious adverse events | 6/1000 | 6/1000 (2 to 16) | RR 1.04 (0.40 to 2.72) | 2690 (2) | ⊕⊕⊝⊝ LOW9 | |
| Maternal admission to intensive care | 1/1000 | 1/1000 (0 to 3) | RR 0.56 (0.12 to 2.63) | 2458 (2) | ⊕⊕⊝⊝ LOW9 | |
| Postnatal depression | 112/1000 | 100 (80 to 125) | Average RR 0.99 (0.56 to 1.77) | 2431 (2) | ⊕⊕⊝⊝ LOW10 | |
| *The basis for the assumed risk (e.g. the median control group risk across studies) is provided in footnotes. The corresponding risk (and its 95% confidence interval) is based on the assumed risk in the comparison group and the relative effect of the intervention (and its 95% CI). | ||||||
| GRADE Working Group grades of evidence | ||||||
| 6 Design limitations (‐1): downgraded one level due to some studies with attrition bias and some selective reporting bias; and some imprecision (not downgraded) 7 Design limitations (‐1): downgraded one level for combined study limitations (mostly attrition bias and selective reporting bias); Imprecision (‐1): downgraded one level due to confidence intervals including line of no effect 8 Design limitations (‐1): downgraded one level for study limitations (mainly attrition bias): heterogeneity I2 = 54%, but not downgraded due to use of a random‐effects model 9 Imprecision (‐2): downgraded two levels for wide confidence intervals and only 2 studies 10 Design limitations (‐1): downgraded one level for study limitations (unclear randomisation in 1 study); downgraded one level for imprecision (wide confidence intervals; 2 studies only) | ||||||
| Omega‐3 LCPUFA compared with no omega‐3 during pregnancy: child/adult outcomes | ||||||
| Population: children of women randomised to omega‐3 or no omega‐3 during pregnancy Settings: Australia (2 RCTs), Bangladesh (1 RCT), Canada (1 RCT), Denmark (1 RCT), Hungary (1 RCT), Germany (1 RCT), Spain (2 RCTs), Mexico (1 RCT), Netherlands (1 RCT) Intervention: omega‐3 Comparison: no omega‐3 | ||||||
| Outcomes | Illustrative comparative risks* (95% CI) | Relative effect | No of participants | Quality of the evidence | Comments | |
| Assumed risk | Corresponding risk | |||||
| Risk with no omega‐3 | Risk with omega‐3 | |||||
| Cognition: BSID II score at < 24 months | The mean BSID II score at 24 months in the intervention group was 0.37 points lower in the intervention group (1.47 lower to 0.76 higher) | MD ‐0.37 (‐1.49 to 0.76) | 1154 (4) | ⊕⊕⊝⊝ LOW11 | ||
| Cognition: BSID III score at < 24 months | The mean BSID III score at 24 months in the intervention group was 0.04 points higher (1.59 lower to 1.68 higher) | MD 0.04 (‐1.59 to 1.68) | 809 (2) | ⊕⊕⊝⊝ LOW12 | ||
| IQ: WASI at 7 years | The mean WASI at 7 years in the intervention group was identical to the mean in the control group (0.79 points lower to 2.79 higher) | MD 1.00 (‐0.79 to 2.79) | 543 (1) | ⊕⊕⊝⊝ LOW12 | ||
| IQ: WISC‐IV at 12 years | The WISC‐IV at 12 years in the intervention group was identical to in the control group (5.16 points lower to 7.16 higher) | MD 1.00 (‐5.16 to 7.16) | 50 (1) | ⊕⊝⊝⊝ VERY LOW13 | ||
| Behaviour: BSID III adaptive behaviour score at 12‐18 months | The mean BSID III adaptive behaviour score in the intervention group at 12‐18 months was 1.20 points lower (3.12 lower to 0.72 higher) | MD ‐1.20 (‐3.12 to 0.72) | 809 (2) | ⊕⊕⊝⊝ LOW14 | At 12 months (one study), 18 months (one study) | |
| Behaviour: SDQ Total Difficulties at 7 years | The mean SDQ total difficulties score at 7 years in the intervention group was 1.08 higher (0.18 higher to 1.98 higher) | MD 1.08 (0.18 to 1.98) | 543 (1) | ⊕⊕⊝⊝ LOW12 | ||
| BMI at 19 years | The mean BMI at 19 years in the intervention group was identical to that in the control group (0.83 lower to 0.83 higher) | MD 0 (‐0.83 to 0.83) | 243 (1) | ⊕⊝⊝⊝ VERY LOW15 | ||
| Diabetes | Not reported | |||||
| *The basis for the assumed risk (e.g. the median control group risk across studies) is provided in footnotes. The corresponding risk (and its 95% confidence interval) is based on the assumed risk in the comparison group and the relative effect of the intervention (and its 95% CI). | ||||||
| GRADE Working Group grades of evidence | ||||||
| 11 Design limitations (‐1): downgraded one level due to unclear randomisation in 3 studies (that contributed 40% to meta‐analysis) and some studies at high risk of attrition bias; Imprecision (‐1): downgraded one level for wide confidence intervals including line of no effect 12 Imprecision (‐2): downgraded one level for confidence intervals including line of no effect; and one level for small number of studies/single study 13 Design limitations (‐1): downgraded one level for unclear selection bias (not clear if random sequence generated), possible attrition and/or reporting bias; Imprecision (‐2): downgraded two levels for wide confidence intervals including line of no effect and 1 study with small number of participants 14 Design limitations (‐1): downgraded one level for unclear randomisation (possible lack of allocation concealment), possible attrition and/or selective bias in 1 of the trials (contributing 15% to analysis); Imprecision (‐1): downgraded one level for confidence intervals including line of no effect and few studies Design limitations (‐1): downgraded one level for unclear sequence generation and unclear blinding: Imprecision (‐2): downgraded two levels for confidence intervals including line of no effect and 1 study with small number of participants | ||||||
| Omega‐3 compared with no omega‐3 during pregnancy: health services outcomes | ||||||
| Population: pregnant women and their infants Settings: Australia (1 RCT), Belgium (1 RCT), Denmark (2 RCTs), Egypt (1), Iran (2 RCTs), Italy (1 RCT), Netherlands (1 RCT), Norway (1 RCT), Russia (1 RCT), Scotland (1 RCT), UK (1 RCT), USA (5 RCTs) Intervention: omega‐3 Comparison: no omega‐3 | ||||||
| Outcomes | Illustrative comparative risks* (95% CI) | Relative effect | No of participants | Quality of the evidence | Comments | |
| Assumed risk | Corresponding risk | |||||
| no omega‐3 | omega‐3 | |||||
| Maternal hospital admission (antenatal) | 273/1000 | 251/1000 (221 to 284) | RR 0.92 (0.81 to 1.04) | 2876 (5) | ⊕⊕⊝⊝ LOW 16 | |
| Infant admission to neonatal care | 151/1000 | 139/1000 (125 to 156) | RR 0.92 (0.83 to 1.03) | 6920 (9) | ⊕⊕⊕⊝ MODERATE 17 | |
| Maternal length of hospital stay (days) | The mean length of stay in the intervention group was 0.18 days greater (0.20 less to 0.57 days greater) | MD 0.18 (‐0.20 to 0.57) | 2290 (2) | ⊕⊕⊝⊝ LOW 8 | ||
| Infant length of hospital stay (days) | The mean length of stay in the intervention group was 0.11 days greater (1.40 less to 1.62 days greater) | MD 0.11 (‐1.40 to 1.62) | 2041 (1) | ⊕⊕⊝⊝ LOW 8 | ||
| Costs | Not reported | |||||
| *The basis for the assumed risk (e.g. the median control group risk across studies) is provided in footnotes. The corresponding risk (and its 95% confidence interval) is based on the assumed risk in the comparison group and the relative effect of the intervention (and its 95% CI). | ||||||
| GRADE Working Group grades of evidence | ||||||
| 16 Design limitations (‐1): downgraded one level due to some studies with possible risk of attrition bias; Imprecision (‐1): downgraded one level for confidence intervals including line of no effect 17 Imprecision (‐1): downgraded one level for confidence intervals including line of no effect 18 Imprecision (‐2): downgraded one level for confidence intervals including line of no effect and once for small number of studies | ||||||
| Study ID | Omega‐3 (mean (SD)unless otherwise reported) | No omega‐3 (mean (SD)unless otherwise reported) |
| 27 (4.3) | 27 (4.8) | |
| 30.9 (4.6) for DHA/FOS group | 30.0 (4.62) in vitamin/mineral group; 31 (4.71) for FOS group | |
| 32.3 (4.3) | 32.2 (4.5) | |
| "The three study groups were similar in baseline characteristics with regard to maternal age at delivery (data not shown)". | ||
| 31.4 (3.9) | 31.2 (4.0) | |
| Not reported | ||
| 25.3 (4.9) | 24.8 (4.7) | |
| Not reported | ||
| "Ages ranged from 14‐40 years" | ||
| 30.0 (3.3) | 29.2 (3.8) | |
| 30.9 (5.3) | 32.7 (5.9) | |
| 30.9 (3.7) | 32.6 (3.6) | |
| Not reported | ||
| 31.0 (5.8) | 29.7 (6.2) | |
| 31.1 (4.1) | 31.7 (3.9) | |
| 32.6 (4.6) | 32.2 (4.8) | |
| 25.5 (4.3) | 25.6 (4.8) | |
| 27 (5) | 27 (5) | |
| Median (interquartile range): 28 (23 ‐ 32) | Median (interquartile range): 27 (24‐32) | |
| In high‐dose group 24.5 (12.72); In low‐dose group 24.3 (12.72) | 27.0 (9.05) | |
| 31.9 (4.9) | 31.6 (4.5) | |
| 28.6 (3.4) | 27.6 (3.2) | |
| 29.8 (5.5) | 29.6 (4.8) | |
| 30.5 (4.8) | 29.9 (4.7) | |
| 27.17 (6.34) | 26.71 (5.66) | |
| 30.1 (5.3) | 30.0 (5.5) | |
| 30.7 (3.5) for omega‐3 group 31.2 (4.3) for omega‐3 + vitamin D group | 30.7 (4.1) for placebo group 31.5 (7.0) for vitamin D group | |
| 23.9 (4.3) | 24.7 (4.8) | |
| Not reported | ||
| 26.33 (4.2) | 25.15 (4.2) | |
| Not reported | ||
| 25.9 (4.8) | 26.9 (4.5) | |
| 28.4 for 0.1 g/day EPA + DHA group 28.7 for 0.3 g/day EPA + DHA group 28.4 for 0.7 g/day EPA + DHA group 28.9 for 1.4 g/day EPA + DHA group 28.8 for 2.8 g/day EPA + DHA group 28.8 for 2.2g/day ALA group | 28.5 for no treatment group | |
| Median (range): 30.6 (20.1 ‐ 41.1) for DHA/EPA group Median (range): 31.1 (21.5 ‐ 40.1) for DHA/EPA+folate group | Median (range): 31.1 (18.8 ‐ 40.8) for folate group Median (range): 31.1 (18.4 ‐ 40.3) for no treatment (placebo) group | |
| 27.9 (4.6) | 26.3 (5.0) | |
| Median (IQR): 30.3 (24‐40) | Median (IQR): 30.2 (26‐32) in placebo group; 32.0 (23‐40) in primrose oil group | |
| 28.9 (5.7) | 28.9 (5.6) | |
| Not reported | ||
| 25.06 (5.73) | 25.11 (7.45) | |
| Not reported | ||
| 31.7 (4.4) | 31.2 (4.4) | |
| Median (range): 29 (18 ‐ 42) | Median (range): 29 (18 ‐ 44) | |
| Median (range): 34 (20 ‐ 45) | Median (range): 37 (27‐45) | |
| Median (range): 31.0 (21.0 ‐ 41.0) | Median (range): 32.0 (21.0 ‐ 44.0) | |
| 30.6 (4.5) in DHA rich fish oil group; 29.9 (5.0) in EPA rich fish oil group | 30.4 (5.9) | |
| 32.6 (4.04) | 33.4 (3.61) | |
| 29.5 (3.94) | 28.4 (4.69) | |
| Not reported | ||
| Median (IQR): 32.6 (27.9 ‐ 35.9) advice group; 27.6 (24.5 ‐ 32.0) advice + gift card group | Median (IQR): 32.4 (27.7 to 34.3) | |
| 29.4 (4.4) | olive oil group 29.7 (4.3); placebo/no oil group 29.1 (4.1) | |
| Prophylactic trials PD trial 29.3 (4.87) IUGR trial 30 (4.64) PIH trial 30.3 (7.01) Twins trial 30.2 (6.18) Therapeutic trials Threat‐PE trial 32.1 (11.7) Susp‐IUGR trial 29.3 (7.88) | Prophylactic trials PD trial 30.0 (6.22) IUGR trial 29.0 (3.93) PIH trial 28.9 (5.32) Twins trial 30.2 (6.35) Therapeutic trials Threat‐PE trial 32.9 (14.6) Susp‐IUGR trial 29.8 (10.3) | |
| see Olsen 2000 | ||
| Mean (range): 26.6 (18‐39) | Mean (range): 26.1 (16‐40) | |
| 30.3 (5.2) | 28.3 (4.85) | |
| 30.86 (4.18) | 29.92 (4.80) | |
| 26.2 (4.6) | 26.3 (4.8) | |
| 30.06 (7.59) | 28.96 (6.40) | |
| 29.7 (3.6) for omega‐3 group 29.9 (4.0) for omega‐3 + vitamin D group | 29.2 (3.4) for placebo group 29.9 (5.0) for vitamin D group | |
| 31.2 (4.4) | 34.5 (3.8) | |
| Not reported | ||
| Not reported | ||
| Median (range): 26.8 (18‐39) | Median (range): 26.1 (16‐40) | |
| 34.5 (7.41) | 31.25 (5.18) | |
| 21.7 (4.3) | 21.6 (4.2) | |
| High DHA egg group 19.9 (4.1) | Ordinary egg group 24.8 (7.8) | |
| 30.9 (3.9) | 31.3 (5.7) | |
| 28.6 (6.3) | 29.4 (4.4) | |
| 22.1 (4.2) | 23.4 (4.5) | |
| 29 (4.7) | 28.3 (6.7) | |
| Median (range): 32.3 (22.3 ‐ 43.3) in DHA group; 31.5 (24.8 ‐ 41.4) in DHA + AA group | Median (range): 33.5 (26.0 ‐ 40.3) | |
| Not reported | ||
| Median (IQR): 25.5 (22.0‐34.5) | Median (IQR): 27.0 (21.0 ‐ 31.0) | |
| Abbreviations: IQR (interquartile range) | ||
| Study ID | Omega‐3 | No omega‐3 |
| Mean (SD): 2.9 (4.8) | Mean (SD): 2.8 (1.6) | |
| > 1: 22 (45.8%) in DHA/FOS group | > 1: 28 (57.1%) in vitamin/mineral group 24 (51.1%) in FOS group | |
| 1: 155 (44.8%) | 1: 166 (47.6%) | |
| Not reported | ||
| Median (IQR): 0.5 (0,1) | Median (IQR): 0 (0,1) | |
| Not reported | ||
| Prior pregnancies, N Mean (SD): 1.2 (1.3) | Prior pregnancies, N Mean (SD): 1.3 (1.4) | |
| Not reported | ||
| Not reported | ||
| 0: 11 (38%) 1: 15 (52%) 2: 3 (10%) 3: 0 (0%) | 0: 12 (41%) 1: 11 (38%) 2: 5 (17%) 3: 1 (3%) | |
| ≥ 1: 15 (45.5%) | ≥ 1: 21 (53.8%) | |
| Not reported | ||
| Primiparous: 24 (77.4%) | Primiparous: 22 (78.6%) | |
| Not reported | ||
| Not reported | ||
| Not reported | ||
| 0: 7 (28%) 1:18 (72%) | 0: 5 (21%) 1: 19 (79%) | |
| Not reported | ||
| Not reported | ||
| Primiparous: 55.8% | Primiparous: 61.2% | |
| Mean (SD): 0.3 (0.5) | Mean (SD): 0.3 (0.5) | |
| Nulliparous: 25 (53%) Primiparous: 22 (47%) | Nulliparous: 26 (60%) Primiparous: 17 (40%) | |
| Multiparous: 35.6% | Multiparous: 31.8% | |
| Mean (SD): 1.38 (1.67) | Mean (SD): 1.53 (1.55) | |
| Not reported | ||
| Not reported | ||
| Mean (SD): 1.5 (0.8) | Mean (SD): 1.8 (0.8) | |
| Not reported | ||
| Not reported | ||
| Not reported | ||
| 1: 38 (50.7%) 2: 28 (37.3%) ≥ 3: 9 (12.0%) | 1: 37 (49.3%) 2: 27 (36%) ≥ 3: 11 (14.7%) | |
| Primiparous women 0.1 g/day EPA + DHA group: 257 (66.2%) 0.3 g/day EPA + DHA group: 267 (69.5%) 0.7 g/day EPA + DHA group: 244 (63.5%) 1.4 g/day EPA + DHA group: 247 (64.7%) 2.8 g/day EPA + DHA group: 246 (62.9%) 2.2 g/day ALA group: 258 (66.3%) | Primiparous women No treatment group: 513 (66.4%) | |
| < 2: 56 (86%) for DHA/EPA group; 56 (88%) for DHA/EPA+folate group 2: 7 (11%) for DHA/EPA group; 6 (9%) for DHA/EPA+folate group > 2: 2 (3%) for DHA/EPA group; 2 (3%) for DHA/EPA+folate group | < 2: 65 (90%) for folate group; 61 (88%) for placebo group 2: 7 (10%).for folate group; 7 (10%) for placebo group > 2: 0 (0) for folate group; 1 (1%) for placebo group | |
| Not reported | ||
| Nulliparous: 2 (66%) in fish oil group Primiparous: 1 in (33%) fish oil group | Nulliparous: 1 (25%) in primrose oil group; 3 (75%) in placebo group Primiparous: 3 (60%) in primrose oil group; 2 (40%) in placebo group | |
| Primiparous: 471 (39.3%) | Primiparous: 474 (39.4%) | |
| Not reported | ||
| Mean (SD): 1.68 (0.90) | Mean (SD): 1.74 (0.91) | |
| Not reported | ||
| Not reported | ||
| 0: 18 (40%) 1‐3: 26 (57.8%) > 4: 1 (2.2%) | 0: 14 (35.0%) 1‐3: 23 (57.5%) > 4: 2 (5.0%) | |
| 0: 10 (24%) 1‐3: 27 (65.9%) > 4: 3 (7.3%) | 0: 7 (14.9%) 1‐3: 32 (68.1%) > 4: 6 (12.8%) | |
| 0: 33 (50%) 1‐3: 27 (41%) ≥ 4: 6 (9%) | 0: 24 (35%) 1‐3: 40 (57%) ≥ 4: 5 (7%) | |
| Mean (SD): 0.87 (0.83) for EPA rich fish oil group; 1.08 (0.94) for DHA rich fish oil group | Mean (SD): 0.85 (1.2) | |
| 1: 60.6% 2: 30.8% > 2: 8.6% | 1: 47.7% 2: 36.7% > 2: 15.6% | |
| Not reported | ||
| Not reported | ||
| Primiparous: 6 (35%) in advice group; 4 (24%) in advice + gift card group | Primiparous: 6 (30%) in control group | |
| Primiparous: Fish oil group: 56% | Primiparous: Olive oil group: 61% No oil group: 60% | |
| Prophylactic trials: no nulliparous women except for: Twins trial: 52.5% nulliparous Therapeutic trials Threat‐PE trial: 71.4% nulliparous Susp‐IUGR trial: 52.0% nulliparous | Prophylactic trials: no nulliparous women except for: Twins trial: 52.5% nulliparous Therapeutic trials Threat‐PE trial: 65.6% nulliparous Susp‐IUGR trial: 51.9% nulliparous | |
| Included primiparous and multiparous women | ||
| Primiparous: 8 (67%) | Primiparous: 5 (42%) | |
| 0: 46 (36%) 1: 83 (64%) | 0: 50 (40%) 1: 76 (60%) | |
| Not reported | ||
| Mean (SD): 0.46 (0.50) | Mean (SD): 0.40 (0.49) | |
| Not reported | ||
| Mean (SD): 1.4 (0.9) | Mean (SD): 1.6 (1.2) | |
| Not reported | ||
| Excluded nulliparous women | ||
| Not reported | ||
| Mean (SD): 1.63 (0.74) | Mean (SD): 1.38 (0.52) | |
| Nulliparous before study: 68% | Nulliparous before study: 58% | |
| Women were excluded if they had more than 4 previous pregnancies Mean (SD): 1.9 (1.1) | Mean (SD): 2.3 (1.9) | |
| Mean (SD): 1.7 (1.1) | Mean (SD): 1.8 (1.1) | |
| Not reported | ||
| Women with > 2 children: 16.8% | Women with > 2 children: 31.5% | |
| Included women with 1‐4 prior births | ||
| Included women with a first or second pregnancy | ||
| Not reported | ||
| 0‐1: 26 (81.2%) ≥ 2: 6 (18.8%) | 0‐1: 18 (64.3%) ≥ 2: 10 (35.7%) | |
| Study | Eligibility criteria |
| Excluded women taking ≥ 300 mg DHA a day | |
| Excluded women planning to take DHA during pregnancy | |
| Excluded women consuming fish more than twice a week | |
| Excluded women consuming fish more than twice a week | |
| Excluded women with a previous intolerance to omega‐3 fatty acids | |
| Excluded women with an allergy to fish or undergoing treatment with omega‐3 fatty acid supplements | |
| Excluded women with an allergy to fish or regular intake of fish oil | |
| Excluded women taking more than 200 mg DHA a day | |
| Excluded women with an allergy to fish or fish products; women who do not eat any fish; and women with a regular intake of fish oil (> 500 mg/week in the previous 4 weeks) | |
| Excluded women with an allergy to fish or fish products; and women with a regular intake of fish oil supplements (> 500 mg/week at any time during the preceding month) | |
| Excluded women with allergies to fish or consumption of salmon, mackerel, rainbow trout or sardines at least weekly | |
| Excluded women taking omega‐3 supplementation before randomisation | |
| Excluded women already taking DHA | |
| Did not include women taking DHA supplements in pregnancy | |
| Excluded women taking omega‐3 fatty acid supplements | |
| Excluded women consuming fish more than twice a week | |
| Excluded women consuming ≥ 2 servings of sea fish a week | |
| Excluded women with an allergy to fish oil or fish products; and women consuming fish more than twice a week | |
| Included women with only limited fish intake and who did not use fish oil capsules during pregnancy | |
| Excluded women who had used fish oil supplements since the beginning of their pregnancy | |
| Excluded women who consumed > 1 fish meal/week or who used DHA‐fortified foods or supplements | |
| Excluded women who were already taking DHA supplements | |
| Excluded women with an allergy to fish products | |
| Excluded women with an allergy to seafood or fish oils | |
| Excluded women taking fish oil supplements | |
| Excluded women taking omega‐3 fatty acid supplements and women consuming > 2 fish meals a week | |
| Excluded women taking any lipid or fatty acid supplementation | |
| included women with a diet low in oily fish (excluding canned tuna) ≤ twice per month | |
| Excluded women with an allergy to fish and fish oil and women previously regularly taking a preconception fish oil supplement | |
| Excluded women consuming fish > 3 times a month; or with no contraindications to fish consumption such as allergy, or self‐restrictions such as a vegetarian diet | |
| Excluded women with a fish allergy or regular intake of fish oil | |
| Excluded women with a fish allergy or regular intake of fish oil | |
| Only included women who consumed fish at least twice a week (equivalent to 600 g fish a week) | |
| Excluded women regularly taking fish oil or DHA supplements | |
| Excluded women taking omega‐3 fatty acid supplements | |
| Excluded women taking fish oil supplements or eating more than 3 oily fish portions per week; not showing any signs of intolerance or allergy to fish | |
| Excluded women with any signs of intolerance or allergy to fish or using dietary supplements containing omega‐3 and omega‐6 PUFA | |
| Excluded women with a diet including polyunsaturated fatty acids (PUFA, ALA supplements) or LCPUFA (EPA and or DHA supplements) | |
| Excluded women who were vegetarians or vegans | |
| Excluded women taking any oil supplementation (such as fish oil, flaxseed oil or cod liver oil) |
| Study ID | omega‐3 | no omega‐3 |
| Not reported | ||
| Employed: 31 (77.5%) in DHA/folate group 13 years of schooling: 32 (66.7%) in DHA/folate group | Employed: 35 (85.4%) in Vit/Min group; 30 (78.9%) in folate group 13 years of schooling: 28 (57.1%) in Vit/Min group; 32 (68.1%) in folate group | |
| Household annual income: Low: 33 (9.6%) Medium: 179 (51.9%) High: 133 (38.6%) | Household annual income: Low: 34 (9.7%) Medium: 187 (53.6%) High: 128 (36.7%) | |
| Not reported | ||
| 15 or more years of education: 17 (94.4%) | 15 or more years of education: 15 (88.2%) | |
| Not reported | ||
| Maternal education: Mean (SD): 13.69 years (2.67) | Maternal education: Mean (SD): 13.36 years (2.72) | |
| Not reported | ||
| "Sixty‐nine percent were employed; ninety‐four percent of their husbands were employed". | ||
| Education measured on an 8‐point scale: Mean (SD): 4.3 (1.4) | Education measured on an 8‐point scale: Mean (SD): 3.9 (1.5) | |
| Maternal education: 10‐12 years: 10 (30.3%) > 12 years: 23 (69.7%) | Maternal education: 10‐12 years: 9 (23.1%) > 12 years: 30 (76.9%) | |
| Not reported | ||
| Maternal employment: 61.3% employed Maternal education: Mean (SD): 15.5 years ((2.1) | Maternal employment: 60.7% employed Maternal education, Mean (SD): 14.6 years (2.2) | |
| Not reported | ||
| Not reported | ||
| Maternal education: Mean (SD): 14.0 years (3.1) | Maternal education: Mean (SD): 13.9 years (2.7) | |
| Not reported | ||
| Maternal education: Median (IQR): 13 years (12‐16) | Maternal education: Median (IQR): 13 years (12‐16) | |
| Not reported | ||
| Maternal education: 63.8% attended ≥ 12 years of school | Maternal education: 69.9% attended ≥ 12 years of school | |
| Maternal education: < 10 years: 2.9% 10‐12 years: 21.4% > 12 years: 75.7% | Maternal education: < 10 years: 1.8% 10‐12 years: 31.1% > 12 years: 67.1% | |
| Not reported | ||
| Not reported | ||
| Not reported | ||
| Not reported | ||
| Not reported | ||
| Maternal education: Mean (SD): 12.8 years (2.2) | Maternal education; Mean (SD): 12.2 years (1.5) | |
| Not reported | ||
| Maternal education: < 6 years: 7.5% 6 to 9 years: 12.5% 9 to 12 years: 20% | Maternal education: < 6 years: 7.5 % 6 to 9 years: 15% 9 to 12 years: 10% | |
| Not reported | ||
| Maternal education: Primary school (1‐5 years): 14 (18.7%) Seconday school (6‐8 years): 23 (30.7%) High school (9‐12 years): 33 (44.0%) University (> 12 years): 5 (6.7%) Family income: Adequate: 15 (20%) Relatively adequate: 44 (58.7%) Non adequate: 16 (21.3%) | Maternal education: Primary school (1‐5 years): 15 (20.0%) Seconday school (6‐8 years): 14 (18.7%) High school (9‐12 years): 39 (52.0%) University (> 12 years): 7 (9.3%) Family income; Adequate: 13 (17.3%) Relatively adequate: 50 (66.7%) Non adequate: 12 (16.0%) | |
| Not reported | ||
| Job training of father: None: 29 (45%) for DHA/EPA group; 17 (27%) for DHA/EPA+folate group Apprenticeship: 14 (22%) for DHA/EPA group; 19 (31%) for DHA/EPA+folate group University degree: 15 (23%) for DHA/EPA group; 21 (34%) for DHA/EPA+folate group | Job training of father: None: 33 (47%) for folate group; 27 (40%) for placebo group Apprenticeship: 10 (14%) for folate group; 14 (21%) for placebo group University degree: 24 (34%) for folate group; 20 (29%) for placebo group | |
| Education: Mean (SD): 14.8 years (2.1) | Education: Mean (SD): 14.9 years (3.2) | |
| Not reported | ||
| Mother completed secondary education: 755 (63.1%) Mother completed further education: 816 (68.2%) MSSI score: median 28.5, IQR (25.0 ‐ 31.0) | Mother completed secondary education: 760 (63.2%) Mother completed further education: 824 (68.6%) MSSI score: median 29.0, IQR (25.0 ‐ 31.0) | |
| Not reported | ||
| Education: > 8 years: 82.1% ESOMAR classification: AB (high level): 0.5% CA (medium level): 4.4% CB (medium level): 34.9% D (medium ‐ low level): 40.4% E (low level): 19.8% | Education: > 8 years: 80.7% ESOMAR classification: AB (high level): 0.3% CA (medium level): 4.2% CB (medium level): 33.4% D (medium ‐ low level): 44.6% E (low level): 17.5% | |
| Not reported | ||
| Not reported | ||
| Not reported | ||
| Not reported | ||
| Not reported | ||
| Not reported | ||
| Not reported | ||
| Not reported | ||
| Not reported | ||
| Working full time: 6 (35%) for advice to eat fish group; 9 (50%) for advice to eat fish + gift card group | Working full time: 7 (35%) for control group | |
| Not reported | ||
| Not reported | ||
| see Olsen 2000 | ||
| Not reported | ||
| Not reported | ||
| High school or university degree: 129 (100%) Average socioeconomic status (not defined): 129 (100%) | High school or university degree: 126 (100%) Average socioeconomic status (not defined): 126 (100%) | |
| High school education or above: 56.6% | High school education or above: 59.5% | |
| Not reported | ||
| Not reported | ||
| Maternal education: Mean (SD): 14.5 years (3.5) | Maternal education: Mean (SD): 15.3 (2.9) | |
| Not reported | ||
| Not reported | ||
| Not reported | ||
| Not reported | ||
| "Most subjects received government assistance for medical care" | ||
| Not reported | ||
| Not reported | ||
| Not reported | ||
| Mostly low‐income participants Mothers with > 5 years of schooling: 36.8% Working mothers: 16.0 Fathers with stable job: 65.6 Family income (taka/month, 1 USD = 59 taka): 64.0 | Mostly low‐income participants Mothers with > 5 years of schooling: 32.3% Working mothers: 12.1% Fathers with stable job: 65.3% Family income (taka/month, 1 USD = 59 taka): 54.0 | |
| SES assessed using the ESOMAR criteria: High: 5.3% Medium: 73.7% Low: 21.1% | SES assessed using the ESOMAR criteria: High: 19.0% Medium: 66.7% Low: 14.3% | |
| Not reported | ||
| Not reported | ||
| Family income, not further defined: US $263.2 (181.9‐383.0) Maternal education: | Family income (US $) not further defined: US $304.1 (180.7 ‐ 379.8) Maternal education: Median (IQR): 8.0 years (7.5 ‐ 10.5) | |
| Abbreviations: DHA: docosahexaenoic acid; EPA: eicosapentaenoic acid; ESOMAR: European Society for Opinion and Marketing Research; IQR: interquartile range; MSSI: maternal social support index; SD: standard deviation; SES: socioeconomic status | ||
| Study ID | Omega‐3 | No omega‐3 |
| Not reported (study conducted in Egypt) | ||
| "Caucasian women" | ||
| Caucasian: 333 (96.2%) | Caucasian: 332 (95.1%) | |
| Not reported (conducted in Denmark) | ||
| Women of European descent | ||
| Not reported (study conducted in the Netherlands) | ||
| Hispanic: 8% Not Hispanic: 92% | Hispanic: 8% Not Hispanic 92% | |
| African‐American: 38% | ||
| Maternal ethnicity not reported; reported that 98% of included infants were white | Maternal ethnicity not reported; reported that 93% of included infants were white | |
| Not reported (conducted in Angola) | ||
| "White women" | ||
| Caucasian women | ||
| Not reported (conducted in South Africa) | ||
| Not reported (conducted in USA) | ||
| Not reported (conducted in Sweden) | ||
| Not reported (conducted in Italy) | ||
| 28% African‐American (conducted in USA) | ||
| African American: 11 (44%) Caucasian: 10 (40%) Other (e.g. Hispanic or Asian): 4 (16%) | African American: 6 (25%) Caucasian: 11 (46%) Other (e.g. Hispanic or Asian): 7 (29%) | |
| African American: 148 (34.1%) White: 245 (56.5%) Asian: 13 (3.0%) Other: 28 (6.5%) Hispanic/Latina ethnicity: 64 (14.7%) | African American: 145 (34.9%) White: 240 (57.7%) Asian: 5 (1.2%) Other: 26 (6.3%) Hispanic/Latina ethnicity: 57 (13.6%) | |
| Not reported (conducted in USA) | ||
| Not reported (conducted in Germany) | ||
| Not reported (conducted in Norway) | ||
| Not reported (conducted in Croatia) | ||
| Not reported (conducted in Spain) | ||
| Not reported (conducted in Egypt) | ||
| Not reported (conducted in Iran) | ||
| Not reported (conducted in Iran) | ||
| Not reported (conducted in USA) | ||
| Not reported (conducted in USA) | ||
| Not reported (conducted in Iran) | ||
| African American women | ||
| Not reported (conducted in Iran) | ||
| Not reported (conducted in Denmark) | ||
| Not reported (conducted in Spain, Germany or Hungary) | ||
| African American: 12 (37.5%) White: 20 (62.5%) | African American: 15 (53.6%) White: 13 (46.4%) | |
| Not reported (conducted in Finland) | ||
| Not reported (conducted in Australia) | ||
| Not reported (conducted in UK) | ||
| "mainly ethnically mixed (American and Hispanic)" | ||
| Not reported (conducted in Spain) | ||
| African American: 1 (1.7%) Caucasian: 55 (92%) Hispanic: 2 (3%) Asian: 1 (1.67%) Other: 1 (1.67%) | African American: 0 (0%) Caucasian: 52 (95%) Hispanic: 2 (3%) Asian: 1 (2%) Other: 0 (0%) | |
| Asian: 16 (35.6%) African/Afro‐Caribbean: 10 (22.2%) Caucasian: 13 (28.9%) Others: 6 (13.3%) | Asian: 18 (45.0%) African/Afro‐Caribbean: 14 (35.0%) Caucasian: 6 (15.0%) Others: 2 (5.0%) | |
| Asian: 18 (43.9%) African/Afro‐Caribbean: 15 (36.6%) Caucasian: 5 (12.2%) Others: 3 (7.3%) | Asian: 27 (57.5%) African/Afro‐Caribbean: 10 (21.3%) Caucasian: 5 (10.6%) Others: 5 (10.6%) | |
| Asian: 40 (60%) African/Afro‐Caribbean: 18 (27%) Caucasian: 5 (7%) Others: 4 (7%) | Asian: 44 (62%) African/Afro‐Caribbean: 18 (25%) Caucasian: 5 (7%) Others: 4 (6%) | |
| White: 33 (85%) for EPA‐rich group; 29 (76%) for DHA‐rich group African‐American: 4 (10%) for EPA‐rich group; 4 (11%) for DHA‐rich group Hispanic‐Latina: 0 (0%) for EPA‐rich group; 4 (11%) for DHA‐rich group Asian: 1 (3%) for EPA‐rich group; 1 (3%) for DHA‐rich group American Indian or Alaska Native: 0 (0%) for EPA‐rich group; 0 (0) for DHA‐rich group Native Hawaiian or other Pacific ethnicity: 1 (3) for EPA‐rich group; 0 (0%) for DHA‐rich group | White: 34 (83%) African‐American: 2 (5%) Hispanic‐Latina: 3 (7%) Asian: 1 (2%) American Indian or Alaska Native: 1 (2%) Native Hawaiian or other Pacific ethnicity: 0 (0%) | |
| White: 73.1% Non‐white: 26.9% | White: 73.9% Non‐white: 26.1% | |
| Not reported (conducted in UK) | ||
| Not reported (conducted in UK) | ||
| White: 9 (50%) advice only group; 9 (53%) advice+voucher group Black: 2 (11%) advice only group; 2 (12%) advice+voucher group Asian: 2 (11%) advice only group; 1 (6%) advice+voucher group Hispanic/other: 5 (28%) advice only group; 5 (29%) advice+voucher group | White: 9 (45%) Black: 2 (10%) Asian: 3 (15%) Hispanic/other: 6 (30%) | |
| Not reported (conducted in Denmark) | ||
| Not reported (conducted in Denmark, Scotland, Sweden, England, Italy, Netherlands, Norway, Belgium and Russia) | ||
| See Olsen 2000 | ||
| Not reported (conducted in UK) | ||
| Not reported (conducted in the Netherlands) | ||
| Caucasians | ||
| Not reported (conducted in Mexico) | ||
| Not reported (conducted in Iran) | ||
| Not reported (conducted in Iran) | ||
| Not reported (conducted in Australia) | ||
| Not reported (conducted in Brazil) | ||
| Not reported (conducted in Venezuela) | ||
| Not reported (conducted in Iran) | ||
| Not reported (conducted in Spain) | ||
| African:104 (73%) Other: 38 (27%) | African: 109 (73%) Other: 40 (27%) | |
| African: 15 (83%) Other: 3 (17%) | African: 15 (78%) Other: 4 (22%) | |
| Not reported (conducted in Taiwan) | ||
| Not reported (conducted in Iran) | ||
| Not reported (conducted in India) | ||
| Hispanic: 19 (100%) | Hispanic: 21 (100%) | |
| Not reported (conducted in the Netherlands) | ||
| Neither ethnicity, race or country where study conducted reported | ||
| White: 13 (40.6%) Non‐white: 19 (59.4%) | White: 5 (17.9%) Non‐white: 23 (82.1%) | |
| Study ID | Omega‐3 | No omega‐3 | |
| Smokers were excluded | |||
| Smokers were excluded | |||
| Smoking during pregnancy: 21 (6.1%) | Smoking during pregnancy: 33 (9.5%) | ||
| "The three study groups were similar in baseline characteristics with regard to... percentage of smokers (data not shown)". | |||
| Not reported | |||
| Not reported | |||
| History of smoking: 41% Smoking during pregnancy: 30% | History of smoking: 45% Smoking during pregnancy: 38% | ||
| Not reported | |||
| Not reported | |||
| Smoking at 14 weeks GA: Yes: 4 (14%) | Smoking at 14 weeks GA: Yes: 10 (34%) | ||
| 15 (28%) | 24 (35%) | ||
| Smokers were excluded | |||
| Not reported | |||
| Not reported | |||
| Exposure to smoke: (at least 1 of immediate family a smoker) 9 (17%) | Exposure to smoke: (at least 1 of immediate family a smoker) 11 (17%) | ||
| Maternal smoking at baseline: 50% | Maternal smoking at baseline: 48% | ||
| Not reported | |||
| Not reported | |||
| Smoking during pregnancy: 64 (15%) | Smoking during pregnancy: 72 (17%) | ||
| Not reported | |||
| Smoking before pregnancy: 16% | Smoking before pregnancy: 24% | ||
| Smoking: 16% | Smoking: 22% | ||
| Not reported | |||
| Not reported | |||
| Not reported | |||
| Smokers were excluded | |||
| Smokers were excluded | |||
| Smokers were excluded | |||
| Not reported | |||
| Smokers were excluded | |||
| Regular smokers were excluded | |||
| Not reported | |||
| Smoked during pregnancy 0.1 g/day EPA + DHA group: 79 (20.3%) 0.3 g/day EPA + DHA group: 78 (20.3%) 0.7 g/day EPA + DHA group: 78 (20.3%) 1.4 g/day EPA + DHA group: 79 (20.6%) 2.8 g/day EPA + DHA group: 78 (19.9%) 2.2g/day ALA group: 79 (20.3%) | Smoked during pregnancy 160 (20.7%) | ||
| Smoking at study entry Yes: 8 (12%) for DHA/EPA group; 9 (14%) for DHA/EPA + Folate group | Smoking at study entry Yes: 5 (7%) for Folate group; 9 (13%) for placebo group | ||
| "Current or previous use of tobacco" an exclusion criteria | |||
| Not reported | |||
| Smoking at trial entry or leading up to pregnancy 358 (29.9%) | Smoking at trial entry or leading up to pregnancy 407 (33.9%) | ||
| Not reported | |||
| Not reported | |||
| Not reported | |||
| Not reported | |||
| Smoker 6 (13%) | Smoker 0 (0%) | ||
| Smoker 2 (4%) | Smoker 0 (0%) | ||
| Smoker 2 (3%) | Smoker 0 (0%) | ||
| Not reported | |||
| Not reported | |||
| Not reported | |||
| Not reported | |||
| Never smoker 14 (78%) in advice group; 12 (71%) in advice+gift card group | Never smoker 14 (70%) in control group | ||
| Smokers Fish oil group: 33% | Smokers Olive oil group: 29% No oil group: 33% | ||
| Smoker Prophylactic trials Earl‐PD trial 45% Earl‐IUGR trial 52% Earl‐PIH trial 19% Twins trial 33% Therapeutic trials Threat‐PE trial 18% Susp‐IUGR trial 31% | Smoker Prophylactic trials Earl‐PD trial 41% Earl‐IUGR 52% Earl‐PIH trial 24% Twins trial 29% Therapeutic trials Threat‐PE trial 21% Susp‐IUGR trial 30% | ||
| Current smoker 42 (37%) | Current smoker 32 (27%) | ||
| Not reported | |||
| Smokers were excluded | |||
| Not reported | |||
| Not reported | |||
| Smokers were excluded | |||
| Smoker 0 (0%) | Smoker 3 (23%) | ||
| Not reported | |||
| Not reported | |||
| Smokers were excluded | |||
| Smoker 1 (13%) | Smoker 2 (25%) | ||
| Smoker before pregnancy: 46.8% Smoker during pregnancy: 27.0% | Smoker before pregnancy: 38.2% Smoker during pregnancy: 21.5% | ||
| Not reported | |||
| Not reported | |||
| Smokers were excluded | |||
| Not reported | |||
| Not reported | |||
| Not reported | |||
| Not reported | |||
| Not reported | |||
| Study ID | All women included in the study |
| Increased/high‐risk (pregnancy complicated with asymmetrical IUGR) | |
| Low‐risk (healthy women) | |
| Any/mixed risk (not reported) | |
| Low‐risk (healthy women) | |
| Low‐risk (healthy women) | |
| Increased/high‐risk (women with a history of IUGR with or without PIH in the previous pregnancy) | |
| Low‐risk (healthy women) | |
| Increased/high‐risk (Infants at risk of T1D (e.g. mothers with T1D) | |
| Mixed risk (21% of all included women had a history of PIH, and 4% a history of preterm birth) | |
| Low‐risk (healthy women) | |
| Increased/high risk (women with GDM) | |
| Low‐risk (history of physician‐diagnosed allergic rhinitis and/or asthma and 1 or more positive skin prick test to common allergens, but who were otherwise healthy) | |
| Increased/high‐risk (women with severe gestational proteinuric hypertension | |
| Increased/high‐risk (pregnant and postpartum women with a major depressive order) | |
| Low‐risk (pregnant women affected by allergy themselves, of having a husband or previous child with allergies, otherwise healthy) | |
| Increased/high‐risk (pregnancy women with a history of IUGR, fetal demise or pre‐eclampsia) | |
| Low‐risk (healthy women) | |
| Increased/high‐risk: (overweight or obese (BMI ≥ 25) | |
| Increased/high‐risk (women with at least 1 prior spontaneous preterm birth) | |
| Low‐risk (healthy women) | |
| Low‐risk (healthy women) | |
| Low‐risk (healthy women) | |
| Increased/high‐risk (pregnant women with T1D) | |
| Low‐risk (healthy women) | |
| Increased/high‐risk (oligohydramnios at 30‐34 weeks GA) | |
| Increased/high‐risk (women with GDM) | |
| Increased/high‐risk (women with GDM) | |
| Low‐risk (healthy women) | |
| Low‐risk (healthy women) | |
| Increased/high‐risk (women diagnosed with mild depression) | |
| Increased/high‐risk (women living in urban low‐income environments) | |
| Low‐risk (healthy women) | |
| Any/mixed risk (not reported) | |
| Low‐risk (healthy women) | |
| Increased/high‐risk (all women overweight or obese) | |
| Increased/high‐risk (women with pre‐eclampsia) | |
| Any/mixed risk | |
| Low‐risk (healthy women) for final outcomes (any/mixed risk for preterm birth outcome) | |
| Increased/high‐risk (all included women underweight (BMI ≤ 21.2kg/m 2 at 10 weeks GA)) | |
| Any/mixed risk (not reported) | |
| Any/mixed risk | |
| Low‐risk (healthy women) | |
| Increased/high‐risk (women diagnosed with Type 2 diabetes) | |
| Increased/high‐risk (women with GDM) | |
| Increased/high‐risk (women with a history of depression) | |
| Low‐risk (healthy women) | |
| Low‐risk (women with a history of allergy, atopy or asthma) | |
| Increased/high‐risk: (women at risk of developing pre‐eclampsia, fetal growth restriction, gestational diabetes) | |
| Any/mixed risk | |
| Low‐risk (healthy women) | |
| Increased/high‐risk (previous preterm birth or IUGR in previous pregnancy or pregnancy‐induced hypertension or twins in current pregnancy; threatening pre‐eclampsia or ultrasonically estimated fetal weight below the 10th centile) | |
| See Olsen 2000 | |
| Increased/high‐risk (primigravida with abnormal Doppler blood flow, previous birthweight < 3rd centile, PIH, previous unexplained stillbirth) | |
| Low‐risk (healthy women) | |
| Low‐risk (healthy women) | |
| Low‐risk (healthy women) | |
| Increased/high‐risk (women at high risk for pre‐eclampsia) | |
| Increased/high‐risk (women diagnosed with GDM) | |
| Increased/high‐risk (current episode of major depression or dysthymia) | |
| Any/mixed (not reported) | |
| Increased/high‐risk (women at risk of pre‐eclampsia) | |
| Increased/high‐risk (women with GDM) | |
| Low‐risk (healthy women) | |
| Low‐risk (healthy women) | |
| Low‐risk (healthy women) | |
| Increased/high‐risk (women diagnosed with major depressive disorder between 16 weeks and 32 weeks GA) | |
| Increased/high‐risk (women with GDM) | |
| Increased/high‐risk (low income; 28% women undernourished) | |
| Low‐risk ("women free from any known diseases that could affect fetal growth") | |
| Low‐risk (healthy women) | |
| Increased/high‐risk (women with GDM) | |
| Increased/high‐risk (pregnant women classified at risk for postpartum depression) | |
| Abbreviations: ADA: American Diabetes Association; BMI: body mass index; GA: gestational age; GDM: gestational diabetes mellitus; IUGR: intrauterine growth restriction; OGTT: oral glucose tolerance test; PIH: pregnancy‐induced hypertension; PPD: postpartum depression | |
| Outcome or subgroup title | No. of studies | No. of participants | Statistical method | Effect size |
| 1 Preterm birth (< 37 weeks) Show forest plot | 26 | 10304 | Risk Ratio (M‐H, Fixed, 95% CI) | 0.89 [0.81, 0.97] |
| 2 Early preterm birth (< 34 weeks) Show forest plot | 9 | 5204 | Risk Ratio (M‐H, Fixed, 95% CI) | 0.58 [0.44, 0.77] |
| 3 Prolonged gestation (> 42 weeks) Show forest plot | 6 | 5141 | Risk Ratio (M‐H, Fixed, 95% CI) | 1.61 [1.11, 2.33] |
| 4 Maternal death Show forest plot | 4 | 4830 | Risk Ratio (M‐H, Fixed, 95% CI) | 1.69 [0.07, 39.30] |
| 5 Pre‐eclampsia (hypertension with proteinuria) Show forest plot | 20 | 8306 | Risk Ratio (M‐H, Fixed, 95% CI) | 0.84 [0.69, 1.01] |
| 6 High blood pressure (without proteinuria) Show forest plot | 7 | 4531 | Risk Ratio (M‐H, Fixed, 95% CI) | 1.03 [0.89, 1.20] |
| 7 Eclampsia Show forest plot | 1 | 100 | Risk Ratio (M‐H, Fixed, 95% CI) | 0.14 [0.01, 2.70] |
| 8 Maternal antepartum hospitalisation Show forest plot | 5 | 2876 | Risk Ratio (M‐H, Fixed, 95% CI) | 0.92 [0.81, 1.04] |
| 8.1 Any | 4 | 2813 | Risk Ratio (M‐H, Fixed, 95% CI) | 0.91 [0.80, 1.03] |
| 8.2 Due to PIH or IUGR | 1 | 63 | Risk Ratio (M‐H, Fixed, 95% CI) | 1.23 [0.67, 2.28] |
| 9 Mother's length of stay in hospital (days) Show forest plot | 2 | 2290 | Mean Difference (IV, Fixed, 95% CI) | 0.18 [‐0.20, 0.57] |
| 10 Maternal anaemia Show forest plot | 1 | 846 | Risk Ratio (M‐H, Fixed, 95% CI) | 1.16 [0.91, 1.48] |
| 11 Miscarriage (< 24 weeks) Show forest plot | 9 | 4190 | Risk Ratio (M‐H, Fixed, 95% CI) | 1.07 [0.80, 1.43] |
| 12 Antepartum vaginal bleeding Show forest plot | 2 | 2151 | Risk Ratio (M‐H, Fixed, 95% CI) | 1.01 [0.69, 1.48] |
| 13 Rupture of membranes (PPROM; PROM) Show forest plot | 4 | Risk Ratio (M‐H, Fixed, 95% CI) | Subtotals only | |
| 13.1 Preterm prelabour rupture of membranes (PPROM) | 3 | 925 | Risk Ratio (M‐H, Fixed, 95% CI) | 0.53 [0.25, 1.10] |
| 13.2 Premature rupture of membranes (PROM) | 3 | 915 | Risk Ratio (M‐H, Fixed, 95% CI) | 0.41 [0.21, 0.82] |
| 14 Maternal admission to intensive care Show forest plot | 2 | 2458 | Risk Ratio (M‐H, Fixed, 95% CI) | 0.56 [0.12, 2.63] |
| 15 Maternal adverse events Show forest plot | 17 | Risk Ratio (M‐H, Fixed, 95% CI) | Subtotals only | |
| 15.1 Severe adverse event | 2 | 2690 | Risk Ratio (M‐H, Fixed, 95% CI) | 1.04 [0.40, 2.72] |
| 15.2 Severe enough for cessation | 6 | 1487 | Risk Ratio (M‐H, Fixed, 95% CI) | 1.01 [0.53, 1.93] |
| 15.3 Any | 5 | 1480 | Risk Ratio (M‐H, Fixed, 95% CI) | 1.38 [1.16, 1.65] |
| 15.4 Nausea | 9 | 2929 | Risk Ratio (M‐H, Fixed, 95% CI) | 1.05 [0.90, 1.22] |
| 15.5 Unpleasant taste | 5 | 2356 | Risk Ratio (M‐H, Fixed, 95% CI) | 4.82 [3.35, 6.92] |
| 15.6 Vomiting | 7 | 3640 | Risk Ratio (M‐H, Fixed, 95% CI) | 1.14 [0.95, 1.37] |
| 15.7 Stomach pain | 4 | 928 | Risk Ratio (M‐H, Fixed, 95% CI) | 1.49 [0.62, 3.59] |
| 15.8 Reflux | 1 | 26 | Risk Ratio (M‐H, Fixed, 95% CI) | 1.0 [0.16, 6.07] |
| 15.9 Belching or burping | 5 | 2262 | Risk Ratio (M‐H, Fixed, 95% CI) | 3.52 [2.86, 4.34] |
| 15.10 Diarrhoea | 6 | 1764 | Risk Ratio (M‐H, Fixed, 95% CI) | 0.80 [0.52, 1.24] |
| 15.11 Constipation | 1 | 1077 | Risk Ratio (M‐H, Fixed, 95% CI) | 0.42 [0.08, 2.15] |
| 15.12 Nasal bleeding | 2 | 1506 | Risk Ratio (M‐H, Fixed, 95% CI) | 0.94 [0.71, 1.24] |
| 15.13 Swelling/other reaction at injection site | 1 | 852 | Risk Ratio (M‐H, Fixed, 95% CI) | 1.10 [0.99, 1.22] |
| 15.14 Insomnia | 1 | 36 | Risk Ratio (M‐H, Fixed, 95% CI) | 1.5 [0.28, 7.93] |
| 15.15 Headache | 1 | 301 | Risk Ratio (M‐H, Fixed, 95% CI) | 1.61 [0.91, 2.86] |
| 15.16 Gynaecological infections | 1 | 291 | Risk Ratio (M‐H, Fixed, 95% CI) | 0.84 [0.45, 1.55] |
| 15.17 Labour related | 1 | 291 | Risk Ratio (M‐H, Fixed, 95% CI) | 0.49 [0.27, 0.88] |
| 15.18 Urinary tract infection | 1 | 291 | Risk Ratio (M‐H, Fixed, 95% CI) | 0.30 [0.06, 1.42] |
| 16 Caesarean section Show forest plot | 28 | 8481 | Risk Ratio (M‐H, Fixed, 95% CI) | 0.97 [0.91, 1.03] |
| 17 Induction (post‐term) Show forest plot | 3 | 2900 | Risk Ratio (M‐H, Random, 95% CI) | 0.82 [0.22, 2.98] |
| 18 Blood loss at birth (mL) Show forest plot | 6 | 2776 | Mean Difference (IV, Fixed, 95% CI) | 11.50 [‐6.75, 29.76] |
| 19 Postpartum haemorrhage Show forest plot | 4 | 4085 | Risk Ratio (M‐H, Fixed, 95% CI) | 1.03 [0.82, 1.30] |
| 20 Gestational diabetes Show forest plot | 12 | 5235 | Risk Ratio (M‐H, Fixed, 95% CI) | 1.02 [0.83, 1.26] |
| 21 Maternal insulin resistance (HOMA‐IR) Show forest plot | 3 | 176 | Mean Difference (IV, Random, 95% CI) | ‐0.85 [‐2.50, 0.80] |
| 22 Excessive gestational weight gain Show forest plot | 1 | 350 | Risk Ratio (M‐H, Fixed, 95% CI) | 1.21 [0.95, 1.55] |
| 23 Gestational weight gain (kg) Show forest plot | 11 | 2297 | Mean Difference (IV, Random, 95% CI) | ‐0.05 [‐0.68, 0.59] |
| 24 Depression during pregnancy: thresholds Show forest plot | 3 | Risk Ratio (M‐H, Fixed, 95% CI) | Subtotals only | |
| 24.1 HAMD 50% reduction (after 8 weeks) | 1 | 24 | Risk Ratio (M‐H, Fixed, 95% CI) | 2.26 [0.78, 6.49] |
| 24.2 HAMD ≤ 7 | 1 | 24 | Risk Ratio (M‐H, Fixed, 95% CI) | 2.12 [0.51, 8.84] |
| 24.3 Unspecified | 1 | 301 | Risk Ratio (M‐H, Fixed, 95% CI) | 2.39 [0.47, 12.11] |
| 24.4 EPDS ≥ 11 | 1 | 34 | Risk Ratio (M‐H, Fixed, 95% CI) | 1.4 [0.55, 3.55] |
| 25 Depression during pregnancy: scores Show forest plot | 5 | Mean Difference (IV, Random, 95% CI) | Subtotals only | |
| 25.1 BDI | 2 | 104 | Mean Difference (IV, Random, 95% CI) | ‐5.86 [‐8.32, ‐3.39] |
| 25.2 HAMD | 3 | 71 | Mean Difference (IV, Random, 95% CI) | ‐0.92 [‐5.91, 4.06] |
| 25.3 EPDS | 4 | 122 | Mean Difference (IV, Random, 95% CI) | ‐0.40 [‐3.70, 2.89] |
| 25.4 MADRS | 1 | 26 | Mean Difference (IV, Random, 95% CI) | ‐1.60 [‐7.80, 4.60] |
| 26 Anxiety during pregnancy Show forest plot | 1 | 301 | Risk Ratio (M‐H, Fixed, 95% CI) | 0.95 [0.06, 15.12] |
| 27 Difficult life circumstances (maternal) Show forest plot | 1 | 51 | Mean Difference (IV, Fixed, 95% CI) | 0.32 [‐0.15, 0.79] |
| 28 Stress (maternal) Show forest plot | 1 | Mean Difference (IV, Fixed, 95% CI) | Subtotals only | |
| 28.1 Perceived Stress Scale (scores) | 1 | 51 | Mean Difference (IV, Fixed, 95% CI) | ‐1.82 [‐3.68, 0.04] |
| 29 Depressive symptoms postpartum: threshold Show forest plot | 4 | Risk Ratio (M‐H, Random, 95% CI) | Subtotals only | |
| 29.1 PDSS ≥ 80 | 1 | 42 | Risk Ratio (M‐H, Random, 95% CI) | 0.37 [0.04, 3.25] |
| 29.2 EPDS | 2 | 2431 | Risk Ratio (M‐H, Random, 95% CI) | 0.99 [0.56, 1.77] |
| 29.3 Major depressive disorder | 1 | 118 | Risk Ratio (M‐H, Random, 95% CI) | 1.33 [0.27, 6.56] |
| 30 Depressive symptoms postpartum: scores Show forest plot | 2 | Mean Difference (IV, Fixed, 95% CI) | Subtotals only | |
| 30.1 BDI: 6‐8 weeks postpartum | 1 | 118 | Mean Difference (IV, Fixed, 95% CI) | 0.25 [‐1.93, 2.43] |
| 30.2 PDSS total (LS over 6 months) | 1 | 42 | Mean Difference (IV, Fixed, 95% CI) | ‐6.08 [‐12.42, 0.26] |
| 30.3 Disturbances sleep/eating (LS over 6 months) | 1 | 42 | Mean Difference (IV, Fixed, 95% CI) | ‐1.0 [‐2.66, 0.66] |
| 30.4 Anxiety/insecurity (LS over 6 months) | 1 | 42 | Mean Difference (IV, Fixed, 95% CI) | ‐1.30 [‐2.96, 0.36] |
| 30.5 Emotional lability (LS over 6 months) | 1 | 42 | Mean Difference (IV, Fixed, 95% CI) | ‐1.29 [‐3.10, 0.52] |
| 30.6 Mental confusion (LS over 6 months) | 1 | 42 | Mean Difference (IV, Fixed, 95% CI) | ‐1.30 [‐2.92, 0.32] |
| 30.7 Loss of self (LS over 6 months) | 1 | 42 | Mean Difference (IV, Fixed, 95% CI) | ‐0.90 [‐1.80, 0.00] |
| 30.8 Guilt (LS over 6 months) | 1 | 42 | Mean Difference (IV, Fixed, 95% CI) | ‐0.30 [‐1.13, 0.53] |
| 30.9 Suicide (LS over 6 months) | 1 | 42 | Mean Difference (IV, Fixed, 95% CI) | ‐0.07 [‐0.35, 0.21] |
| 30.10 PDSS total at 6 months | 1 | 42 | Mean Difference (IV, Fixed, 95% CI) | ‐2.87 [‐12.17, 6.43] |
| 30.11 Disturbances sleep/eating at 6 months | 1 | 42 | Mean Difference (IV, Fixed, 95% CI) | ‐0.20 [‐2.08, 1.68] |
| 30.12 Anxiety/insecurity at 6 months | 1 | 42 | Mean Difference (IV, Fixed, 95% CI) | ‐0.46 [‐2.65, 1.73] |
| 30.13 Emotional lability at 6 months | 1 | 42 | Mean Difference (IV, Fixed, 95% CI) | ‐0.96 [‐3.32, 1.40] |
| 30.14 Mental confusion at 6 months | 1 | 42 | Mean Difference (IV, Fixed, 95% CI) | ‐0.13 [‐2.15, 1.89] |
| 30.15 Loss of self at 6 months | 1 | 42 | Mean Difference (IV, Fixed, 95% CI) | ‐0.97 [‐2.18, 0.24] |
| 30.16 Guilt at 6 months | 1 | 42 | Mean Difference (IV, Fixed, 95% CI) | 0.21 [‐0.69, 1.11] |
| 30.17 Suicide at 6 months | 1 | 42 | Mean Difference (IV, Fixed, 95% CI) | ‐0.52 [‐1.13, 0.09] |
| 31 Gestational length (days) Show forest plot | 43 | 12517 | Mean Difference (IV, Random, 95% CI) | 1.67 [0.95, 2.39] |
| 32 Perinatal death Show forest plot | 10 | 7416 | Risk Ratio (M‐H, Fixed, 95% CI) | 0.75 [0.54, 1.03] |
| 33 Stillbirth Show forest plot | 16 | 7880 | Risk Ratio (M‐H, Fixed, 95% CI) | 0.94 [0.62, 1.42] |
| 34 Neonatal death Show forest plot | 9 | 7448 | Risk Ratio (M‐H, Fixed, 95% CI) | 0.61 [0.34, 1.11] |
| 35 Infant death Show forest plot | 4 | 3239 | Risk Ratio (M‐H, Fixed, 95% CI) | 0.74 [0.25, 2.19] |
| 36 Large‐for‐gestational age Show forest plot | 6 | 3722 | Risk Ratio (M‐H, Fixed, 95% CI) | 1.15 [0.97, 1.36] |
| 37 Macrosomia Show forest plot | 6 | 2008 | Risk Ratio (M‐H, Fixed, 95% CI) | 0.69 [0.43, 1.13] |
| 38 Low birthweight (< 2500 g) Show forest plot | 15 | 8449 | Risk Ratio (M‐H, Fixed, 95% CI) | 0.90 [0.82, 0.99] |
| 39 Small‐for‐gestational age/IUGR Show forest plot | 8 | 6907 | Risk Ratio (M‐H, Fixed, 95% CI) | 1.01 [0.90, 1.13] |
| 40 Birthweight (g) Show forest plot | 44 | 11584 | Mean Difference (IV, Random, 95% CI) | 75.74 [38.05, 113.43] |
| 41 Birthweight Z score Show forest plot | 4 | 2792 | Mean Difference (IV, Fixed, 95% CI) | 0.06 [‐0.02, 0.13] |
| 42 Birth length (cm) Show forest plot | 29 | 8128 | Mean Difference (IV, Random, 95% CI) | 0.11 [‐0.10, 0.31] |
| 43 Head circumference at birth (cm) Show forest plot | 24 | 7161 | Mean Difference (IV, Random, 95% CI) | 0.07 [‐0.05, 0.19] |
| 44 Head circumference at birth Z score Show forest plot | 2 | 2462 | Mean Difference (IV, Fixed, 95% CI) | ‐0.03 [‐0.14, 0.07] |
| 45 Length at birth Z score Show forest plot | 2 | 2462 | Mean Difference (IV, Random, 95% CI) | 0.18 [‐0.18, 0.54] |
| 46 Baby admitted to neonatal care Show forest plot | 9 | 6920 | Risk Ratio (M‐H, Fixed, 95% CI) | 0.92 [0.83, 1.03] |
| 47 Infant length of stay in hospital (days) Show forest plot | 1 | 2041 | Mean Difference (IV, Fixed, 95% CI) | 0.11 [‐1.40, 1.62] |
| 48 Congenital anomalies Show forest plot | 3 | 1807 | Risk Ratio (M‐H, Fixed, 95% CI) | 1.08 [0.61, 1.92] |
| 49 Retinopathy of prematurity Show forest plot | 1 | 837 | Risk Ratio (M‐H, Fixed, 95% CI) | 1.20 [0.32, 4.44] |
| 50 Bronchopulmonary dysplasia Show forest plot | 2 | 3191 | Risk Ratio (M‐H, Fixed, 95% CI) | 1.06 [0.45, 2.48] |
| 51 Respiratory distress syndrome Show forest plot | 2 | 1129 | Risk Ratio (M‐H, Random, 95% CI) | 1.17 [0.54, 2.52] |
| 52 Necrotising enterocolitis (NEC) Show forest plot | 2 | 3198 | Risk Ratio (M‐H, Fixed, 95% CI) | 0.97 [0.26, 3.55] |
| 53 Neonatal sepsis (proven) Show forest plot | 3 | 3788 | Risk Ratio (M‐H, Fixed, 95% CI) | 0.97 [0.44, 2.14] |
| 54 Convulsion Show forest plot | 1 | 2361 | Risk Ratio (M‐H, Fixed, 95% CI) | 0.09 [0.01, 1.63] |
| 55 Intraventricular haemorrhage Show forest plot | 3 | Risk Ratio (M‐H, Random, 95% CI) | Subtotals only | |
| 55.1 Any | 3 | 5423 | Risk Ratio (M‐H, Random, 95% CI) | 1.00 [0.29, 3.49] |
| 55.2 Grade 3 or 4 | 1 | 837 | Risk Ratio (M‐H, Random, 95% CI) | 1.60 [0.38, 6.65] |
| 56 Neonatal/infant adverse events Show forest plot | 3 | Risk Ratio (M‐H, Fixed, 95% CI) | Subtotals only | |
| 56.1 Any adverse event | 2 | 592 | Risk Ratio (M‐H, Fixed, 95% CI) | 0.92 [0.82, 1.02] |
| 56.2 Serious adverse events | 2 | 2690 | Risk Ratio (M‐H, Fixed, 95% CI) | 0.72 [0.53, 0.99] |
| 57 Neonatal/infant morbidity: cardiovascular Show forest plot | 1 | Risk Ratio (M‐H, Fixed, 95% CI) | Subtotals only | |
| 58 Neonatal/infant morbidity: respiratory Show forest plot | 1 | 291 | Risk Ratio (M‐H, Fixed, 95% CI) | 1.02 [0.66, 1.57] |
| 59 Neonatal/infant morbidity: due to pregnancy/birth events Show forest plot | 1 | 291 | Risk Ratio (M‐H, Fixed, 95% CI) | 1.02 [0.67, 1.55] |
| 60 Neonatal/infant morbidity: other Show forest plot | 1 | Risk Ratio (M‐H, Fixed, 95% CI) | Subtotals only | |
| 60.1 Colds in past 15 days: at 1 month of age | 1 | 849 | Risk Ratio (M‐H, Fixed, 95% CI) | 0.85 [0.72, 1.00] |
| 60.2 Colds in past 15 days: at 3 months of age | 1 | 834 | Risk Ratio (M‐H, Fixed, 95% CI) | 0.86 [0.73, 1.01] |
| 60.3 Colds in past 15 days: at 6 months of age | 1 | 834 | Risk Ratio (M‐H, Fixed, 95% CI) | 0.99 [0.86, 1.15] |
| 60.4 Fever in past 15 days: at 1 month of age | 1 | 849 | Risk Ratio (M‐H, Fixed, 95% CI) | 1.08 [0.53, 2.22] |
| 60.5 Fever in past 15 days: at 3 months of age | 1 | 834 | Risk Ratio (M‐H, Fixed, 95% CI) | 0.80 [0.53, 1.23] |
| 60.6 Fever in past 15 days: at 6 months of age | 1 | 834 | Risk Ratio (M‐H, Fixed, 95% CI) | 0.99 [0.74, 1.31] |
| 60.7 Rash in past 15 days: at 1 month of age | 1 | 849 | Risk Ratio (M‐H, Fixed, 95% CI) | 1.11 [0.89, 1.38] |
| 60.8 Rash in past 15 days: at 3 months of age | 1 | 834 | Risk Ratio (M‐H, Fixed, 95% CI) | 0.82 [0.54, 1.26] |
| 60.9 Rash in past 15 days: at 6 months of age | 1 | 834 | Risk Ratio (M‐H, Fixed, 95% CI) | 1.14 [0.76, 1.71] |
| 60.10 Vomiting in past 15 days: at 1 month of age | 1 | 849 | Risk Ratio (M‐H, Fixed, 95% CI) | 1.55 [0.82, 2.93] |
| 60.11 Vomiting in past 15 days: at 3 months of age | 1 | 834 | Risk Ratio (M‐H, Fixed, 95% CI) | 1.43 [0.69, 2.96] |
| 60.12 Vomiting in past 15 days: at 6 months of age | 1 | 834 | Risk Ratio (M‐H, Fixed, 95% CI) | 1.33 [0.72, 2.46] |
| 60.13 Diarrhoea in past 15 days: at 1 month of age | 1 | 849 | Risk Ratio (M‐H, Fixed, 95% CI) | 0.83 [0.42, 1.67] |
| 60.14 Diarrhoea in past 15 days: at 3 months of age | 1 | 834 | Risk Ratio (M‐H, Fixed, 95% CI) | 0.83 [0.46, 1.51] |
| 60.15 Diarrhoea in past 15 days: at 6 months of age | 1 | 834 | Risk Ratio (M‐H, Fixed, 95% CI) | 1.02 [0.63, 1.64] |
| 60.16 Other illness in the past 15 days: at 1 month | 1 | 849 | Risk Ratio (M‐H, Fixed, 95% CI) | 1.40 [0.81, 2.41] |
| 60.17 Other illness in the past 15 days: at 3 months | 1 | 834 | Risk Ratio (M‐H, Fixed, 95% CI) | 0.96 [0.54, 1.73] |
| 60.18 Other illness in the past 15 days: at 6 months | 1 | 834 | Risk Ratio (M‐H, Fixed, 95% CI) | 1.15 [0.68, 1.95] |
| 61 Infant/child morbidity Show forest plot | 1 | Risk Ratio (M‐H, Fixed, 95% CI) | Subtotals only | |
| 61.1 ICU admissions | 1 | 1396 | Risk Ratio (M‐H, Fixed, 95% CI) | 0.58 [0.31, 1.06] |
| 61.2 Medical diagnosis of attention deficit hyperactivity disorder (ADHD) | 1 | 1526 | Risk Ratio (M‐H, Fixed, 95% CI) | 2.96 [0.31, 28.40] |
| 61.3 Medical diagnosis of autism spectrum disorder | 1 | 1526 | Risk Ratio (M‐H, Fixed, 95% CI) | 1.15 [0.54, 2.47] |
| 61.4 Medical diagnosis of other learning/behavioural disorders | 1 | 1526 | Risk Ratio (M‐H, Fixed, 95% CI) | 1.12 [0.78, 1.60] |
| 61.5 Medical diagnosis of other chronic health conditions | 1 | 1526 | Risk Ratio (M‐H, Fixed, 95% CI) | 0.97 [0.65, 1.44] |
| 62 Ponderal index Show forest plot | 6 | 887 | Mean Difference (IV, Random, 95% CI) | 0.05 [‐0.01, 0.11] |
| 63 Infant/child weight (kg) Show forest plot | 11 | Mean Difference (IV, Random, 95% CI) | Subtotals only | |
| 63.1 At < 3 months | 2 | 863 | Mean Difference (IV, Random, 95% CI) | 0.01 [‐0.07, 0.09] |
| 63.2 At 3 to < 12 months | 4 | 1028 | Mean Difference (IV, Random, 95% CI) | 0.01 [‐0.18, 0.20] |
| 63.3 At 1 to < 2 years | 4 | 1084 | Mean Difference (IV, Random, 95% CI) | 0.01 [‐0.19, 0.21] |
| 63.4 At 2 to < 3 years | 2 | 182 | Mean Difference (IV, Random, 95% CI) | 0.24 [‐0.20, 0.68] |
| 63.5 At 3 to < 4 years | 2 | 1651 | Mean Difference (IV, Random, 95% CI) | 0.18 [‐0.20, 0.57] |
| 63.6 At 4 to < 5 years | 2 | 631 | Mean Difference (IV, Random, 95% CI) | 0.38 [‐0.29, 1.05] |
| 63.7 At 5 to < 6 years | 4 | 2618 | Mean Difference (IV, Random, 95% CI) | 0.23 [‐0.18, 0.63] |
| 63.8 At ≥ 6 years | 3 | 508 | Mean Difference (IV, Random, 95% CI) | ‐0.08 [‐0.79, 0.64] |
| 64 Infant/child length/height (cm) Show forest plot | 11 | Mean Difference (IV, Random, 95% CI) | Subtotals only | |
| 64.1 < 3 months | 2 | 861 | Mean Difference (IV, Random, 95% CI) | ‐0.01 [‐0.69, 0.66] |
| 64.2 3 to < 12 months | 4 | 1115 | Mean Difference (IV, Random, 95% CI) | 0.11 [‐0.20, 0.42] |
| 64.3 1 to < 2 years | 4 | 998 | Mean Difference (IV, Random, 95% CI) | 0.01 [‐0.45, 0.48] |
| 64.4 2 to < 3 years | 2 | 182 | Mean Difference (IV, Random, 95% CI) | 0.18 [‐0.73, 1.08] |
| 64.5 3 to < 4 years | 2 | 1651 | Mean Difference (IV, Random, 95% CI) | 0.18 [‐0.21, 0.58] |
| 64.6 4 to < 5 years | 2 | 631 | Mean Difference (IV, Random, 95% CI) | 0.30 [‐0.36, 0.95] |
| 64.7 5 to < 6 years | 5 | 2733 | Mean Difference (IV, Random, 95% CI) | 0.20 [‐0.17, 0.57] |
| 64.8 At ≥ 6 years | 2 | 393 | Mean Difference (IV, Random, 95% CI) | ‐1.22 [‐2.29, ‐0.16] |
| 65 Infant/child head circumference (cm) Show forest plot | 10 | Mean Difference (IV, Random, 95% CI) | Subtotals only | |
| 65.1 At < 3 months | 2 | 863 | Mean Difference (IV, Random, 95% CI) | ‐0.04 [‐0.22, 0.14] |
| 65.2 At 3 to < 12 months | 5 | 1309 | Mean Difference (IV, Random, 95% CI) | ‐0.03 [‐0.19, 0.12] |
| 65.3 At 1 to < 2 years | 4 | 1084 | Mean Difference (IV, Random, 95% CI) | 0.06 [‐0.18, 0.30] |
| 65.4 At 2 to < 3 years | 2 | 182 | Mean Difference (IV, Random, 95% CI) | ‐0.04 [‐0.47, 0.40] |
| 65.5 At 3 to < 4 years | 2 | 1651 | Mean Difference (IV, Random, 95% CI) | ‐0.01 [‐0.16, 0.14] |
| 65.6 At 4 to < 5 years | 1 | 107 | Mean Difference (IV, Random, 95% CI) | 0.0 [‐0.47, 0.47] |
| 65.7 At ≥ 5 years | 3 | 1760 | Mean Difference (IV, Random, 95% CI) | 0.02 [‐0.13, 0.17] |
| 66 Infant/child length/height for age Z score (LAZ/HAZ) Show forest plot | 3 | Mean Difference (IV, Random, 95% CI) | Subtotals only | |
| 66.1 At < 3 months | 2 | 875 | Mean Difference (IV, Random, 95% CI) | ‐0.13 [‐0.27, 0.02] |
| 66.2 At 3 to < 12 months | 3 | 1085 | Mean Difference (IV, Random, 95% CI) | ‐0.05 [‐0.19, 0.09] |
| 66.3 At 12 to < 24 months | 2 | 897 | Mean Difference (IV, Random, 95% CI) | ‐0.06 [‐0.31, 0.18] |
| 66.4 At 4 to < 5 years | 1 | 524 | Mean Difference (IV, Random, 95% CI) | 0.0 [‐0.15, 0.15] |
| 66.5 At ≥ 5 years | 1 | 802 | Mean Difference (IV, Random, 95% CI) | 0.0 [‐0.12, 0.12] |
| 67 Infant/child waist circumference (cm) Show forest plot | 2 | Mean Difference (IV, Fixed, 95% CI) | Subtotals only | |
| 67.1 At 2 to < 3 years | 1 | 101 | Mean Difference (IV, Fixed, 95% CI) | ‐0.20 [‐1.29, 0.89] |
| 67.2 At 3 to < 4 years | 2 | 1651 | Mean Difference (IV, Fixed, 95% CI) | 0.28 [‐0.05, 0.60] |
| 67.3 At 4 to < 5 years | 1 | 106 | Mean Difference (IV, Fixed, 95% CI) | 0.70 [‐0.40, 1.80] |
| 67.4 At ≥ 5 years | 2 | 1645 | Mean Difference (IV, Fixed, 95% CI) | 0.15 [‐0.24, 0.55] |
| 68 Infant/child weight‐for‐age Z score (WAZ) Show forest plot | 2 | Mean Difference (IV, Random, 95% CI) | Subtotals only | |
| 68.1 At < 3 months | 2 | 874 | Mean Difference (IV, Random, 95% CI) | ‐0.09 [‐0.30, 0.12] |
| 68.2 At 3 to < 12 months | 2 | 834 | Mean Difference (IV, Random, 95% CI) | ‐0.05 [‐0.18, 0.08] |
| 68.3 At 12 to < 24 months | 2 | 883 | Mean Difference (IV, Random, 95% CI) | ‐0.01 [‐0.13, 0.12] |
| 68.4 At ≥ 60 months | 1 | 802 | Mean Difference (IV, Random, 95% CI) | ‐0.1 [‐0.25, 0.05] |
| 69 Infant/child BMI Z score Show forest plot | 5 | Mean Difference (IV, Random, 95% CI) | Subtotals only | |
| 69.1 At 1 to < 2 years | 2 | 801 | Mean Difference (IV, Random, 95% CI) | ‐0.05 [‐0.09, 0.00] |
| 69.2 At 2 to < 3 years | 1 | 63 | Mean Difference (IV, Random, 95% CI) | ‐0.07 [‐0.25, 0.11] |
| 69.3 At 3 to < 4 years | 1 | 1531 | Mean Difference (IV, Random, 95% CI) | 0.02 [‐0.08, 0.12] |
| 69.4 At 4 to < 5 years | 2 | 587 | Mean Difference (IV, Random, 95% CI) | 0.15 [‐0.16, 0.47] |
| 69.5 At 5 to < 6 years | 3 | 2504 | Mean Difference (IV, Random, 95% CI) | 0.03 [‐0.05, 0.11] |
| 69.6 At 6 to < 7 years | 1 | 115 | Mean Difference (IV, Random, 95% CI) | 0.01 [‐0.02, 0.05] |
| 69.7 At ≥ 7 years | 1 | 250 | Mean Difference (IV, Random, 95% CI) | 0.18 [‐0.10, 0.46] |
| 70 Infant/child weight for length/height Z score (WHZ) Show forest plot | 3 | Mean Difference (IV, Random, 95% CI) | Subtotals only | |
| 70.1 At < 3 months | 2 | 860 | Mean Difference (IV, Random, 95% CI) | ‐0.03 [‐0.41, 0.34] |
| 70.2 At 3 to < 12 months | 3 | 1083 | Mean Difference (IV, Random, 95% CI) | ‐0.00 [‐0.14, 0.14] |
| 70.3 At 12 to < 24 months | 2 | 883 | Mean Difference (IV, Random, 95% CI) | ‐0.02 [‐0.14, 0.10] |
| 71 Infant/child BMI percentile Show forest plot | 1 | Mean Difference (IV, Fixed, 95% CI) | Subtotals only | |
| 71.1 At 24 months | 1 | 118 | Mean Difference (IV, Fixed, 95% CI) | 4.5 [‐5.50, 14.50] |
| 71.2 At 36 months | 1 | 120 | Mean Difference (IV, Fixed, 95% CI) | 8.0 [‐1.09, 17.09] |
| 71.3 At 48 months | 1 | 107 | Mean Difference (IV, Fixed, 95% CI) | 13.0 [3.19, 22.81] |
| 71.4 At 60 months | 1 | 114 | Mean Difference (IV, Fixed, 95% CI) | 4.80 [‐4.70, 14.30] |
| 72 Child/adult BMI Show forest plot | 3 | Mean Difference (IV, Fixed, 95% CI) | Subtotals only | |
| 72.1 At 3 to 4 years | 1 | 1531 | Mean Difference (IV, Fixed, 95% CI) | 0.01 [‐0.14, 0.16] |
| 72.2 At 5 to 6 years | 1 | 1531 | Mean Difference (IV, Fixed, 95% CI) | ‐0.01 [‐0.18, 0.16] |
| 72.3 At 7 to 9 years | 2 | 393 | Mean Difference (IV, Fixed, 95% CI) | 0.16 [‐0.25, 0.57] |
| 72.4 At 19 years | 1 | 243 | Mean Difference (IV, Fixed, 95% CI) | 0.0 [‐0.83, 0.83] |
| 73 Infant/child body fat (%) Show forest plot | 3 | Mean Difference (IV, Fixed, 95% CI) | Subtotals only | |
| 73.1 At 1 year | 1 | 165 | Mean Difference (IV, Fixed, 95% CI) | 0.0 [‐0.88, 0.88] |
| 73.2 At 2 to < 3 years | 1 | 110 | Mean Difference (IV, Fixed, 95% CI) | 0.20 [‐0.68, 1.08] |
| 73.3 At 3 to < 4 years | 2 | 1644 | Mean Difference (IV, Fixed, 95% CI) | ‐0.18 [‐0.74, 0.38] |
| 73.4 At 4 to < 5 years | 1 | 102 | Mean Difference (IV, Fixed, 95% CI) | 0.30 [‐0.79, 1.39] |
| 73.5 At 5 to < 6 years | 3 | 1797 | Mean Difference (IV, Fixed, 95% CI) | 0.01 [‐0.56, 0.58] |
| 73.6 At ≥ 7 years: BIS | 1 | 250 | Mean Difference (IV, Fixed, 95% CI) | 1.44 [‐0.31, 3.19] |
| 73.7 At ≥ 7 years: BOD POD | 1 | 250 | Mean Difference (IV, Fixed, 95% CI) | ‐0.42 [‐2.23, 1.39] |
| 74 Infant/child total fat mass (kg) Show forest plot | 3 | Mean Difference (IV, Fixed, 95% CI) | Subtotals only | |
| 74.1 At 1 year | 1 | 164 | Mean Difference (IV, Fixed, 95% CI) | 0.0 [‐0.07, 0.07] |
| 74.2 At 2 to < 3 years | 1 | 110 | Mean Difference (IV, Fixed, 95% CI) | 0.10 [‐0.09, 0.29] |
| 74.3 At 3 to < 4 years | 2 | 1644 | Mean Difference (IV, Fixed, 95% CI) | ‐0.01 [‐0.12, 0.10] |
| 74.4 At 4 to < 5 years | 1 | 102 | Mean Difference (IV, Fixed, 95% CI) | 0.20 [‐0.05, 0.45] |
| 74.5 At 5 to < 6 years | 3 | 1797 | Mean Difference (IV, Fixed, 95% CI) | 0.05 [‐0.10, 0.21] |
| 74.6 Up to 8 years: BOD POD | 1 | 250 | Mean Difference (IV, Fixed, 95% CI) | 0.08 [‐0.71, 0.87] |
| 74.7 Up to 8 years: BIS | 1 | 250 | Mean Difference (IV, Fixed, 95% CI) | 0.29 [‐0.47, 1.05] |
| 75 Cognition: thresholds Show forest plot | 3 | Risk Ratio (M‐H, Fixed, 95% CI) | Subtotals only | |
| 75.1 BSID III < 85 at 18 months | 1 | 726 | Risk Ratio (M‐H, Fixed, 95% CI) | 0.49 [0.24, 0.98] |
| 75.2 BSID III > 115 at 18 months | 1 | 726 | Risk Ratio (M‐H, Fixed, 95% CI) | 0.84 [0.49, 1.44] |
| 75.3 BSID II < 85 at 18 months | 1 | 730 | Risk Ratio (M‐H, Fixed, 95% CI) | 1.43 [0.97, 2.12] |
| 75.4 BSID III cognitive score (highest quartile): at 18 months | 1 | 154 | Risk Ratio (M‐H, Fixed, 95% CI) | 0.90 [0.49, 1.65] |
| 76 Cognition: scores Show forest plot | 10 | Mean Difference (IV, Fixed, 95% CI) | Subtotals only | |
| 76.1 BSID II score < 24 months | 4 | 1154 | Mean Difference (IV, Fixed, 95% CI) | ‐0.37 [‐1.49, 0.76] |
| 76.2 BSID III score < 24 months | 2 | 809 | Mean Difference (IV, Fixed, 95% CI) | 0.04 [‐1.59, 1.68] |
| 76.3 Fagan novelty preference < 24 months | 2 | 274 | Mean Difference (IV, Fixed, 95% CI) | ‐0.79 [‐1.68, 0.11] |
| 76.4 K‐ABC mental processing composite at 2 to 5 years | 1 | 84 | Mean Difference (IV, Fixed, 95% CI) | 4.10 [‐0.14, 8.34] |
| 76.5 K‐ABC sequential processing at 5 to 6 years | 1 | 96 | Mean Difference (IV, Fixed, 95% CI) | 0.0 [‐1.80, 1.80] |
| 76.6 GMDS general quotient score at 2 to 5 years | 1 | 72 | Mean Difference (IV, Fixed, 95% CI) | 3.70 [‐1.02, 8.42] |
| 76.7 DAS II: General Conceptual Ability Scale at 2 to 5 years | 1 | 646 | Mean Difference (IV, Fixed, 95% CI) | 0.13 [‐1.53, 1.79] |
| 76.8 DAS II: Non‐verbal Reasoning Scale at 2 to 5 years | 1 | 646 | Mean Difference (IV, Fixed, 95% CI) | ‐0.35 [‐2.04, 1.34] |
| 76.9 DAS II: Verbal Scale at 2 to 5 years | 1 | 646 | Mean Difference (IV, Fixed, 95% CI) | ‐0.35 [‐1.74, 1.04] |
| 76.10 DAS II: Spatial Scale at 2 to 5 years | 1 | 646 | Mean Difference (IV, Fixed, 95% CI) | 0.96 [‐0.77, 2.69] |
| 76.11 MCDS: scale index general cognitive at 5 years | 1 | 797 | Mean Difference (IV, Fixed, 95% CI) | ‐0.5 [‐2.35, 1.35] |
| 76.12 WASI full‐scale IQ at 6 to 9 years | 1 | 543 | Mean Difference (IV, Fixed, 95% CI) | 1.0 [‐0.79, 2.79] |
| 76.13 WISC‐IV full scale IQ at > 12 years | 1 | 50 | Mean Difference (IV, Fixed, 95% CI) | 1.0 [‐5.16, 7.16] |
| 77 Attention: scores Show forest plot | 3 | Mean Difference (IV, Fixed, 95% CI) | Subtotals only | |
| 77.1 K‐CPT omissions at 5 years | 1 | 797 | Mean Difference (IV, Fixed, 95% CI) | ‐1.90 [‐3.39, ‐0.41] |
| 77.2 K‐CPT commissions at 5 years | 1 | 797 | Mean Difference (IV, Fixed, 95% CI) | 0.10 [‐1.37, 1.57] |
| 77.3 K‐CPT hit response time at 5 years | 1 | 797 | Mean Difference (IV, Fixed, 95% CI) | ‐0.60 [‐2.06, 0.86] |
| 77.4 Attention: single‐object task: total time looking at toy(s) at 2 to 5 years | 1 | 150 | Mean Difference (IV, Fixed, 95% CI) | ‐7.80 [‐22.59, 6.99] |
| 77.5 Attention: multiple‐object task; # times shifted looks between toys at 2 to 5 years | 1 | 150 | Mean Difference (IV, Fixed, 95% CI) | ‐0.40 [‐4.28, 3.48] |
| 77.6 Attention: distractibility: av latency to look when attention focused (s) at 2 to 5 years | 1 | 150 | Mean Difference (IV, Fixed, 95% CI) | ‐0.30 [‐0.86, 0.26] |
| 77.7 Attention: global speed (ms) at 8.5 years | 1 | 130 | Mean Difference (IV, Fixed, 95% CI) | ‐5.5 [‐47.16, 36.16] |
| 77.8 Attention: interference (ms) at 8.5 years | 1 | 130 | Mean Difference (IV, Fixed, 95% CI) | 6.97 [‐16.42, 30.36] |
| 77.9 Attention: orienting (ms) at 8.5 years | 1 | 130 | Mean Difference (IV, Fixed, 95% CI) | 3.99 [‐16.90, 24.88] |
| 77.10 Attention: alertness (ms) at 8.5 years | 1 | 130 | Mean Difference (IV, Fixed, 95% CI) | ‐5.69 [‐27.88, 16.50] |
| 78 Motor: thresholds Show forest plot | 2 | Risk Ratio (M‐H, Fixed, 95% CI) | Subtotals only | |
| 78.1 BSID II score < 85 at 18 months | 1 | 730 | Risk Ratio (M‐H, Fixed, 95% CI) | 0.88 [0.65, 1.19] |
| 78.2 Fine motor (highest quartile): at 18 months | 1 | 154 | Risk Ratio (M‐H, Fixed, 95% CI) | 1.19 [0.71, 1.99] |
| 78.3 Gross motor (highest quartile): at 18 months | 1 | 154 | Risk Ratio (M‐H, Fixed, 95% CI) | 1.13 [0.68, 1.88] |
| 79 Motor: scores Show forest plot | 6 | Mean Difference (IV, Fixed, 95% CI) | Subtotals only | |
| 79.1 BSID II at < 24 months | 4 | 1153 | Mean Difference (IV, Fixed, 95% CI) | 0.23 [‐0.90, 1.36] |
| 79.2 BSID III at < 24 months | 1 | 726 | Mean Difference (IV, Fixed, 95% CI) | 0.06 [‐1.52, 1.64] |
| 79.3 BSID III fine motor score at < 24 months | 1 | 49 | Mean Difference (IV, Fixed, 95% CI) | 0.05 [‐1.20, 1.30] |
| 79.4 BSID III gross motor score at < 24 months | 1 | 49 | Mean Difference (IV, Fixed, 95% CI) | 0.05 [‐0.68, 0.78] |
| 80 Language: thresholds Show forest plot | 2 | Risk Ratio (M‐H, Fixed, 95% CI) | Subtotals only | |
| 80.1 BSID III < 85 | 1 | 726 | Risk Ratio (M‐H, Fixed, 95% CI) | 1.02 [0.74, 1.40] |
| 80.2 BSID III > 115 | 1 | 726 | Risk Ratio (M‐H, Fixed, 95% CI) | 0.82 [0.52, 1.29] |
| 80.3 Receptive language (highest quartile) | 1 | 154 | Risk Ratio (M‐H, Fixed, 95% CI) | 1.82 [1.07, 3.10] |
| 80.4 Expressive language (highest quartile) | 1 | 154 | Risk Ratio (M‐H, Fixed, 95% CI) | 1.65 [1.02, 2.68] |
| 80.5 Infant CDI: words understood (highest quartile) | 1 | 159 | Risk Ratio (M‐H, Fixed, 95% CI) | 2.42 [1.33, 4.42] |
| 80.6 Infant CDI: words produced (highest quartile) | 1 | 159 | Risk Ratio (M‐H, Fixed, 95% CI) | 2.08 [1.15, 3.74] |
| 80.7 Infant CDI: words understood (highest quartile) | 1 | 134 | Risk Ratio (M‐H, Fixed, 95% CI) | 1.97 [1.11, 3.48] |
| 80.8 Infant CDI: words produced (highest quartile) | 1 | 134 | Risk Ratio (M‐H, Fixed, 95% CI) | 1.97 [1.11, 3.48] |
| 80.9 Toddler CDI: words produced (highest quartile) | 1 | 134 | Risk Ratio (M‐H, Fixed, 95% CI) | 2.09 [1.12, 3.90] |
| 80.10 Non‐native constant contrast discrimination | 1 | 144 | Risk Ratio (M‐H, Fixed, 95% CI) | 0.97 [0.68, 1.40] |
| 81 Language: scores Show forest plot | 5 | Mean Difference (IV, Fixed, 95% CI) | Subtotals only | |
| 81.1 Receptive communication at < 24 months | 1 | 49 | Mean Difference (IV, Fixed, 95% CI) | 0.55 [‐0.77, 1.87] |
| 81.2 Receptive language (Peabody Picture Vocabulary Test IIIA) at 2 to 5 years | 1 | 70 | Mean Difference (IV, Fixed, 95% CI) | 3.90 [‐0.73, 8.53] |
| 81.3 Expressive communication at < 24 months | 1 | 49 | Mean Difference (IV, Fixed, 95% CI) | 0.21 [‐0.86, 1.28] |
| 81.4 BSID III at < 24 months | 2 | 809 | Mean Difference (IV, Fixed, 95% CI) | ‐0.84 [‐2.77, 1.09] |
| 81.5 CELF‐P2 Core Language Score at 2 to 5 years | 1 | 646 | Mean Difference (IV, Fixed, 95% CI) | ‐0.93 [‐2.92, 1.06] |
| 81.6 CELF‐P2 Core Language Score at 6 to 9 years | 1 | 543 | Mean Difference (IV, Fixed, 95% CI) | ‐0.21 [‐2.51, 2.09] |
| 81.7 Peabody Picture Vocabulary Test | 1 | 97 | Mean Difference (IV, Fixed, 95% CI) | 4.0 [‐3.11, 11.11] |
| 82 Behaviour: thresholds Show forest plot | 1 | Risk Ratio (M‐H, Fixed, 95% CI) | Subtotals only | |
| 82.1 Behaviour Rating Scale scores < 26: at < 24 months | 1 | 730 | Risk Ratio (M‐H, Fixed, 95% CI) | 5.0 [0.24, 103.79] |
| 83 Behaviour: scores Show forest plot | 6 | Mean Difference (IV, Fixed, 95% CI) | Subtotals only | |
| 83.1 NBAS habituation | 1 | 27 | Mean Difference (IV, Fixed, 95% CI) | ‐1.45 [‐8.49, 5.59] |
| 83.2 NBAS orienting | 1 | 27 | Mean Difference (IV, Fixed, 95% CI) | 3.65 [‐9.09, 16.39] |
| 83.3 NBAS motor | 1 | 27 | Mean Difference (IV, Fixed, 95% CI) | 2.99 [‐8.23, 14.21] |
| 83.4 NBAS state organisation | 1 | 27 | Mean Difference (IV, Fixed, 95% CI) | 1.63 [‐7.21, 10.47] |
| 83.5 NBAS state regulation | 1 | 27 | Mean Difference (IV, Fixed, 95% CI) | 0.51 [‐14.70, 15.72] |
| 83.6 NBAS autonomic | 1 | 27 | Mean Difference (IV, Fixed, 95% CI) | 3.30 [‐8.75, 15.35] |
| 83.7 NBAS reflexes | 1 | 27 | Mean Difference (IV, Fixed, 95% CI) | 0.68 [‐10.28, 11.64] |
| 83.8 BehavioUr Rating Scale score 12 to < 24 months | 1 | 730 | Mean Difference (IV, Fixed, 95% CI) | 0.0 [‐0.94, 0.94] |
| 83.9 Wolke: approach at < 12 months | 1 | 249 | Mean Difference (IV, Fixed, 95% CI) | ‐0.10 [‐0.42, 0.22] |
| 83.10 Wolke: activity at < 12 months | 1 | 249 | Mean Difference (IV, Fixed, 95% CI) | ‐0.10 [‐0.45, 0.25] |
| 83.11 Wolke: co‐operation at < 12 months | 1 | 249 | Mean Difference (IV, Fixed, 95% CI) | 0.0 [‐0.39, 0.39] |
| 83.12 Wolke: emotional tone at < 12 months | 1 | 249 | Mean Difference (IV, Fixed, 95% CI) | ‐0.10 [‐0.49, 0.29] |
| 83.13 Wolke: vocalisation at < 12 months | 1 | 249 | Mean Difference (IV, Fixed, 95% CI) | ‐0.10 [‐0.52, 0.32] |
| 83.14 BSID III social‐emotional score at < 24 months | 2 | 809 | Mean Difference (IV, Fixed, 95% CI) | ‐0.70 [‐3.04, 1.64] |
| 83.15 BSID III adaptive behaviour score at < 24 months | 2 | 809 | Mean Difference (IV, Fixed, 95% CI) | ‐1.20 [‐3.12, 0.72] |
| 83.16 SDQ Total Difficulties at 2 to 5 years | 1 | 646 | Mean Difference (IV, Fixed, 95% CI) | 0.62 [‐0.00, 1.24] |
| 83.17 SDQ Total Difficulties at 6 to 9 years | 1 | 543 | Mean Difference (IV, Fixed, 95% CI) | 1.08 [0.18, 1.98] |
| 83.18 BASC‐2: Behavioral Symptoms Index (%) at 5 years | 1 | 797 | Mean Difference (IV, Fixed, 95% CI) | ‐0.5 [‐4.54, 3.54] |
| 83.19 CBCL total problem behaviour at 2 ‐ 5 years | 1 | 72 | Mean Difference (IV, Fixed, 95% CI) | ‐1.0 [‐3.41, 1.41] |
| 83.20 CBCL parent report: total behaviours score at 12+ years | 1 | 48 | Mean Difference (IV, Fixed, 95% CI) | ‐0.80 [‐5.23, 3.63] |
| 83.21 CBCL parent report: total competence score at > 12 years | 1 | 48 | Mean Difference (IV, Fixed, 95% CI) | ‐0.20 [‐6.36, 5.96] |
| 84 Vision: visual acuity (cycles/degree) Show forest plot | 2 | Mean Difference (IV, Fixed, 95% CI) | Subtotals only | |
| 84.1 At 2 months | 1 | 135 | Mean Difference (IV, Fixed, 95% CI) | 0.18 [‐0.01, 0.37] |
| 84.2 At 4 months | 1 | 30 | Mean Difference (IV, Fixed, 95% CI) | 0.5 [‐0.43, 1.43] |
| 84.3 At 6 months | 1 | 26 | Mean Difference (IV, Fixed, 95% CI) | 0.5 [‐0.48, 1.48] |
| 85 Vision: VEP acuity Show forest plot | 1 | Mean Difference (IV, Fixed, 95% CI) | Subtotals only | |
| 85.1 Adjusted VEP acuity at 4 months (cpd) | 1 | 182 | Mean Difference (IV, Fixed, 95% CI) | ‐0.18 [‐0.75, 0.39] |
| 85.2 Unadjusted VEP acuity at 4 months (cpd) | 1 | 182 | Mean Difference (IV, Fixed, 95% CI) | ‐0.18 [‐0.76, 0.40] |
| 86 Vision: VEP latency Show forest plot | 3 | Mean Difference (IV, Fixed, 95% CI) | Subtotals only | |
| 86.1 Peak latency N1 at birth | 1 | 9 | Mean Difference (IV, Fixed, 95% CI) | ‐12.60 [‐29.40, 4.20] |
| 86.2 Peak latency P1 at birth | 1 | 14 | Mean Difference (IV, Fixed, 95% CI) | ‐6.80 [‐20.44, 6.84] |
| 86.3 Peak latency N2 at birth | 1 | 49 | Mean Difference (IV, Fixed, 95% CI) | 3.60 [‐12.39, 19.59] |
| 86.4 Peak latency P2 at birth | 1 | 55 | Mean Difference (IV, Fixed, 95% CI) | 0.10 [‐16.28, 16.48] |
| 86.5 Peak latency N3 at birth | 1 | 53 | Mean Difference (IV, Fixed, 95% CI) | ‐6.20 [‐36.15, 23.75] |
| 86.6 Latency N1 (ms) at 3 months | 1 | 679 | Mean Difference (IV, Fixed, 95% CI) | 0.30 [‐2.21, 2.81] |
| 86.7 Latency P1 (ms) at 3 months | 1 | 679 | Mean Difference (IV, Fixed, 95% CI) | ‐0.5 [‐3.19, 2.19] |
| 86.8 Latency N3 (ms) at 3 months | 1 | 679 | Mean Difference (IV, Fixed, 95% CI) | ‐2.30 [‐5.91, 1.31] |
| 86.9 Latency (69 min of arc) at 4 months (ms) | 1 | 182 | Mean Difference (IV, Fixed, 95% CI) | ‐1.0 [‐3.47, 1.47] |
| 86.10 Latency (48 min of arc) at 4 months (ms) | 1 | 182 | Mean Difference (IV, Fixed, 95% CI) | 0.0 [‐3.20, 3.20] |
| 86.11 Latency (20 min of arc) at 4 months (ms) | 1 | 182 | Mean Difference (IV, Fixed, 95% CI) | 0.0 [‐4.22, 4.22] |
| 86.12 Latency N1 (ms) at 6 months | 1 | 817 | Mean Difference (IV, Fixed, 95% CI) | ‐1.40 [‐3.44, 0.64] |
| 86.13 Latency P1 (ms) at 6 months | 1 | 817 | Mean Difference (IV, Fixed, 95% CI) | ‐0.80 [‐2.78, 1.18] |
| 86.14 Latency N3 (ms) at 6 months | 1 | 817 | Mean Difference (IV, Fixed, 95% CI) | ‐0.70 [‐3.45, 2.05] |
| 87 Hearing: brainstem auditory‐evoked responses Show forest plot | 1 | Mean Difference (IV, Fixed, 95% CI) | Subtotals only | |
| 87.1 Latency 1 (ms) at 1 month | 1 | 749 | Mean Difference (IV, Fixed, 95% CI) | ‐0.01 [‐0.03, 0.01] |
| 87.2 Latency 3 (ms) at 1 month | 1 | 749 | Mean Difference (IV, Fixed, 95% CI) | ‐0.01 [‐0.06, 0.04] |
| 87.3 Latency 5 (ms) at 1 month | 1 | 749 | Mean Difference (IV, Fixed, 95% CI) | ‐0.03 [‐0.09, 0.03] |
| 87.4 Interpeak latency 1‐3 (ms) at 1 month | 1 | 749 | Mean Difference (IV, Fixed, 95% CI) | ‐0.01 [‐0.06, 0.04] |
| 87.5 Interpeak latency 3‐5 (ms) at 1 month | 1 | 749 | Mean Difference (IV, Fixed, 95% CI) | 0.0 [‐0.05, 0.05] |
| 87.6 Interpeak latency 1‐5 (ms) at 1 month | 1 | 749 | Mean Difference (IV, Fixed, 95% CI) | ‐0.02 [‐0.07, 0.03] |
| 87.7 Latency 1 (ms) at 3 months | 1 | 664 | Mean Difference (IV, Fixed, 95% CI) | 0.0 [‐0.02, 0.02] |
| 87.8 Latency 3 (ms) at 3 months | 1 | 664 | Mean Difference (IV, Fixed, 95% CI) | 0.01 [‐0.04, 0.06] |
| 87.9 Latency 5 (ms) at 3 months | 1 | 664 | Mean Difference (IV, Fixed, 95% CI) | ‐0.04 [‐0.10, 0.02] |
| 87.10 Interpeak latency 1‐3 (ms) at 3 months | 1 | 664 | Mean Difference (IV, Fixed, 95% CI) | 0.01 [‐0.03, 0.05] |
| 87.11 Interpeak latency 3‐5 (ms) at 3 months | 1 | 664 | Mean Difference (IV, Fixed, 95% CI) | ‐0.03 [‐0.08, 0.02] |
| 87.12 Interpeak latency 1‐5 (ms) at 3 months | 1 | 664 | Mean Difference (IV, Fixed, 95% CI) | ‐0.03 [‐0.09, 0.03] |
| 88 Neurodevelopment: thresholds Show forest plot | 3 | Risk Ratio (M‐H, Fixed, 95% CI) | Subtotals only | |
| 88.1 Hempel: simple minor neurological dysfunction at 18 months | 1 | 114 | Risk Ratio (M‐H, Fixed, 95% CI) | 1.11 [0.80, 1.53] |
| 88.2 Hempel: simple and complex minor neurological dysfunction at 4 years | 1 | 167 | Risk Ratio (M‐H, Fixed, 95% CI) | 1.09 [0.37, 3.23] |
| 88.3 Hempel: complex minor neurological dysfunction at 18 months | 1 | 114 | Risk Ratio (M‐H, Fixed, 95% CI) | 0.68 [0.24, 1.93] |
| 88.4 ASQ total at 6 months (subnormal ‐ below 2 SD less than mean scores) | 1 | 146 | Risk Ratio (M‐H, Fixed, 95% CI) | 0.54 [0.17, 1.77] |
| 88.5 Touwen: simple and complex minor neurological dysfunction at 5.5 years | 1 | 148 | Risk Ratio (M‐H, Fixed, 95% CI) | 1.00 [0.61, 1.63] |
| 88.6 Neonatal neurological classification: mildly/definitely abnormal at 2 weeks | 1 | 119 | Risk Ratio (M‐H, Fixed, 95% CI) | 0.87 [0.38, 1.97] |
| 88.7 General movements: mildly/definitely abnormal at 2 weeks | 1 | 119 | Risk Ratio (M‐H, Fixed, 95% CI) | 1.27 [0.75, 2.14] |
| 88.8 General movements: mildly/definitely abnormal at 12 weeks | 1 | 119 | Risk Ratio (M‐H, Fixed, 95% CI) | 1.54 [0.89, 2.65] |
| 89 Neurodevelopment: scores Show forest plot | 1 | Mean Difference (IV, Fixed, 95% CI) | Subtotals only | |
| 89.1 ASQ gross motor at 4 months | 1 | 148 | Mean Difference (IV, Fixed, 95% CI) | 0.30 [‐2.38, 2.98] |
| 89.2 ASQ gross motor at 6 months | 1 | 146 | Mean Difference (IV, Fixed, 95% CI) | 1.20 [‐2.31, 4.71] |
| 89.3 ASQ fine motor at 4 months | 1 | 148 | Mean Difference (IV, Fixed, 95% CI) | 1.10 [‐2.03, 4.23] |
| 89.4 ASQ fine motor at 6 months | 1 | 146 | Mean Difference (IV, Fixed, 95% CI) | 1.20 [‐1.59, 3.99] |
| 89.5 ASQ problem solving at 4 months | 1 | 148 | Mean Difference (IV, Fixed, 95% CI) | 1.60 [‐0.99, 4.19] |
| 89.6 ASQ problem solving at 6 months | 1 | 146 | Mean Difference (IV, Fixed, 95% CI) | 0.5 [‐1.95, 2.95] |
| 89.7 ASQ personal‐social at 4 months | 1 | 148 | Mean Difference (IV, Fixed, 95% CI) | 1.10 [‐1.64, 3.84] |
| 89.8 ASQ personal‐social at 6 months | 1 | 146 | Mean Difference (IV, Fixed, 95% CI) | 0.80 [‐2.61, 4.21] |
| 89.9 ASQ communication at 4 months | 1 | 148 | Mean Difference (IV, Fixed, 95% CI) | 2.70 [0.41, 4.99] |
| 89.10 ASQ communication at 6 months | 1 | 146 | Mean Difference (IV, Fixed, 95% CI) | 0.40 [‐1.55, 2.35] |
| 90 Child Development Inventory Show forest plot | 1 | Risk Ratio (M‐H, Fixed, 95% CI) | Subtotals only | |
| 90.1 Social | 1 | 130 | Risk Ratio (M‐H, Fixed, 95% CI) | 0.0 [0.0, 0.0] |
| 90.2 Self help | 1 | 130 | Risk Ratio (M‐H, Fixed, 95% CI) | 0.29 [0.01, 6.90] |
| 90.3 Gross motor | 1 | 130 | Risk Ratio (M‐H, Fixed, 95% CI) | 4.30 [0.21, 87.76] |
| 90.4 Fine motor | 1 | 130 | Risk Ratio (M‐H, Fixed, 95% CI) | 4.30 [0.21, 87.76] |
| 90.5 Expressive language | 1 | 130 | Risk Ratio (M‐H, Fixed, 95% CI) | 0.86 [0.05, 13.41] |
| 90.6 Language comprehension | 1 | 130 | Risk Ratio (M‐H, Fixed, 95% CI) | 0.0 [0.0, 0.0] |
| 90.7 Letters | 1 | 130 | Risk Ratio (M‐H, Fixed, 95% CI) | 0.17 [0.01, 3.51] |
| 90.8 Numbers | 1 | 130 | Risk Ratio (M‐H, Fixed, 95% CI) | 0.86 [0.05, 13.41] |
| 90.9 General development | 1 | 130 | Risk Ratio (M‐H, Fixed, 95% CI) | 0.51 [0.13, 2.06] |
| 91 Infant sleep behaviour (%) Show forest plot | 1 | Mean Difference (IV, Fixed, 95% CI) | Subtotals only | |
| 91.1 Arousals in quiet sleep: day 1 | 1 | 46 | Mean Difference (IV, Fixed, 95% CI) | ‐3.19 [‐6.07, ‐0.31] |
| 91.2 Arousals in quiet sleep: day 2 | 1 | 39 | Mean Difference (IV, Fixed, 95% CI) | ‐1.89 [‐4.49, 0.71] |
| 91.3 Quiet sleep: day 1 | 1 | 46 | Mean Difference (IV, Fixed, 95% CI) | 0.74 [‐1.97, 3.45] |
| 91.4 Quiet sleep: day 2 | 1 | 39 | Mean Difference (IV, Fixed, 95% CI) | ‐1.0 [‐4.36, 2.36] |
| 91.5 Active sleep: day 1 | 1 | 46 | Mean Difference (IV, Fixed, 95% CI) | ‐2.42 [‐8.51, 3.67] |
| 91.6 Active sleep: day 2 | 1 | 39 | Mean Difference (IV, Fixed, 95% CI) | ‐0.13 [‐8.23, 7.97] |
| 91.7 Arousals in active sleep: day 1 | 1 | 46 | Mean Difference (IV, Fixed, 95% CI) | ‐3.0 [‐5.66, ‐0.34] |
| 91.8 Arousals in active sleep: day 2 | 1 | 46 | Mean Difference (IV, Fixed, 95% CI) | ‐0.63 [‐4.12, 2.86] |
| 92 Cerebral palsy Show forest plot | 1 | 114 | Risk Ratio (M‐H, Fixed, 95% CI) | 0.0 [0.0, 0.0] |
| Outcome or subgroup title | No. of studies | No. of participants | Statistical method | Effect size |
| 1 Preterm birth (< 37 weeks) Show forest plot | 27 | 10304 | Risk Ratio (M‐H, Fixed, 95% CI) | 0.88 [0.81, 0.97] |
| 1.1 Omega‐3 supplements only | 18 | 7608 | Risk Ratio (M‐H, Fixed, 95% CI) | 0.90 [0.80, 1.01] |
| 1.2 Omega‐3 supplements/enrichment + food/diet advice | 3 | 516 | Risk Ratio (M‐H, Fixed, 95% CI) | 0.73 [0.41, 1.29] |
| 1.3 Omega‐3 food/diet advice | 1 | 48 | Risk Ratio (M‐H, Fixed, 95% CI) | 0.11 [0.01, 2.22] |
| 1.4 Omega‐3 supplements + other agents | 6 | 2132 | Risk Ratio (M‐H, Fixed, 95% CI) | 0.89 [0.76, 1.04] |
| 2 Early preterm birth (< 34 weeks) Show forest plot | 9 | 5204 | Risk Ratio (M‐H, Fixed, 95% CI) | 0.58 [0.44, 0.77] |
| 2.1 Omega‐3 supplements only | 8 | 4234 | Risk Ratio (M‐H, Fixed, 95% CI) | 0.62 [0.46, 0.82] |
| 2.2 Omega‐3 supplements + other agents | 1 | 970 | Risk Ratio (M‐H, Fixed, 95% CI) | 0.19 [0.04, 0.88] |
| 3 Prolonged gestation (> 42 weeks) Show forest plot | 6 | 5141 | Risk Ratio (M‐H, Fixed, 95% CI) | 1.61 [1.11, 2.33] |
| 3.1 Omega‐3 supplements only | 5 | 4953 | Risk Ratio (M‐H, Fixed, 95% CI) | 1.59 [1.09, 2.31] |
| 3.2 Omega‐3 supplements + food/diet advice | 1 | 188 | Risk Ratio (M‐H, Fixed, 95% CI) | 3.13 [0.13, 75.84] |
| 4 Maternal death Show forest plot | 4 | 4830 | Risk Ratio (M‐H, Fixed, 95% CI) | 1.69 [0.07, 39.30] |
| 4.1 Omega‐3 supplements only | 3 | 4782 | Risk Ratio (M‐H, Fixed, 95% CI) | 0.0 [0.0, 0.0] |
| 4.2 Omega‐3 food/diet advice | 1 | 48 | Risk Ratio (M‐H, Fixed, 95% CI) | 1.69 [0.07, 39.30] |
| 5 Pre‐eclampsia (hypertension with proteinuria) Show forest plot | 21 | 8306 | Risk Ratio (M‐H, Fixed, 95% CI) | 0.84 [0.69, 1.01] |
| 5.1 Omega‐3 supplements only | 13 | 5825 | Risk Ratio (M‐H, Fixed, 95% CI) | 0.95 [0.76, 1.19] |
| 5.2 Omega‐3 supplements/enrichment + food/dietary advice | 2 | 328 | Risk Ratio (M‐H, Fixed, 95% CI) | 0.65 [0.25, 1.69] |
| 5.3 Omega‐3 supplements + other agents | 6 | 2153 | Risk Ratio (M‐H, Fixed, 95% CI) | 0.58 [0.39, 0.88] |
| 6 High blood pressure (without proteinuria) Show forest plot | 7 | 4531 | Risk Ratio (M‐H, Fixed, 95% CI) | 1.03 [0.89, 1.20] |
| 6.1 Omega‐3 supplements only | 6 | 4431 | Risk Ratio (M‐H, Fixed, 95% CI) | 1.05 [0.90, 1.22] |
| 6.2 Omega‐3 supplements + other agents | 1 | 100 | Risk Ratio (M‐H, Fixed, 95% CI) | 0.69 [0.33, 1.47] |
| 7 Eclampsia Show forest plot | 1 | 100 | Risk Ratio (M‐H, Fixed, 95% CI) | 0.14 [0.01, 2.70] |
| 7.1 Omega‐3 supplements + other agents | 1 | 100 | Risk Ratio (M‐H, Fixed, 95% CI) | 0.14 [0.01, 2.70] |
| 8 Maternal antepartum hospitalisation Show forest plot | 5 | 2876 | Risk Ratio (M‐H, Fixed, 95% CI) | 0.92 [0.81, 1.04] |
| 8.1 Omega‐3 supplements only | 4 | 2817 | Risk Ratio (M‐H, Fixed, 95% CI) | 0.92 [0.82, 1.04] |
| 8.2 Omega‐3 supplementation + other agents | 1 | 59 | Risk Ratio (M‐H, Fixed, 95% CI) | 0.21 [0.01, 4.13] |
| 9 Mother's length of stay in hospital (days) Show forest plot | 2 | 2290 | Mean Difference (IV, Fixed, 95% CI) | 0.18 [‐0.20, 0.57] |
| 9.1 Omega‐3 supplements only | 2 | 2290 | Mean Difference (IV, Fixed, 95% CI) | 0.18 [‐0.20, 0.57] |
| 10 Maternal anaemia Show forest plot | 1 | 846 | Risk Ratio (M‐H, Fixed, 95% CI) | 1.16 [0.91, 1.48] |
| 10.1 Omega‐3 supplements only | 1 | 846 | Risk Ratio (M‐H, Fixed, 95% CI) | 1.16 [0.91, 1.48] |
| 11 Miscarriage (< 24 weeks) Show forest plot | 9 | 4190 | Risk Ratio (M‐H, Fixed, 95% CI) | 1.07 [0.80, 1.43] |
| 11.1 Omega‐3 supplements only | 8 | 3049 | Risk Ratio (M‐H, Fixed, 95% CI) | 0.95 [0.56, 1.60] |
| 11.2 Omega‐3 supplements + other agents | 1 | 1141 | Risk Ratio (M‐H, Fixed, 95% CI) | 1.14 [0.80, 1.61] |
| 12 Antepartum vaginal bleeding Show forest plot | 2 | 2151 | Risk Ratio (M‐H, Fixed, 95% CI) | 1.01 [0.69, 1.48] |
| 12.1 Omega‐3 supplements only | 2 | 2151 | Risk Ratio (M‐H, Fixed, 95% CI) | 1.01 [0.69, 1.48] |
| 13 Preterm prelabour rupture of membranes Show forest plot | 3 | 925 | Risk Ratio (M‐H, Fixed, 95% CI) | 0.53 [0.25, 1.10] |
| 13.1 Omega‐3 supplements only | 2 | 670 | Risk Ratio (M‐H, Fixed, 95% CI) | 0.61 [0.28, 1.34] |
| 13.2 Omega‐3 supplementation/enrichment + food/diet advice | 1 | 255 | Risk Ratio (M‐H, Fixed, 95% CI) | 0.24 [0.03, 2.15] |
| 14 Prelabour rupture of membranes Show forest plot | 3 | 915 | Risk Ratio (M‐H, Fixed, 95% CI) | 0.41 [0.21, 0.82] |
| 14.1 Omega‐3 supplements only | 1 | 369 | Risk Ratio (M‐H, Fixed, 95% CI) | 0.54 [0.14, 2.11] |
| 14.2 Omega‐3 supplementation/enrichment + food/diet advice | 2 | 546 | Risk Ratio (M‐H, Fixed, 95% CI) | 0.38 [0.17, 0.85] |
| 15 Maternal admission to intensive care Show forest plot | 2 | 2458 | Risk Ratio (M‐H, Fixed, 95% CI) | 0.56 [0.12, 2.63] |
| 15.1 Omega‐3 supplements only | 1 | 2399 | Risk Ratio (M‐H, Fixed, 95% CI) | 1.00 [0.14, 7.12] |
| 15.2 Omega‐3 supplements + other agent | 1 | 59 | Risk Ratio (M‐H, Fixed, 95% CI) | 0.21 [0.01, 4.13] |
| 16 Maternal severe adverse effects (including cessation) Show forest plot | 8 | 4177 | Risk Ratio (M‐H, Fixed, 95% CI) | 1.02 [0.59, 1.75] |
| 16.1 Omega‐3 supplements only | 7 | 3886 | Risk Ratio (M‐H, Fixed, 95% CI) | 1.01 [0.54, 1.87] |
| 16.2 Omega‐3 supplementation/enrichment + food/diet advice | 1 | 291 | Risk Ratio (M‐H, Fixed, 95% CI) | 1.05 [0.35, 3.18] |
| 17 Caesarean section Show forest plot | 29 | 8481 | Risk Ratio (M‐H, Fixed, 95% CI) | 0.97 [0.91, 1.03] |
| 17.1 Omega‐3 supplements only | 19 | 6537 | Risk Ratio (M‐H, Fixed, 95% CI) | 0.98 [0.92, 1.06] |
| 17.2 Omega‐3 supplements/enrichment +food/diet advice | 4 | 574 | Risk Ratio (M‐H, Fixed, 95% CI) | 0.87 [0.63, 1.19] |
| 17.3 Omega‐3 food/diet advice | 1 | 107 | Risk Ratio (M‐H, Fixed, 95% CI) | 0.91 [0.38, 2.17] |
| 17.4 Omega‐3 supplements + other agents | 5 | 1263 | Risk Ratio (M‐H, Fixed, 95% CI) | 0.88 [0.72, 1.08] |
| 18 Induction (post‐term) Show forest plot | 3 | 2900 | Risk Ratio (M‐H, Random, 95% CI) | 0.82 [0.22, 2.98] |
| 18.1 Omega‐3 supplements only | 2 | 2712 | Risk Ratio (M‐H, Random, 95% CI) | 0.82 [0.22, 2.98] |
| 18.2 Omega‐3 supplements + food/diet advice | 1 | 188 | Risk Ratio (M‐H, Random, 95% CI) | 0.0 [0.0, 0.0] |
| 19 Blood loss at birth (mL) Show forest plot | 6 | 2776 | Mean Difference (IV, Fixed, 95% CI) | 11.50 [‐6.75, 29.76] |
| 19.1 Omega‐3 supplements only | 5 | 2588 | Mean Difference (IV, Fixed, 95% CI) | 11.64 [‐8.89, 32.17] |
| 19.2 Omega‐3 supplements + food/diet advice | 1 | 188 | Mean Difference (IV, Fixed, 95% CI) | 11.0 [‐28.91, 50.91] |
| 20 Postpartum haemorrhage Show forest plot | 4 | 4085 | Risk Ratio (M‐H, Fixed, 95% CI) | 1.03 [0.82, 1.30] |
| 20.1 Omega‐3 supplements only | 3 | 3233 | Risk Ratio (M‐H, Fixed, 95% CI) | 0.97 [0.71, 1.34] |
| 20.2 Omega‐3 supplements + other agent | 1 | 852 | Risk Ratio (M‐H, Fixed, 95% CI) | 1.11 [0.79, 1.57] |
| 21 Gestational diabetes Show forest plot | 12 | 5235 | Risk Ratio (M‐H, Fixed, 95% CI) | 1.02 [0.83, 1.26] |
| 21.1 Omega‐3 supplements only | 7 | 3726 | Risk Ratio (M‐H, Fixed, 95% CI) | 1.02 [0.80, 1.30] |
| 21.2 Omega‐3 supplements/enrichment + food/diet advice | 4 | 595 | Risk Ratio (M‐H, Fixed, 95% CI) | 0.66 [0.33, 1.34] |
| 21.3 Omega‐3 supplements + other agents | 2 | 914 | Risk Ratio (M‐H, Fixed, 95% CI) | 1.34 [0.80, 2.24] |
| 22 Maternal insulin resistance (HOMA‐IR) Show forest plot | 3 | 176 | Mean Difference (IV, Random, 95% CI) | ‐0.85 [‐2.50, 0.80] |
| 22.1 Omega‐3 supplements only | 2 | 116 | Mean Difference (IV, Random, 95% CI) | ‐0.25 [‐1.94, 1.44] |
| 22.2 Omega‐3 supplements + other agents | 1 | 60 | Mean Difference (IV, Random, 95% CI) | ‐2.0 [‐3.10, ‐0.90] |
| 23 Excessive gestational weight gain Show forest plot | 1 | 350 | Risk Ratio (M‐H, Fixed, 95% CI) | 1.21 [0.95, 1.55] |
| 23.1 Omega‐3 supplements only | 1 | 350 | Risk Ratio (M‐H, Fixed, 95% CI) | 1.21 [0.95, 1.55] |
| 24 Gestational weight gain (kg) Show forest plot | 11 | 2297 | Mean Difference (IV, Random, 95% CI) | ‐0.05 [‐0.68, 0.59] |
| 24.1 Omega‐3 supplements only | 6 | 955 | Mean Difference (IV, Random, 95% CI) | ‐0.22 [‐1.47, 1.03] |
| 24.2 Omega‐3 supplements/enrichment + food/diet advice | 3 | 313 | Mean Difference (IV, Random, 95% CI) | ‐0.11 [‐0.99, 0.78] |
| 24.3 Omega‐3 supplements + other agents | 2 | 1029 | Mean Difference (IV, Random, 95% CI) | 0.43 [‐0.08, 0.95] |
| 25 Depression during pregnancy: scores Show forest plot | 5 | Mean Difference (IV, Fixed, 95% CI) | Subtotals only | |
| 25.1 Omega‐3 supplements only: BDI | 2 | 104 | Mean Difference (IV, Fixed, 95% CI) | ‐5.86 [‐8.32, ‐3.39] |
| 25.2 Omega‐3 supplements only: HAMD | 3 | 71 | Mean Difference (IV, Fixed, 95% CI) | ‐1.08 [‐3.35, 1.19] |
| 25.3 Omega‐3 supplements only: EPDS | 4 | 122 | Mean Difference (IV, Fixed, 95% CI) | ‐0.15 [‐2.09, 1.79] |
| 25.4 Omega‐3 supplements only: MADRS | 1 | 26 | Mean Difference (IV, Fixed, 95% CI) | ‐1.60 [‐7.80, 4.60] |
| 26 Depression during pregnancy: thresholds Show forest plot | 3 | Risk Ratio (M‐H, Fixed, 95% CI) | Subtotals only | |
| 26.1 Omega‐3 supplements only: HAMD 50% reduction (after 8 weeks) | 1 | 24 | Risk Ratio (M‐H, Fixed, 95% CI) | 2.26 [0.78, 6.49] |
| 26.2 Omega‐3 supplements only: HAMD ≤ 7 | 1 | 24 | Risk Ratio (M‐H, Fixed, 95% CI) | 2.12 [0.51, 8.84] |
| 26.3 Omega‐3 supplements only: unspecified | 1 | 301 | Risk Ratio (M‐H, Fixed, 95% CI) | 2.39 [0.47, 12.11] |
| 26.4 Omega‐3 supplements only: EPDS ≥ 11 | 1 | 34 | Risk Ratio (M‐H, Fixed, 95% CI) | 1.4 [0.55, 3.55] |
| 27 Depressive symptoms postpartum: thresholds Show forest plot | 4 | Risk Ratio (M‐H, Fixed, 95% CI) | Subtotals only | |
| 27.1 Omega‐3 supplements only: PDSS ≥80 | 1 | 42 | Risk Ratio (M‐H, Fixed, 95% CI) | 0.37 [0.04, 3.25] |
| 27.2 Omega‐3 supplements only: EPDS | 2 | 2431 | Risk Ratio (M‐H, Fixed, 95% CI) | 0.89 [0.71, 1.12] |
| 27.3 Omega‐3 supplements only: major depressive disorder | 1 | 118 | Risk Ratio (M‐H, Fixed, 95% CI) | 1.33 [0.27, 6.56] |
| 28 Depressive symptoms postpartum: scores Show forest plot | 2 | Mean Difference (IV, Fixed, 95% CI) | Subtotals only | |
| 28.1 Omega‐3 supplements only: BD: 6‐8 weeks postpartum | 1 | 118 | Mean Difference (IV, Fixed, 95% CI) | 0.25 [‐1.93, 2.43] |
| 28.2 Omega‐3 supplements only: PDSS total (LS over 6 months) | 1 | 42 | Mean Difference (IV, Fixed, 95% CI) | ‐6.08 [‐12.42, 0.26] |
| 29 Length of gestation (days) Show forest plot | 43 | 12517 | Mean Difference (IV, Random, 95% CI) | 1.65 [0.94, 2.37] |
| 29.1 Omega‐3 supplements only | 29 | 9290 | Mean Difference (IV, Random, 95% CI) | 1.67 [0.76, 2.59] |
| 29.2 Omega‐3 supplements/enrichment + food/diet advice | 6 | 680 | Mean Difference (IV, Random, 95% CI) | 2.45 [‐0.14, 5.04] |
| 29.3 Omega‐3 food/diet advice | 1 | 107 | Mean Difference (IV, Random, 95% CI) | 5.00 [0.64, 9.36] |
| 29.4 Omega‐3 supplements + other agents | 8 | 2440 | Mean Difference (IV, Random, 95% CI) | 1.04 [0.05, 2.03] |
| 30 Perinatal death Show forest plot | 10 | 7416 | Risk Ratio (M‐H, Fixed, 95% CI) | 0.75 [0.54, 1.03] |
| 30.1 Omega‐3 supplements only | 8 | 6496 | Risk Ratio (M‐H, Fixed, 95% CI) | 0.71 [0.48, 1.03] |
| 30.2 Omega‐3 supplements + other agents | 2 | 920 | Risk Ratio (M‐H, Fixed, 95% CI) | 0.87 [0.47, 1.62] |
| 31 Stillbirth Show forest plot | 16 | 7880 | Risk Ratio (M‐H, Fixed, 95% CI) | 0.94 [0.62, 1.42] |
| 31.1 Omega‐3 supplements only | 13 | 7693 | Risk Ratio (M‐H, Fixed, 95% CI) | 0.92 [0.60, 1.42] |
| 31.2 Omega‐3 supplements + food/diet advice | 1 | 79 | Risk Ratio (M‐H, Fixed, 95% CI) | 0.33 [0.01, 7.75] |
| 31.3 Omega‐3 food/diet advice | 1 | 48 | Risk Ratio (M‐H, Fixed, 95% CI) | 1.69 [0.07, 39.30] |
| 31.4 Omega‐3 supplements + other agents | 1 | 60 | Risk Ratio (M‐H, Fixed, 95% CI) | 3.0 [0.13, 70.83] |
| 32 Neonatal death Show forest plot | 9 | 7448 | Risk Ratio (M‐H, Fixed, 95% CI) | 0.61 [0.34, 1.11] |
| 32.1 Omega‐3 supplements only | 9 | 7448 | Risk Ratio (M‐H, Fixed, 95% CI) | 0.61 [0.34, 1.11] |
| 33 Infant death Show forest plot | 4 | 3239 | Risk Ratio (M‐H, Fixed, 95% CI) | 0.74 [0.25, 2.19] |
| 33.1 Omega‐3 supplements only | 4 | 3239 | Risk Ratio (M‐H, Fixed, 95% CI) | 0.74 [0.25, 2.19] |
| 34 Large‐for‐gestational age Show forest plot | 5 | 3602 | Risk Ratio (M‐H, Fixed, 95% CI) | 1.20 [1.01, 1.43] |
| 34.1 Omega‐3 supplements only | 2 | 2518 | Risk Ratio (M‐H, Fixed, 95% CI) | 1.19 [0.99, 1.43] |
| 34.2 Omega‐3 supplements + food/diet advice | 1 | 188 | Risk Ratio (M‐H, Fixed, 95% CI) | 1.23 [0.48, 3.17] |
| 34.3 Omega‐3 supplements + other agent | 2 | 896 | Risk Ratio (M‐H, Fixed, 95% CI) | 1.28 [0.72, 2.29] |
| 35 Macrosomia Show forest plot | 7 | 2008 | Risk Ratio (M‐H, Fixed, 95% CI) | 0.69 [0.43, 1.13] |
| 35.1 Omega‐3 supplements only | 5 | 1904 | Risk Ratio (M‐H, Fixed, 95% CI) | 0.80 [0.47, 1.36] |
| 35.2 Omega‐3 supplements + other agent | 2 | 104 | Risk Ratio (M‐H, Fixed, 95% CI) | 0.31 [0.08, 1.23] |
| 36 Low birthweight (< 2500 g) Show forest plot | 15 | 8449 | Risk Ratio (M‐H, Fixed, 95% CI) | 0.90 [0.82, 0.99] |
| 36.1 Omega‐3 supplements only | 10 | 6214 | Risk Ratio (M‐H, Fixed, 95% CI) | 0.96 [0.86, 1.07] |
| 36.2 Omega‐3 supplements/enrichment + food/diet advice | 2 | 328 | Risk Ratio (M‐H, Fixed, 95% CI) | 0.66 [0.34, 1.26] |
| 36.3 Omega‐3 supplements + other agents | 3 | 1907 | Risk Ratio (M‐H, Fixed, 95% CI) | 0.77 [0.62, 0.95] |
| 37 Small‐for‐gestational age/IUGR Show forest plot | 8 | 6907 | Risk Ratio (M‐H, Fixed, 95% CI) | 1.01 [0.90, 1.13] |
| 37.1 Omega‐3 supplements only | 5 | 5041 | Risk Ratio (M‐H, Fixed, 95% CI) | 1.05 [0.93, 1.20] |
| 37.2 Omega‐3 supplements + other agents | 3 | 1866 | Risk Ratio (M‐H, Fixed, 95% CI) | 0.80 [0.59, 1.09] |
| 38 Birthweight (g) Show forest plot | 44 | 11584 | Mean Difference (IV, Random, 95% CI) | 75.74 [38.05, 113.43] |
| 38.1 Omega‐3 supplements only | 31 | 8522 | Mean Difference (IV, Random, 95% CI) | 59.41 [23.23, 95.59] |
| 38.2 Omega‐3 supplements/enrichment + food/diet advice | 6 | 859 | Mean Difference (IV, Random, 95% CI) | 129.42 [49.52, 209.31] |
| 38.3 Omega‐3 food/diet advice | 1 | 107 | Mean Difference (IV, Random, 95% CI) | ‐17.0 [‐190.97, 156.97] |
| 38.4 Omega‐3 supplements + other agents | 6 | 2096 | Mean Difference (IV, Random, 95% CI) | 69.14 [‐72.81, 211.10] |
| 39 Birthweight Z score Show forest plot | 4 | 2792 | Mean Difference (IV, Fixed, 95% CI) | 0.06 [‐0.02, 0.13] |
| 39.1 Omega‐3 supplements only | 3 | 2677 | Mean Difference (IV, Fixed, 95% CI) | 0.06 [‐0.01, 0.14] |
| 39.2 Omega‐3 supplements + other agent | 1 | 115 | Mean Difference (IV, Fixed, 95% CI) | 0.00 [‐0.21, 0.21] |
| 40 Birth length (cm) Show forest plot | 29 | 8008 | Mean Difference (IV, Random, 95% CI) | 0.13 [‐0.08, 0.34] |
| 40.1 Omega‐3 supplements only | 20 | 6010 | Mean Difference (IV, Random, 95% CI) | 0.21 [‐0.03, 0.45] |
| 40.2 Omega‐3 supplements/enrichment + food/diet advice | 4 | 606 | Mean Difference (IV, Random, 95% CI) | 0.42 [‐0.01, 0.85] |
| 40.3 Omega‐3 food/diet advice | 1 | 123 | Mean Difference (IV, Random, 95% CI) | ‐0.10 [‐0.56, 0.36] |
| 40.4 Omega‐3 supplements + other agent | 4 | 1269 | Mean Difference (IV, Random, 95% CI) | ‐0.51 [‐0.78, ‐0.23] |
| 41 Length at birth Z score Show forest plot | 2 | 2462 | Mean Difference (IV, Random, 95% CI) | 0.18 [‐0.18, 0.54] |
| 41.1 Omega‐3 supplements only | 2 | 2462 | Mean Difference (IV, Random, 95% CI) | 0.18 [‐0.18, 0.54] |
| 42 Head circumference at birth (cm) Show forest plot | 23 | 7041 | Mean Difference (IV, Fixed, 95% CI) | 0.10 [0.01, 0.18] |
| 42.1 Omega‐3 supplements only | 16 | 5442 | Mean Difference (IV, Fixed, 95% CI) | 0.07 [‐0.03, 0.17] |
| 42.2 Omega‐3 supplements/enrichment + food/diet advice | 3 | 418 | Mean Difference (IV, Fixed, 95% CI) | 0.34 [0.03, 0.65] |
| 42.3 Omega‐3 food/diet advice only | 1 | 107 | Mean Difference (IV, Fixed, 95% CI) | ‐0.20 [‐0.75, 0.35] |
| 42.4 Omega‐3 supplements + other agent | 3 | 1074 | Mean Difference (IV, Fixed, 95% CI) | 0.15 [‐0.06, 0.35] |
| 43 Head circumference at birth Z score Show forest plot | 2 | 2462 | Mean Difference (IV, Fixed, 95% CI) | ‐0.03 [‐0.14, 0.07] |
| 43.1 Omega‐3 supplementation only | 2 | 2462 | Mean Difference (IV, Fixed, 95% CI) | ‐0.03 [‐0.14, 0.07] |
| 44 Baby admitted to neonatal care Show forest plot | 9 | 6920 | Risk Ratio (M‐H, Fixed, 95% CI) | 0.92 [0.83, 1.03] |
| 44.1 Omega‐3 supplements only | 5 | 5692 | Risk Ratio (M‐H, Fixed, 95% CI) | 0.90 [0.79, 1.02] |
| 44.2 Omega‐3 supplements/enrichment + food/diet advice | 2 | 328 | Risk Ratio (M‐H, Fixed, 95% CI) | 0.89 [0.54, 1.50] |
| 44.3 Omega‐3 supplements + other agents | 2 | 900 | Risk Ratio (M‐H, Fixed, 95% CI) | 1.01 [0.81, 1.26] |
| 45 Infant length of stay in hospital (days) Show forest plot | 1 | 2041 | Mean Difference (IV, Fixed, 95% CI) | 0.11 [‐1.40, 1.62] |
| 45.1 Omega‐3 supplementation only | 1 | 2041 | Mean Difference (IV, Fixed, 95% CI) | 0.11 [‐1.40, 1.62] |
| 46 Congenital anomalies Show forest plot | 3 | 1807 | Risk Ratio (M‐H, Fixed, 95% CI) | 1.08 [0.61, 1.92] |
| 46.1 Omega‐3 supplements only | 3 | 1807 | Risk Ratio (M‐H, Fixed, 95% CI) | 1.08 [0.61, 1.92] |
| 47 Retinopathy of prematurity Show forest plot | 1 | 837 | Risk Ratio (M‐H, Fixed, 95% CI) | 1.20 [0.32, 4.44] |
| 47.1 Omega‐3 supplementation + other agent only | 1 | 837 | Risk Ratio (M‐H, Fixed, 95% CI) | 1.20 [0.32, 4.44] |
| 48 Bronchopulmonary dysplasia Show forest plot | 2 | 3191 | Risk Ratio (M‐H, Fixed, 95% CI) | 1.06 [0.45, 2.48] |
| 48.1 Omega‐3 supplementation only | 1 | 2363 | Risk Ratio (M‐H, Fixed, 95% CI) | 0.50 [0.09, 2.71] |
| 48.2 Omega‐3 supplementation + other agent | 1 | 828 | Risk Ratio (M‐H, Fixed, 95% CI) | 1.42 [0.51, 3.96] |
| 49 Respiratory distress syndrome Show forest plot | 2 | 1129 | Risk Ratio (M‐H, Random, 95% CI) | 1.17 [0.54, 2.52] |
| 49.1 Omega‐3 supplementation only | 1 | 301 | Risk Ratio (M‐H, Random, 95% CI) | 0.72 [0.31, 1.65] |
| 49.2 Omega‐3 supplementation + other agent | 1 | 828 | Risk Ratio (M‐H, Random, 95% CI) | 1.60 [1.08, 2.37] |
| 50 Necrotising enterocolitis (NEC) Show forest plot | 2 | 3198 | Risk Ratio (M‐H, Fixed, 95% CI) | 0.97 [0.26, 3.55] |
| 50.1 Omega‐3 supplementation only | 1 | 2361 | Risk Ratio (M‐H, Fixed, 95% CI) | 2.98 [0.12, 73.13] |
| 50.2 Omega‐3 supplementation + other agent | 1 | 837 | Risk Ratio (M‐H, Fixed, 95% CI) | 0.72 [0.16, 3.20] |
| 51 Neonatal sepsis (proven) Show forest plot | 3 | 3788 | Risk Ratio (M‐H, Fixed, 95% CI) | 0.97 [0.44, 2.14] |
| 51.1 Omega‐3 supplements only | 3 | 3788 | Risk Ratio (M‐H, Fixed, 95% CI) | 0.97 [0.44, 2.14] |
| 52 Convulsion Show forest plot | 1 | 2361 | Risk Ratio (M‐H, Fixed, 95% CI) | 0.09 [0.01, 1.63] |
| 52.1 Omega‐3 supplementation only | 1 | 2361 | Risk Ratio (M‐H, Fixed, 95% CI) | 0.09 [0.01, 1.63] |
| 53 Intraventricular haemorrhage Show forest plot | 3 | 5423 | Risk Ratio (M‐H, Random, 95% CI) | 1.00 [0.29, 3.49] |
| 53.1 Omega‐3 supplements only | 2 | 4586 | Risk Ratio (M‐H, Random, 95% CI) | 0.59 [0.02, 16.16] |
| 53.2 Omega‐3 supplementation + other agent | 1 | 837 | Risk Ratio (M‐H, Random, 95% CI) | 1.07 [0.44, 2.60] |
| 54 Neonatal/infant serious adverse events Show forest plot | 2 | 2690 | Risk Ratio (M‐H, Fixed, 95% CI) | 0.72 [0.53, 0.99] |
| 54.1 Omega‐3 supplementation | 1 | 2399 | Risk Ratio (M‐H, Fixed, 95% CI) | 0.67 [0.44, 1.01] |
| 54.2 Omega‐3 supplements/enrichment + food/diet advice | 1 | 291 | Risk Ratio (M‐H, Fixed, 95% CI) | 0.81 [0.50, 1.31] |
| 55 Neonatal/infant morbidity: cardiovascular Show forest plot | 1 | 291 | Risk Ratio (M‐H, Fixed, 95% CI) | 1.20 [0.85, 1.69] |
| 55.1 Omega‐3 supplements/enrichment + food/diet advice | 1 | 291 | Risk Ratio (M‐H, Fixed, 95% CI) | 1.20 [0.85, 1.69] |
| 56 Neonatal/infant morbidity: respiratory Show forest plot | 1 | 291 | Risk Ratio (M‐H, Fixed, 95% CI) | 1.02 [0.66, 1.57] |
| 56.1 Omega‐3 supplements/enrichment + food/diet advice | 1 | 291 | Risk Ratio (M‐H, Fixed, 95% CI) | 1.02 [0.66, 1.57] |
| 57 Neonatal/infant morbidity: caused by pregnancy/birth Show forest plot | 1 | 291 | Risk Ratio (M‐H, Fixed, 95% CI) | 1.02 [0.67, 1.55] |
| 57.1 Omega‐3 supplements/enrichment + food/diet advice | 1 | 291 | Risk Ratio (M‐H, Fixed, 95% CI) | 1.02 [0.67, 1.55] |
| 58 Ponderal index Show forest plot | 6 | 887 | Mean Difference (IV, Random, 95% CI) | 0.05 [‐0.01, 0.11] |
| 58.1 Omega‐3 supplements only | 5 | 699 | Mean Difference (IV, Random, 95% CI) | 0.04 [‐0.04, 0.11] |
| 58.2 Omega‐3 supplements + food/diet advice | 1 | 188 | Mean Difference (IV, Random, 95% CI) | 0.08 [0.01, 0.15] |
| Outcome or subgroup title | No. of studies | No. of participants | Statistical method | Effect size |
| 1 Preterm birth (< 37 weeks) Show forest plot | 26 | 10294 | Risk Ratio (M‐H, Fixed, 95% CI) | 0.88 [0.80, 0.97] |
| 1.1 Low: < 500 mg/day | 6 | 1604 | Risk Ratio (M‐H, Fixed, 95% CI) | 0.88 [0.65, 1.20] |
| 1.2 Mid: 500 mg‐1 g/day | 9 | 4343 | Risk Ratio (M‐H, Fixed, 95% CI) | 0.79 [0.64, 0.98] |
| 1.3 High: > 1 g/day | 9 | 4240 | Risk Ratio (M‐H, Fixed, 95% CI) | 0.92 [0.83, 1.03] |
| 1.4 Other | 2 | 107 | Risk Ratio (M‐H, Fixed, 95% CI) | 0.66 [0.19, 2.32] |
| 2 Early preterm birth (< 34 weeks) Show forest plot | 9 | 5204 | Risk Ratio (M‐H, Fixed, 95% CI) | 0.58 [0.44, 0.77] |
| 2.1 Low: < 500 mg/day | 1 | 168 | Risk Ratio (M‐H, Fixed, 95% CI) | 0.29 [0.05, 1.51] |
| 2.2 Mid: 500 mg‐1 g/day | 7 | 4176 | Risk Ratio (M‐H, Fixed, 95% CI) | 0.47 [0.30, 0.75] |
| 2.3 High: > 1 g/day | 2 | 860 | Risk Ratio (M‐H, Fixed, 95% CI) | 0.69 [0.49, 0.99] |
| 3 Prolonged gestation (> 42 weeks) Show forest plot | 6 | 5141 | Risk Ratio (M‐H, Fixed, 95% CI) | 1.59 [1.10, 2.30] |
| 3.1 Low: < 500 mg/day | 2 | 303 | Risk Ratio (M‐H, Fixed, 95% CI) | 1.72 [0.07, 41.64] |
| 3.2 Mid: 500 mg‐1 g/day | 2 | 2544 | Risk Ratio (M‐H, Fixed, 95% CI) | 1.92 [0.54, 6.81] |
| 3.3 High: > 1 g/day | 3 | 2294 | Risk Ratio (M‐H, Fixed, 95% CI) | 1.56 [1.05, 2.30] |
| 4 Pre‐eclampsia (hypertension with proteinuria) Show forest plot | 20 | 8306 | Risk Ratio (M‐H, Fixed, 95% CI) | 0.83 [0.69, 1.01] |
| 4.1 Low: < 500 mg/day | 5 | 650 | Risk Ratio (M‐H, Fixed, 95% CI) | 0.59 [0.28, 1.26] |
| 4.2 Mid: 500 mg‐1 g/day | 7 | 4118 | Risk Ratio (M‐H, Fixed, 95% CI) | 0.83 [0.62, 1.11] |
| 4.3 High: > 1 g/day | 8 | 3479 | Risk Ratio (M‐H, Fixed, 95% CI) | 0.87 [0.66, 1.14] |
| 4.4 Other | 1 | 59 | Risk Ratio (M‐H, Fixed, 95% CI) | 2.07 [0.20, 21.60] |
| 5 Caesarean section Show forest plot | 28 | 8481 | Risk Ratio (M‐H, Fixed, 95% CI) | 0.97 [0.91, 1.03] |
| 5.1 Low: < 500 g/day | 8 | 1670 | Risk Ratio (M‐H, Fixed, 95% CI) | 0.94 [0.84, 1.06] |
| 5.2 Mid: 500 mg‐1 g/day | 10 | 4399 | Risk Ratio (M‐H, Fixed, 95% CI) | 0.93 [0.85, 1.02] |
| 5.3 High: > 1 g/day | 8 | 2294 | Risk Ratio (M‐H, Fixed, 95% CI) | 1.15 [0.97, 1.37] |
| 5.4 Other | 2 | 118 | Risk Ratio (M‐H, Fixed, 95% CI) | 0.59 [0.30, 1.15] |
| 6 Length of gestation (days) Show forest plot | 42 | 12517 | Mean Difference (IV, Random, 95% CI) | 1.67 [0.95, 2.39] |
| 6.1 Low: < 500 mg/day | 12 | 2117 | Mean Difference (IV, Random, 95% CI) | 1.05 [0.07, 2.03] |
| 6.2 Mid: 500 mg‐1 g/day | 15 | 4881 | Mean Difference (IV, Random, 95% CI) | 1.97 [0.56, 3.38] |
| 6.3 High: > 1 g/day | 12 | 3364 | Mean Difference (IV, Random, 95% CI) | 1.86 [0.45, 3.27] |
| 6.4 Mixed | 1 | 1998 | Mean Difference (IV, Random, 95% CI) | 0.10 [‐1.00, 1.20] |
| 6.5 Other | 3 | 157 | Mean Difference (IV, Random, 95% CI) | 2.24 [‐0.83, 5.31] |
| 7 Perinatal death Show forest plot | 10 | 7416 | Risk Ratio (M‐H, Fixed, 95% CI) | 0.75 [0.54, 1.03] |
| 7.1 Low: < 500 mg/day | 2 | 1127 | Risk Ratio (M‐H, Fixed, 95% CI) | 0.52 [0.20, 1.33] |
| 7.2 Mid: 500 mg‐1 g/day | 3 | 2566 | Risk Ratio (M‐H, Fixed, 95% CI) | 0.41 [0.16, 1.02] |
| 7.3 High: > 1 g/day | 5 | 3723 | Risk Ratio (M‐H, Fixed, 95% CI) | 0.89 [0.61, 1.29] |
| 8 Stillbirth Show forest plot | 16 | 7880 | Risk Ratio (M‐H, Fixed, 95% CI) | 0.94 [0.62, 1.42] |
| 8.1 Low: < 500 mg/day | 1 | 977 | Risk Ratio (M‐H, Fixed, 95% CI) | 0.67 [0.11, 3.96] |
| 8.2 Mid: 500 mg/day‐1 g/day | 5 | 2783 | Risk Ratio (M‐H, Fixed, 95% CI) | 0.70 [0.27, 1.83] |
| 8.3 High: > 1 g/day | 7 | 3933 | Risk Ratio (M‐H, Fixed, 95% CI) | 1.03 [0.62, 1.69] |
| 8.4 Other | 3 | 187 | Risk Ratio (M‐H, Fixed, 95% CI) | 1.16 [0.23, 5.94] |
| 9 Neonatal death Show forest plot | 9 | 7448 | Risk Ratio (M‐H, Fixed, 95% CI) | 0.61 [0.34, 1.11] |
| 9.1 Low: < 500 mg/day | 2 | 1123 | Risk Ratio (M‐H, Fixed, 95% CI) | 0.47 [0.15, 1.44] |
| 9.2 Mid: 500 mg/day‐1 g/day | 2 | 2700 | Risk Ratio (M‐H, Fixed, 95% CI) | 0.50 [0.12, 1.98] |
| 9.3 High: > 1 g/day | 5 | 3625 | Risk Ratio (M‐H, Fixed, 95% CI) | 0.78 [0.34, 1.78] |
| 10 Low birthweight (< 2500 g) Show forest plot | 15 | 8449 | Risk Ratio (M‐H, Fixed, 95% CI) | 0.90 [0.82, 0.99] |
| 10.1 Low: < 500 mg/day | 5 | 1551 | Risk Ratio (M‐H, Fixed, 95% CI) | 0.74 [0.51, 1.08] |
| 10.2 Mid: 500 mg‐1 g/day | 5 | 3901 | Risk Ratio (M‐H, Fixed, 95% CI) | 0.71 [0.54, 0.92] |
| 10.3 High: > 1 g/day | 5 | 2997 | Risk Ratio (M‐H, Fixed, 95% CI) | 0.97 [0.88, 1.08] |
| 11 Small‐for‐gestational age/IUGR Show forest plot | 8 | 6907 | Risk Ratio (M‐H, Fixed, 95% CI) | 1.01 [0.90, 1.13] |
| 11.1 Low: < 500 mg/day | 1 | 973 | Risk Ratio (M‐H, Fixed, 95% CI) | 1.04 [0.73, 1.48] |
| 11.2 Mid: 500 mg‐1 g/day | 2 | 3369 | Risk Ratio (M‐H, Fixed, 95% CI) | 0.85 [0.66, 1.09] |
| 11.3 High: > 1 g/day | 4 | 2506 | Risk Ratio (M‐H, Fixed, 95% CI) | 1.07 [0.93, 1.23] |
| 11.4 Other | 1 | 59 | Risk Ratio (M‐H, Fixed, 95% CI) | 2.07 [0.20, 21.60] |
| 12 Birthweight (g) Show forest plot | 44 | 11584 | Mean Difference (IV, Random, 95% CI) | 75.30 [38.09, 112.50] |
| 12.1 Low: < 500 mg/day | 12 | 2220 | Mean Difference (IV, Random, 95% CI) | 26.32 [‐12.74, 65.39] |
| 12.2 Mid: 500 mg‐1 g/day | 18 | 5007 | Mean Difference (IV, Random, 95% CI) | 91.49 [24.34, 158.64] |
| 12.3 High: > 1 g/day | 14 | 4298 | Mean Difference (IV, Random, 95% CI) | 88.31 [29.61, 147.01] |
| 12.4 Other | 1 | 59 | Mean Difference (IV, Random, 95% CI) | ‐203.20 [‐456.97, 50.57] |
| Outcome or subgroup title | No. of studies | No. of participants | Statistical method | Effect size |
| 1 Preterm birth (< 37 weeks) Show forest plot | 26 | 10304 | Risk Ratio (M‐H, Fixed, 95% CI) | 0.89 [0.81, 0.97] |
| 1.1 ≤ 20 weeks GA start | 12 | 6563 | Risk Ratio (M‐H, Fixed, 95% CI) | 0.85 [0.76, 0.95] |
| 1.2 > 20 weeks GA start | 13 | 3693 | Risk Ratio (M‐H, Fixed, 95% CI) | 1.01 [0.82, 1.23] |
| 1.3 Mixed | 1 | 48 | Risk Ratio (M‐H, Fixed, 95% CI) | 0.11 [0.01, 2.22] |
| 2 Early preterm birth (< 34 weeks) Show forest plot | 9 | 5204 | Risk Ratio (M‐H, Fixed, 95% CI) | 0.58 [0.44, 0.77] |
| 2.1 ≤ 20 weeks GA start | 8 | 5090 | Risk Ratio (M‐H, Fixed, 95% CI) | 0.56 [0.43, 0.75] |
| 2.2 > 20 weeks GA start | 1 | 114 | Risk Ratio (M‐H, Fixed, 95% CI) | 4.83 [0.24, 98.44] |
| 3 Prolonged gestation (> 42 weeks) Show forest plot | 6 | 5141 | Risk Ratio (M‐H, Fixed, 95% CI) | 1.61 [1.11, 2.33] |
| 3.1 ≤ 20 weeks GA start | 5 | 4608 | Risk Ratio (M‐H, Fixed, 95% CI) | 2.35 [1.29, 4.28] |
| 3.2 > 20 weeks GA start | 1 | 533 | Risk Ratio (M‐H, Fixed, 95% CI) | 1.19 [0.73, 1.93] |
| 4 Pre‐eclampsia (hypertension with proteinuria) Show forest plot | 20 | 8306 | Risk Ratio (M‐H, Fixed, 95% CI) | 0.84 [0.69, 1.01] |
| 4.1 ≤ 20 weeks GA start | 13 | 6296 | Risk Ratio (M‐H, Fixed, 95% CI) | 0.92 [0.74, 1.15] |
| 4.2 > 20 weeks GA start | 6 | 1883 | Risk Ratio (M‐H, Fixed, 95% CI) | 0.79 [0.53, 1.18] |
| 4.3 Not reported | 1 | 127 | Risk Ratio (M‐H, Fixed, 95% CI) | 0.07 [0.01, 0.54] |
| 5 Caesarean section Show forest plot | 28 | 8481 | Risk Ratio (M‐H, Fixed, 95% CI) | 0.97 [0.91, 1.03] |
| 5.1 ≤ 20 weeks GA start | 13 | 4995 | Risk Ratio (M‐H, Fixed, 95% CI) | 0.97 [0.88, 1.07] |
| 5.2 > 20 weeks GA start | 14 | 2617 | Risk Ratio (M‐H, Fixed, 95% CI) | 0.98 [0.87, 1.10] |
| 5.3 Mixed | 1 | 869 | Risk Ratio (M‐H, Fixed, 95% CI) | 0.95 [0.83, 1.08] |
| 6 Length of gestation (days) Show forest plot | 43 | 12517 | Mean Difference (IV, Random, 95% CI) | 1.67 [0.95, 2.39] |
| 6.1 ≤ 20 weeks GA start | 23 | 9396 | Mean Difference (IV, Random, 95% CI) | 1.99 [1.08, 2.90] |
| 6.2 > 20 weeks GA start | 20 | 3121 | Mean Difference (IV, Random, 95% CI) | 1.18 [‐0.05, 2.40] |
| 7 Perinatal death Show forest plot | 10 | 7416 | Risk Ratio (M‐H, Fixed, 95% CI) | 0.75 [0.54, 1.03] |
| 7.1 ≤ 20 weeks GA start | 6 | 5815 | Risk Ratio (M‐H, Fixed, 95% CI) | 0.72 [0.49, 1.07] |
| 7.2 > 20 weeks GA start | 4 | 1601 | Risk Ratio (M‐H, Fixed, 95% CI) | 0.79 [0.46, 1.38] |
| 8 Stillbirth Show forest plot | 16 | 7880 | Risk Ratio (M‐H, Fixed, 95% CI) | 0.94 [0.62, 1.42] |
| 8.1 ≤ 20 weeks GA start | 8 | 5537 | Risk Ratio (M‐H, Fixed, 95% CI) | 0.88 [0.52, 1.48] |
| 8.2 > 20 weeks GA start | 7 | 2295 | Risk Ratio (M‐H, Fixed, 95% CI) | 1.02 [0.50, 2.07] |
| 8.3 Mixed | 1 | 48 | Risk Ratio (M‐H, Fixed, 95% CI) | 1.69 [0.07, 39.30] |
| 9 Neonatal death Show forest plot | 9 | 7448 | Risk Ratio (M‐H, Fixed, 95% CI) | 0.61 [0.34, 1.11] |
| 9.1 ≤ 20 weeks GA start | 6 | 5415 | Risk Ratio (M‐H, Fixed, 95% CI) | 0.60 [0.26, 1.36] |
| 9.2 > 20 weeks GA start | 3 | 2033 | Risk Ratio (M‐H, Fixed, 95% CI) | 0.62 [0.26, 1.49] |
| 10 Low birthweight (< 2500 g) Show forest plot | 15 | 8449 | Risk Ratio (M‐H, Fixed, 95% CI) | 0.90 [0.82, 0.99] |
| 10.1 ≤ 20 weeks GA start | 9 | 6553 | Risk Ratio (M‐H, Fixed, 95% CI) | 0.88 [0.79, 0.97] |
| 10.2 > 20 weeks GA start | 6 | 1896 | Risk Ratio (M‐H, Fixed, 95% CI) | 1.02 [0.81, 1.28] |
| 11 Small‐for‐gestational age/IUGR Show forest plot | 8 | 6907 | Risk Ratio (M‐H, Fixed, 95% CI) | 1.01 [0.90, 1.13] |
| 11.1 ≤ 20 weeks GA start | 5 | 5643 | Risk Ratio (M‐H, Fixed, 95% CI) | 1.00 [0.88, 1.14] |
| 11.2 > 20 weeks GA start | 3 | 1264 | Risk Ratio (M‐H, Fixed, 95% CI) | 1.03 [0.79, 1.34] |
| 12 Birthweight (g) Show forest plot | 43 | 11584 | Mean Difference (IV, Random, 95% CI) | 75.69 [37.84, 113.55] |
| 12.1 ≤ 20 weeks GA start | 25 | 7802 | Mean Difference (IV, Random, 95% CI) | 83.26 [44.09, 122.43] |
| 12.2 > 20 weeks GA start | 17 | 3747 | Mean Difference (IV, Random, 95% CI) | 42.96 [‐34.14, 120.06] |
| 12.3 Not reported | 1 | 35 | Mean Difference (IV, Random, 95% CI) | 200.0 [‐205.07, 605.07] |
| Outcome or subgroup title | No. of studies | No. of participants | Statistical method | Effect size |
| 1 Preterm birth (< 37 weeks) Show forest plot | 26 | 10304 | Risk Ratio (M‐H, Fixed, 95% CI) | 0.89 [0.81, 0.97] |
| 1.1 DHA/largely DHA | 12 | 4744 | Risk Ratio (M‐H, Fixed, 95% CI) | 0.84 [0.69, 1.02] |
| 1.2 Mixed DHA/EPA | 9 | 4172 | Risk Ratio (M‐H, Fixed, 95% CI) | 0.92 [0.83, 1.03] |
| 1.3 Mixed DHA/EPA/other | 5 | 1388 | Risk Ratio (M‐H, Fixed, 95% CI) | 0.71 [0.45, 1.11] |
| 2 Early preterm birth (< 34 weeks) Show forest plot | 9 | 5204 | Risk Ratio (M‐H, Fixed, 95% CI) | 0.58 [0.44, 0.77] |
| 2.1 DHA/largely DHA | 5 | 3260 | Risk Ratio (M‐H, Fixed, 95% CI) | 0.46 [0.28, 0.76] |
| 2.2 Mixed DHA/EPA | 2 | 860 | Risk Ratio (M‐H, Fixed, 95% CI) | 0.69 [0.49, 0.99] |
| 2.3 Mixed DHA/EPA/other | 2 | 1084 | Risk Ratio (M‐H, Fixed, 95% CI) | 0.41 [0.14, 1.25] |
| 3 Prolonged gestation (> 42 weeks) Show forest plot | 6 | 5141 | Risk Ratio (M‐H, Fixed, 95% CI) | 1.61 [1.11, 2.33] |
| 3.1 DHA/largely DHA | 3 | 2847 | Risk Ratio (M‐H, Fixed, 95% CI) | 2.12 [0.60, 7.49] |
| 3.2 Mixed DHA/EPA | 2 | 2106 | Risk Ratio (M‐H, Fixed, 95% CI) | 1.54 [1.04, 2.28] |
| 3.3 Mixed DHA/EPA/other | 1 | 188 | Risk Ratio (M‐H, Fixed, 95% CI) | 3.13 [0.13, 75.84] |
| 4 Pre‐eclampsia (hypertension with proteinuria) Show forest plot | 20 | 8306 | Risk Ratio (M‐H, Fixed, 95% CI) | 0.84 [0.69, 1.01] |
| 4.1 DHA/largely DHA | 6 | 3454 | Risk Ratio (M‐H, Fixed, 95% CI) | 0.98 [0.71, 1.33] |
| 4.2 Mixed DHA/EPA | 9 | 3506 | Risk Ratio (M‐H, Fixed, 95% CI) | 0.90 [0.69, 1.18] |
| 4.3 Mixed DHA/EPA/other | 5 | 1346 | Risk Ratio (M‐H, Fixed, 95% CI) | 0.40 [0.23, 0.71] |
| 5 Caesarean section Show forest plot | 28 | 8481 | Risk Ratio (M‐H, Fixed, 95% CI) | 0.97 [0.91, 1.03] |
| 5.1 DHA/largely DHA | 9 | 4327 | Risk Ratio (M‐H, Fixed, 95% CI) | 0.95 [0.87, 1.03] |
| 5.2 Mixed DHA/EPA | 10 | 2433 | Risk Ratio (M‐H, Fixed, 95% CI) | 1.10 [0.95, 1.27] |
| 5.3 Mixed DHA/EPA/other | 9 | 1721 | Risk Ratio (M‐H, Fixed, 95% CI) | 0.88 [0.75, 1.02] |
| 6 Gestational length (days) Show forest plot | 43 | 12517 | Mean Difference (IV, Random, 95% CI) | 1.67 [0.95, 2.39] |
| 6.1 DHA/largely DHA | 14 | 4791 | Mean Difference (IV, Random, 95% CI) | 2.44 [0.91, 3.98] |
| 6.2 Mixed DHA/EPA | 17 | 5760 | Mean Difference (IV, Random, 95% CI) | 1.23 [0.21, 2.24] |
| 6.3 Mixed DHA/EPA/other | 12 | 1966 | Mean Difference (IV, Random, 95% CI) | 1.42 [0.33, 2.50] |
| 7 Perinatal death Show forest plot | 10 | 7416 | Risk Ratio (M‐H, Fixed, 95% CI) | 0.75 [0.54, 1.03] |
| 7.1 DHA/largely DHA | 3 | 3475 | Risk Ratio (M‐H, Fixed, 95% CI) | 0.44 [0.21, 0.91] |
| 7.2 Mixed DHA/EPA | 6 | 3873 | Risk Ratio (M‐H, Fixed, 95% CI) | 0.88 [0.60, 1.27] |
| 7.3 Mixed DHA/EPA/other | 1 | 68 | Risk Ratio (M‐H, Fixed, 95% CI) | 0.67 [0.12, 3.74] |
| 8 Stillbirth Show forest plot | 16 | 7880 | Risk Ratio (M‐H, Fixed, 95% CI) | 0.94 [0.62, 1.42] |
| 8.1 DHA/largely DHA | 5 | 3639 | Risk Ratio (M‐H, Fixed, 95% CI) | 0.69 [0.28, 1.70] |
| 8.2 Mixed DHA/EPA | 8 | 3987 | Risk Ratio (M‐H, Fixed, 95% CI) | 1.06 [0.65, 1.73] |
| 8.3 Mixed DHA/EPA/other | 3 | 254 | Risk Ratio (M‐H, Fixed, 95% CI) | 0.70 [0.14, 3.51] |
| 9 Neonatal death Show forest plot | 9 | 7448 | Risk Ratio (M‐H, Fixed, 95% CI) | 0.61 [0.34, 1.11] |
| 9.1 DHA/largely DHA | 3 | 3673 | Risk Ratio (M‐H, Fixed, 95% CI) | 0.50 [0.20, 1.23] |
| 9.2 Mixed DHA/EPA | 6 | 3775 | Risk Ratio (M‐H, Fixed, 95% CI) | 0.73 [0.33, 1.62] |
| 10 Low birthweight (< 2500 g) Show forest plot | 15 | 8449 | Risk Ratio (M‐H, Fixed, 95% CI) | 0.90 [0.82, 0.99] |
| 10.1 DHA/largely DHA | 6 | 4118 | Risk Ratio (M‐H, Fixed, 95% CI) | 0.72 [0.56, 0.93] |
| 10.2 Mixed DHA/EPA | 6 | 3147 | Risk Ratio (M‐H, Fixed, 95% CI) | 0.96 [0.87, 1.07] |
| 10.3 Mixed DHA/EPA/other | 3 | 1184 | Risk Ratio (M‐H, Fixed, 95% CI) | 0.78 [0.51, 1.18] |
| 11 Small‐for‐gestational age/IUGR Show forest plot | 8 | 6907 | Risk Ratio (M‐H, Fixed, 95% CI) | 1.01 [0.90, 1.13] |
| 11.1 DHA/largely DHA | 2 | 3372 | Risk Ratio (M‐H, Fixed, 95% CI) | 0.95 [0.75, 1.20] |
| 11.2 Mixed DHA/EPA | 4 | 2506 | Risk Ratio (M‐H, Fixed, 95% CI) | 1.07 [0.93, 1.23] |
| 11.3 Mixed EPA/DHA/other | 2 | 1029 | Risk Ratio (M‐H, Fixed, 95% CI) | 0.78 [0.50, 1.22] |
| 12 Birthweight (g) Show forest plot | 43 | 11584 | Mean Difference (IV, Random, 95% CI) | 75.69 [37.84, 113.55] |
| 12.1 DHA/largely DHA | 17 | 6121 | Mean Difference (IV, Random, 95% CI) | 52.60 [26.96, 78.23] |
| 12.2 Mixed DHA/EPA | 15 | 4429 | Mean Difference (IV, Random, 95% CI) | 72.72 [6.67, 138.78] |
| 12.3 Mixed DHA/EPA/other | 11 | 1034 | Mean Difference (IV, Random, 95% CI) | 113.65 [12.54, 214.75] |
| Outcome or subgroup title | No. of studies | No. of participants | Statistical method | Effect size |
| 1 Preterm birth (< 37 weeks) Show forest plot | 27 | 10304 | Risk Ratio (M‐H, Fixed, 95% CI) | 0.89 [0.81, 0.97] |
| 1.1 Increased/high risk | 12 | 3702 | Risk Ratio (M‐H, Fixed, 95% CI) | 0.92 [0.83, 1.03] |
| 1.2 Low risk | 10 | 3241 | Risk Ratio (M‐H, Fixed, 95% CI) | 0.92 [0.71, 1.20] |
| 1.3 Any/mixed risk | 5 | 3361 | Risk Ratio (M‐H, Fixed, 95% CI) | 0.71 [0.54, 0.93] |
| 2 Early preterm birth (< 34 weeks) Show forest plot | 10 | 5204 | Risk Ratio (M‐H, Fixed, 95% CI) | 0.58 [0.44, 0.77] |
| 2.1 Increased/high risk | 6 | 2104 | Risk Ratio (M‐H, Fixed, 95% CI) | 0.67 [0.49, 0.93] |
| 2.2 Low risk | 3 | 701 | Risk Ratio (M‐H, Fixed, 95% CI) | 0.31 [0.12, 0.79] |
| 2.3 Any/mixed risk | 1 | 2399 | Risk Ratio (M‐H, Fixed, 95% CI) | 0.48 [0.25, 0.93] |
| 3 Prolonged gestation (> 42 weeks) Show forest plot | 6 | 5141 | Risk Ratio (M‐H, Fixed, 95% CI) | 1.61 [1.11, 2.33] |
| 3.1 Increased/high risk | 1 | 1573 | Risk Ratio (M‐H, Fixed, 95% CI) | 2.39 [1.19, 4.80] |
| 3.2 Low risk | 4 | 1201 | Risk Ratio (M‐H, Fixed, 95% CI) | 1.26 [0.79, 2.01] |
| 3.3 Any/mixed risk | 1 | 2367 | Risk Ratio (M‐H, Fixed, 95% CI) | 2.00 [0.50, 7.97] |
| 4 Pre‐eclampsia (hypertension with proteinuria) Show forest plot | 20 | 8306 | Risk Ratio (M‐H, Fixed, 95% CI) | 0.84 [0.69, 1.01] |
| 4.1 Increased/high risk | 12 | 3564 | Risk Ratio (M‐H, Fixed, 95% CI) | 0.76 [0.59, 0.99] |
| 4.2 Low risk | 5 | 1507 | Risk Ratio (M‐H, Fixed, 95% CI) | 0.59 [0.28, 1.24] |
| 4.3 Any/mixed risk | 3 | 3235 | Risk Ratio (M‐H, Fixed, 95% CI) | 1.01 [0.74, 1.37] |
| 5 Caesarean section Show forest plot | 29 | 8481 | Risk Ratio (M‐H, Fixed, 95% CI) | 0.97 [0.91, 1.03] |
| 5.1 Increased/high risk | 12 | 2046 | Risk Ratio (M‐H, Fixed, 95% CI) | 0.92 [0.80, 1.05] |
| 5.2 Low risk | 14 | 3185 | Risk Ratio (M‐H, Fixed, 95% CI) | 0.99 [0.89, 1.09] |
| 5.3 Any/mixed risk | 3 | 3250 | Risk Ratio (M‐H, Fixed, 95% CI) | 0.98 [0.87, 1.10] |
| 6 Length of gestation (days) Show forest plot | 43 | 12517 | Mean Difference (IV, Random, 95% CI) | 1.67 [0.95, 2.39] |
| 6.1 Increased/high risk | 18 | 3707 | Mean Difference (IV, Random, 95% CI) | 2.17 [0.65, 3.68] |
| 6.2 Low risk | 22 | 4330 | Mean Difference (IV, Random, 95% CI) | 1.41 [0.52, 2.29] |
| 6.3 Any/mixed group | 3 | 4480 | Mean Difference (IV, Random, 95% CI) | 1.27 [‐0.36, 2.91] |
| 7 Perinatal death Show forest plot | 10 | 7416 | Risk Ratio (M‐H, Fixed, 95% CI) | 0.75 [0.54, 1.03] |
| 7.1 Increased/high risk | 6 | 3566 | Risk Ratio (M‐H, Fixed, 95% CI) | 0.84 [0.56, 1.26] |
| 7.2 Low risk | 2 | 1127 | Risk Ratio (M‐H, Fixed, 95% CI) | 0.52 [0.20, 1.33] |
| 7.3 Any/mixed risk | 2 | 2723 | Risk Ratio (M‐H, Fixed, 95% CI) | 0.67 [0.35, 1.26] |
| 8 Stillbirth Show forest plot | 16 | 7880 | Risk Ratio (M‐H, Fixed, 95% CI) | 0.94 [0.62, 1.42] |
| 8.1 Increased/high risk | 9 | 3137 | Risk Ratio (M‐H, Fixed, 95% CI) | 1.06 [0.65, 1.72] |
| 8.2 Low risk | 5 | 2296 | Risk Ratio (M‐H, Fixed, 95% CI) | 1.13 [0.40, 3.23] |
| 8.3 Any/mixed risk | 2 | 2447 | Risk Ratio (M‐H, Fixed, 95% CI) | 0.27 [0.06, 1.27] |
| 9 Neonatal death Show forest plot | 9 | 7448 | Risk Ratio (M‐H, Fixed, 95% CI) | 0.61 [0.34, 1.11] |
| 9.1 Increased/high risk | 4 | 2889 | Risk Ratio (M‐H, Fixed, 95% CI) | 0.78 [0.34, 1.78] |
| 9.2 Low risk | 3 | 1424 | Risk Ratio (M‐H, Fixed, 95% CI) | 0.52 [0.19, 1.45] |
| 9.3 Any/mixed risk | 2 | 3135 | Risk Ratio (M‐H, Fixed, 95% CI) | 0.40 [0.08, 2.07] |
| 10 Low birthweight (< 2500 g) Show forest plot | 15 | 8449 | Risk Ratio (M‐H, Fixed, 95% CI) | 0.90 [0.82, 0.99] |
| 10.1 Increased/high risk | 7 | 4081 | Risk Ratio (M‐H, Fixed, 95% CI) | 0.96 [0.87, 1.07] |
| 10.2 Low risk | 6 | 1869 | Risk Ratio (M‐H, Fixed, 95% CI) | 0.73 [0.52, 1.02] |
| 10.3 Any/mixed risk | 2 | 2499 | Risk Ratio (M‐H, Fixed, 95% CI) | 0.63 [0.44, 0.92] |
| 11 Small‐for‐gestational age/IUGR Show forest plot | 8 | 6907 | Risk Ratio (M‐H, Fixed, 95% CI) | 1.01 [0.90, 1.13] |
| 11.1 Increased/high risk | 6 | 3535 | Risk Ratio (M‐H, Fixed, 95% CI) | 1.03 [0.90, 1.18] |
| 11.2 Low risk | 1 | 973 | Risk Ratio (M‐H, Fixed, 95% CI) | 1.04 [0.73, 1.48] |
| 11.3 Any/mixed risk | 1 | 2399 | Risk Ratio (M‐H, Fixed, 95% CI) | 0.89 [0.66, 1.21] |
| 12 Birthweight (g) Show forest plot | 43 | 11584 | Mean Difference (IV, Random, 95% CI) | 75.69 [37.84, 113.55] |
| 12.1 Increased/high risk | 19 | 4848 | Mean Difference (IV, Random, 95% CI) | 105.52 [30.84, 180.21] |
| 12.2 Low risk | 23 | 4337 | Mean Difference (IV, Random, 95% CI) | 46.63 [13.90, 79.36] |
| 12.3 Any/mixed group | 1 | 2399 | Mean Difference (IV, Random, 95% CI) | 68.0 [22.38, 113.62] |
| Outcome or subgroup title | No. of studies | No. of participants | Statistical method | Effect size |
| 1 Early preterm birth < 34 weeks Show forest plot | 1 | 224 | Risk Ratio (M‐H, Fixed, 95% CI) | 0.91 [0.13, 6.38] |
| 2 Prolonged gestation > 42 weeks Show forest plot | 1 | 224 | Risk Ratio (M‐H, Fixed, 95% CI) | 0.91 [0.06, 14.44] |
| 3 Pre‐eclampsia Show forest plot | 1 | 224 | Risk Ratio (M‐H, Fixed, 95% CI) | 0.91 [0.06, 14.44] |
| 4 Induction (post‐term) Show forest plot | 1 | 224 | Risk Ratio (M‐H, Fixed, 95% CI) | 0.10 [0.01, 1.87] |
| 5 PROM Show forest plot | 1 | 224 | Risk Ratio (M‐H, Fixed, 95% CI) | 0.30 [0.03, 2.89] |
| 6 PPROM Show forest plot | 1 | 224 | Risk Ratio (M‐H, Fixed, 95% CI) | 1.22 [0.28, 5.32] |
| 7 Length of gestation Show forest plot | 2 | 1474 | Mean Difference (IV, Fixed, 95% CI) | 0.24 [‐1.16, 1.64] |
| 8 Birthweight (g) Show forest plot | 1 | 224 | Mean Difference (IV, Fixed, 95% CI) | ‐110.35 [‐242.80, 22.10] |
| 9 Length at birth (cm) Show forest plot | 1 | 224 | Mean Difference (IV, Fixed, 95% CI) | 0.05 [‐0.80, 0.90] |
| 10 Head circumference at birth (cm) Show forest plot | 1 | 224 | Mean Difference (IV, Fixed, 95% CI) | ‐0.24 [‐0.87, 0.39] |
| Outcome or subgroup title | No. of studies | No. of participants | Statistical method | Effect size |
| 1 Gestational diabetes Show forest plot | 2 | Risk Ratio (M‐H, Fixed, 95% CI) | Subtotals only | |
| 1.1 DHA versus EPA | 1 | 77 | Risk Ratio (M‐H, Fixed, 95% CI) | 0.15 [0.02, 1.14] |
| 1.2 DHA versus DHA/AA | 1 | 86 | Risk Ratio (M‐H, Fixed, 95% CI) | 0.33 [0.01, 7.96] |
| 2 Caesarean section Show forest plot | 1 | 77 | Risk Ratio (M‐H, Fixed, 95% CI) | 1.23 [0.61, 2.51] |
| 2.1 DHA versus EPA | 1 | 77 | Risk Ratio (M‐H, Fixed, 95% CI) | 1.23 [0.61, 2.51] |
| 3 Adverse events: cessation Show forest plot | 1 | Risk Ratio (M‐H, Fixed, 95% CI) | Subtotals only | |
| 3.1 DHA versus EPA | 1 | 77 | Risk Ratio (M‐H, Fixed, 95% CI) | 0.82 [0.24, 2.83] |
| 4 Pre‐eclampsia Show forest plot | 1 | 77 | Risk Ratio (M‐H, Fixed, 95% CI) | 0.26 [0.06, 1.13] |
| 4.1 DHA versus EPA | 1 | 77 | Risk Ratio (M‐H, Fixed, 95% CI) | 0.26 [0.06, 1.13] |
| 5 Blood loss at birth (mL) Show forest plot | 1 | 77 | Mean Difference (IV, Fixed, 95% CI) | 1.0 [‐181.94, 183.94] |
| 5.1 DHA versus EPA | 1 | 77 | Mean Difference (IV, Fixed, 95% CI) | 1.0 [‐181.94, 183.94] |
| 6 Depressive symptoms postpartum: thresholds Show forest plot | 1 | Risk Ratio (M‐H, Fixed, 95% CI) | Subtotals only | |
| 6.1 Major depressive disorder at 6‐8 weeks | 1 | 77 | Risk Ratio (M‐H, Fixed, 95% CI) | 0.68 [0.12, 3.87] |
| 7 Depressive symptoms postpartum: scores Show forest plot | 1 | Mean Difference (IV, Fixed, 95% CI) | Subtotals only | |
| 7.1 BDI: 6‐8 weeks postpartum | 1 | 77 | Mean Difference (IV, Fixed, 95% CI) | ‐1.40 [‐3.75, 0.95] |
| 8 Length of gestation (days) Show forest plot | 3 | Mean Difference (IV, Fixed, 95% CI) | Subtotals only | |
| 8.1 DHA versus EPA | 1 | 77 | Mean Difference (IV, Fixed, 95% CI) | 9.10 [5.24, 12.96] |
| 8.2 EPA/DHA vs ALA | 1 | 1250 | Mean Difference (IV, Fixed, 95% CI) | ‐0.29 [‐2.33, 1.75] |
| 8.3 DHA versus DHA/AA | 1 | 83 | Mean Difference (IV, Fixed, 95% CI) | 0.0 [‐3.31, 3.31] |
| 9 Baby admitted to neonatal care Show forest plot | 1 | 78 | Risk Ratio (M‐H, Fixed, 95% CI) | 0.35 [0.08, 1.63] |
| 9.1 DHA versus EPA | 1 | 78 | Risk Ratio (M‐H, Fixed, 95% CI) | 0.35 [0.08, 1.63] |
| 10 Birthweight (g) Show forest plot | 2 | Mean Difference (IV, Fixed, 95% CI) | Subtotals only | |
| 10.1 DHA versus EPA | 1 | 78 | Mean Difference (IV, Fixed, 95% CI) | 372.0 [151.90, 592.10] |
| 10.2 DHA versus DHA/AA | 1 | 83 | Mean Difference (IV, Fixed, 95% CI) | ‐79.0 [‐260.22, 102.22] |
| 11 Infant weight (kg) Show forest plot | 1 | Mean Difference (IV, Fixed, 95% CI) | Subtotals only | |
| 11.1 DHA versus DHA/AA | 1 | 80 | Mean Difference (IV, Fixed, 95% CI) | ‐0.20 [‐0.79, 0.39] |
| 12 Infant height (cm) Show forest plot | 1 | Mean Difference (IV, Fixed, 95% CI) | Subtotals only | |
| 12.1 DHA versus DHA/AA | 1 | 80 | Mean Difference (IV, Fixed, 95% CI) | ‐0.80 [‐2.50, 0.90] |
| 13 Infant head circumference (cm) Show forest plot | 1 | Mean Difference (IV, Fixed, 95% CI) | Subtotals only | |
| 13.1 At 18 months | 1 | 80 | Mean Difference (IV, Fixed, 95% CI) | 0.10 [‐0.45, 0.65] |
| 14 Cognition: Scores Show forest plot | 1 | Mean Difference (IV, Fixed, 95% CI) | Subtotals only | |
| 14.1 DHA versus DHA/AA: BSID II | 1 | 80 | Mean Difference (IV, Fixed, 95% CI) | 0.90 [‐4.71, 6.51] |
| 15 Motor: Scores Show forest plot | 1 | Mean Difference (IV, Fixed, 95% CI) | Subtotals only | |
| 15.1 DHA versus DHA/AA: BSID II | 1 | 79 | Mean Difference (IV, Fixed, 95% CI) | 3.40 [‐1.07, 7.87] |
| 16 Neurodevelopment Show forest plot | 1 | Risk Ratio (M‐H, Fixed, 95% CI) | Subtotals only | |
| 16.1 DHA versus DHA/AA: neonatal neurological classification: mildly/definitely abnormal at 2 weeks | 1 | 67 | Risk Ratio (M‐H, Fixed, 95% CI) | 0.73 [0.28, 1.87] |
| 16.2 DHA versus DHA/AA: general movement quality: mildly/definitely abnormal at 2 weeks | 1 | 67 | Risk Ratio (M‐H, Fixed, 95% CI) | 1.08 [0.68, 1.72] |
| 16.3 DHA versus DHA/AA: general movement quality: mildly/definitely abnormal at 12 weeks | 1 | 83 | Risk Ratio (M‐H, Fixed, 95% CI) | 1.81 [1.11, 2.95] |
| 17 Cerebral palsy Show forest plot | 1 | Risk Ratio (M‐H, Fixed, 95% CI) | Subtotals only | |
| 17.1 DHA versus DHA/AA | 1 | 80 | Risk Ratio (M‐H, Fixed, 95% CI) | 0.0 [0.0, 0.0] |
| Outcome or subgroup title | No. of studies | No. of participants | Statistical method | Effect size |
| 1 Preterm birth (< 37 weeks) Show forest plot | 12 | 6718 | Risk Ratio (M‐H, Fixed, 95% CI) | 0.92 [0.83, 1.02] |
| 2 Early preterm birth (< 34 weeks) Show forest plot | 6 | 4073 | Risk Ratio (M‐H, Fixed, 95% CI) | 0.61 [0.46, 0.82] |
| 3 Prolonged gestation (> 42 weeks) Show forest plot | 3 | 4285 | Risk Ratio (M‐H, Fixed, 95% CI) | 2.32 [1.26, 4.28] |
| 4 Pre‐eclampsia (hypertension with proteinuria) Show forest plot | 12 | 6104 | Risk Ratio (M‐H, Fixed, 95% CI) | 1.00 [0.81, 1.25] |
| 5 Caesarean section Show forest plot | 12 | 5239 | Risk Ratio (M‐H, Fixed, 95% CI) | 0.96 [0.89, 1.04] |
| 6 Length of gestation (days) Show forest plot | 16 | 6313 | Mean Difference (IV, Fixed, 95% CI) | 1.42 [0.73, 2.11] |
| 7 Perinatal death Show forest plot | 5 | 4610 | Risk Ratio (M‐H, Fixed, 95% CI) | 0.60 [0.37, 0.97] |
| 8 Stillbirth Show forest plot | 10 | 6193 | Risk Ratio (M‐H, Fixed, 95% CI) | 0.80 [0.49, 1.31] |
| 9 Neonatal death Show forest plot | 6 | 4791 | Risk Ratio (M‐H, Fixed, 95% CI) | 0.56 [0.25, 1.27] |
| 10 Low birthweight (< 2500 g) Show forest plot | 10 | 6839 | Risk Ratio (M‐H, Random, 95% CI) | 0.87 [0.73, 1.04] |
| 11 Small‐for‐gestational age/IUGR Show forest plot | 6 | 5874 | Risk Ratio (M‐H, Fixed, 95% CI) | 1.03 [0.91, 1.16] |
| 12 Birthweight (g) Show forest plot | 18 | 7382 | Mean Difference (IV, Fixed, 95% CI) | 48.84 [22.93, 74.76] |