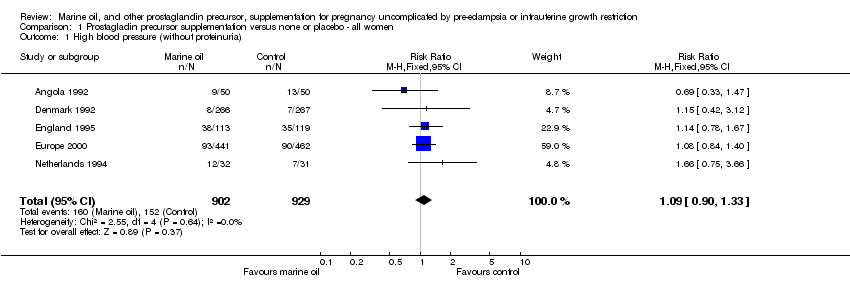
| 1 High blood pressure (without proteinuria) Show forest plot | 5 | 1831 | Risk Ratio (M‐H, Fixed, 95% CI) | 1.09 [0.90, 1.33] |
|
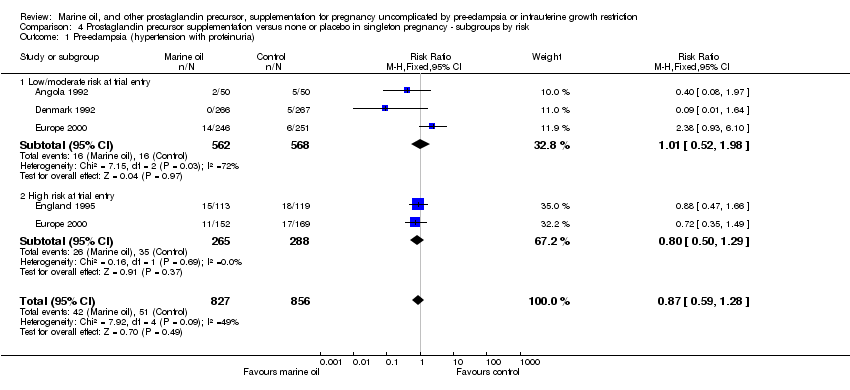
| 2 Pre‐eclampsia (hypertension with proteinuria) Show forest plot | 4 | 1683 | Risk Ratio (M‐H, Fixed, 95% CI) | 0.86 [0.59, 1.27] |
|
| 3 Eclampsia or other serious maternal morbidity Show forest plot | 1 | 100 | Risk Ratio (M‐H, Fixed, 95% CI) | 0.14 [0.01, 2.70] |
|
| 4 Maternal death Show forest plot | 1 | 1477 | Risk Ratio (M‐H, Fixed, 95% CI) | 0.0 [0.0, 0.0] |
|
| 5 Maternal antepartum hospitalisation Show forest plot | 1 | 63 | Risk Ratio (M‐H, Fixed, 95% CI) | 1.23 [0.67, 2.28] |
|
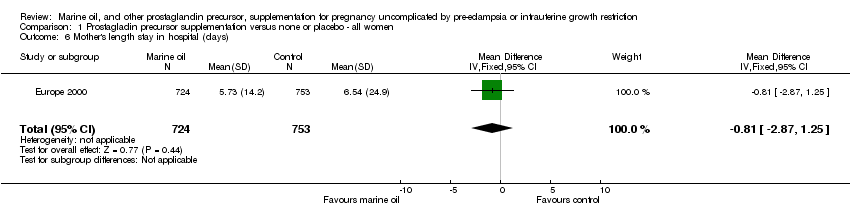
| 6 Mother's length stay in hospital (days) Show forest plot | 1 | 1477 | Mean Difference (IV, Fixed, 95% CI) | ‐0.81 [‐2.87, 1.25] |
|
| 7 Antepartum vaginal bleeding Show forest plot | 2 | 1976 | Risk Ratio (M‐H, Fixed, 95% CI) | 1.05 [0.71, 1.56] |
|
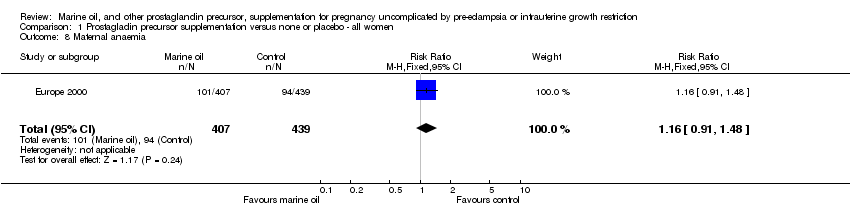
| 8 Maternal anaemia Show forest plot | 1 | 846 | Risk Ratio (M‐H, Fixed, 95% CI) | 1.16 [0.91, 1.48] |
|
| 9 Maternal side‐effects Show forest plot | 3 | | Risk Ratio (M‐H, Fixed, 95% CI) | Subtotals only |
|
| 9.1 Belching | 3 | 1386 | Risk Ratio (M‐H, Fixed, 95% CI) | 3.55 [2.78, 4.52] |
| 9.2 Unpleasant taste | 3 | 1354 | Risk Ratio (M‐H, Fixed, 95% CI) | 6.17 [4.03, 9.44] |
| 9.3 Nausea | 3 | 1352 | Risk Ratio (M‐H, Fixed, 95% CI) | 1.09 [0.74, 1.60] |
| 9.4 Vomiting | 2 | 1263 | Risk Ratio (M‐H, Fixed, 95% CI) | 0.95 [0.53, 1.69] |
| 9.5 Stomach pain | 2 | 477 | Risk Ratio (M‐H, Fixed, 95% CI) | 1.55 [0.54, 4.41] |
| 9.6 Diarrhoea | 2 | 1251 | Risk Ratio (M‐H, Fixed, 95% CI) | 0.68 [0.42, 1.12] |
| 9.7 Constipation | 1 | 1077 | Risk Ratio (M‐H, Fixed, 95% CI) | 0.42 [0.08, 2.15] |
| 9.8 Nasal bleeding | 2 | 1506 | Risk Ratio (M‐H, Fixed, 95% CI) | 0.94 [0.71, 1.24] |
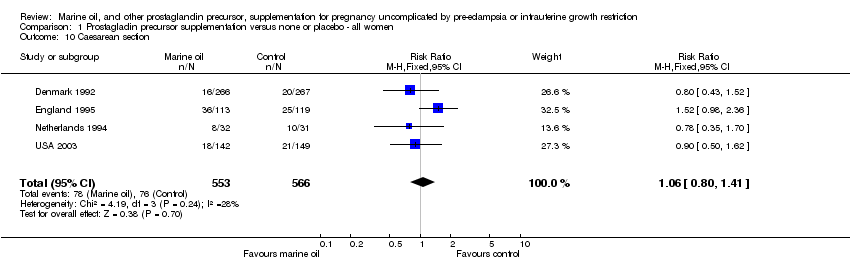
| 10 Caesarean section Show forest plot | 4 | 1119 | Risk Ratio (M‐H, Fixed, 95% CI) | 1.06 [0.80, 1.41] |
|
| 11 Length of labour (hours) | 0 | 0 | Mean Difference (IV, Fixed, 95% CI) | 0.0 [0.0, 0.0] |
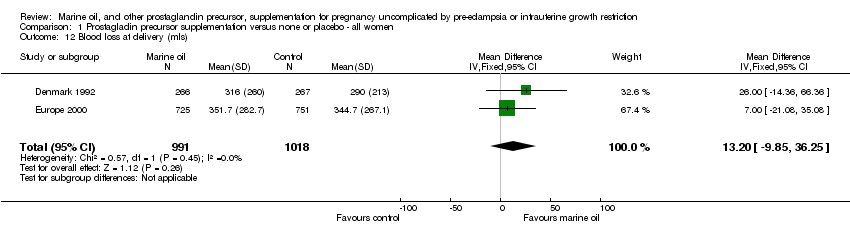
| 12 Blood loss at delivery (mls) Show forest plot | 2 | 2009 | Mean Difference (IV, Fixed, 95% CI) | 13.20 [‐9.85, 36.25] |
|
| 13 Vaginal blood loss after delivery Show forest plot | 1 | 533 | Risk Ratio (M‐H, Fixed, 95% CI) | 1.29 [0.49, 3.41] |
|
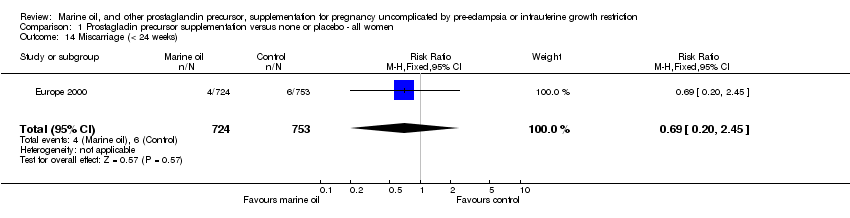
| 14 Miscarriage (< 24 weeks) Show forest plot | 1 | 1477 | Risk Ratio (M‐H, Fixed, 95% CI) | 0.69 [0.20, 2.45] |
|
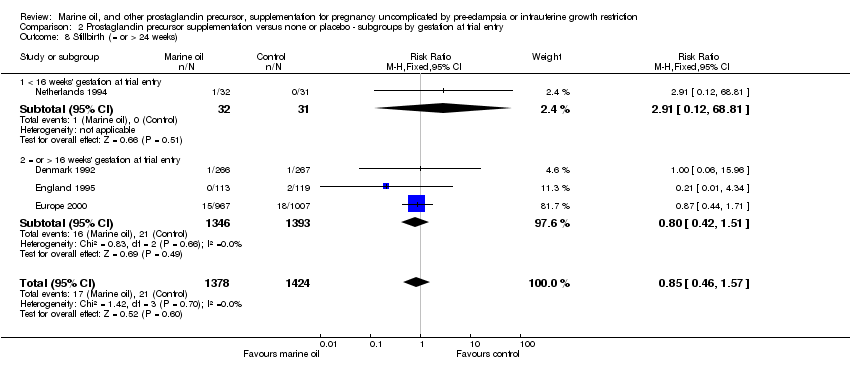
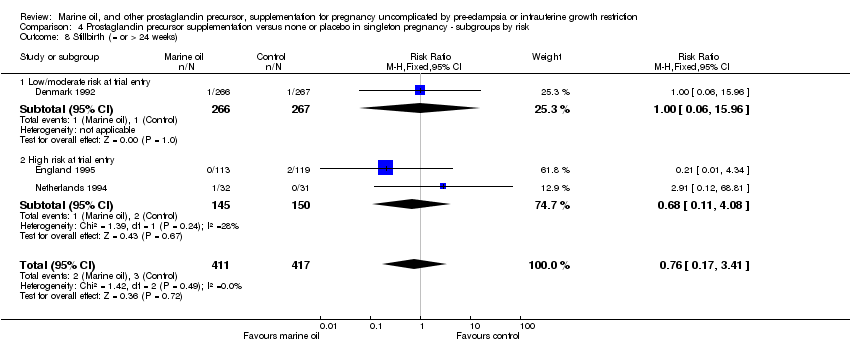
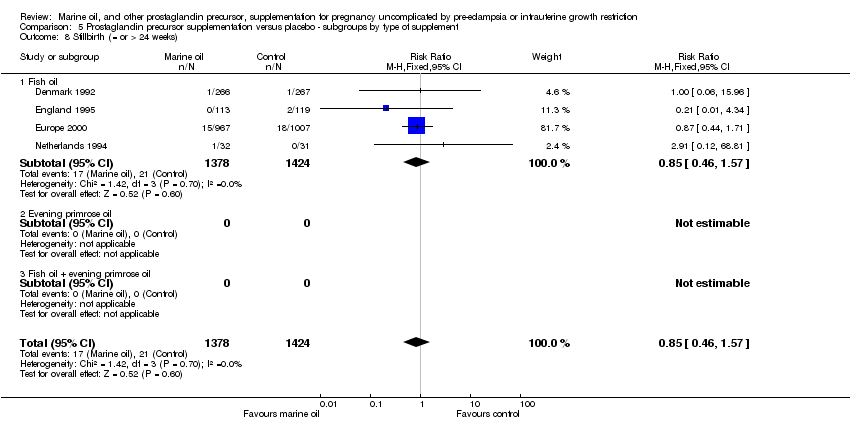
| 15 Stillbirth (= or > 24 weeks) Show forest plot | 4 | 2802 | Risk Ratio (M‐H, Fixed, 95% CI) | 0.85 [0.46, 1.57] |
|
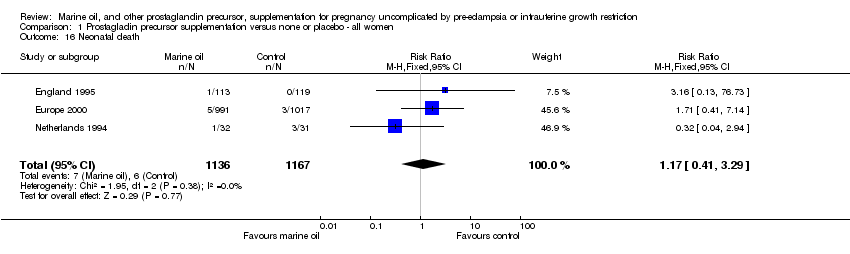
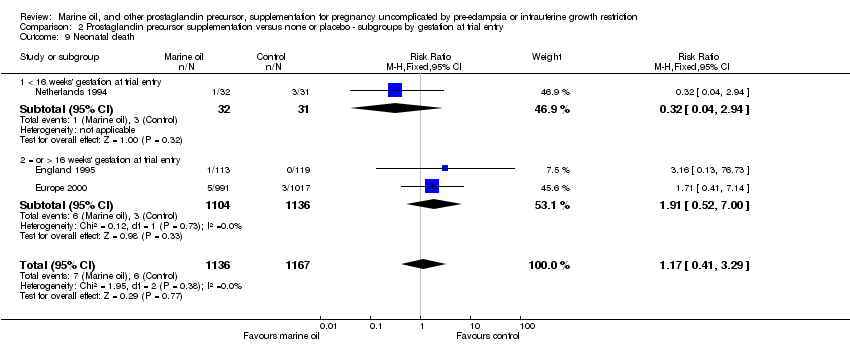
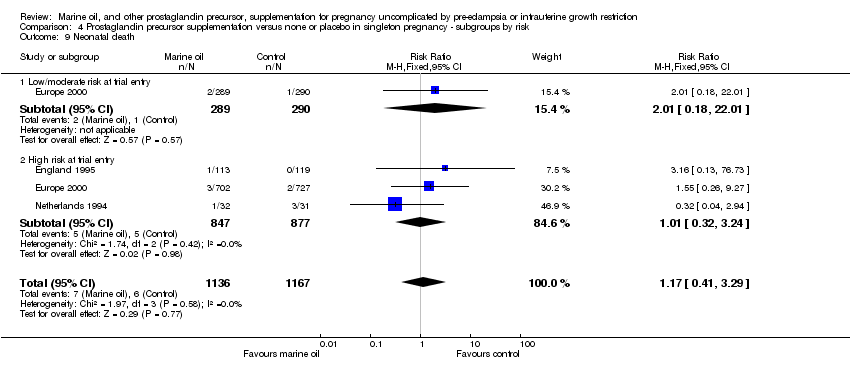
| 16 Neonatal death Show forest plot | 3 | 2303 | Risk Ratio (M‐H, Fixed, 95% CI) | 1.17 [0.41, 3.29] |
|
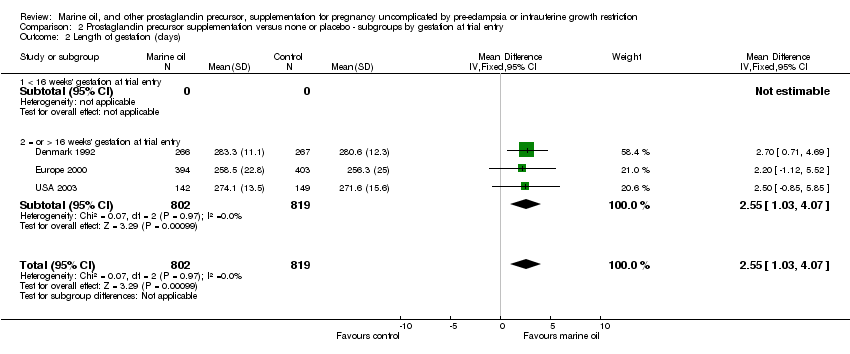
| 17 Length of gestation (days) Show forest plot | 3 | 1621 | Mean Difference (IV, Fixed, 95% CI) | 2.55 [1.03, 4.07] |
|
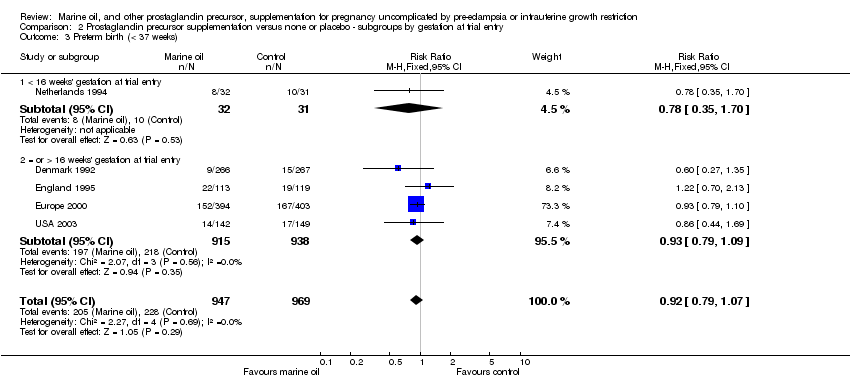
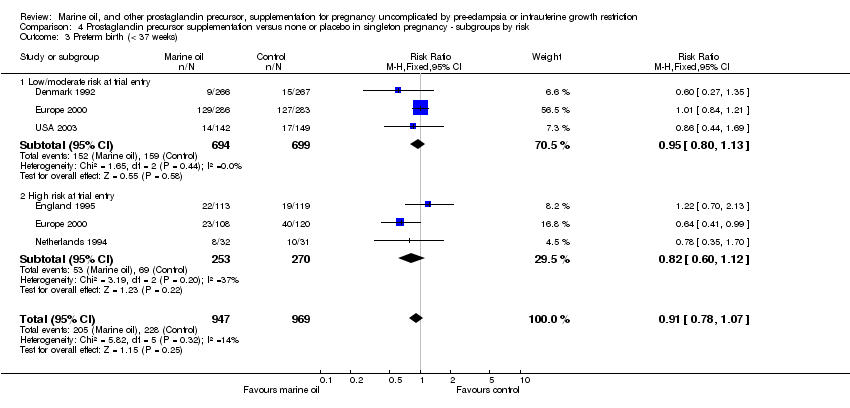
| 18 Preterm birth (< 37 weeks) Show forest plot | 5 | 1916 | Risk Ratio (M‐H, Fixed, 95% CI) | 0.92 [0.79, 1.07] |
|
| 19 Early preterm birth (< 34 weeks) Show forest plot | 2 | 860 | Risk Ratio (M‐H, Fixed, 95% CI) | 0.69 [0.49, 0.99] |
|
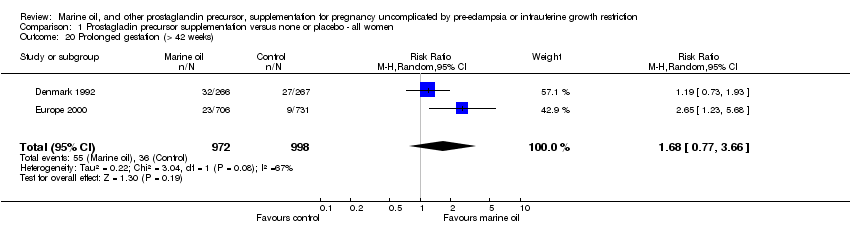
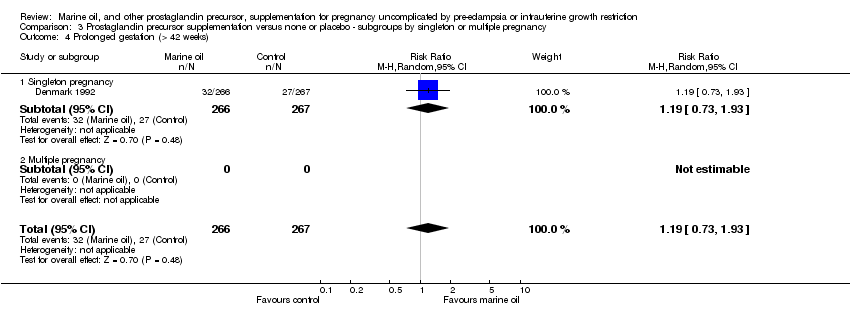
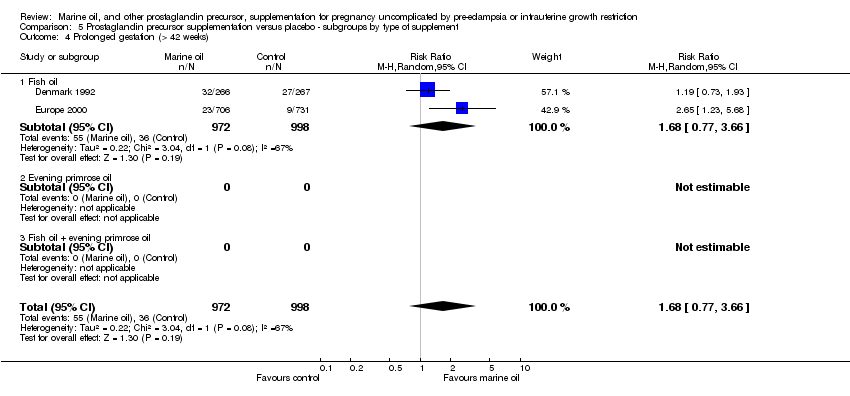
| 20 Prolonged gestation (> 42 weeks) Show forest plot | 2 | 1970 | Risk Ratio (M‐H, Random, 95% CI) | 1.68 [0.77, 3.66] |
|
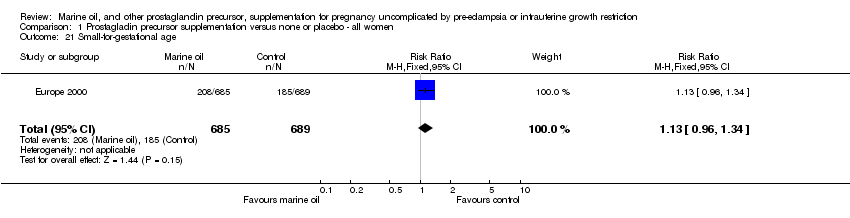
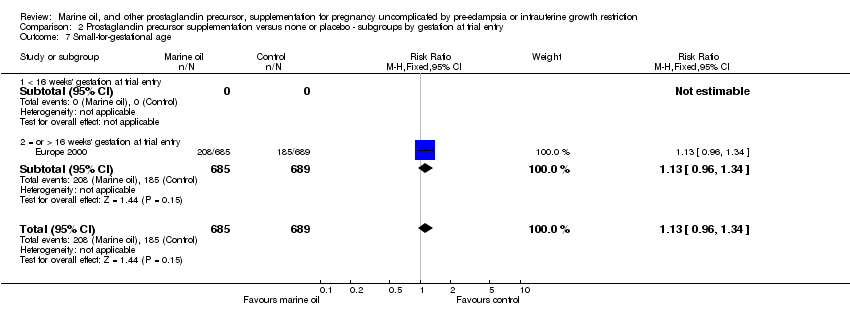
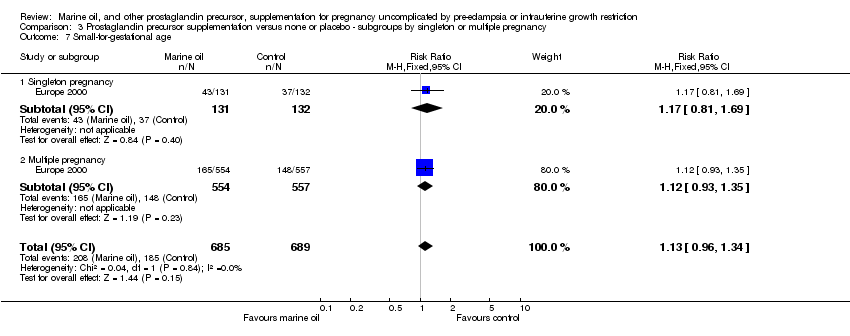
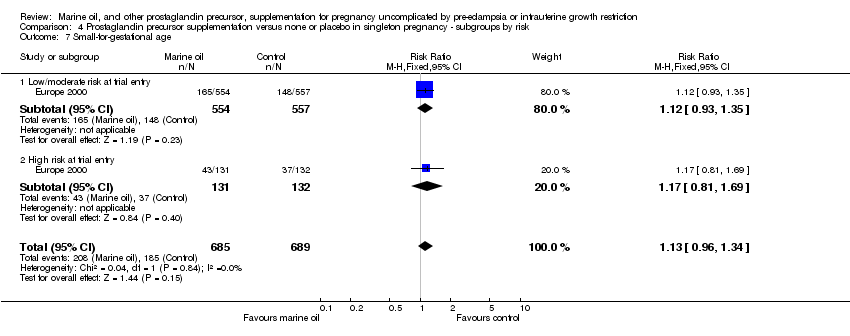
| 21 Small‐for‐gestational age Show forest plot | 1 | 1374 | Risk Ratio (M‐H, Fixed, 95% CI) | 1.13 [0.96, 1.34] |
|
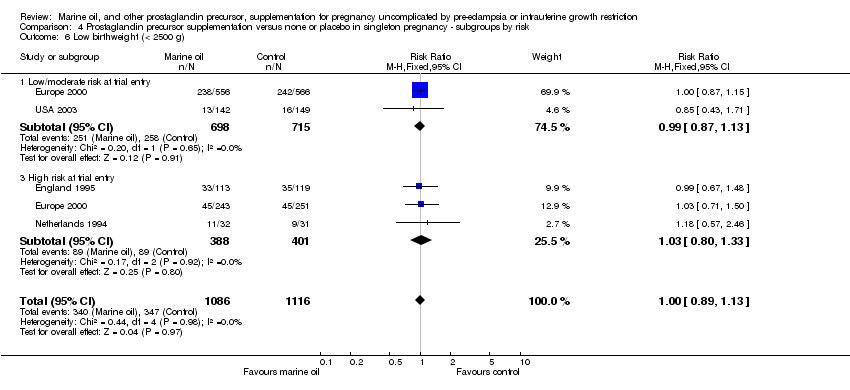
| 22 Low birthweight (< 2500 g) Show forest plot | 5 | 2302 | Risk Ratio (M‐H, Fixed, 95% CI) | 1.00 [0.88, 1.12] |
|
| 23 Very low birthweight (< 1500 g) | 0 | 0 | Risk Ratio (M‐H, Fixed, 95% CI) | 0.0 [0.0, 0.0] |
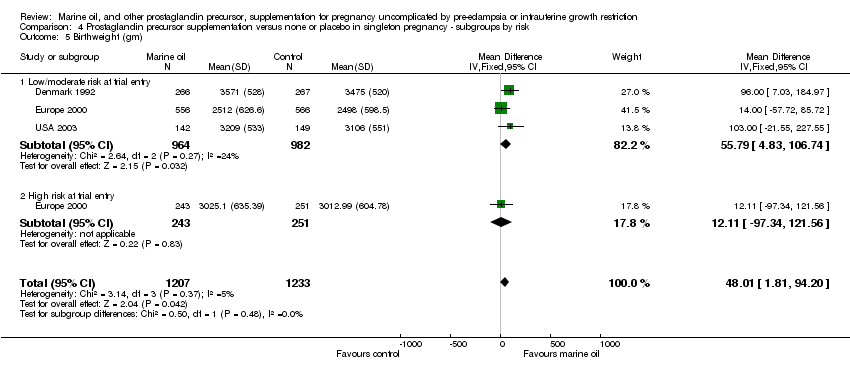
| 24 Birthweight (gm) Show forest plot | 3 | 2440 | Mean Difference (IV, Fixed, 95% CI) | 47.24 [1.05, 93.44] |
|
| 25 Birth length (cm) Show forest plot | 2 | 824 | Mean Difference (IV, Fixed, 95% CI) | 0.48 [0.13, 0.83] |
|
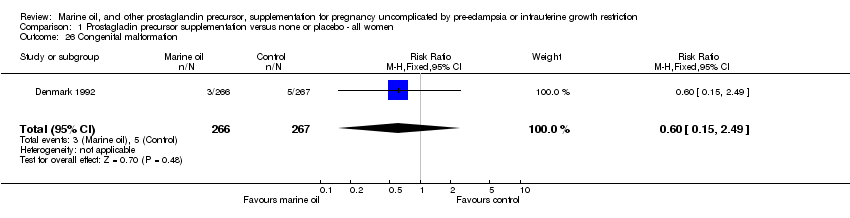
| 26 Congenital malformation Show forest plot | 1 | 533 | Risk Ratio (M‐H, Fixed, 95% CI) | 0.60 [0.15, 2.49] |
|
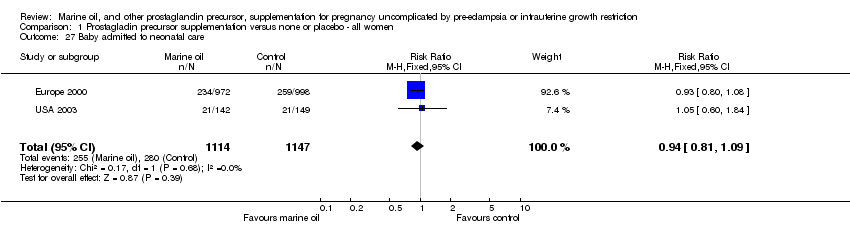
| 27 Baby admitted to neonatal care Show forest plot | 2 | 2261 | Risk Ratio (M‐H, Fixed, 95% CI) | 0.94 [0.81, 1.09] |
|
| 28 Baby's length of stay in hospital (days) Show forest plot | 1 | 1970 | Mean Difference (IV, Fixed, 95% CI) | ‐0.32 [‐1.63, 0.99] |
|
| 29 Neonatal morbidity ‐ bleeding disorders (eg IVH) Show forest plot | 1 | 1974 | Risk Ratio (M‐H, Fixed, 95% CI) | 2.39 [0.62, 9.22] |
|
| 30 Neonatal morbidity ‐ non‐bleeding disorders (eg RDS) Show forest plot | 1 | 75 | Risk Ratio (M‐H, Fixed, 95% CI) | 2.5 [0.11, 59.46] |
|
| 31 Childhood disability | 0 | 0 | Risk Ratio (M‐H, Fixed, 95% CI) | 0.0 [0.0, 0.0] |