| 1 Time from first injection to effective analgesia (minutes) Show forest plot | 4 | 364 | Mean Difference (IV, Fixed, 95% CI) | ‐5.50 [‐6.47, ‐4.52] |
|
| 1.1 CSE vs traditional epidural | 0 | 0 | Mean Difference (IV, Fixed, 95% CI) | 0.0 [0.0, 0.0] |
| 1.2 CSE vs low dose epidural | 3 | 285 | Mean Difference (IV, Fixed, 95% CI) | ‐5.59 [‐6.59, ‐4.58] |
| 1.3 Opioid CSE vs traditional epidural | 1 | 79 | Mean Difference (IV, Fixed, 95% CI) | ‐4.0 [‐8.08, 0.08] |
| 1.4 Opioid CSE vs test LA/opioid epidural | 0 | 0 | Mean Difference (IV, Fixed, 95% CI) | 0.0 [0.0, 0.0] |
| 2 Need for rescue analgesia Show forest plot | 6 | 1097 | Odds Ratio (M‐H, Fixed, 95% CI) | 0.80 [0.60, 1.08] |
|
| 2.1 CSE vs low dose epidural | 4 | 986 | Odds Ratio (M‐H, Fixed, 95% CI) | 0.91 [0.67, 1.24] |
| 2.2 CSE vs traditional epidural | 1 | 42 | Odds Ratio (M‐H, Fixed, 95% CI) | 0.10 [0.02, 0.40] |
| 2.3 Opioid CSE vs traditional epidural | 0 | 0 | Odds Ratio (M‐H, Fixed, 95% CI) | 0.0 [0.0, 0.0] |
| 2.4 Opioid CSE vs test LA/opioid epidural | 1 | 69 | Odds Ratio (M‐H, Fixed, 95% CI) | 0.31 [0.01, 7.99] |
| 2.5 Opioid CSE vs low dose epidural | 0 | 0 | Odds Ratio (M‐H, Fixed, 95% CI) | 0.0 [0.0, 0.0] |
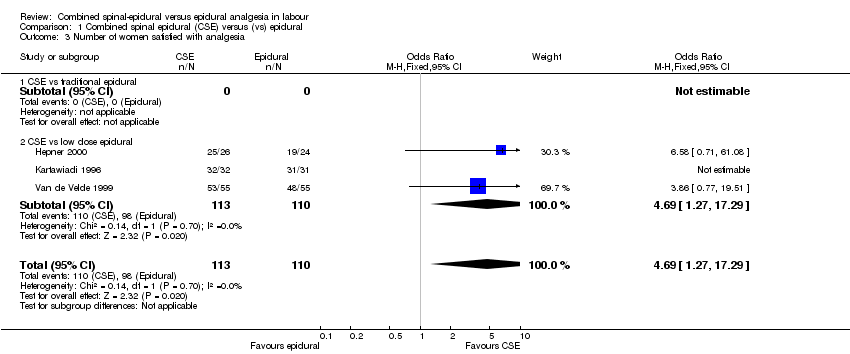
| 3 Number of women satisfied with analgesia Show forest plot | 3 | 223 | Odds Ratio (M‐H, Fixed, 95% CI) | 4.69 [1.27, 17.29] |
|
| 3.1 CSE vs traditional epidural | 0 | 0 | Odds Ratio (M‐H, Fixed, 95% CI) | 0.0 [0.0, 0.0] |
| 3.2 CSE vs low dose epidural | 3 | 223 | Odds Ratio (M‐H, Fixed, 95% CI) | 4.69 [1.27, 17.29] |
| 4 Number of women who mobilise Show forest plot | 5 | 963 | Odds Ratio (M‐H, Fixed, 95% CI) | 1.07 [0.82, 1.39] |
|
| 4.1 CSE vs low dose epidural | 3 | 854 | Odds Ratio (M‐H, Fixed, 95% CI) | 0.99 [0.75, 1.32] |
| 4.2 CSE vs traditional epidural | 0 | 0 | Odds Ratio (M‐H, Fixed, 95% CI) | 0.0 [0.0, 0.0] |
| 4.3 Opioid CSE vs test LA/opioid epidural | 2 | 109 | Odds Ratio (M‐H, Fixed, 95% CI) | 1.99 [0.87, 4.59] |
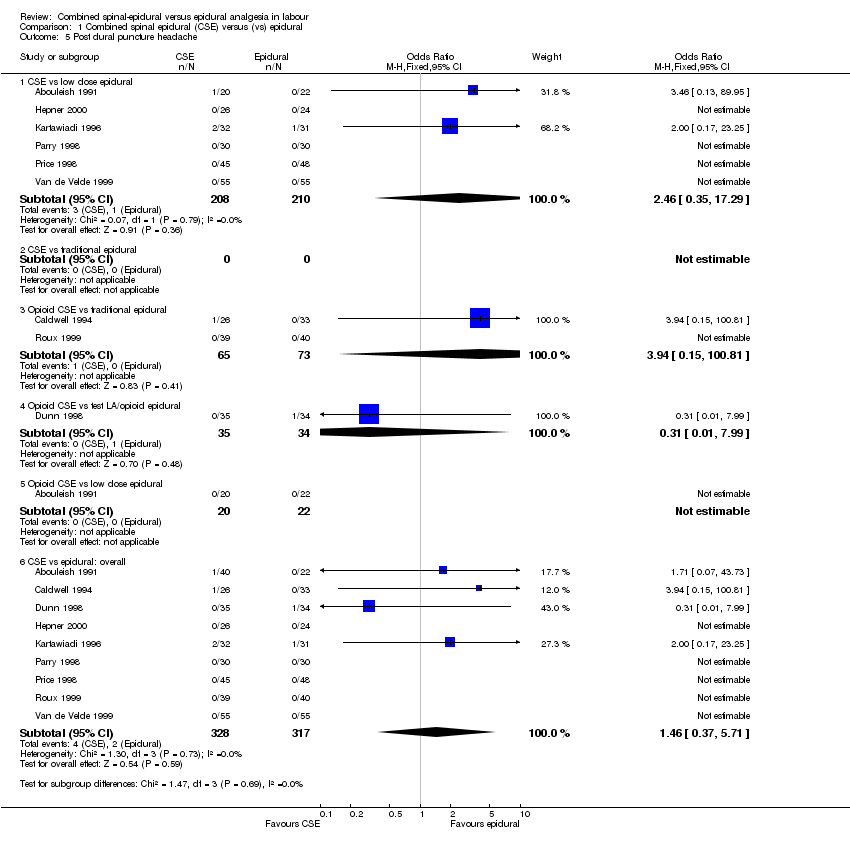
| 5 Post dural puncture headache Show forest plot | 9 | | Odds Ratio (M‐H, Fixed, 95% CI) | Subtotals only |
|
| 5.1 CSE vs low dose epidural | 6 | 418 | Odds Ratio (M‐H, Fixed, 95% CI) | 2.46 [0.35, 17.29] |
| 5.2 CSE vs traditional epidural | 0 | 0 | Odds Ratio (M‐H, Fixed, 95% CI) | 0.0 [0.0, 0.0] |
| 5.3 Opioid CSE vs traditional epidural | 2 | 138 | Odds Ratio (M‐H, Fixed, 95% CI) | 3.94 [0.15, 100.81] |
| 5.4 Opioid CSE vs test LA/opioid epidural | 1 | 69 | Odds Ratio (M‐H, Fixed, 95% CI) | 0.31 [0.01, 7.99] |
| 5.5 Opioid CSE vs low dose epidural | 1 | 42 | Odds Ratio (M‐H, Fixed, 95% CI) | 0.0 [0.0, 0.0] |
| 5.6 CSE vs epidural: overall | 9 | 645 | Odds Ratio (M‐H, Fixed, 95% CI) | 1.46 [0.37, 5.71] |
| 6 Known dural tap Show forest plot | 6 | | Odds Ratio (M‐H, Fixed, 95% CI) | Subtotals only |
|
| 6.1 CSE vs traditional epidural | 1 | 704 | Odds Ratio (M‐H, Fixed, 95% CI) | 0.33 [0.01, 8.23] |
| 6.2 CSE vs low dose epidural | 3 | 893 | Odds Ratio (M‐H, Fixed, 95% CI) | 0.14 [0.01, 2.74] |
| 6.3 Opioid CSE vs traditional epidural | 2 | 138 | Odds Ratio (M‐H, Fixed, 95% CI) | 7.18 [0.84, 61.72] |
| 6.4 Opioid CSE vs test LA/opioid epidural | 1 | 69 | Odds Ratio (M‐H, Fixed, 95% CI) | 0.0 [0.0, 0.0] |
| 6.5 CSE vs epidural: overall | 6 | 1453 | Odds Ratio (M‐H, Fixed, 95% CI) | 1.77 [0.53, 5.94] |
| 7 Number of women requiring blood patch for PDPH Show forest plot | 6 | | Odds Ratio (M‐H, Fixed, 95% CI) | Subtotals only |
|
| 7.1 CSE vs low dose epidural | 3 | 198 | Odds Ratio (M‐H, Fixed, 95% CI) | 5.16 [0.24, 112.01] |
| 7.2 Opioid CSE vs low dose epidural | 2 | 92 | Odds Ratio (M‐H, Fixed, 95% CI) | 0.0 [0.0, 0.0] |
| 7.3 Opioid CSE vs test LA/opioid epidural | 1 | 69 | Odds Ratio (M‐H, Fixed, 95% CI) | 0.31 [0.01, 7.99] |
| 7.4 CSE vs traditional epidural | 0 | 0 | Odds Ratio (M‐H, Fixed, 95% CI) | 0.0 [0.0, 0.0] |
| 7.5 Opioid CSE vs traditional epidural | 1 | 79 | Odds Ratio (M‐H, Fixed, 95% CI) | 0.0 [0.0, 0.0] |
| 7.6 CSE vs epidural: overall | 6 | 416 | Odds Ratio (M‐H, Fixed, 95% CI) | 1.47 [0.24, 8.98] |
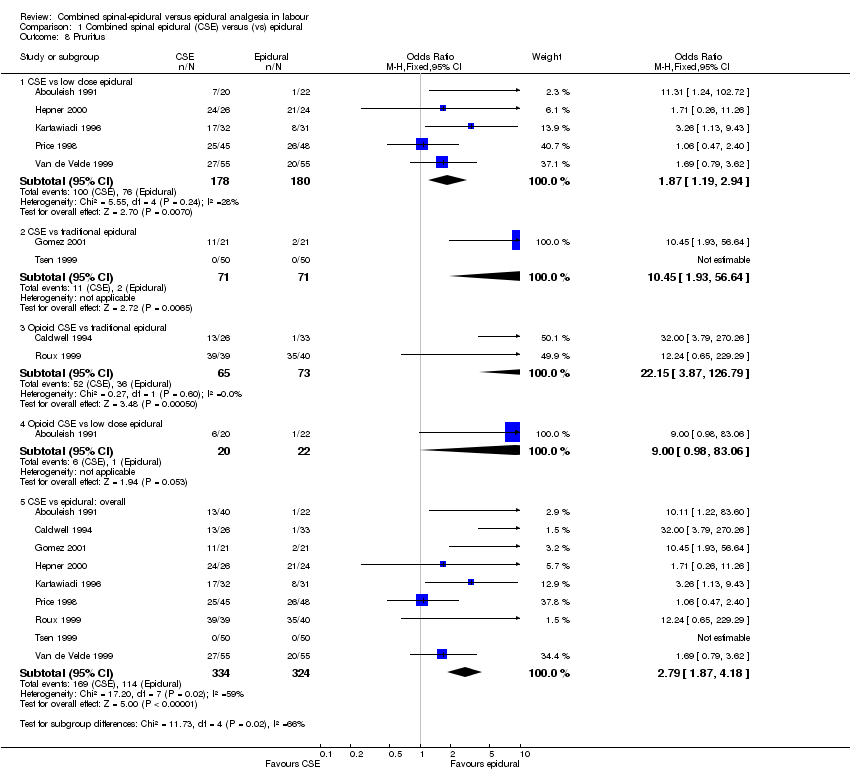
| 8 Pruritus Show forest plot | 9 | | Odds Ratio (M‐H, Fixed, 95% CI) | Subtotals only |
|
| 8.1 CSE vs low dose epidural | 5 | 358 | Odds Ratio (M‐H, Fixed, 95% CI) | 1.87 [1.19, 2.94] |
| 8.2 CSE vs traditional epidural | 2 | 142 | Odds Ratio (M‐H, Fixed, 95% CI) | 10.45 [1.93, 56.64] |
| 8.3 Opioid CSE vs traditional epidural | 2 | 138 | Odds Ratio (M‐H, Fixed, 95% CI) | 22.15 [3.87, 126.79] |
| 8.4 Opioid CSE vs low dose epidural | 1 | 42 | Odds Ratio (M‐H, Fixed, 95% CI) | 9.0 [0.98, 83.06] |
| 8.5 CSE vs epidural: overall | 9 | 658 | Odds Ratio (M‐H, Fixed, 95% CI) | 2.79 [1.87, 4.18] |
| 9 Urinary retention Show forest plot | 2 | | Odds Ratio (M‐H, Fixed, 95% CI) | Subtotals only |
|
| 9.1 CSE vs traditional epidural | 0 | 0 | Odds Ratio (M‐H, Fixed, 95% CI) | 0.0 [0.0, 0.0] |
| 9.2 CSE vs low dose epidural | 2 | 126 | Odds Ratio (M‐H, Fixed, 95% CI) | 0.71 [0.29, 1.73] |
| 9.3 Opioid CSE vs low dose epidural | 1 | 34 | Odds Ratio (M‐H, Fixed, 95% CI) | 2.02 [0.51, 7.94] |
| 9.4 CSE vs epidural: overall | 2 | 142 | Odds Ratio (M‐H, Fixed, 95% CI) | 0.89 [0.39, 2.00] |
| 10 Nausea/vomiting Show forest plot | 8 | | Odds Ratio (M‐H, Fixed, 95% CI) | Subtotals only |
|
| 10.1 CSE vs traditional epidural | 2 | 142 | Odds Ratio (M‐H, Fixed, 95% CI) | 0.21 [0.02, 2.09] |
| 10.2 CSE vs low dose epidural | 3 | 202 | Odds Ratio (M‐H, Fixed, 95% CI) | 1.16 [0.54, 2.46] |
| 10.3 Opioid CSE vs traditional epidural | 2 | 138 | Odds Ratio (M‐H, Fixed, 95% CI) | 2.10 [1.03, 4.29] |
| 10.4 Opioid CSE vs test LA/opioid epidural | 1 | 69 | Odds Ratio (M‐H, Fixed, 95% CI) | 0.96 [0.30, 3.12] |
| 10.5 Opioid CSE vs low dose epidural | 1 | 42 | Odds Ratio (M‐H, Fixed, 95% CI) | 12.27 [0.62, 244.05] |
| 10.6 CSE vs epidural: overall | 8 | 571 | Odds Ratio (M‐H, Fixed, 95% CI) | 1.36 [0.87, 2.14] |
| 11 Hypotension Show forest plot | 10 | 791 | Odds Ratio (M‐H, Fixed, 95% CI) | 0.98 [0.39, 2.44] |
|
| 11.1 CSE vs traditional epidural | 2 | 142 | Odds Ratio (M‐H, Fixed, 95% CI) | 0.0 [0.0, 0.0] |
| 11.2 CSE vs low dose epidural | 6 | 501 | Odds Ratio (M‐H, Fixed, 95% CI) | 1.26 [0.46, 3.44] |
| 11.3 Opioid CSE vs traditional epidural | 1 | 79 | Odds Ratio (M‐H, Fixed, 95% CI) | 0.19 [0.01, 4.19] |
| 11.4 Opioid CSE vs test LA/opioid epidural | 1 | 69 | Odds Ratio (M‐H, Fixed, 95% CI) | 0.0 [0.0, 0.0] |
| 12 Respiratory depression Show forest plot | 5 | | Odds Ratio (M‐H, Fixed, 95% CI) | Subtotals only |
|
| 12.1 CSE vs traditional epidural | 0 | 0 | Odds Ratio (M‐H, Fixed, 95% CI) | 0.0 [0.0, 0.0] |
| 12.2 CSE vs low dose epidural | 2 | 92 | Odds Ratio (M‐H, Fixed, 95% CI) | 0.0 [0.0, 0.0] |
| 12.3 Opioid CSE vs traditional epidural | 2 | 138 | Odds Ratio (M‐H, Fixed, 95% CI) | 0.0 [0.0, 0.0] |
| 12.4 Opioid CSE vs test LA/opioid epidural | 1 | 69 | Odds Ratio (M‐H, Fixed, 95% CI) | 0.0 [0.0, 0.0] |
| 12.5 Opioid CSE vs low dose epidural | 1 | 42 | Odds Ratio (M‐H, Fixed, 95% CI) | 0.0 [0.0, 0.0] |
| 13 Headache (any) Show forest plot | 2 | 189 | Odds Ratio (M‐H, Fixed, 95% CI) | 0.33 [0.05, 2.11] |
|
| 13.1 Opioid CSE vs traditional epidural | 1 | 79 | Odds Ratio (M‐H, Fixed, 95% CI) | 1.03 [0.06, 17.01] |
| 13.2 CSE vs low dose epidural | 1 | 110 | Odds Ratio (M‐H, Fixed, 95% CI) | 0.14 [0.01, 2.68] |
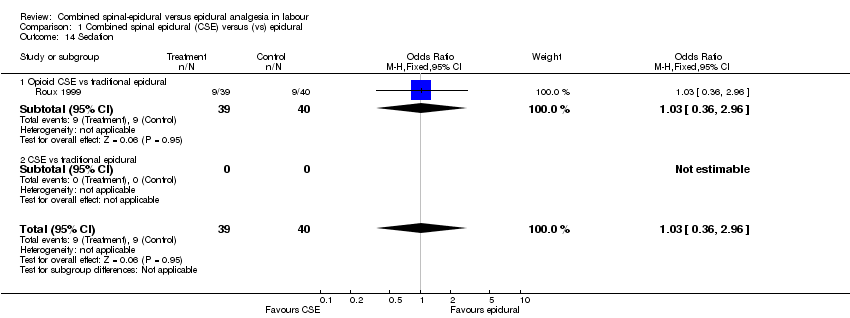
| 14 Sedation Show forest plot | 1 | 79 | Odds Ratio (M‐H, Fixed, 95% CI) | 1.03 [0.36, 2.96] |
|
| 14.1 Opioid CSE vs traditional epidural | 1 | 79 | Odds Ratio (M‐H, Fixed, 95% CI) | 1.03 [0.36, 2.96] |
| 14.2 CSE vs traditional epidural | 0 | 0 | Odds Ratio (M‐H, Fixed, 95% CI) | 0.0 [0.0, 0.0] |
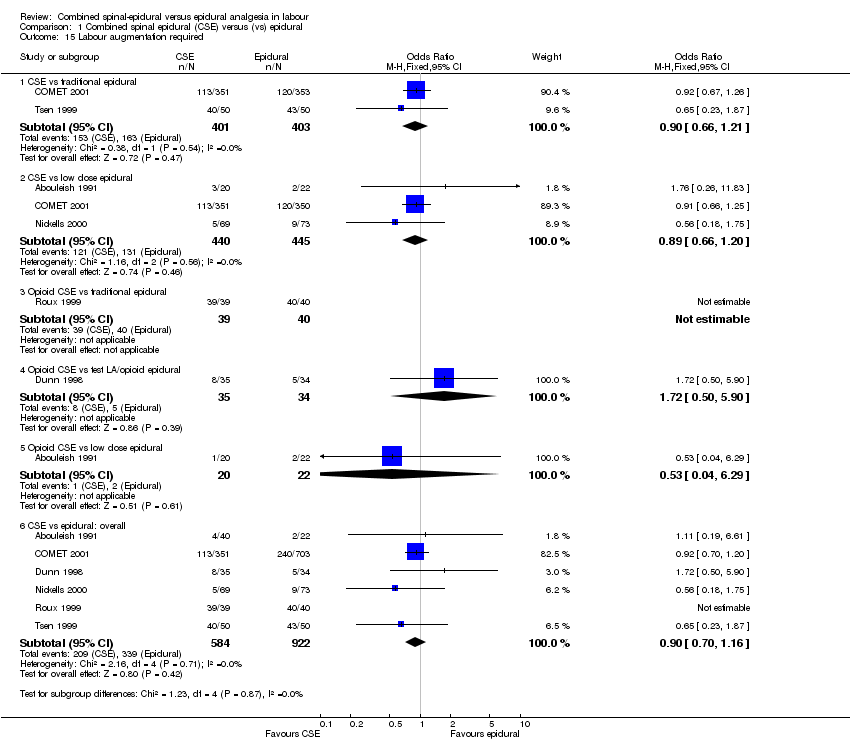
| 15 Labour augmentation required Show forest plot | 6 | | Odds Ratio (M‐H, Fixed, 95% CI) | Subtotals only |
|
| 15.1 CSE vs traditional epidural | 2 | 804 | Odds Ratio (M‐H, Fixed, 95% CI) | 0.90 [0.66, 1.21] |
| 15.2 CSE vs low dose epidural | 3 | 885 | Odds Ratio (M‐H, Fixed, 95% CI) | 0.89 [0.66, 1.20] |
| 15.3 Opioid CSE vs traditional epidural | 1 | 79 | Odds Ratio (M‐H, Fixed, 95% CI) | 0.0 [0.0, 0.0] |
| 15.4 Opioid CSE vs test LA/opioid epidural | 1 | 69 | Odds Ratio (M‐H, Fixed, 95% CI) | 1.72 [0.50, 5.90] |
| 15.5 Opioid CSE vs low dose epidural | 1 | 42 | Odds Ratio (M‐H, Fixed, 95% CI) | 0.53 [0.04, 6.29] |
| 15.6 CSE vs epidural: overall | 6 | 1506 | Odds Ratio (M‐H, Fixed, 95% CI) | 0.90 [0.70, 1.16] |
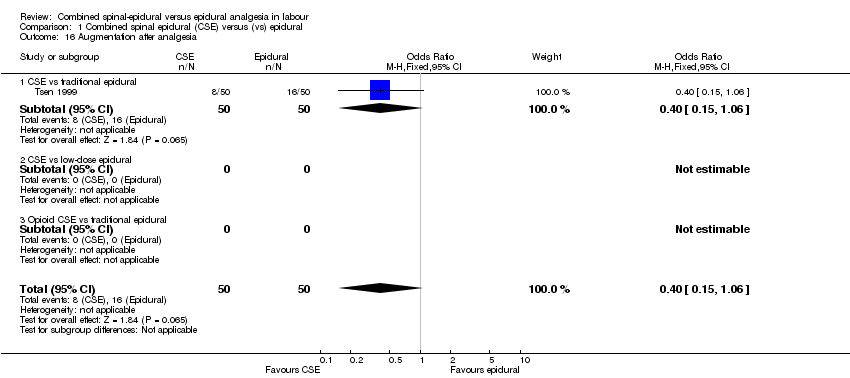
| 16 Augmentation after analgesia Show forest plot | 1 | 100 | Odds Ratio (M‐H, Fixed, 95% CI) | 0.40 [0.15, 1.06] |
|
| 16.1 CSE vs traditional epidural | 1 | 100 | Odds Ratio (M‐H, Fixed, 95% CI) | 0.40 [0.15, 1.06] |
| 16.2 CSE vs low‐dose epidural | 0 | 0 | Odds Ratio (M‐H, Fixed, 95% CI) | 0.0 [0.0, 0.0] |
| 16.3 Opioid CSE vs traditional epidural | 0 | 0 | Odds Ratio (M‐H, Fixed, 95% CI) | 0.0 [0.0, 0.0] |
| 17 Normal delivery Show forest plot | 12 | | Odds Ratio (M‐H, Fixed, 95% CI) | Subtotals only |
|
| 17.1 CSE vs low dose epidural | 7 | 1119 | Odds Ratio (M‐H, Fixed, 95% CI) | 0.96 [0.75, 1.23] |
| 17.2 CSE vs traditional epidural | 3 | 846 | Odds Ratio (M‐H, Fixed, 95% CI) | 1.31 [0.99, 1.73] |
| 17.3 Opioid CSE vs traditional epidural | 2 | 138 | Odds Ratio (M‐H, Fixed, 95% CI) | 0.56 [0.26, 1.20] |
| 17.4 Opioid CSE vs test LA/opioid epidural | 1 | 69 | Odds Ratio (M‐H, Fixed, 95% CI) | 0.86 [0.26, 2.87] |
| 17.5 Opioid CSE vs low‐dose epidural | 1 | 42 | Odds Ratio (M‐H, Fixed, 95% CI) | 0.89 [0.19, 4.15] |
| 17.6 CSE vs epidural: overall | 12 | 1841 | Odds Ratio (M‐H, Fixed, 95% CI) | 1.03 [0.84, 1.25] |
| 18 Instrumental delivery Show forest plot | 10 | | Odds Ratio (M‐H, Fixed, 95% CI) | Subtotals only |
|
| 18.1 CSE vs low‐dose epidural | 6 | 1059 | Odds Ratio (M‐H, Fixed, 95% CI) | 1.07 [0.80, 1.43] |
| 18.2 CSE vs traditional epidural | 3 | 846 | Odds Ratio (M‐H, Fixed, 95% CI) | 0.72 [0.54, 0.97] |
| 18.3 Opioid CSE vs low‐dose epidural | 1 | 42 | Odds Ratio (M‐H, Fixed, 95% CI) | 0.0 [0.0, 0.0] |
| 18.4 Opioid CSE vs traditional epidural | 1 | 79 | Odds Ratio (M‐H, Fixed, 95% CI) | 1.53 [0.44, 5.31] |
| 18.5 Opioid CSE vs test LA/opioid epidural | 1 | 69 | Odds Ratio (M‐H, Fixed, 95% CI) | 0.97 [0.13, 7.31] |
| 18.6 CSE vs epidural: overall | 10 | 1722 | Odds Ratio (M‐H, Fixed, 95% CI) | 0.91 [0.72, 1.15] |
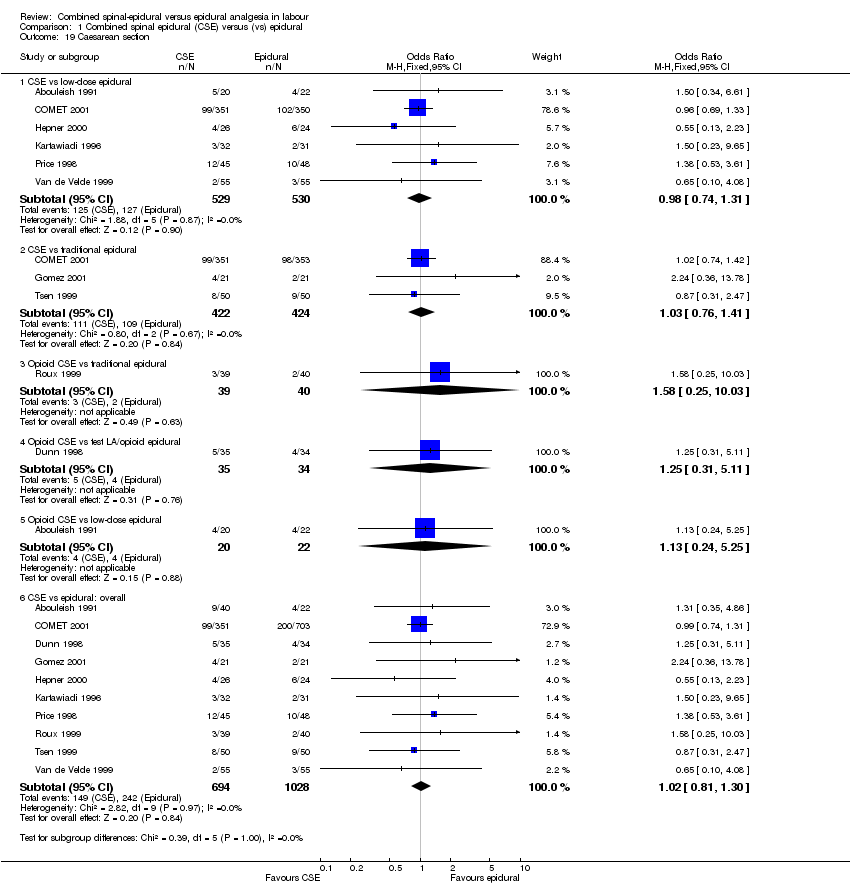
| 19 Caesarean section Show forest plot | 10 | | Odds Ratio (M‐H, Fixed, 95% CI) | Subtotals only |
|
| 19.1 CSE vs low‐dose epidural | 6 | 1059 | Odds Ratio (M‐H, Fixed, 95% CI) | 0.98 [0.74, 1.31] |
| 19.2 CSE vs traditional epidural | 3 | 846 | Odds Ratio (M‐H, Fixed, 95% CI) | 1.03 [0.76, 1.41] |
| 19.3 Opioid CSE vs traditional epidural | 1 | 79 | Odds Ratio (M‐H, Fixed, 95% CI) | 1.58 [0.25, 10.03] |
| 19.4 Opioid CSE vs test LA/opioid epidural | 1 | 69 | Odds Ratio (M‐H, Fixed, 95% CI) | 1.25 [0.31, 5.11] |
| 19.5 Opioid CSE vs low‐dose epidural | 1 | 42 | Odds Ratio (M‐H, Fixed, 95% CI) | 1.13 [0.24, 5.25] |
| 19.6 CSE vs epidural: overall | 10 | 1722 | Odds Ratio (M‐H, Fixed, 95% CI) | 1.02 [0.81, 1.30] |
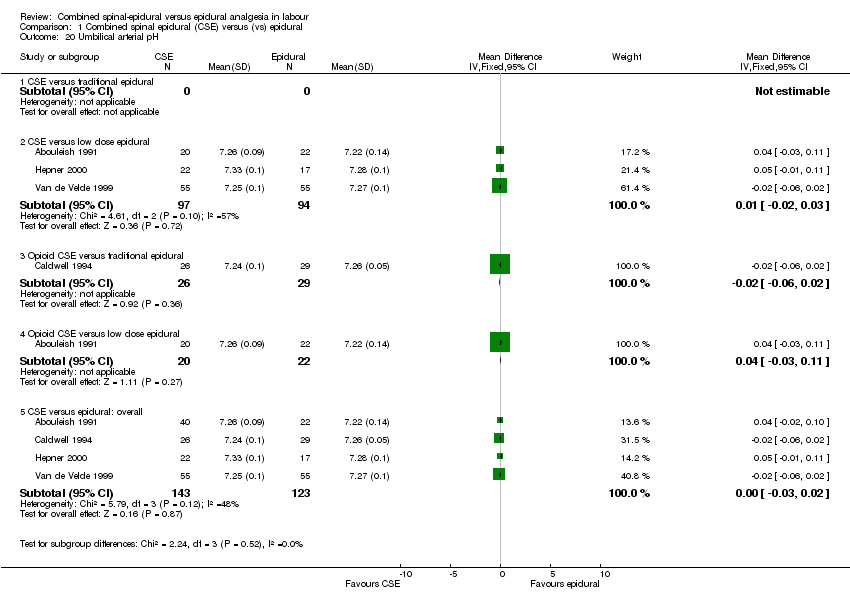
| 20 Umbilical arterial pH Show forest plot | 4 | | Mean Difference (IV, Fixed, 95% CI) | Subtotals only |
|
| 20.1 CSE versus traditional epidural | 0 | 0 | Mean Difference (IV, Fixed, 95% CI) | 0.0 [0.0, 0.0] |
| 20.2 CSE versus low dose epidural | 3 | 191 | Mean Difference (IV, Fixed, 95% CI) | 0.01 [‐0.02, 0.03] |
| 20.3 Opioid CSE versus traditional epidural | 1 | 55 | Mean Difference (IV, Fixed, 95% CI) | ‐0.02 [‐0.06, 0.02] |
| 20.4 Opioid CSE versus low dose epidural | 1 | 42 | Mean Difference (IV, Fixed, 95% CI) | 0.04 [‐0.03, 0.11] |
| 20.5 CSE versus epidural: overall | 4 | 266 | Mean Difference (IV, Fixed, 95% CI) | ‐0.00 [‐0.03, 0.02] |
| 21 Umbilical venous pH Show forest plot | 3 | | Mean Difference (IV, Fixed, 95% CI) | Subtotals only |
|
| 21.1 CSE versus traditional epidural | 0 | 0 | Mean Difference (IV, Fixed, 95% CI) | 0.0 [0.0, 0.0] |
| 21.2 CSE versus low dose epidural | 2 | 85 | Mean Difference (IV, Fixed, 95% CI) | 0.03 [‐0.00, 0.07] |
| 21.3 Opioid CSE versus traditional epidural | 1 | 55 | Mean Difference (IV, Fixed, 95% CI) | ‐0.03 [‐0.06, ‐0.00] |
| 21.4 Opioid CSE versus low dose epidural | 1 | 42 | Mean Difference (IV, Fixed, 95% CI) | 0.04 [‐0.00, 0.08] |
| 21.5 CSE versus epidural: overall | 3 | 160 | Mean Difference (IV, Fixed, 95% CI) | ‐0.01 [‐0.03, 0.02] |
| 22 Umbilical cord pH Show forest plot | 1 | 110 | Mean Difference (IV, Fixed, 95% CI) | ‐0.02 [‐0.05, 0.01] |
|
| 22.1 CSE versus low dose epidural | 1 | 110 | Mean Difference (IV, Fixed, 95% CI) | ‐0.02 [‐0.05, 0.01] |
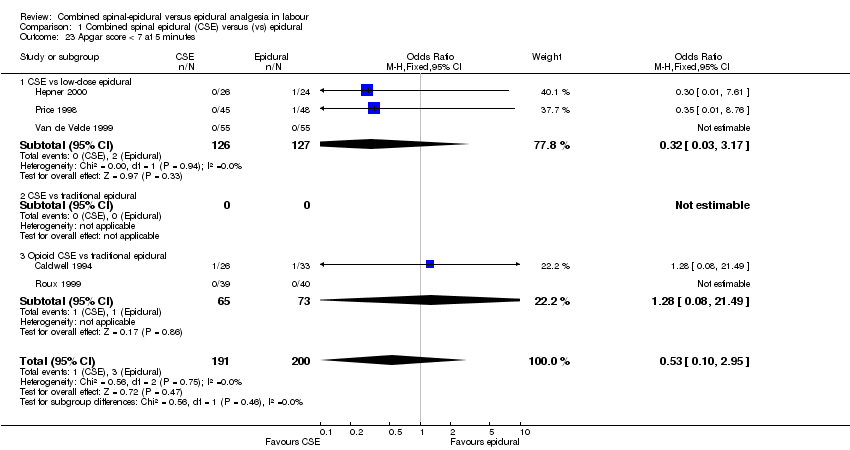
| 23 Apgar score < 7 at 5 minutes Show forest plot | 5 | 391 | Odds Ratio (M‐H, Fixed, 95% CI) | 0.53 [0.10, 2.95] |
|
| 23.1 CSE vs low‐dose epidural | 3 | 253 | Odds Ratio (M‐H, Fixed, 95% CI) | 0.32 [0.03, 3.17] |
| 23.2 CSE vs traditional epidural | 0 | 0 | Odds Ratio (M‐H, Fixed, 95% CI) | 0.0 [0.0, 0.0] |
| 23.3 Opioid CSE vs traditional epidural | 2 | 138 | Odds Ratio (M‐H, Fixed, 95% CI) | 1.28 [0.08, 21.49] |
| 24 Apgar score < 8 at 5 minutes Show forest plot | 4 | | Odds Ratio (M‐H, Fixed, 95% CI) | Subtotals only |
|
| 24.1 CSE vs traditional epidural | 1 | 704 | Odds Ratio (M‐H, Fixed, 95% CI) | 2.37 [0.61, 9.26] |
| 24.2 CSE vs low‐dose epidural | 4 | 866 | Odds Ratio (M‐H, Fixed, 95% CI) | 0.80 [0.32, 2.00] |
| 24.3 Opioid CSE vs low‐dose epidural | 1 | 42 | Odds Ratio (M‐H, Fixed, 95% CI) | 3.46 [0.13, 89.95] |
| 24.4 CSE vs epidural: overall | 4 | 1239 | Odds Ratio (M‐H, Fixed, 95% CI) | 1.22 [0.52, 2.83] |
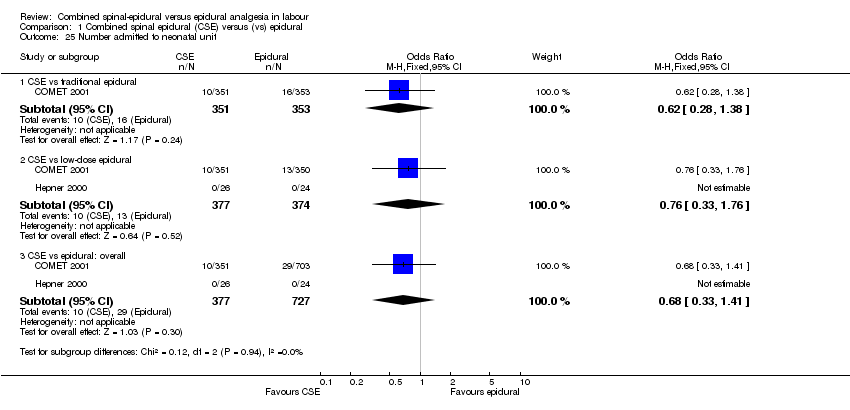
| 25 Number admitted to neonatal unit Show forest plot | 2 | | Odds Ratio (M‐H, Fixed, 95% CI) | Subtotals only |
|
| 25.1 CSE vs traditional epidural | 1 | 704 | Odds Ratio (M‐H, Fixed, 95% CI) | 0.62 [0.28, 1.38] |
| 25.2 CSE vs low‐dose epidural | 2 | 751 | Odds Ratio (M‐H, Fixed, 95% CI) | 0.76 [0.33, 1.76] |
| 25.3 CSE vs epidural: overall | 2 | 1104 | Odds Ratio (M‐H, Fixed, 95% CI) | 0.68 [0.33, 1.41] |