Fertilización in vitro para la subfertilidad inexplicada
Referencias
References to studies included in this review
References to studies excluded from this review
References to ongoing studies
Additional references
Characteristics of studies
Characteristics of included studies [ordered by study ID]
| Methods | Multi‐centre open‐label 3‐arm parallel‐group randomised controlled non‐inferiority trial | |
| Participants | 602 couples seeking fertility treatment after ≥ 12 months of unprotected intercourse, with the female partner between 18 and 38 years, an unfavourable prognosis for natural conception and a diagnosis of unexplained or mild male subfertility. Exclusion criteria included anovulation, double‐sided tubal disease, severe endometriosis, premature ovarian failure and known endocrine disorders (e.g. Cushing syndrome, adrenal hyperplasia) | |
| Interventions | Three cycles of IVF‐SET (plus subsequent cryo‐cycles), six cycles of modified natural cycle IVF and six cycles of IUI‐COH within 12 months after randomisation. Any additional treatments provided during this period were included at follow‐up | |
| Outcomes | Main outcome measures: The primary outcome was birth of a healthy child resulting from a singleton pregnancy conceived within 12 months after randomisation. Secondary outcomes included live birth, clinical pregnancy, ongoing pregnancy, multiple pregnancy, time to pregnancy, pregnancy complications and neonatal morbidity and mortality | |
| Notes | States: "During our trial the results of a pilot study, randomising women to three cycles of IUI‐COH or one cycle of IVF‐SET, were published. This pilot study demonstrated that the policy of transferring two embryos when no good quality embryos are available is not effective in preventing multiple pregnancies. The study protocol was amended, and from February 2010, after allocation of 48 women to the IVF‐SET group, a strict single embryo transfer policy (i.e. single embryo transfer was performed irrespective of embryo quality) was implemented" | |
| Risk of bias | ||
| Bias | Authors' judgement | Support for judgement |
| Random sequence generation (selection bias) | Low risk | Randomisation was performed with an "online randomisation program, using biased coin minimisation, stratified for study centre" |
| Allocation concealment (selection bias) | Low risk | "A web based program generated a unique number with allocation code after entry of the patient’s initials and date of birth. Neither the recruiters nor the trial project group could access the randomisation sequence" |
| Blinding (performance bias and detection bias) | Unclear risk | Blinding was not possible because of the nature of the interventions |
| Incomplete outcome data (attrition bias) | Low risk | 602/602 randomly assigned women were included in the ITT analysis |
| Selective reporting (reporting bias) | Low risk | All expected outcomes were reported |
| Other bias | Low risk | None was suspected |
| Methods | Randomised controlled parallel trial | |
| Participants | 44 couples Inclusion criteria Adults who had primary or secondary infertility ≥ 1 year in duration with evidence of ovulation and tubal patency, aged 18 to 42 years for females and 18 to 60 years for males Exclusion criteria IUI or IVF treatment in the previous 12 months, coital disorder, untreated ovulatory disorders or endometriosis (American Fertility Society criteria grades 2 to 4), tubal obstruction, abnormal semen analyses (concentration < 20 × 106/mL, progressive motility < 25%, abnormal morphology > 95% or positive sperm antibodies) or any contraindication for multiple pregnancy | |
| Interventions | IVF vs IUI | |
| Outcomes | Live birth rate, clinical pregnancy rate, multiple pregnancy rate, OHSS, cost per live birth | |
| Notes | Financial support provided by a pharmaceutical company | |
| Risk of bias | ||
| Bias | Authors' judgement | Support for judgement |
| Random sequence generation (selection bias) | Low risk | "computer‐generated, adaptive‐biased coin randomisation schedule" |
| Allocation concealment (selection bias) | Low risk | "sequentially numbered opaque sealed envelopes" |
| Blinding (performance bias and detection bias) | Unclear risk | This was not mentioned |
| Incomplete outcome data (attrition bias) | Low risk | 43/44 randomly assigned women were included in the analysis |
| Selective reporting (reporting bias) | Low risk | Study reported primary and secondary treatment outcomes adequately including adverse outcomes |
| Other bias | Low risk | No other potential bias could be observed |
| Methods | Randomised controlled parallel trial, with clinicians blinded to outcome determinations. Intention‐to‐treat analysis performed, numbers of and reasons for withdrawals and dropouts stated, clearly defined interventions applied with standardised protocols, couples followed up until discharge from the hospital of both mother and infant(s), if pregnant, or 1 year after completion of treatment protocol. Tables with permuted blocks of varying sizes, stratified by the woman's age (38th to 41st vs 42nd to 43rd birthday) | |
| Participants | 154 couples Inclusion criteria Couples in which the woman had 38 to 42 years 6 months of attempted conception; at least 1 ovary and ipsilateral patent fallopian tube confirmed by hysterosalpingogram or laparoscopy; regular menstrual cycles of 21 to 45 days; and no pelvic pathology, ectopic pregnancy nor previous infertility treatment (except up to 3 cycles of clomiphene without IUI). Normal prolactin and thyroid‐stimulating hormone levels and body mass index (BMI) < 38 in the woman; sperm concentration > 15 million total motile sperm or > 5 million total motile sperm at reflex IUI preparation in the male partner Exclusion criteria Age outside the range, prior infertility treatment or not a candidate for study treatments, or not covered by a participating insurer | |
| Interventions | Three‐arm randomised controlled trial. Couples were randomly assigned to treatment with 2 cycles of clomiphene citrate (CC) and intrauterine insemination (IUI), follicle‐stimulating hormone (FSH)/IUI or immediate IVF, followed by by 3 cycles of IVF if not pregnant | |
| Outcomes | Live birth, clinical pregnancy, multiple pregnancy and time to conception were reported | |
| Notes | Population of the study consisted of women with relatively advanced reproductive age | |
| Risk of bias | ||
| Bias | Authors' judgement | Support for judgement |
| Random sequence generation (selection bias) | Low risk | "The allocation sequence was generated by an independent biostatistician", using tables with permuted blocks of varying sizes, stratified by the woman's age (38th to 41st vs 42nd to 43rd birthday) |
| Allocation concealment (selection bias) | Low risk | Remote allocation: "The allocation sequence was ... implemented by an epidemiologist. Randomization was never conducted by clinical staff" |
| Blinding (performance bias and detection bias) | Low risk | All clinical investigators were blinded to outcome determinations |
| Incomplete outcome data (attrition bias) | Low risk | 154/154 randomly assigned women were included in the ITT analysis |
| Selective reporting (reporting bias) | Low risk | Live birth, clinical pregnancy, multiple pregnancy and time to conception were reported |
| Other bias | Low risk | No other potential bias could be observed |
| Methods | Randomised controlled parallel trial, participants and providers unable to be blinded, intention‐to‐treat analysis performed, numbers of and reasons for withdrawals and dropouts stated, clearly defined interventions applied with standardised protocols, overall duration of follow‐up 6 cycles. Computer‐generated randomisation schedule, administered by numbered masked and sealed envelopes | |
| Participants | 181 women with unexplained or mild male factor infertility of at least 3 years' duration or male subfertility for ≥ 1 year, with no abnormality found during full infertility investigation, which included basal body temperature chart, late luteal phase endometrial biopsy, postcoital test, hysterosalpingogram, diagnostic laparoscopy and ≥ 2 semen analyses. Exclusion criteria included cycle disorders, untreated endometriosis (AFS grade 2 to 4), and bilateral occluded tubes. | |
| Interventions | IVF vs IUI and IVF vs intrauterine insemination plus ovarian stimulation (IUI + SO) | |
| Outcomes | LBR per woman/couple | |
| Notes | Power calculation mentioned | |
| Risk of bias | ||
| Bias | Authors' judgement | Support for judgement |
| Random sequence generation (selection bias) | Low risk | Randomisation was computer‐generated |
| Allocation concealment (selection bias) | Low risk | "numbered masked and sealed envelopes" |
| Blinding (performance bias and detection bias) | Unclear risk | This was not mentioned |
| Incomplete outcome data (attrition bias) | Low risk | 172/181 (95%) randomly assigned women with idiopathic subfertility were included in the analysis |
| Selective reporting (reporting bias) | Low risk | Study reported primary and secondary treatment outcomes adequately including adverse outcomes |
| Other bias | Low risk | Pre‐study power calculation was performed, and no other potential bias was observed |
| Methods | 139 women in a multi‐centre randomised controlled trial (RCT). Randomisation was based on a blocked schedule using numbered, sealed, opaque envelopes and stratified by centre; female age (≥ 35 years) and presence or absence of abnormal sperm (total sperm count ≥ 20 million). Power calculation done. Intention‐to‐treat analysis performed. Fisher's exact test used for analysis. Confidence intervals calculated using Mantel‐Haenszel statistics | |
| Participants | Duration of subfertility ≥ 2 years (defined as no live birth during that time), no previous IVF treatment, female age 18 to 39 years, day 3 serum follicle‐stimulating hormone (FSH) level ≥ 15 IU/L or standard level for inclusion in an individual centre's IVF programme, whichever level was lower; semen analysis within past 6 months showing adequate sperm number to perform intracytoplasmic sperm injection (ICSI), evidence of tubal patency by hysterosalpingography or laparoscopy Mean duration of subfertility was 58 months. All couples had exhausted appropriate lower intensity treatment options, such as ovulation induction and intrauterine insemination. | |
| Interventions | First cycle of IVF compared with 90 days of no treatment (expectant management) | |
| Outcomes | Clinically viable pregnancy rate per couple, LBR per couple | |
| Notes | ||
| Risk of bias | ||
| Bias | Authors' judgement | Support for judgement |
| Random sequence generation (selection bias) | Low risk | States: "Random allocation was based on a blocked schedule using numbered, sealed, opaque envelopes" |
| Allocation concealment (selection bias) | Low risk | "Random allocation was based on a blocked schedule using numbered, sealed, opaque envelopes" |
| Blinding (performance bias and detection bias) | Unclear risk | This was not mentioned |
| Incomplete outcome data (attrition bias) | Low risk | 68/68 randomly assigned women analysed by intention‐to‐treat |
| Selective reporting (reporting bias) | Low risk | Study reported primary and secondary treatment outcomes adequately including adverse outcomes |
| Other bias | High risk | Pre‐study power calculation was performed,.and no other potential bias could be observed |
| Methods | RCT using permuted blocks of varying sizes, stratified by woman's age (< 35 vs ≥ 35 years), laparoscopy within past year (yes or no) and study site (Boston IVF or Harvard Vanguard Medical Associates). Allocation sequence was produced by random numbers generated by a congruence method. Investigators were blinded to all outcome determinations | |
| Participants | 503 couples; women 21 to 39 years of age with unexplained infertility and mild male factor of 12 months' duration | |
| Interventions | Couples in this study were randomly assigned to conventional pathway involving clomiphene citrate plus intrauterine insemination (CC + IUI) followed by IUI + gonadotropins and then IVF; or accelerated pathway (CC + IUI followed by 6 cycles of IVF) | |
| Outcomes | Pregnancy rate per cycle, pregnancy rate per couple, LBR per cycle, LBR per couple, time to pregnancy, charge data | |
| Notes | Study could not be included for comparison between IVF and IUI + CC, as both arms received CC + IUI | |
| Risk of bias | ||
| Bias | Authors' judgement | Support for judgement |
| Random sequence generation (selection bias) | Low risk | "The allocation sequence was produced by use of random numbers generated by a congruence method. The sequence was developed by the biostatistician |
| Allocation concealment (selection bias) | Low risk | Apparently remote allocation: "The sequence was ...implemented by the epidemiologist" |
| Blinding (performance bias and detection bias) | Low risk | Investigators were blinded to all outcome determinations; allocation was performed by a biostatistician and was implemented by an epidemiologist |
| Incomplete outcome data (attrition bias) | Low risk | 503/503 randomly assigned women analysed by intention‐to‐treat |
| Selective reporting (reporting bias) | Low risk | Study authors published preliminary results in 2007 and did not appear to publish or failed to publish based on results of the trial |
| Other bias | Low risk | No other potential biases could be detected |
| Methods | RCT; participant and provider could not be blinded. Follow‐up was 1 cycle in the IVF group and 6 months in the expectant management group | |
| Participants | 245 couples with infertility for 1 year, completed investigation for infertility, woman < 40 years. Mean duration of infertility 65 months, all previously treated by conventional means. Only 35 couples had unexplained infertility and are included in analysis in this review | |
| Interventions | IVF vs expectant management. Duration of expectant management was 6 months, during which time other treatments (apart from IVF) were permitted | |
| Outcomes | Pregnancy rate per woman/couple | |
| Notes | Computer‐generated random number table. 16 cycles (16.2%) cancelled after start of treatment for various reasons For couples randomly assigned to expectant treatment, any form of infertility treatment other than IVF was permitted for the 6‐months expectant management arm. 78% of couples received some form of infertility treatment except IVF while in the expectant arm Despite randomisation, a significant difference was noted between mean ages of participants in the 2 arms of the study | |
| Risk of bias | ||
| Bias | Authors' judgement | Support for judgement |
| Random sequence generation (selection bias) | Low risk | Randomisation was computer‐generated |
| Allocation concealment (selection bias) | Unclear risk | This was not mentioned |
| Blinding (performance bias and detection bias) | Unclear risk | No blinding was performed because of the nature of the intervention used |
| Incomplete outcome data (attrition bias) | High risk | No intention‐to‐treat analysis was performed. 19% of participants overall withdrew (unclear how many with unexplained infertility withdrew) |
| Selective reporting (reporting bias) | Unclear risk | Information was insufficient for judgement of the trial as low risk or high risk |
| Other bias | High risk | Withdrawals were numerous; exact time of withdrawal was not defined, especially for the expectant management group. Groups were not balanced with regard to prognostic factors: IVF group were older and had higher proportion with endometriosis |
| Methods | Multi‐centre RCT | |
| Participants | 116 couples with unexplained and mild male factor infertility. All couples had a standard fertility workup, including assessment of ovulation by basal temperature curve or ultrasound, a tubal patency test and sperm analysis. This study included all couples with unexplained or mild male subfertility, female age between 18 and 38 years and poor fertility prospects, defined as a 12‐month prognosis < 30% for natural conception according to the model of Hunault 2004 | |
| Interventions | 1 cycle of IVF–eSET followed by 1 cryocycle or 3 cycles of IUI–ovarian stimulation. Results of freeze–thaw cycles were also included in this study, provided the transfer took place within 4 months after randomisation | |
| Outcomes | Ongoing pregnancy rate per woman/couple, cost per cycle | |
| Notes | Additional data on methods and outcomes were requested from lead author | |
| Risk of bias | ||
| Bias | Authors' judgement | Support for judgement |
| Random sequence generation (selection bias) | Low risk | Central Internet‐based randomisation was stratified by centre |
| Allocation concealment (selection bias) | Unclear risk | This was not mentioned |
| Blinding (performance bias and detection bias) | Unclear risk | This was not mentioned |
| Incomplete outcome data (attrition bias) | Low risk | Intention‐to‐treat analysis was performed |
| Selective reporting (reporting bias) | Low risk | No other reports on the trial could be retrieved |
| Other bias | Low risk | No other potential bias was noted |
Abbreviations:
AFS: American Fertility Society.
eSET: elective single embryo transfer.
FSH: follicle‐stimulating hormone.
ICSI: intracytoplasmic sperm injection.
IUI: intrauterine insemination.
IUI‐COH: intrauterine insemination‐controlled ovarian hyperstimulation.
IVF: in vitro fertilisation.
IVF‐SET: in vitro fertilisation‐single embryo transfer.
LBR: live birth rate.
SO: ovarian stimulation.
Characteristics of excluded studies [ordered by study ID]
| Study | Reason for exclusion |
| Multi‐centre randomised controlled trial (RCT) comparing effectiveness of in vitro fertilisation (IVF) vs intrauterine insemination plus ovarian stimulation (IUI + gonadotropins) and IVF vs gamete intrafallopian transfer (GIFT). Pregnancy rate per cycle and live birth rate (LBR) per cycle were reported outcomes | |
| Couples with unexplained subfertility and intermediate prognosis of natural conception were randomly allocated to 6 months EM or immediate start with IUI‐COS: no IVF arm | |
| Diagnostic stratification not done; therefore number of participants with unexplained infertility is not known. Control group could include participants who underwent some form of fertility treatment while awaiting spontaneous pregnancy | |
| Diagnostic stratification not done. Study population included all categories of infertile couples. Couples with unexplained infertility were not analysed separately | |
| Although study authors describe the study as randomised controlled trial (RCT), on closer inspection the method of allocation was found to be non‐random. Every second participant was allocated to the gamete intrafallopian transfer (GIFT) group | |
| No intervention of interest (gamete intrafallopian transfer (GIFT) excluded from 2011 review update) | |
| No intervention of interest (gamete intrafallopian transfer (GIFT) excluded from 2011 review update) | |
| Randomisation was not genuine. Study authors describe method of randomisation as pseudo‐randomisation. Allocation of treatment was breached by participant preference. Pregnancy and live birth rate (LBR) per woman/couple has not been reported |
Characteristics of ongoing studies [ordered by study ID]
| Trial name or title | Controlled ovarian stimulation and intrauterine insemination or in vitro fertilisation as first‐line treatment for unexplained infertility: a randomised controlled trial |
| Methods | Randomised controlled trial (RCT) |
| Participants | Inclusion criteria
Exclusion criteria
|
| Interventions | Randomisation is performed by an independent worker in blocks of 10 and distributed in individual consecutively numbered opaque envelopes. Participants will be randomly assigned to 2 groups:
In IVF group, women will undergo controlled ovarian hyperstimulation after downregulation with gonadotropin releasing hormone (GnRH) agonist in a long protocol starting on day 2. COH is started with FSH, with doses ranging from 150 to 450 IU, depending on initial anti‐Mullerian hormone (AMH) level as decided by attending clinician. Day of embryo transfer will be decided by embryologist base |
| Outcomes | Primary outcome: singleton live birth Secondary outcomes: clinical pregnancy rate, multiple pregnancy rate |
| Starting date | 17/6/2013 |
| Contact information | Anupa Nandi Homerton Fertility Unit Homerton Hospital E9 6SR London United Kingdom |
| Notes |
Data and analyses
| Outcome or subgroup title | No. of studies | No. of participants | Statistical method | Effect size |
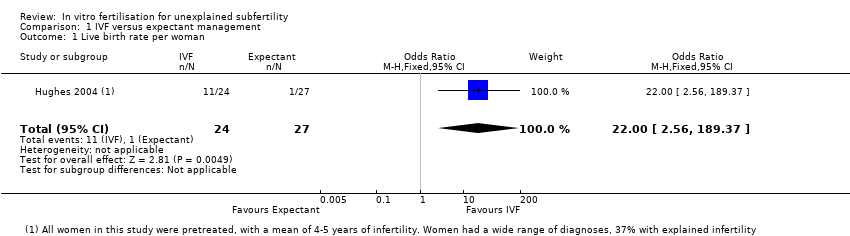
| 1 Live birth rate per woman Show forest plot | 1 | 51 | Odds Ratio (M‐H, Fixed, 95% CI) | 22.0 [2.56, 189.37] |
| Analysis 1.1  Comparison 1 IVF versus expectant management, Outcome 1 Live birth rate per woman. | ||||
| 2 Clinical pregnancy rate per woman Show forest plot | 2 | 86 | Odds Ratio (M‐H, Fixed, 95% CI) | 3.24 [1.07, 9.80] |
| Analysis 1.2  Comparison 1 IVF versus expectant management, Outcome 2 Clinical pregnancy rate per woman. | ||||
| Outcome or subgroup title | No. of studies | No. of participants | Statistical method | Effect size |
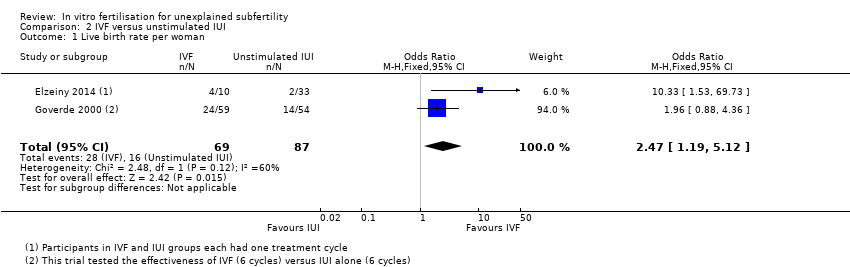
| 1 Live birth rate per woman Show forest plot | 2 | 156 | Odds Ratio (M‐H, Fixed, 95% CI) | 2.47 [1.19, 5.12] |
| Analysis 2.1  Comparison 2 IVF versus unstimulated IUI, Outcome 1 Live birth rate per woman. | ||||
| 2 Clinical pregnancy rate per woman Show forest plot | 1 | 43 | Odds Ratio (M‐H, Fixed, 95% CI) | 4.83 [0.94, 24.95] |
| Analysis 2.2  Comparison 2 IVF versus unstimulated IUI, Outcome 2 Clinical pregnancy rate per woman. | ||||
| 3 Multiple pregnancy rate per woman Show forest plot | 1 | 43 | Odds Ratio (M‐H, Fixed, 95% CI) | 1.03 [0.04, 27.29] |
| Analysis 2.3  Comparison 2 IVF versus unstimulated IUI, Outcome 3 Multiple pregnancy rate per woman. | ||||
| Outcome or subgroup title | No. of studies | No. of participants | Statistical method | Effect size |
| 1 Live birth rate per woman Show forest plot | 5 | Odds Ratio (M‐H, Fixed, 95% CI) | Subtotals only | |
| Analysis 3.1  Comparison 3 IVF versus IUI + ovarian stimulation with gonadotropins or clomiphene (CC), Outcome 1 Live birth rate per woman. | ||||
| 1.1 Treatment‐naive women IVF vs IUI + gonadotropins | 4 | 745 | Odds Ratio (M‐H, Fixed, 95% CI) | 1.27 [0.94, 1.73] |
| 1.2 Pretreated women IVF vs IUI + gonadotropins | 1 | 280 | Odds Ratio (M‐H, Fixed, 95% CI) | 3.90 [2.32, 6.57] |
| 1.3 Treatment‐naive women IVF vs IUI + CC | 1 | 103 | Odds Ratio (M‐H, Fixed, 95% CI) | 2.51 [0.96, 6.55] |
| 2 Clinical pregnancy rate per woman Show forest plot | 4 | Odds Ratio (M‐H, Fixed, 95% CI) | Subtotals only | |
| Analysis 3.2  Comparison 3 IVF versus IUI + ovarian stimulation with gonadotropins or clomiphene (CC), Outcome 2 Clinical pregnancy rate per woman. | ||||
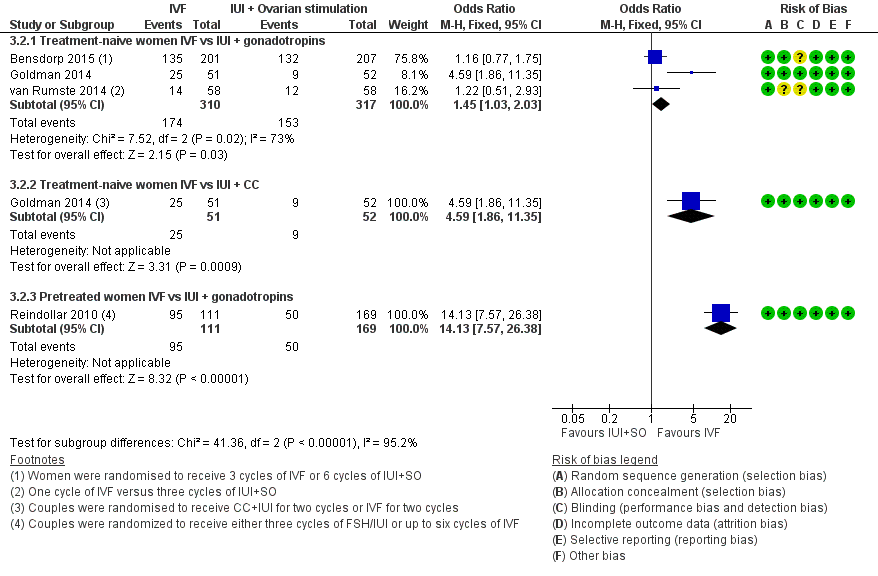
| 2.1 Treatment‐naive women IVF vs IUI + gonadotropins | 3 | 627 | Odds Ratio (M‐H, Fixed, 95% CI) | 1.45 [1.03, 2.03] |
| 2.2 Treatment‐naive women IVF vs IUI + CC | 1 | 103 | Odds Ratio (M‐H, Fixed, 95% CI) | 4.59 [1.86, 11.35] |
| 2.3 Pretreated women IVF vs IUI + gonadotropins | 1 | 280 | Odds Ratio (M‐H, Fixed, 95% CI) | 14.13 [7.57, 26.38] |
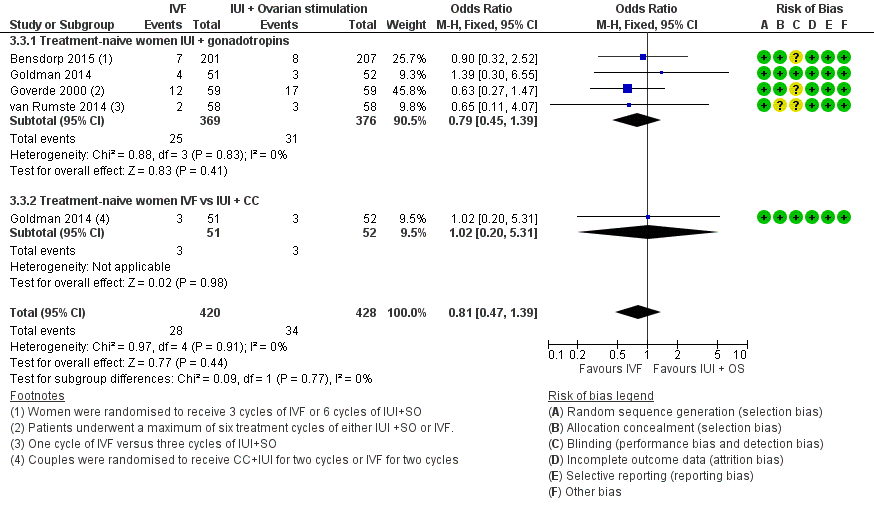
| 3 Multiple pregnancy rate per woman Show forest plot | 4 | 848 | Odds Ratio (M‐H, Fixed, 95% CI) | 0.81 [0.47, 1.39] |
| Analysis 3.3  Comparison 3 IVF versus IUI + ovarian stimulation with gonadotropins or clomiphene (CC), Outcome 3 Multiple pregnancy rate per woman. | ||||
| 3.1 Treatment‐naive women IUI + gonadotropins | 4 | 745 | Odds Ratio (M‐H, Fixed, 95% CI) | 0.79 [0.45, 1.39] |
| 3.2 Treatment‐naive women IVF vs IUI + CC | 1 | 103 | Odds Ratio (M‐H, Fixed, 95% CI) | 1.02 [0.20, 5.31] |
| 4 Incidence of OHSS per woman Show forest plot | 2 | 324 | Odds Ratio (M‐H, Fixed, 95% CI) | 1.15 [0.43, 3.06] |
| Analysis 3.4  Comparison 3 IVF versus IUI + ovarian stimulation with gonadotropins or clomiphene (CC), Outcome 4 Incidence of OHSS per woman. | ||||
| 4.1 Treatment‐naive women IVF vs IUI + gonadotropins | 2 | 221 | Odds Ratio (M‐H, Fixed, 95% CI) | 1.23 [0.36, 4.14] |
| 4.2 Treatment‐naive women IVF vs IUI + CC | 1 | 103 | Odds Ratio (M‐H, Fixed, 95% CI) | 1.02 [0.20, 5.31] |
| 5 Miscarriage rate per woman Show forest plot | 1 | 206 | Odds Ratio (M‐H, Fixed, 95% CI) | 1.16 [0.59, 2.28] |
| Analysis 3.5  Comparison 3 IVF versus IUI + ovarian stimulation with gonadotropins or clomiphene (CC), Outcome 5 Miscarriage rate per woman. | ||||
| 5.1 Treatment‐naive women IVF vs IUI + CC | 1 | 103 | Odds Ratio (M‐H, Fixed, 95% CI) | 1.16 [0.44, 3.02] |
| 5.2 Treatment‐naive women IVF vs IUI+ gonadotropins | 1 | 103 | Odds Ratio (M‐H, Fixed, 95% CI) | 1.16 [0.44, 3.02] |

Methodological quality graph: review authors' judgements about each methodological quality item presented as percentages across all included studies.

Methodological quality summary: review authors' judgements about each methodological quality item for each included study.

Study flow diagram.

Forest plot of comparison: 1 IVF versus expectant management, outcome: 1.1 Live birth rate per woman.

Forest plot of comparison: 1 IVF versus expectant management, outcome: 1.2 Clinical pregnancy rate per woman.

Forest plot of comparison: 2 IVF versus unstimulated IUI, outcome: 2.1 Live birth rate per woman.

Forest plot of comparison: 3 IVF versus IUI + ovarian stimulation with gonadotropins or clomiphene (CC), outcome: 3.1 Live birth rate per woman.
Forest plot of comparison: 3 IVF versus IUI + ovarian stimulation with gonadotropins or clomiphene (CC), outcome: 3.2 Clinical pregnancy rate per woman.
Forest plot of comparison: 3 IVF versus IUI + ovarian stimulation with gonadotropins or clomiphene (CC), outcome: 3.3 Multiple pregnancy rate per woman.
Comparison 1 IVF versus expectant management, Outcome 1 Live birth rate per woman.

Comparison 1 IVF versus expectant management, Outcome 2 Clinical pregnancy rate per woman.
Comparison 2 IVF versus unstimulated IUI, Outcome 1 Live birth rate per woman.

Comparison 2 IVF versus unstimulated IUI, Outcome 2 Clinical pregnancy rate per woman.
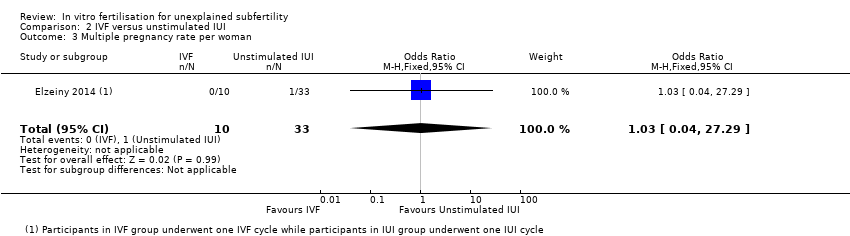
Comparison 2 IVF versus unstimulated IUI, Outcome 3 Multiple pregnancy rate per woman.

Comparison 3 IVF versus IUI + ovarian stimulation with gonadotropins or clomiphene (CC), Outcome 1 Live birth rate per woman.

Comparison 3 IVF versus IUI + ovarian stimulation with gonadotropins or clomiphene (CC), Outcome 2 Clinical pregnancy rate per woman.
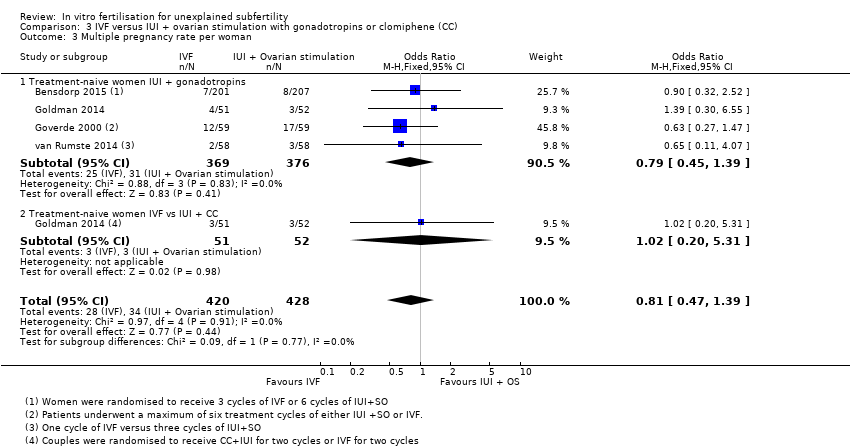
Comparison 3 IVF versus IUI + ovarian stimulation with gonadotropins or clomiphene (CC), Outcome 3 Multiple pregnancy rate per woman.

Comparison 3 IVF versus IUI + ovarian stimulation with gonadotropins or clomiphene (CC), Outcome 4 Incidence of OHSS per woman.

Comparison 3 IVF versus IUI + ovarian stimulation with gonadotropins or clomiphene (CC), Outcome 5 Miscarriage rate per woman.
| IVF compared with expectant management for unexplained subfertility | ||||||
| Population: women with unexplained subfertility | ||||||
| Outcomes | Plain language summary | Illustrative comparative risks* (95% CI) | Relative effect | Number of participants | Quality of the evidence | |
| Assumed risk | Corresponding risk | |||||
| Expectant management | IVF | |||||
| Live birth rate per woman | There is inconclusive evidence to suggest that IVF may result in more births than expectant management | 37 per 1000 | 458 per 1000 | OR 22 | 51 | ⊕⊝⊝⊝ |
| Pregnancy rate per woman | There is inconclusive evidence to suggest that IVF may result in more clinical pregnancies than expectant management | 127 per 1000 | 320 per 1000 | OR 3.24 | 86 | ⊕⊝⊝⊝ |
| Multiple pregnancy rate | Not reported in the included studies | |||||
| *The basis for the assumed risk is the median control group risk across studies. The corresponding risk (and its 95% confidence interval) is based on the assumed risk in the comparison group and the relative effect of the intervention (and its 95% CI). | ||||||
| GRADE Working Group grades of evidence. | ||||||
| aThe GRADE quality rating was downgraded by 3 levels due to very serious imprecision, questionable applicability and (for the analysis of clinical pregnancy) serious inconsistency. Very few events were reported in the included studies (12 births and 18 pregnancies altogether). There was also substantial statistical heterogeneity (I2=80%) in the analysis of clinical pregnancies (with differing directions of effect) and applicability was unclear due to the long duration of unexplained infertility and use of co‐interventions. | ||||||
| IVF compared with unstimulated IUI for unexplained subfertility | ||||||
| Population: women with unexplained subfertility | ||||||
| Outcomes | Plain language summary | Illustrative comparative risks* (95% CI) | Relative effect | Number of participants | Quality of the evidence | |
| Assumed risk | Corresponding risk | |||||
| Unstimulated IUI | IVF | |||||
| Live birth rate | Evidence suggests that IVF may result in more births than insemination without using fertility drugs | 160 per 1000 | 320 per 1000 | OR 2.47 | 156 | ⊕⊕⊝⊝ |
| Pregnancy rate IVF vs IUI | It is unclear whether there is a difference in the pregnancy rate resulting from IVF compared with insemination without using fertility drugs, due to insufficient evidence | 121 per 1000 | 400 per 1000 | OR 4.83 | 43 | ⊕⊕⊝⊝ |
| Multiple pregnancy rate | It is unclear whether there is a difference in the multiple pregnancy rate resulting from IVF compared with insemination without using fertility drugs, due to insufficient evidence | 30 per 1000 | 31 per 1000 | OR 1.03 | 43 | ⊕⊝⊝⊝ |
| *The basis for the assumed risk is the median control group risk across studies. The corresponding risk (and its 95% confidence interval) is based on the assumed risk in the comparison group and the relative effect of the intervention (and its 95% CI). | ||||||
| GRADE Working Group grades of evidence. | ||||||
| aThe GRADE quality rating was downgraded by 2 levels due to serious imprecision: There were only 44 events. There was also substantial statistical heterogeneity (I2=60%), though the direction of effect was consistent. cThe GRADE quality rating was downgraded by 3 levels due to very serious imprecision: there was only one event in this analysis | ||||||
| IVF compared with IUI + superovulation for unexplained subfertility | ||||||
| Population: women with unexplained subfertility | ||||||
| Outcomes | Plain language summary | Illustrative comparative risks* (95% CI) | Relative effect | Number of participants | Quality of the evidence | |
| Assumed risk | Corresponding risk | |||||
| IUI + superovulation | IVF | |||||
| Live birth rate in treatment‐naive women IVF vs IUI + gonadotropins | In treatment‐naive women there is no conclusive evidence of a difference in live birth rates between IVF and insemination using injectable fertility drugs | 273 per 1000 | 308 per 1000 | OR 1.27 (0.94 to 1.73) | 745 | ⊕⊕⊕⊝ |
| Live birth rate in pretreated women IVF vs IUI + gonadotropins | In women pretreated with oral fertility drugs IVF leads to more live births than insemination using injectable fertility drugs | 219 per 1000 | 523 per 1000 | OR 3.90 (2.32 to 6.57) | 280 | ⊕⊕⊕⊝ |
| Live birth rate in treatment‐naive women IVF vs IUI + CC | In treatment‐naive women there is no conclusive evidence of a difference in live birth rates between IVF and insemination using injectable fertility drugs | 154 per 1000 | 314 per 1000 | OR 2.51 (0.96 to 6.55) | 103 | ⊕⊕⊝⊝ |
| Multiple pregnancy rate | In treatment‐naive women there is no evidence of a difference in multiple pregnancy rates between IVF and insemination using injectable fertility drugs | 58 per 1000 | 47 per 1000 | OR 0.81 | 848 | ⊕⊕⊕⊝ |
| Incidence of OHSS | In treatment‐naive women there is no evidence of a difference in OHSS rates between IVF and insemination using injectable fertility drugs | 58 per 1000 | 66 per 1000 | OR 1.15 | 324 | ⊕⊕⊝⊝ |
| *The basis for the assumed risk is the median risk in the control groups. The corresponding risk (and its 95% confidence interval) is based on the assumed risk in the comparison group and the relative effect of the intervention (and its 95% CI). | ||||||
| GRADE Working Group grades of evidence. | ||||||
| aThe GRADE quality rating was downgraded by 1 level due to serious imprecision: the confidence interval is compatible with no difference between the interventions or with meaningful benefit from IVF. cThe GRADE quality rating was downgraded by 2 levels due to very serious imprecision: there were only 24 events and the confidence interval is compatible with no difference between the interventions or with meaningful benefit from IVF dThe GRADE quality rating was downgraded by 1 level due to serious imprecision: the confidence interval is compatible with no difference between the interventions or with meaningful benefit in either arm. | ||||||
| Outcome or subgroup title | No. of studies | No. of participants | Statistical method | Effect size |
| 1 Live birth rate per woman Show forest plot | 1 | 51 | Odds Ratio (M‐H, Fixed, 95% CI) | 22.0 [2.56, 189.37] |
| 2 Clinical pregnancy rate per woman Show forest plot | 2 | 86 | Odds Ratio (M‐H, Fixed, 95% CI) | 3.24 [1.07, 9.80] |
| Outcome or subgroup title | No. of studies | No. of participants | Statistical method | Effect size |
| 1 Live birth rate per woman Show forest plot | 2 | 156 | Odds Ratio (M‐H, Fixed, 95% CI) | 2.47 [1.19, 5.12] |
| 2 Clinical pregnancy rate per woman Show forest plot | 1 | 43 | Odds Ratio (M‐H, Fixed, 95% CI) | 4.83 [0.94, 24.95] |
| 3 Multiple pregnancy rate per woman Show forest plot | 1 | 43 | Odds Ratio (M‐H, Fixed, 95% CI) | 1.03 [0.04, 27.29] |
| Outcome or subgroup title | No. of studies | No. of participants | Statistical method | Effect size |
| 1 Live birth rate per woman Show forest plot | 5 | Odds Ratio (M‐H, Fixed, 95% CI) | Subtotals only | |
| 1.1 Treatment‐naive women IVF vs IUI + gonadotropins | 4 | 745 | Odds Ratio (M‐H, Fixed, 95% CI) | 1.27 [0.94, 1.73] |
| 1.2 Pretreated women IVF vs IUI + gonadotropins | 1 | 280 | Odds Ratio (M‐H, Fixed, 95% CI) | 3.90 [2.32, 6.57] |
| 1.3 Treatment‐naive women IVF vs IUI + CC | 1 | 103 | Odds Ratio (M‐H, Fixed, 95% CI) | 2.51 [0.96, 6.55] |
| 2 Clinical pregnancy rate per woman Show forest plot | 4 | Odds Ratio (M‐H, Fixed, 95% CI) | Subtotals only | |
| 2.1 Treatment‐naive women IVF vs IUI + gonadotropins | 3 | 627 | Odds Ratio (M‐H, Fixed, 95% CI) | 1.45 [1.03, 2.03] |
| 2.2 Treatment‐naive women IVF vs IUI + CC | 1 | 103 | Odds Ratio (M‐H, Fixed, 95% CI) | 4.59 [1.86, 11.35] |
| 2.3 Pretreated women IVF vs IUI + gonadotropins | 1 | 280 | Odds Ratio (M‐H, Fixed, 95% CI) | 14.13 [7.57, 26.38] |
| 3 Multiple pregnancy rate per woman Show forest plot | 4 | 848 | Odds Ratio (M‐H, Fixed, 95% CI) | 0.81 [0.47, 1.39] |
| 3.1 Treatment‐naive women IUI + gonadotropins | 4 | 745 | Odds Ratio (M‐H, Fixed, 95% CI) | 0.79 [0.45, 1.39] |
| 3.2 Treatment‐naive women IVF vs IUI + CC | 1 | 103 | Odds Ratio (M‐H, Fixed, 95% CI) | 1.02 [0.20, 5.31] |
| 4 Incidence of OHSS per woman Show forest plot | 2 | 324 | Odds Ratio (M‐H, Fixed, 95% CI) | 1.15 [0.43, 3.06] |
| 4.1 Treatment‐naive women IVF vs IUI + gonadotropins | 2 | 221 | Odds Ratio (M‐H, Fixed, 95% CI) | 1.23 [0.36, 4.14] |
| 4.2 Treatment‐naive women IVF vs IUI + CC | 1 | 103 | Odds Ratio (M‐H, Fixed, 95% CI) | 1.02 [0.20, 5.31] |
| 5 Miscarriage rate per woman Show forest plot | 1 | 206 | Odds Ratio (M‐H, Fixed, 95% CI) | 1.16 [0.59, 2.28] |
| 5.1 Treatment‐naive women IVF vs IUI + CC | 1 | 103 | Odds Ratio (M‐H, Fixed, 95% CI) | 1.16 [0.44, 3.02] |
| 5.2 Treatment‐naive women IVF vs IUI+ gonadotropins | 1 | 103 | Odds Ratio (M‐H, Fixed, 95% CI) | 1.16 [0.44, 3.02] |