Intervenciones para las sobredosis de paracetamol (acetaminofeno)
Información
- DOI:
- https://doi.org/10.1002/14651858.CD003328.pub3Copiar DOI

- Base de datos:
-
- Cochrane Database of Systematic Reviews
- Versión publicada:
-
- 23 febrero 2018see what's new
- Tipo:
-
- Intervention
- Etapa:
-
- Review
- Grupo Editorial Cochrane:
-
Grupo Cochrane de Hepatobiliar
- Copyright:
-
- Copyright © 2018 The Cochrane Collaboration. Published by John Wiley & Sons, Ltd.
Cifras del artículo
Altmetric:
Citado por:
Autores
Contributions of authors
AC: designed, drafted, and revised the protocol; performed the searches; selected trials and studies; extracted data; rated studies; and drafted and revised the review.
CG: revised the protocol, conducted the Trial Sequential Analyses, and revised the review.
JB: selected the trial Nicholas Buckley was involved in, assessed risks of bias, extracted data, and revised the review.
NB: extracted data, rated studies, and revised the protocol and the review.
Sources of support
Internal sources
-
Copenhagen Trial Unit, Denmark.
External sources
-
The 1991 Pharmacy Foundation, Denmark.
-
Copenhagen Hospital Corporation's Medical Research Council's Grant on Getting Research into Practice (GRIP), Denmark.
-
Danish Medical Research Council's Grant on Getting Research into Practice (GRIP), Denmark.
-
Copenhagen Hospital Corporation's Medical Research Council, Denmark.
Declarations of interest
AC: none known.
CG: none known.
JB: none known.
NB: none known.
Acknowledgements
We are indebted to Dimitrinka Nikolova and Sarah Klingenberg for their helpful assistance. We would like to acknowledge Dr Omid Khakhouie for translating one of the trials into English.
Cochrane Review Group funding acknowledgement: the Danish State is the largest single funder of The Cochrane Hepato‐Biliary Group through its investment in The Copenhagen Trial Unit, Centre for Clinical Intervention Research, Rigshospitalet, Copenhagen University Hospital, Denmark. Disclaimer: the views and opinions expressed in this review are those of the review authors and do not necessarily reflect those of the Danish State or The Copenhagen Trial Unit.
Peer reviewers: Goran Poropat, Croatia; Goran Hauser, Croatia.
Contact editors: Vanja Giljaca, UK; Marsha Morgan, UK.
Sign‐off editor: Luit Penninga, Denmark.
Version history
| Published | Title | Stage | Authors | Version |
| 2018 Feb 23 | Interventions for paracetamol (acetaminophen) overdose | Review | Angela L Chiew, Christian Gluud, Jesper Brok, Nick A Buckley | |
| 2006 Apr 19 | Interventions for paracetamol (acetaminophen) overdose | Review | Jesper Brok, Nick Buckley, Christian Gluud | |
| 2002 Jul 22 | Interventions for paracetamol (acetaminophen) overdoses | Review | Jesper Brok, Nick Buckley, Christian Gluud | |
Keywords
MeSH
Medical Subject Headings (MeSH) Keywords
- Acetaminophen [pharmacokinetics, *poisoning];
- Acetylcysteine [therapeutic use];
- Analgesics, Non-Narcotic [pharmacokinetics, *poisoning];
- Antidotes [therapeutic use];
- Charcoal [therapeutic use];
- Cysteamine [therapeutic use];
- Dimercaprol [therapeutic use];
- Drug Overdose [mortality, therapy];
- Gastric Lavage;
- Intestinal Absorption;
- Liver Failure, Acute [chemically induced, epidemiology, surgery];
- Liver Transplantation;
- Methionine [therapeutic use];
- Randomized Controlled Trials as Topic;
Medical Subject Headings Check Words
Humans;
PICO
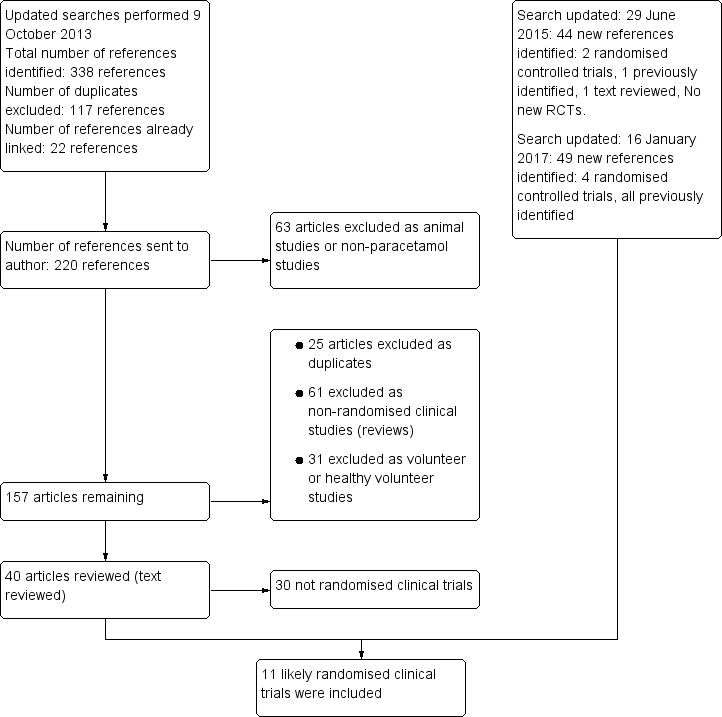
Flow chart: search strategy and results.

Risk of bias graph: review authors' judgements about each risk of bias item presented as percentages across all included studies.

Risk of bias summary: review authors' judgements about each risk of bias item for each included study.

Trial Sequential Analysis of cysteamine versus control on hepatotoxicity defined as aspartate aminotransferase (AST) above 1000 IU/L. The diversity‐adjusted required information size (DARIS) was 982 participants based on a proportion of 53% with the outcome in the control group (Pc); a risk reduction of 20%; an alpha (a) of 2.5%; a beta (b) of 20% (equivalent to a power of 80%); and an assumed diversity of 20%. As demonstrated the trial sequential monitoring boundaries for benefit, harm, or futility were crossed by the cumulative Z value.

Trial Sequential Analysis of acetylcysteine versus placebo on mortality. The diversity‐adjusted required information size (DARIS) is 375 participants based on a proportion of 80% with the outcome in the control group (Pc); a risk reduction of 20% (Peto OR: POR); an alpha (a) of 2.5%; a beta (b) of 20% (equivalent to a power of 80%); and an assumed diversity of 20%. As demonstrated the trial sequential monitoring boundaries for benefit, harm, or futility were crossed by the cumulative Z value.

Trial Sequential Analysis of 15‐min infusion of acetylcysteine versus 60‐min infusion of acetylcysteine on any adverse event. The diversity‐adjusted required information size (DARIS) is 820 participants based on a proportion of 60% with the outcome in the control group (Pc); a risk reduction of 20%; an alpha (a) of 2.5%; a beta (b) of 20% (equivalent to a power of 80%); and an assumed diversity of 20%. As demonstrated the trial sequential monitoring boundaries for harm, benefit, or futility were crossed by the cumulative Z value.

Comparison 1 Methionine versus no intervention, Outcome 1 Mortality.

Comparison 1 Methionine versus no intervention, Outcome 2 Hepatotoxicity (aspartate aminotransferase > 1000 IU/L).

Comparison 2 Cysteamine versus no intervention, Outcome 1 Mortality.
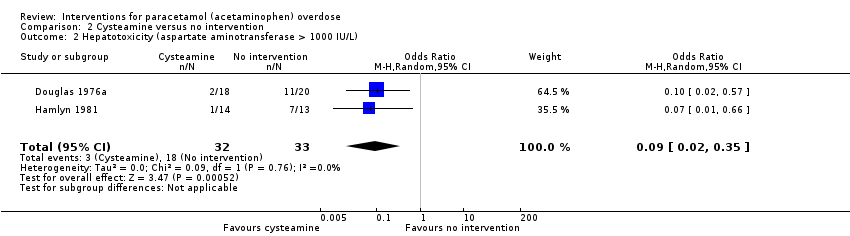
Comparison 2 Cysteamine versus no intervention, Outcome 2 Hepatotoxicity (aspartate aminotransferase > 1000 IU/L).

Comparison 3 Cysteamine versus methionine, Outcome 1 Mortality.
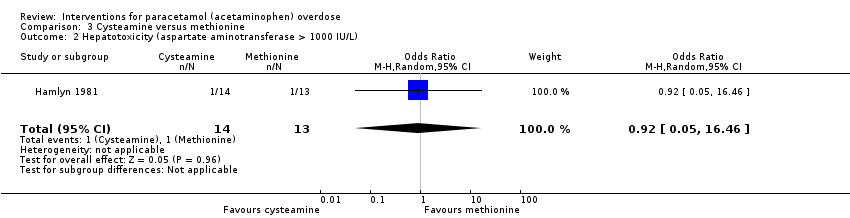
Comparison 3 Cysteamine versus methionine, Outcome 2 Hepatotoxicity (aspartate aminotransferase > 1000 IU/L).

Comparison 4 Cysteamine versus dimercaprol, Outcome 1 Mortality.

Comparison 4 Cysteamine versus dimercaprol, Outcome 2 Maximum alanine aminotransferase (IU/L).

Comparison 5 Intravenous acetylcysteine versus 'placebo' in people with fulminant hepatic failure, Outcome 1 Mortality.

Comparison 6 Initial dose over 60 minutes versus 15 minutes of intravenous acetylcysteine, Outcome 1 Mortality.
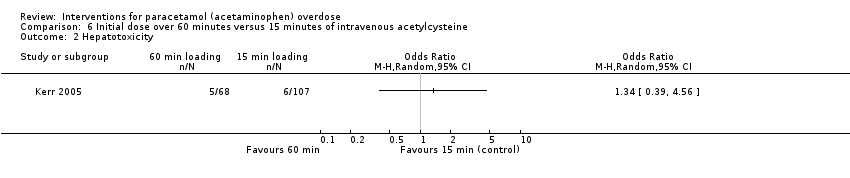
Comparison 6 Initial dose over 60 minutes versus 15 minutes of intravenous acetylcysteine, Outcome 2 Hepatotoxicity.

Comparison 6 Initial dose over 60 minutes versus 15 minutes of intravenous acetylcysteine, Outcome 3 Any adverse event.

Comparison 7 12‐hour intravenous acetylcysteine regimen versus 20.5‐hour regimen, Outcome 1 Mortality.

Comparison 7 12‐hour intravenous acetylcysteine regimen versus 20.5‐hour regimen, Outcome 2 Hepatotoxicity.
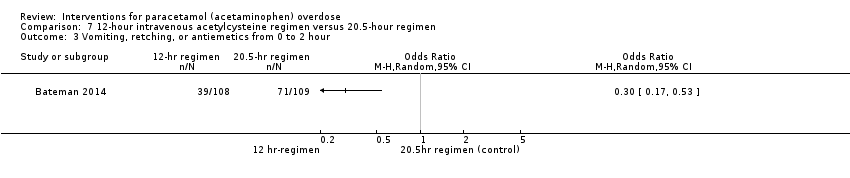
Comparison 7 12‐hour intravenous acetylcysteine regimen versus 20.5‐hour regimen, Outcome 3 Vomiting, retching, or antiemetics from 0 to 2 hour.

Comparison 7 12‐hour intravenous acetylcysteine regimen versus 20.5‐hour regimen, Outcome 4 Vomiting, retching, or antiemetics 0 to 12 hour.

Comparison 7 12‐hour intravenous acetylcysteine regimen versus 20.5‐hour regimen, Outcome 5 Anaphylactoid symptoms (all).

Comparison 8 Charcoal haemoperfusion versus no intervention, Outcome 1 Mortality.
| Methionine and supportive treatment compared with supportive treatment (randomised trials) for paracetamol (acetaminophen) overdose | ||||||
| Patient or population: people with paracetamol (acetaminophen) overdose | ||||||
| Outcomes | Illustrative comparative risks* (95% CI) | Relative effect | No of participants | Quality of the evidence | Comments | |
| Assumed risk | Corresponding risk | |||||
| Supportive treatment | Methionine and supportive treatment | |||||
| Mortality | Study population | Peto OR 0.14 | 26 | ⊕⊝⊝⊝ | The Trial Sequential Analysis‐adjusted CI could not be estimated due to the paucity of data. | |
| 77 per 1000 | 12 per 1000 | |||||
| Hepatotoxicity | Study population | OR 0.05 | 26 | ⊕⊕⊝⊝ | ‐ | |
| 615 per 1000 | 74 per 1000 | |||||
| *The basis for the assumed risk (e.g. the median control group risk across studies) is provided in footnotes. The corresponding risk (and its 95% confidence interval) is based on the assumed risk in the comparison group and the relative effect of the intervention (and its 95% CI). | ||||||
| GRADE Working Group grades of evidence | ||||||
| 1Downgraded one level for risk of bias (concerns regarding randomisation sequence generation and allocation concealment probably compromised). | ||||||
| Cysteamine compared with no intervention (randomised trials) for paracetamol (acetaminophen) overdose | ||||||
| Patient or population: people with paracetamol (acetaminophen) overdose | ||||||
| Outcomes | Illustrative comparative risks* (95% CI) | Relative effect | No of participants | Quality of the evidence | Comments | |
| Assumed risk | Corresponding risk | |||||
| No intervention | Cysteamine | |||||
| Mortality | Study population | Peto OR 0.53 | 65 | ⊕⊝⊝⊝ | ‐ | |
| 61 per 1000 | 33 per 1000 | |||||
| Hepatotoxicity (aspartate aminotransferase > 1000 IU/L) | Study population | OR 0.09 | 65 | ⊕⊕⊝⊝ | Trial Sequential Analysis‐adjusted CI ranged from 0.00 to 24.0. | |
| 545 per 1000 | 97 per 1000 | |||||
| *The basis for the assumed risk (e.g. the median control group risk across studies) is provided in footnotes. The corresponding risk (and its 95% confidence interval) is based on the assumed risk in the comparison group and the relative effect of the intervention (and its 95% CI). | ||||||
| GRADE Working Group grades of evidence | ||||||
| 1Downgraded one level because of risk of bias (method of randomisation had potential for bias and allocation concealment not specified). | ||||||
| Cysteamine compared with dimercaprol (randomised trials) for paracetamol (acetaminophen) overdose | ||||||
| Patient or population: people with paracetamol (acetaminophen) overdose | ||||||
| Outcomes | Illustrative comparative risks* (95% CI) | Relative effect | No of participants | Quality of the evidence | Comments | |
| Assumed risk | Corresponding risk | |||||
| Dimercaprol | Cysteamine | |||||
| Mortality | Study population | Peto OR 0.14 | 52 | ⊕⊝⊝⊝ | ‐ | |
| 38 per 1000 | 6 per 1000 | |||||
| Mean maximum alanine aminotransferase (IU/L) | The mean maximum alanine aminotransferase (IU/L) in the dimercaprol was 754 | The mean maximum alanine aminotransferase (IU/L) in the cysteamine group was 722 (IU/L) | ‐ | 52 | ⊕⊕⊝⊝ | Difference ‐32.00 (95% CI ‐512.9 to 448.9). The difference between the 2 groups was not significant. |
| *The basis for the assumed risk (e.g. the median control group risk across studies) is provided in footnotes. The corresponding risk (and its 95% confidence interval) is based on the assumed risk in the comparison group and the relative effect of the intervention (and its 95% CI). | ||||||
| GRADE Working Group grades of evidence | ||||||
| 1Downgraded two levels because of serious imprecision (due to small sample studied, low number of deaths, and confidence intervals wide). | ||||||
| Cysteamine compared with methionine (randomised trials) for paracetamol (acetaminophen) overdose | ||||||
| Patient or population: people with paracetamol (acetaminophen) overdose | ||||||
| Outcomes | Illustrative comparative risks* (95% CI) | Relative effect | No of participants | Quality of the evidence | Comments | |
| Assumed risk | Corresponding risk | |||||
| Methionine | Cysteamine | |||||
| Mortality | Study population | Not estimable | 27 | ⊕⊝⊝⊝ | ‐ | |
| 0 per 1000 | 0 per 1000 | |||||
| Hepatotoxicity (aspartate aminotransferase > 1000 U/L) | Study population | OR 0.92 | 27 | ⊕⊝⊝⊝ | ‐ | |
| 77 per 1000 | 71 per 1000 | |||||
| *The basis for the assumed risk (e.g. the median control group risk across studies) is provided in footnotes. The corresponding risk (and its 95% confidence interval) is based on the assumed risk in the comparison group and the relative effect of the intervention (and its 95% CI). | ||||||
| GRADE Working Group grades of evidence | ||||||
| 1Downgraded one level because of risk of bias (concerns regarding randomisation and allocation concealment not specified). | ||||||
| Standard intravenous acetylcysteine regimen (20.5 hours) compared with shorter (12 hours) protocol for paracetamol (acetaminophen) overdose | ||||||
| Patient or population: people with paracetamol (acetaminophen) overdose | ||||||
| Outcomes | Illustrative comparative risks* (95% CI) | Relative effect | No of participants | Quality of the evidence | Comments | |
| Assumed risk | Corresponding risk | |||||
| Standard intravenous acetylcysteine regimen (20.25 hours) | Shorter (12‐hour protocol) | |||||
| Mortality | Study population | Not estimable | 222 | ⊕⊝⊝⊝ | ‐ | |
| 0 per 1000 | 0 per 1000 | |||||
| Hepatotoxicity | Study population | OR 0.67 (0.11 to 4.08) | 202 (1 RCT) | ⊕⊝⊝⊝ | ‐ | |
| 30 per 1000 | 20 per 1000 (3 to 111) | |||||
| Vomiting, retching, or antiemetics from 0‐2 hours | Study population | OR 0.30 (0.17 to 0.53) | 217 | ⊕⊕⊝⊝ | ‐ | |
| 651 per 1000 | 359 per 1000 | |||||
| Vomiting, retching, or antiemetics 0‐12 hours | Study population | OR 0.40 (0.22 to 0.75) | 203 | ⊕⊕⊝⊝ | ‐ | |
| 784 per 1000 | 593 per 1000 | |||||
| Anaphylactoid symptoms | Study population | OR 0.39 (0.21 to 0.70) | 208 | ⊕⊕⊝⊝ | ‐ | |
| 750 per 1000 | 539 per 1000 | |||||
| *The basis for the assumed risk (e.g. the median control group risk across studies) is provided in footnotes. The corresponding risk (and its 95% confidence interval) is based on the assumed risk in the comparison group and the relative effect of the intervention (and its 95% CI). | ||||||
| GRADE Working Group grades of evidence | ||||||
| 1Downgraded one level because of indirectness (a large number of prospective participants excluded prior to randomisation: 1539 judged suitable for treatment, only 222 randomised). | ||||||
| Oral compared with intravenous acetylcysteine for paracetamol (acetaminophen) overdose | ||||||
| Patient or population: people with paracetamol (acetaminophen) overdose | ||||||
| Outcomes | Illustrative comparative risks* (95% CI) | Relative effect | No of participants | Quality of the evidence | Comments | |
| Assumed risk | Corresponding risk | |||||
| Intravenous acetylcysteine | Oral acetylcysteine | |||||
| Mortality | Study population | Not estimable | 66 | ⊕⊝⊝⊝ | ‐ | |
| 0 per 1000 | 0 per 1000 | |||||
| Hepatotoxicity | ‐ | ‐ | ‐ | ‐ | ‐ | Rates of hepatotoxicity not reported, only mean alanine aminotransferase between the 2 study groups. |
| Nausea | Study population | OR 2.71 | 66 | ⊕⊝⊝⊝ | ‐ | |
| 333 per 1000 | 575 per 1000 | |||||
| Vomiting | Study population | OR 2.10 | 66 | ⊕⊝⊝⊝ | ‐ | |
| 152 per 1000 | 273 per 1000 | |||||
| *The basis for the assumed risk (e.g. the median control group risk across studies) is provided in footnotes. The corresponding risk (and its 95% confidence interval) is based on the assumed risk in the comparison group and the relative effect of the intervention (and its 95% CI). | ||||||
| GRADE Working Group grades of evidence | ||||||
| 1Downgraded one level because of risk of bias (due to randomisation details or concealment allocation were not specified, participants were excluded from IV group if they developed an anaphylactoid reaction unresponsive to decreasing the administration rate. Unclear whether these participants were analysed and should have been included as intention‐to‐treat). | ||||||
| Intravenous acetylcysteine compared with placebo in people with fulminant hepatic failure (randomised trials) for paracetamol (acetaminophen) overdose | ||||||
| Patient or population: people with fulminant hepatic failure secondary to paracetamol (acetaminophen) overdose | ||||||
| Outcomes | Illustrative comparative risks* (95% CI) | Relative effect | No of participants | Quality of the evidence | Comments | |
| Assumed risk | Corresponding risk | |||||
| Placebo | Intravenous acetylcysteine | |||||
| Mortality | Study population | Peto OR 0.29 | 50 | ⊕⊕⊝⊝ | Trial Sequential Analysis‐adjusted CI ranged from 0.01 to 15.8. | |
| 800 per 1000 | 537 per 1000 | |||||
| *The basis for the assumed risk (e.g. the median control group risk across studies) is provided in footnotes. The corresponding risk (and its 95% confidence interval) is based on the assumed risk in the comparison group and the relative effect of the intervention (and its 95% CI). | ||||||
| GRADE Working Group grades of evidence | ||||||
| 1Downgraded one level because of risk of bias (randomisation and allocation concealment unclear). | ||||||
| Initial infusion rate of intravenous acetylcysteine over 15 minutes compared with 60 minutes (randomised trials) for paracetamol (acetaminophen) overdose | ||||||
| Patient or population: people with paracetamol (acetaminophen) overdose | ||||||
| Outcomes | Illustrative comparative risks* (95% CI) | Relative effect | No of participants | Quality of the evidence | Comments | |
| Assumed risk | Corresponding risk | |||||
| Initial infusion over 15 minutes | Initial infusion over 60 minutes | |||||
| Mortality | Study population | Not estimable | 180 | ⊕⊝⊝⊝ | ‐ | |
| 0 per 1000 | 0 per 1000 | |||||
| Hepatotoxicity | Study population | OR 1.34 (0.39 to 4.56) | 175 | ⊕⊝⊝⊝ | ‐ | |
| 56 per 1000 | 74 per 1000 | |||||
| Any adverse event | Study population | OR 0.51 (0.27 to 0.96) | 180 | ⊕⊕⊝⊝ | Trial Sequential Analysis‐adjusted CI ranged from 0.36 to 11.0. | |
| 752 per 1000 | 608 per 1000 | |||||
| *The basis for the assumed risk (e.g. the median control group risk across studies) is provided in footnotes. The corresponding risk (and its 95% confidence interval) is based on the assumed risk in the comparison group and the relative effect of the intervention (and its 95% CI). | ||||||
| GRADE Working Group grades of evidence | ||||||
| 1Downgraded one level because of risk of bias (possible bias due to method of randomisation via "randomisation slips" in a "closed box," many participants lost to follow‐up, and uneven numbers between the 2 treatment groups with many more participants in the 15‐minute infusion group). | ||||||
| Oral and intravenous acetylcysteine compared with intravenous acetylcysteine for paracetamol (acetaminophen) overdose | ||||||
| Patient or population: people with paracetamol (acetaminophen) overdose | ||||||
| Outcomes | Illustrative comparative risks* (95% CI) | Relative effect | No of participants | Quality of the evidence | Comments | |
| Assumed risk | Corresponding risk | |||||
| Intravenous acetylcysteine | Oral and intravenous acetylcysteine | |||||
| Mortality | Study population | Not estimable | 40 | ⊕⊝⊝⊝ | Primary outcome for this study was anaphylactoid reaction. Unable to analyse these results due to large number excluded from one arm.1 | |
| 0 per 1000 | 0 per 1000 | |||||
| Hepatotoxicity | ‐ | ‐ | ‐ | ‐ | ‐ | Not reported. |
| *The basis for the assumed risk (e.g. the median control group risk across studies) is provided in footnotes. The corresponding risk (and its 95% confidence interval) is based on the assumed risk in the comparison group and the relative effect of the intervention (and its 95% CI). | ||||||
| GRADE Working Group grades of evidence | ||||||
| 1Downgraded two levels because of serious risk of bias (randomisation sequence generation and allocation concealment not recorded, and a large number of participants excluded (10 excluded from the 25 randomised)). | ||||||
| Charcoal haemoperfusion compared with no intervention (randomised trials) for paracetamol (acetaminophen) overdose | ||||||
| Patient or population: people with paracetamol (acetaminophen) overdose | ||||||
| Outcomes | Illustrative comparative risks* (95% CI) | Relative effect | No of participants | Quality of the evidence | Comments | |
| Assumed risk | Corresponding risk | |||||
| No intervention | Charcoal haemoperfusion | |||||
| Mortality | Study population | Peto OR 7.39 | 16 | ⊕⊝⊝⊝ | Note very small numbers in this trial; only 8 in each group. With only 1 death in the charcoal haemoperfusion arm. The Trial Sequential Analysis‐adjusted CI could not be calculated. | |
| 0 per 1000 | 0 per 1000 | |||||
| *The basis for the assumed risk (e.g. the median control group risk across studies) is provided in footnotes. The corresponding risk (and its 95% confidence interval) is based on the assumed risk in the comparison group and the relative effect of the intervention (and its 95% CI). | ||||||
| GRADE Working Group grades of evidence | ||||||
| 1Downgraded one level because of risk of bias (randomisation sequence generation and allocation concealment not detailed). | ||||||
| Outcome or subgroup title | No. of studies | No. of participants | Statistical method | Effect size |
| 1 Mortality Show forest plot | 1 | Peto Odds Ratio (Peto, Fixed, 95% CI) | Totals not selected | |
| 2 Hepatotoxicity (aspartate aminotransferase > 1000 IU/L) Show forest plot | 1 | Odds Ratio (M‐H, Random, 95% CI) | Totals not selected | |
| Outcome or subgroup title | No. of studies | No. of participants | Statistical method | Effect size |
| 1 Mortality Show forest plot | 2 | 65 | Peto Odds Ratio (Peto, Fixed, 95% CI) | 0.53 [0.05, 5.22] |
| 2 Hepatotoxicity (aspartate aminotransferase > 1000 IU/L) Show forest plot | 2 | 65 | Odds Ratio (M‐H, Random, 95% CI) | 0.09 [0.02, 0.35] |
| Outcome or subgroup title | No. of studies | No. of participants | Statistical method | Effect size |
| 1 Mortality Show forest plot | 1 | Peto Odds Ratio (Peto, Fixed, 95% CI) | Totals not selected | |
| 2 Hepatotoxicity (aspartate aminotransferase > 1000 IU/L) Show forest plot | 1 | 27 | Odds Ratio (M‐H, Random, 95% CI) | 0.92 [0.05, 16.46] |
| Outcome or subgroup title | No. of studies | No. of participants | Statistical method | Effect size |
| 1 Mortality Show forest plot | 1 | Peto Odds Ratio (Peto, Fixed, 95% CI) | Totals not selected | |
| 2 Maximum alanine aminotransferase (IU/L) Show forest plot | 1 | Mean Difference (IV, Random, 95% CI) | Totals not selected | |
| Outcome or subgroup title | No. of studies | No. of participants | Statistical method | Effect size |
| 1 Mortality Show forest plot | 1 | Peto Odds Ratio (Peto, Fixed, 95% CI) | Totals not selected | |
| Outcome or subgroup title | No. of studies | No. of participants | Statistical method | Effect size |
| 1 Mortality Show forest plot | 1 | Peto Odds Ratio (Peto, Fixed, 95% CI) | Totals not selected | |
| 2 Hepatotoxicity Show forest plot | 1 | Odds Ratio (M‐H, Random, 95% CI) | Totals not selected | |
| 3 Any adverse event Show forest plot | 1 | Odds Ratio (M‐H, Random, 95% CI) | Totals not selected | |
| Outcome or subgroup title | No. of studies | No. of participants | Statistical method | Effect size |
| 1 Mortality Show forest plot | 1 | Peto Odds Ratio (Peto, Fixed, 95% CI) | Totals not selected | |
| 2 Hepatotoxicity Show forest plot | 1 | Odds Ratio (M‐H, Random, 95% CI) | Totals not selected | |
| 3 Vomiting, retching, or antiemetics from 0 to 2 hour Show forest plot | 1 | Odds Ratio (M‐H, Random, 95% CI) | Totals not selected | |
| 4 Vomiting, retching, or antiemetics 0 to 12 hour Show forest plot | 1 | Odds Ratio (M‐H, Random, 95% CI) | Totals not selected | |
| 5 Anaphylactoid symptoms (all) Show forest plot | 1 | Odds Ratio (M‐H, Random, 95% CI) | Totals not selected | |
| Outcome or subgroup title | No. of studies | No. of participants | Statistical method | Effect size |
| 1 Mortality Show forest plot | 1 | Peto Odds Ratio (Peto, Fixed, 95% CI) | Totals not selected | |