Вмешательства при передозировке парацетамола (ацетаминофена)
Abstract
Background
Paracetamol (acetaminophen) is the most widely used non‐prescription analgesic in the world. Paracetamol is commonly taken in overdose either deliberately or unintentionally. In high‐income countries, paracetamol toxicity is a common cause of acute liver injury. There are various interventions to treat paracetamol poisoning, depending on the clinical status of the person. These interventions include inhibiting the absorption of paracetamol from the gastrointestinal tract (decontamination), removal of paracetamol from the vascular system, and antidotes to prevent the formation of, or to detoxify, metabolites.
Objectives
To assess the benefits and harms of interventions for paracetamol overdosage irrespective of the cause of the overdose.
Search methods
We searched The Cochrane Hepato‐Biliary Group Controlled Trials Register (January 2017), CENTRAL (2016, Issue 11), MEDLINE (1946 to January 2017), Embase (1974 to January 2017), and Science Citation Index Expanded (1900 to January 2017). We also searched the World Health Organization International Clinical Trials Registry Platform and ClinicalTrials.gov database (US National Institute of Health) for any ongoing or completed trials (January 2017). We examined the reference lists of relevant papers identified by the search and other published reviews.
Selection criteria
Randomised clinical trials assessing benefits and harms of interventions in people who have ingested a paracetamol overdose. The interventions could have been gastric lavage, ipecacuanha, or activated charcoal, or various extracorporeal treatments, or antidotes. The interventions could have been compared with placebo, no intervention, or to each other in differing regimens.
Data collection and analysis
Two review authors independently extracted data from the included trials. We used fixed‐effect and random‐effects Peto odds ratios (OR) with 95% confidence intervals (CI) for analysis of the review outcomes. We used the Cochrane 'Risk of bias' tool to assess the risks of bias (i.e. systematic errors leading to overestimation of benefits and underestimation of harms). We used Trial Sequential Analysis to control risks of random errors (i.e. play of chance) and GRADE to assess the quality of the evidence and constructed 'Summary of findings' tables using GRADE software.
Main results
We identified 11 randomised clinical trials (of which one acetylcysteine trial was abandoned due to low numbers recruited), assessing several different interventions in 700 participants. The variety of interventions studied included decontamination, extracorporeal measures, and antidotes to detoxify paracetamol's toxic metabolite; which included methionine, cysteamine, dimercaprol, or acetylcysteine. There were no randomised clinical trials of agents that inhibit cytochrome P‐450 to decrease the activation of the toxic metabolite N‐acetyl‐p‐benzoquinone imine.
Of the 11 trials, only two had two common outcomes, and hence, we could only meta‐analyse two comparisons. Each of the remaining comparisons included outcome data from one trial only and hence their results are presented as described in the trials. All trial analyses lack power to access efficacy. Furthermore, all the trials were at high risk of bias. Accordingly, the quality of evidence was low or very low for all comparisons. Interventions that prevent absorption, such as gastric lavage, ipecacuanha, or activated charcoal were compared with placebo or no intervention and with each other in one four‐armed randomised clinical trial involving 60 participants with an uncertain randomisation procedure and hence very low quality. The trial presented results on lowering plasma paracetamol levels. Activated charcoal seemed to reduce the absorption of paracetamol, but the clinical benefits were unclear. Activated charcoal seemed to have the best risk:benefit ratio among gastric lavage, ipecacuanha, or supportive treatment if given within four hours of ingestion. There seemed to be no difference between gastric lavage and ipecacuanha, but gastric lavage and ipecacuanha seemed more effective than no treatment (very low quality of evidence). Extracorporeal interventions included charcoal haemoperfusion compared with conventional treatment (supportive care including gastric lavage, intravenous fluids, and fresh frozen plasma) in one trial with 16 participants. The mean cumulative amount of paracetamol removed was 1.4 g. One participant from the haemoperfusion group who had ingested 135 g of paracetamol, died. There were no deaths in the conventional treatment group. Accordingly, we found no benefit of charcoal haemoperfusion (very low quality of evidence). Acetylcysteine appeared superior to placebo and had fewer adverse effects when compared with dimercaprol or cysteamine. Acetylcysteine superiority to methionine was unproven. One small trial (low quality evidence) found that acetylcysteine may reduce mortality in people with fulminant hepatic failure (Peto OR 0.29, 95% CI 0.09 to 0.94). The most recent randomised clinical trials studied different acetylcysteine regimens, with the primary outcome being adverse events. It was unclear which acetylcysteine treatment protocol offered the best efficacy, as most trials were underpowered to look at this outcome. One trial showed that a modified 12‐hour acetylcysteine regimen with a two‐hour acetylcysteine 100 mg/kg bodyweight loading dose was associated with significantly fewer adverse reactions compared with the traditional three‐bag 20.25‐hour regimen (low quality of evidence). All Trial Sequential Analyses showed lack of sufficient power. Children were not included in the majority of trials. Hence, the evidence pertains only to adults.
Authors' conclusions
These results highlight the paucity of randomised clinical trials comparing different interventions for paracetamol overdose and their routes of administration and the low or very low level quality of the evidence that is available. Evidence from a single trial found activated charcoal seemed the best choice to reduce absorption of paracetamol. Acetylcysteine should be given to people at risk of toxicity including people presenting with liver failure. Further randomised clinical trials with low risk of bias and adequate number of participants are required to determine which regimen results in the fewest adverse effects with the best efficacy. Current management of paracetamol poisoning worldwide involves the administration of intravenous or oral acetylcysteine which is based mainly on observational studies. Results from these observational studies indicate that treatment with acetylcysteine seems to result in a decrease in morbidity and mortality, However, further evidence from randomised clinical trials comparing different treatments are needed.
PICO
Резюме на простом языке
Вмешательства при передозировке парацетамола (ацетаминофена)
Вопрос обзора: в этом обзоре мы рассмотрели доказательства в отношении вмешательств (видов лечения), используемых при отравлении людей парацетамолом (ацетаминофеном). В основном, мы попытались оценить влияние этих вмешательств на число смертей и необходимость трансплантации печени.
Актуальность: парацетамол является одним из самых распространённых лекарств, принимаемых сверх предписанной дозы. Преднамеренное или случайное отравление парацетамолом является частой причиной поражения печени.
Дата поиска: доказательства актуальны на январь 2017 года.
Характеристика исследований: рандомизированные клинические испытания (исследования, в которых людей в случайном порядке распределяют в одну из двух или более групп лечения), в которых участники обратились за медицинской помощью по причине того, что приняли чрезмерную дозу парацетамола, преднамеренно или случайно, независимо от количества принятого парацетамола, возраста, пола или других медицинских состояний пациента.
Существует множество различных вмешательств, которые могут быть использованы для лечения людей с отравлением парацетамолом. Эти вмешательства направлены на уменьшение абсорбции [всасывания] парацетамола в пищеварительном тракте и, следовательно, уменьшение количества парацетамола, которое попадает в кровоток. Эти средства включают активированный уголь (который связывает парацетамол в желудке), промывание желудка (для удаления из желудка как можно большего количества парацетамола) или ипекакуана (сироп, который при приеме внутрь вызывает рвоту (тошноту)). После всасывания парацетамол через кровоток попадает в печень, где большая его часть распадается на безопасные составляющие. Однако, небольшая часть этого лекарства превращается в токсичный продукт, с которым печень обычно может справиться, но приём большого количества парацетамола является для печени избыточным. Вследствие этого токсичный продукт может повредить печень и привести к печёночной недостаточности, к почечной недостаточности, а в некоторых случаях к смерти. Другие вмешательства для лечения отравления парацетамолом включают лекарства (антидоты), которые могут уменьшить количество токсичных продуктов (например, лекарственное средство циметидин) или расщепить токсичные продукты (включают такие лекарственные средства, как метионин, цистеамин, димеркапрол или ацетилцистеин). Наконец, могут быть предприняты попытки удалить парацетамол и его токсичные продукты из кровотока при помощи специального оборудования для очистки крови. Все эти виды лечения были изучены.
Мы нашли 11 рандомизированных клинических испытаний с участием 700 человек. В большинстве этих испытаний рассматривали различные виды лечения.
Основные результаты: активированный уголь, промывание желудка и ипекакуана могут уменьшить всасывание парацетамола при условии их применения в течение одного‐двух часов после приёма парацетамола, но клиническая польза неясна. Активированный уголь, возможно, является лучшим выбором, если человек может его принять. Иногда люди не могут принять внутрь активированный уголь по причине сонливости или потому что не нравится вкус, структура (либо оба этих фактора).
Из видов лечения, направленных на удаление токсичных продуктов парацетамола, ацетилцистеин, вероятно, может уменьшить частоту поражения печени от отравления парацетамолом. Кроме того, он имеет меньше побочных эффектов, чем другие антидоты, такие как димеркапрол и цистеамин; его преимущество над метионином было неясным. Ацетилцистеин следует назначать людям с отравлением парацетамолом при риске повреждения печени, риск зависит от принятой дозы, времени приёма пищи и данных лабораторных исследований.
В наиболее поздних клинических испытаниях рассматривали способы снижения частоты побочных эффектов с помощью внутривенного (через вену) введения ацетилцистеина, изменив способ введения. Эти клинические испытания показали, что при использовании более медленной инфузии и низкой начальной дозы ацетилцистеина может быть уменьшена доля таких побочных эффектов, как тошнота, рвота, а также аллергия (нежелательные реакции организма на лекарство, такие как сыпь).
Качество доказательств: этот обзор вмешательств при отравлении парацетамолом обнаружил удивительно небольшое число опубликованных рандомизированных клинических испытаний для этого достаточно распространённого состояния. Кроме того, в большинстве испытаний было мало участников и во всех испытаниях был высокий риск смещения. Соответственно, качество доказательств следует рассматривать как низкое или очень низкое.
Authors' conclusions
Summary of findings
| Methionine and supportive treatment compared with supportive treatment (randomised trials) for paracetamol (acetaminophen) overdose | ||||||
| Patient or population: people with paracetamol (acetaminophen) overdose | ||||||
| Outcomes | Illustrative comparative risks* (95% CI) | Relative effect | No of participants | Quality of the evidence | Comments | |
| Assumed risk | Corresponding risk | |||||
| Supportive treatment | Methionine and supportive treatment | |||||
| Mortality | Study population | Peto OR 0.14 | 26 | ⊕⊝⊝⊝ | The Trial Sequential Analysis‐adjusted CI could not be estimated due to the paucity of data. | |
| 77 per 1000 | 12 per 1000 | |||||
| Hepatotoxicity | Study population | OR 0.05 | 26 | ⊕⊕⊝⊝ | ‐ | |
| 615 per 1000 | 74 per 1000 | |||||
| *The basis for the assumed risk (e.g. the median control group risk across studies) is provided in footnotes. The corresponding risk (and its 95% confidence interval) is based on the assumed risk in the comparison group and the relative effect of the intervention (and its 95% CI). | ||||||
| GRADE Working Group grades of evidence | ||||||
| 1Downgraded one level for risk of bias (concerns regarding randomisation sequence generation and allocation concealment probably compromised). | ||||||
| Cysteamine compared with no intervention (randomised trials) for paracetamol (acetaminophen) overdose | ||||||
| Patient or population: people with paracetamol (acetaminophen) overdose | ||||||
| Outcomes | Illustrative comparative risks* (95% CI) | Relative effect | No of participants | Quality of the evidence | Comments | |
| Assumed risk | Corresponding risk | |||||
| No intervention | Cysteamine | |||||
| Mortality | Study population | Peto OR 0.53 | 65 | ⊕⊝⊝⊝ | ‐ | |
| 61 per 1000 | 33 per 1000 | |||||
| Hepatotoxicity (aspartate aminotransferase > 1000 IU/L) | Study population | OR 0.09 | 65 | ⊕⊕⊝⊝ | Trial Sequential Analysis‐adjusted CI ranged from 0.00 to 24.0. | |
| 545 per 1000 | 97 per 1000 | |||||
| *The basis for the assumed risk (e.g. the median control group risk across studies) is provided in footnotes. The corresponding risk (and its 95% confidence interval) is based on the assumed risk in the comparison group and the relative effect of the intervention (and its 95% CI). | ||||||
| GRADE Working Group grades of evidence | ||||||
| 1Downgraded one level because of risk of bias (method of randomisation had potential for bias and allocation concealment not specified). | ||||||
| Cysteamine compared with dimercaprol (randomised trials) for paracetamol (acetaminophen) overdose | ||||||
| Patient or population: people with paracetamol (acetaminophen) overdose | ||||||
| Outcomes | Illustrative comparative risks* (95% CI) | Relative effect | No of participants | Quality of the evidence | Comments | |
| Assumed risk | Corresponding risk | |||||
| Dimercaprol | Cysteamine | |||||
| Mortality | Study population | Peto OR 0.14 | 52 | ⊕⊝⊝⊝ | ‐ | |
| 38 per 1000 | 6 per 1000 | |||||
| Mean maximum alanine aminotransferase (IU/L) | The mean maximum alanine aminotransferase (IU/L) in the dimercaprol was 754 | The mean maximum alanine aminotransferase (IU/L) in the cysteamine group was 722 (IU/L) | ‐ | 52 | ⊕⊕⊝⊝ | Difference ‐32.00 (95% CI ‐512.9 to 448.9). The difference between the 2 groups was not significant. |
| *The basis for the assumed risk (e.g. the median control group risk across studies) is provided in footnotes. The corresponding risk (and its 95% confidence interval) is based on the assumed risk in the comparison group and the relative effect of the intervention (and its 95% CI). | ||||||
| GRADE Working Group grades of evidence | ||||||
| 1Downgraded two levels because of serious imprecision (due to small sample studied, low number of deaths, and confidence intervals wide). | ||||||
| Cysteamine compared with methionine (randomised trials) for paracetamol (acetaminophen) overdose | ||||||
| Patient or population: people with paracetamol (acetaminophen) overdose | ||||||
| Outcomes | Illustrative comparative risks* (95% CI) | Relative effect | No of participants | Quality of the evidence | Comments | |
| Assumed risk | Corresponding risk | |||||
| Methionine | Cysteamine | |||||
| Mortality | Study population | Not estimable | 27 | ⊕⊝⊝⊝ | ‐ | |
| 0 per 1000 | 0 per 1000 | |||||
| Hepatotoxicity (aspartate aminotransferase > 1000 U/L) | Study population | OR 0.92 | 27 | ⊕⊝⊝⊝ | ‐ | |
| 77 per 1000 | 71 per 1000 | |||||
| *The basis for the assumed risk (e.g. the median control group risk across studies) is provided in footnotes. The corresponding risk (and its 95% confidence interval) is based on the assumed risk in the comparison group and the relative effect of the intervention (and its 95% CI). | ||||||
| GRADE Working Group grades of evidence | ||||||
| 1Downgraded one level because of risk of bias (concerns regarding randomisation and allocation concealment not specified). | ||||||
| Standard intravenous acetylcysteine regimen (20.5 hours) compared with shorter (12 hours) protocol for paracetamol (acetaminophen) overdose | ||||||
| Patient or population: people with paracetamol (acetaminophen) overdose | ||||||
| Outcomes | Illustrative comparative risks* (95% CI) | Relative effect | No of participants | Quality of the evidence | Comments | |
| Assumed risk | Corresponding risk | |||||
| Standard intravenous acetylcysteine regimen (20.25 hours) | Shorter (12‐hour protocol) | |||||
| Mortality | Study population | Not estimable | 222 | ⊕⊝⊝⊝ | ‐ | |
| 0 per 1000 | 0 per 1000 | |||||
| Hepatotoxicity | Study population | OR 0.67 (0.11 to 4.08) | 202 (1 RCT) | ⊕⊝⊝⊝ | ‐ | |
| 30 per 1000 | 20 per 1000 (3 to 111) | |||||
| Vomiting, retching, or antiemetics from 0‐2 hours | Study population | OR 0.30 (0.17 to 0.53) | 217 | ⊕⊕⊝⊝ | ‐ | |
| 651 per 1000 | 359 per 1000 | |||||
| Vomiting, retching, or antiemetics 0‐12 hours | Study population | OR 0.40 (0.22 to 0.75) | 203 | ⊕⊕⊝⊝ | ‐ | |
| 784 per 1000 | 593 per 1000 | |||||
| Anaphylactoid symptoms | Study population | OR 0.39 (0.21 to 0.70) | 208 | ⊕⊕⊝⊝ | ‐ | |
| 750 per 1000 | 539 per 1000 | |||||
| *The basis for the assumed risk (e.g. the median control group risk across studies) is provided in footnotes. The corresponding risk (and its 95% confidence interval) is based on the assumed risk in the comparison group and the relative effect of the intervention (and its 95% CI). | ||||||
| GRADE Working Group grades of evidence | ||||||
| 1Downgraded one level because of indirectness (a large number of prospective participants excluded prior to randomisation: 1539 judged suitable for treatment, only 222 randomised). | ||||||
| Oral compared with intravenous acetylcysteine for paracetamol (acetaminophen) overdose | ||||||
| Patient or population: people with paracetamol (acetaminophen) overdose | ||||||
| Outcomes | Illustrative comparative risks* (95% CI) | Relative effect | No of participants | Quality of the evidence | Comments | |
| Assumed risk | Corresponding risk | |||||
| Intravenous acetylcysteine | Oral acetylcysteine | |||||
| Mortality | Study population | Not estimable | 66 | ⊕⊝⊝⊝ | ‐ | |
| 0 per 1000 | 0 per 1000 | |||||
| Hepatotoxicity | ‐ | ‐ | ‐ | ‐ | ‐ | Rates of hepatotoxicity not reported, only mean alanine aminotransferase between the 2 study groups. |
| Nausea | Study population | OR 2.71 | 66 | ⊕⊝⊝⊝ | ‐ | |
| 333 per 1000 | 575 per 1000 | |||||
| Vomiting | Study population | OR 2.10 | 66 | ⊕⊝⊝⊝ | ‐ | |
| 152 per 1000 | 273 per 1000 | |||||
| *The basis for the assumed risk (e.g. the median control group risk across studies) is provided in footnotes. The corresponding risk (and its 95% confidence interval) is based on the assumed risk in the comparison group and the relative effect of the intervention (and its 95% CI). | ||||||
| GRADE Working Group grades of evidence | ||||||
| 1Downgraded one level because of risk of bias (due to randomisation details or concealment allocation were not specified, participants were excluded from IV group if they developed an anaphylactoid reaction unresponsive to decreasing the administration rate. Unclear whether these participants were analysed and should have been included as intention‐to‐treat). | ||||||
| Intravenous acetylcysteine compared with placebo in people with fulminant hepatic failure (randomised trials) for paracetamol (acetaminophen) overdose | ||||||
| Patient or population: people with fulminant hepatic failure secondary to paracetamol (acetaminophen) overdose | ||||||
| Outcomes | Illustrative comparative risks* (95% CI) | Relative effect | No of participants | Quality of the evidence | Comments | |
| Assumed risk | Corresponding risk | |||||
| Placebo | Intravenous acetylcysteine | |||||
| Mortality | Study population | Peto OR 0.29 | 50 | ⊕⊕⊝⊝ | Trial Sequential Analysis‐adjusted CI ranged from 0.01 to 15.8. | |
| 800 per 1000 | 537 per 1000 | |||||
| *The basis for the assumed risk (e.g. the median control group risk across studies) is provided in footnotes. The corresponding risk (and its 95% confidence interval) is based on the assumed risk in the comparison group and the relative effect of the intervention (and its 95% CI). | ||||||
| GRADE Working Group grades of evidence | ||||||
| 1Downgraded one level because of risk of bias (randomisation and allocation concealment unclear). | ||||||
| Initial infusion rate of intravenous acetylcysteine over 15 minutes compared with 60 minutes (randomised trials) for paracetamol (acetaminophen) overdose | ||||||
| Patient or population: people with paracetamol (acetaminophen) overdose | ||||||
| Outcomes | Illustrative comparative risks* (95% CI) | Relative effect | No of participants | Quality of the evidence | Comments | |
| Assumed risk | Corresponding risk | |||||
| Initial infusion over 15 minutes | Initial infusion over 60 minutes | |||||
| Mortality | Study population | Not estimable | 180 | ⊕⊝⊝⊝ | ‐ | |
| 0 per 1000 | 0 per 1000 | |||||
| Hepatotoxicity | Study population | OR 1.34 (0.39 to 4.56) | 175 | ⊕⊝⊝⊝ | ‐ | |
| 56 per 1000 | 74 per 1000 | |||||
| Any adverse event | Study population | OR 0.51 (0.27 to 0.96) | 180 | ⊕⊕⊝⊝ | Trial Sequential Analysis‐adjusted CI ranged from 0.36 to 11.0. | |
| 752 per 1000 | 608 per 1000 | |||||
| *The basis for the assumed risk (e.g. the median control group risk across studies) is provided in footnotes. The corresponding risk (and its 95% confidence interval) is based on the assumed risk in the comparison group and the relative effect of the intervention (and its 95% CI). | ||||||
| GRADE Working Group grades of evidence | ||||||
| 1Downgraded one level because of risk of bias (possible bias due to method of randomisation via "randomisation slips" in a "closed box," many participants lost to follow‐up, and uneven numbers between the 2 treatment groups with many more participants in the 15‐minute infusion group). | ||||||
| Oral and intravenous acetylcysteine compared with intravenous acetylcysteine for paracetamol (acetaminophen) overdose | ||||||
| Patient or population: people with paracetamol (acetaminophen) overdose | ||||||
| Outcomes | Illustrative comparative risks* (95% CI) | Relative effect | No of participants | Quality of the evidence | Comments | |
| Assumed risk | Corresponding risk | |||||
| Intravenous acetylcysteine | Oral and intravenous acetylcysteine | |||||
| Mortality | Study population | Not estimable | 40 | ⊕⊝⊝⊝ | Primary outcome for this study was anaphylactoid reaction. Unable to analyse these results due to large number excluded from one arm.1 | |
| 0 per 1000 | 0 per 1000 | |||||
| Hepatotoxicity | ‐ | ‐ | ‐ | ‐ | ‐ | Not reported. |
| *The basis for the assumed risk (e.g. the median control group risk across studies) is provided in footnotes. The corresponding risk (and its 95% confidence interval) is based on the assumed risk in the comparison group and the relative effect of the intervention (and its 95% CI). | ||||||
| GRADE Working Group grades of evidence | ||||||
| 1Downgraded two levels because of serious risk of bias (randomisation sequence generation and allocation concealment not recorded, and a large number of participants excluded (10 excluded from the 25 randomised)). | ||||||
| Charcoal haemoperfusion compared with no intervention (randomised trials) for paracetamol (acetaminophen) overdose | ||||||
| Patient or population: people with paracetamol (acetaminophen) overdose | ||||||
| Outcomes | Illustrative comparative risks* (95% CI) | Relative effect | No of participants | Quality of the evidence | Comments | |
| Assumed risk | Corresponding risk | |||||
| No intervention | Charcoal haemoperfusion | |||||
| Mortality | Study population | Peto OR 7.39 | 16 | ⊕⊝⊝⊝ | Note very small numbers in this trial; only 8 in each group. With only 1 death in the charcoal haemoperfusion arm. The Trial Sequential Analysis‐adjusted CI could not be calculated. | |
| 0 per 1000 | 0 per 1000 | |||||
| *The basis for the assumed risk (e.g. the median control group risk across studies) is provided in footnotes. The corresponding risk (and its 95% confidence interval) is based on the assumed risk in the comparison group and the relative effect of the intervention (and its 95% CI). | ||||||
| GRADE Working Group grades of evidence | ||||||
| 1Downgraded one level because of risk of bias (randomisation sequence generation and allocation concealment not detailed). | ||||||
Background
Paracetamol (acetaminophen) is a mild analgesic and antipyretic agent which is commonly used worldwide (O'Grady 1997). In therapeutic doses (for adults 500 mg to 1000 mg, three or four times per day), paracetamol has few adverse events (Koch‐Weser 1976). During the late 1960s it was realised that paracetamol poisoning could result in severe hepatotoxicity, liver failure, renal failure, and death (Davidson 1966). Paracetamol is commonly taken in overdose either accidentally or intentionally (Buckley 2007), and in many countries, it is the most common single compound taken in overdose (Prescott 2009). In general, a single dose of more than 10 g or 150 mg/kg to 200 mg/kg of paracetamol carries a risk of liver damage (Buckley 1999a), but smaller doses may also cause liver damage (Kwan 1995), particularly in people with chronic alcohol abuse or anorexia. Paracetamol toxicity is the leading cause of acute liver failure in many high‐income countries (Lee 2004; Morgan 2005; Bernal 2013). One large prospective observational cohort study of 31 liver disease and transplant centres in the US, enrolling 2070 participants with acute liver failure between 1998 and 2013, found that paracetamol poisoning was the cause in half of the participants (Reuben 2016).
It was not until the 1970s that several antidotes that replenish glutathione and detoxify N‐acetyl‐p‐benzoquinone imine (NAPQI) were developed; these included methionine, cysteine, cysteamine, and dimercaprol (Prescott 1976). Oral methionine and intravenous acetylcysteine have been used as antidotes in the UK from this time onwards (McElhatton 1997). In one observational study from Edinburgh, intravenous acetylcysteine first‐line was claimed to be equally as effective as cysteamine and methionine and free of adverse effects (Prescott 1979). Ever since, acetylcysteine has been accepted as an antidote for paracetamol overdose either intravenously or orally. Much of the evidence for its use and efficacy comes from observational studies. Acetylcysteine has now become the mainstay and standard treatment for paracetamol poisoning and can either be administered as a 20‐ to 21‐hour intravenous acetylcysteine regimen or an oral acetylcysteine regimen (Smilkstein 1991; Woo 2000; Williamson 2013).
Before acetylcysteine treatment was available, morbidity following paracetamol overdose was significant. In people with an initial paracetamol concentration above the probable risk nomogram line (200 mg/L at four hours), the reported mortality of untreated people was 5% (Prescott 1979). This rate fell to 0.4% after the introduction of acetylcysteine (Gunnell 1997). Furthermore, the previous Cochrane systematic review of acetylcysteine observational studies found acute liver injury in 58% of people who received no antidote. This decreased to 7% if acetylcysteine was administered within 10 hours of ingestion and 27% if administered beyond 10 hours (Brok 2006). One systematic review of oral and intravenous acetylcysteine treatment following paracetamol poisoning from 1966 to 2009 found similar findings with late (greater than eight to 10 hours) acetylcysteine treatment associated with increased rates of hepatotoxicity (postbaseline aspartate aminotransferase (AST) or alanine aminotransferase (ALT) level above 1000 IU/L) (Green 2013). Green and colleagues included 5164 participants with paracetamol poisoning (definition varied according to the study) in their meta‐analysis; they also compared intravenous and oral acetylcysteine. Rates of hepatotoxicity were similar in both groups at 5% to 6% with early treatment (within eight to 10 hours postingestion) and increasing to 23% to 26% if treatment was given beyond this time.
Observational studies of acetylcysteine since the last Cochrane Review and meta‐analysis by Green and colleagues show very similar results with higher rates of hepatotoxicity in people treated more than eight hours postingestion (Duffull 2013; Marks 2017). More recently, observational studies have found an increased risk of acute liver injury despite early treatment in people with higher plasma paracetamol concentrations at admission. This relationship persists even in people treated within eight hours of acetylcysteine (Cairney 2016; Chiew 2017; Marks 2017). In these observational studies, deaths were uncommon and remained at less than 1%. Observational acetylcysteine studies continue to show low rates of acute liver injury particularly in people treated early. The rate of liver injury and death has improved from historical patient series of no antidote and this has meant randomised clinical trials assessing acetylcysteine versus no treatment have not been considered feasible. Instead, trials have focused on different acetylcysteine regimens dose or duration (or both) to examine the optimal way of administering acetylcysteine. Previous versions of this review have also included and examined observational studies. In this updated review, we excluded observational studies. In the last review and since, nearly all observational studies have examined outcomes with one treatment arm and no comparison groups. Hence, further analysis of observational studies adds little to evidence from previous reviews on treatment effectiveness or comparative effectiveness.
While methionine has fallen out of use in Western countries, it remains on the World Health Organization (WHO) essential drug list, a position that was reviewed and affirmed in 2011 (Shiago 2011). In 1984, the therapeutic guidelines in the British Medical Journal regarded methionine and acetylcysteine as equally effective (Henry 1984). The 2011 WHO panel review of the evidence concluded that acetylcysteine and methionine had equal efficacy and safety (and specifically that there was no evidence against this proposition), and thus, the cheaper methionine was the most cost‐effective antidote. Hence, it is widely used in low‐ to middle‐income countries such as Sri Lanka (Senarathna 2012).
Activated charcoal is a mode of decontamination often used in the management of people who have overdosed. Multiple observational and volunteer studies have investigated the effect of charcoal on paracetamol absorption (Buckley 1999a; Yeates 2000). Buckley and colleagues, in one observational study of 981 participants, found that people receiving activated charcoal within two hours of ingestion were less likely to have a toxic paracetamol concentration. In people receiving activated charcoal within two hours, 15% had a paracetamol concentration above 150 mg/L at the four‐hour nomogram treatment line compared to 41% having a level above the same line who did not receive activated charcoal (Buckley 1999a). Similarly, Duffull and colleagues, in one observational study of 1571 people with acute paracetamol poisoning found that those receiving activated charcoal had a reduced probability of having a paracetamol concentration above 150 mg/L at the four‐hour nomogram line (Duffull 2013). One observational series of 200 participants ingesting greater than 40 g of paracetamol found paracetamol concentrations were markedly reduced in those receiving activated charcoal within four hours and a probable benefit of reducing the risk of hepatotoxicity (ALT greater than 1000 U/L) (Chiew 2017). Healthy volunteer studies similarly showed a reduction in paracetamol absorption when activated charcoal was administered within two hours of ingestion (Yeates 2000; Green 2001; Christophersen 2002).
Paracetamol poisoning treatment protocols vary worldwide (Wolf 2007; MHPRA 2012; Chiew 2015; Heard 2017). People are unlikely to develop hepatotoxicity if they have ingested less than 150 mg/kg to 200 mg/kg of paracetamol (Vale 2004; Dart 2006), or 10 g of paracetamol (whichever is less) (Buckley 1999a), unless people have other risk factors such as chronic ethanol abuse or anorexia. A prediction of a person's risk based on reported dose of paracetamol may be limited as they or their relatives are often unaware of the exact amount ingested and the exact timing. The decision to treat a person with acute paracetamol ingestion with either acetylcysteine or methionine is usually based on their paracetamol concentration taken at a known time since ingestion. This concentration is plotted on a paracetamol nomogram such as the Rumack‐Matthew nomogram, to determine the need for treatment (Smilkstein 1988). Plotting paracetamol concentration versus time since ingestion, there are various 'treatment lines' and 'risk lines' for developing hepatotoxicity that are utilised to guide treatment. These 'nomograms' lines are sometimes referred to as the high risk (300 line; i.e. a line commencing from a paracetamol concentration of 300 mg/L at four hours postingestion), the probable risk (200 line), and the possible risk (150 line) used to guide treatment in such countries as Canada, Australia, New Zealand, and the US (Rumack 1975; Prescott 1979; Smilkstein 1991; Daly 2008). In the UK in 2012, the treatment line was lowered further to the 100 mg/L (660 μmol/L) line (MHPRA 2012). However, other countries do not utilise these nomograms and treat all people with acute paracetamol ingestion with acetylcysteine (Schmidt 2001). If the time of ingestion is unknown, or the treating doctor is not confident of the history of ingestion, or if a paracetamol concentration is not available or not used, treatment with acetylcysteine is commenced (Dart 2006; Daly 2008).
Description of the condition
Paracetamol overdose prior to the 1970s was associated with significant morbidity and mortality. It is still the leading cause of acute liver failure in Western countries (Bernal 2013). Paracetamol is extensively metabolised by the liver; in therapeutic doses in adults, the major non‐toxic metabolites are sulphate and glucuronide conjugates which account for 30% (sulphate) and 55% (glucuronide) of the metabolites. A highly reactive toxic metabolite NAPQI is formed by cytochrome P450 2E1; it is responsible for the hepatocellular injury that occurs when paracetamol is taken in excess (Mitchell 1974). The small amounts of NAPQI produced after therapeutic doses of paracetamol are detoxified by glutathione‐dependent reactions. However, in paracetamol overdose, the formation of NAPQI depletes glutathione; once glutathione is depleted to about one‐third of its normal level, NAPQI starts binding covalently to critical cellular proteins. It is hypothesised that this results in loss of activity and function of critical proteins and eventually hepatic cell death (Mitchell 1974).
Description of the intervention
Many different types of interventions are used to treat paracetamol overdose. These interventions include:
-
those that decrease paracetamol absorption from the gastrointestinal tract, including gastric lavage, activated charcoal, and ipecacuanha (ipecac syrup, an emetic);
-
antidotes that prevent the conversion of paracetamol to its hepatotoxic metabolite NAPQI, such as cimetidine;
-
antidotes to detoxify NAPQI, such as methionine, cysteine, cysteamine, dimercaprol, or acetylcysteine;
-
those that remove paracetamol from the blood after the drug has entered the bloodstream. This includes intermittent haemodialysis, intermittent haemoperfusion, continuous renal replacement modalities, or charcoal haemoperfusion.
How the intervention might work
There are many different interventions that can be utilised to manage a person with paracetamol poisoning. These interventions work in different ways. First, there are interventions to reduce the absorption of paracetamol once ingested (decontamination), either by binding paracetamol to activated charcoal or removing paracetamol from the stomach by gastric lavage or ipecac syrup (forcing the person to vomit) (Underhill 1990; Buckley 1999a).
Once absorbed into the bloodstream, paracetamol can be removed from the blood, in cases of severe poisoning, with intermittent haemodialysis, intermittent haemoperfusion, continuous renal replacement modalities, or charcoal haemoperfusion (O'Grady 1988; Higgins 1996; Gosselin 2014).
Other treatment options are drugs such as cimetidine that work by inhibiting cytochrome P‐450. The enzyme cytochrome P‐450 breaks down paracetamol into the toxic metabolite NAPQI. By inhibiting cytochrome‐P450 this may reduce the production of NAPQI (Speeg 1995).
Antidotes that detoxify NAPQI, work by replenishing glutathione, and hence preventing the toxic effects due to this metabolite. Several antidotes to NAPQI were developed in the 1970s, including methionine, cysteine, cysteamine, and dimercaprol (Prescott 1976). The amino acid, cysteine, is the main factor limiting the synthesis of glutathione. Acetylcysteine is a cysteine precursor, that is hydrolysed intracellularly to cysteine, thus replenishing glutathione (Olsson 1988). Glutathione can then covalently bind NAPQI in a 1:1 ratio. NAPQI is then detoxified via irreversible glutathione conjugation to two non‐toxic metabolites, mercapturic acid and cysteine conjugates (Prescott 1980). Acetylcysteine also supplies thiol groups, which can directly react with NAPQI in hepatocytes (Jones 1998).
Why it is important to do this review
Paracetamol overdose is common and is still a leading cause of acute liver failure in many countries. This updated systematic review aimed to assess the benefits and harms of interventions for paracetamol overdose.
Objectives
To assess the benefits and harms of interventions for paracetamol overdosage irrespective of the cause of the overdose.
Methods
Criteria for considering studies for this review
Types of studies
We included randomised clinical trials examining the benefits and harms of interventions for people with paracetamol overdose regardless of sources of publication and language.
Types of participants
People who had ingested a paracetamol overdose. The definition of a paracetamol overdose was not clear‐cut and the risk depended on many factors such as age, weight, comorbidities, concomitant medication, and alcohol ingestion. Therefore, all trials on people with paracetamol poisoning were included irrespective of inclusion criteria applied in the trial (e.g. age, time to treatment, comorbidities, etc.).
Types of interventions
Intervention with gastric lavage, ipecacuanha, or activated charcoal at any dose or duration compared with placebo/no intervention or with each other.
Intervention with antidotes (cimetidine, cysteamine, methionine, dimercaprol, and acetylcysteine) compared with each other, with placebo/no interventions, or other interventions for paracetamol overdose.
Intervention with extracorporeal treatments such as charcoal haemoperfusion, intermittent haemodialysis, or continuous renal replacement therapy compared with placebo/no interventions or other interventions for paracetamol overdose.
Different doses, durations, or method of administration (oral or intravenously) of acetylcysteine compared with each other.
Cointerventions were allowed if received equally in all groups of the trial.
We did not want to examine interventions for liver failure, for example different types of liver support systems, or interventions to treat secondary complications of liver failure such as hepatorenal failure, hepatic encephalopathy, coagulopathy, and cerebral oedema. Interventions for acute liver failure would benefit from being addressed in a separate review, with a subgroup analysis of people with paracetamol overdose.
Types of outcome measures
Primary outcomes
-
Mortality: all‐cause and liver‐related.
-
Liver transplantation.
Secondary outcomes
-
Acute hepatitis (elevation of the serum transaminases greater than three times the upper limit of normal (ULN)).
-
Hepatotoxicity (most commonly defined as number of participants with serum AST or serum ALT greater than 1000 IU/L).
-
Severe acute hepatitis: transaminitis plus an international normalised ratio (INR) greater than 2.
-
Acute (fulminant) hepatic failure defined as development of hepatic encephalopathy on a background of severe acute hepatitis (elevation of the serum transaminases plus prolongation of the prothrombin time).
-
Adverse events.
-
Plasma paracetamol concentration (e.g. plasma paracetamol above a risk line (nomogram)), fall in plasma paracetamol versus time, absorption of paracetamol measured as area under the curve (AUC) of the plasma (or urine) concentration versus time curve.
Search methods for identification of studies
Electronic searches
We searched The Cochrane Hepato‐Biliary Group Controlled Trials Register (Gluud 2017; January 2017), Cochrane Central Register of Controlled Trials (CENTRAL) in the Cochrane Library (2016, Issue 11), MEDLINE Ovid (1946 to January 2017), Embase Ovid (1974 to January 2017), and Science Citation Index Expanded (Web of Science; 1900 to January 2017) (Royle 2003). Appendix 1 provides the search strategies and the time spans of the searches.
Searching other resources
We examined the reference lists of relevant papers identified by the search and other published reviews. We searched the WHO International Clinical Trials Registry Platform (www.who.int/ictrp/en/), which includes (among others) the EU Clinical Trials Register and Australian New Zealand Clinical Trials Registry. We searched the ClinicalTrials.gov database, a service of the US National Institute of Health for trials (clinicaltrials.gov).
Data collection and analysis
Two review authors (AC, NB) screened the electronic search results for possibly relevant trials and retrieved the full text. Two review authors (AC and NB) evaluated whether the trials fulfilled the inclusion criteria and extracted data. We resolved disagreements by discussion. We listed included trials (Characteristics of included studies table) and excluded trials (Characteristics of excluded studies table) with the reason for exclusion. We wrote to the principal investigator of included trials to ask for relevant data if such data were not presented in the published reports.
Assessment of risk of bias in included studies
As there were changes in the risk of bias domains since the last review, we reassessed all trials. Two review authors (AC and NB) independently assessed risk of bias of all included studies using Cochrane's tool for assessing domains for risk of bias (Higgins 2011a) according to The Cochrane Hepato‐Biliary Group Module (Gluud 2017) and methodological studies (Schulz 1995; Moher 1998; Kjaergard 2001; Wood 2008; Savović 2012a; Savović 2012b; Lundh 2017). We used the following definitions in the assessment of risk of bias.
Allocation sequence generation
-
Low risk of bias: sequence generation was achieved using computer random number generation or a random number table. Drawing lots, tossing a coin, shuffling cards, and throwing dice were adequate if performed by an independent person not otherwise involved in the trial.
-
Unclear risk of bias: the method of sequence generation was not specified.
-
High risk of bias: the sequence generation method was not randomised or only quasi‐randomised. We only used these studies for the assessments of harms and not for benefits.
Allocation concealment
-
Low risk of bias: the participant allocations could not have been foreseen in advance of, or during, enrolment. Allocation was controlled by a central and independent randomisation unit, onsite locked computer, identically looking numbered sealed opaque envelopes, or drug bottles or containers prepared by an independent pharmacist or investigator. The allocation sequence was unknown to the investigators.
-
Unclear risk of bias: the method used to conceal the allocation was not described so that intervention allocations may have been foreseen in advance of, or during, enrolment.
-
High risk of bias: the allocation sequence was likely to be known to the investigators who assigned the participants. We only used these studies for the assessments of harms and not for benefits.
Blinding of participants and treatment providers (performance bias)
-
Low risk of bias: it was mentioned that both participants and personnel providing the interventions were blinded and this was described.
-
Unclear risk of bias: it was not mentioned if the trial was blinded, or the extent of blinding was insufficiently described.
-
High risk of bias: no blinding or incomplete blinding was performed.
Blinding of outcome assessment (detection bias)
-
Low risk of bias: it was mentioned that outcome assessors were blinded and this was described.
-
Unclear risk of bias: it was not mentioned if the trial was blinded, or the extent of blinding was insufficiently described.
-
High risk of bias: no blinding or incomplete blinding was performed.
Incomplete outcome data
-
Low risk of bias: missing data were unlikely to make treatment effects depart from plausible values. The study used sufficient methods, such as multiple imputation, to handle missing data.
-
Unclear risk of bias: there was insufficient information to assess whether missing data in combination with the method used to handle missing data were likely to induce bias on the results.
-
High risk of bias: the results were likely to be biased due to missing data.
Selective outcome reporting
-
Low risk of bias: a protocol was published before or at the time the trial was begun and the outcomes called for in the protocol were reported on. If there was no protocol or the protocol was published after the trial had begun, reporting of all‐cause mortality and serious adverse events granted the trial a grade of low risk of bias.
-
Unclear risk of bias: no protocol was published and the outcomes all‐cause mortality and serious adverse events were not reported on.
-
High risk of bias: the outcomes in the protocol were not reported on.
For‐profit bias
-
Low risk of bias: the trial appeared to be free of industry sponsorship or other type of for‐profit support that may have manipulated the trial design, conductance, or results of the trial.
-
Unclear risk of bias: the trial may or may not have been free of for‐profit bias as no information on clinical trial support or sponsorship was provided.
-
High risk of bias: the trial was sponsored by industry or received other type of for‐profit support.
Other bias
-
Low risk of bias: the trial appeared to be free of other bias domains (e.g. academic bias) that could put it at risk of bias.
-
Unclear risk of bias: the trial may or may not have been free of other domains that could put it at risk of bias.
-
High risk of bias: there were other factors in the trial that could have put it at risk of bias (e.g. authors had conducted trials on the same topic).
Overall risk of bias
We judged trials to be at a low risk of bias if they were assessed as at a low risk of bias in all the above domains. We judged trials to be at a high risk of bias if they were assessed as having an unclear risk of bias or a high risk of bias in one or more of the above domains. We assessed the domains 'blinding of outcome assessment' and 'incomplete outcome data' for each outcome. Thus, we were able to assess the bias risk for each result in addition to each trial. The results of our primary outcomes with a low risk of bias should have been our primary analyses.
Two review authors (AC and NB) independently assessed the risk of bias of each included trial against these criteria. Review authors were not blinded with respect to trial authors, institution, or journal. The authors resolved disagreements by consensus, with a third review author (CG) to be consulted if disagreements persisted.
Where the method of allocation concealment was not reported, or where additional information was required to appropriately assess study quality, we contacted the authors of these trials for clarification. We contacted the authors of three studies and received two replies; however, the responses did not uniformly clarify our questions.
Measures of treatment effect
Measures of treatment effect
We performed the analyses in Review Manager 5 (RevMan 2014). Where possible, we analysed data by intention‐to‐treat including all participants irrespective of compliance or follow‐up.
Dichotomous outcomes
We expressed binary outcomes as odds ratios (OR) with 95% confidence intervals (CI). We estimated rare events (mortality and liver transplantation) by Peto ORs (Bradburn 2007). We used both a random‐effects model (DerSimonian 1986) and a fixed‐effect model meta‐analysis to assess data analysed by OR (DeMets 1987). We explored heterogeneity using the Chi2 test with significance set at P value of 0.10 or less and we measured heterogeneity using the I2 statistic (Higgins 2002). Where conclusions were different, we favoured a random‐effects model if there was a high degree of heterogeneity.
Continuous outcomes
The main outcomes assessed in this systematic review were analysed as dichotomous outcomes as this is how ALT/AST and INR are consistently reported. Paracetamol pharmacokinetic data such as paracetamol concentration where possible was analysed as a continuous outcome. Data on participants were collected until discharge, death, or liver transplantation. We calculated the mean differences (MD; if trials used the same methods of measurement) and the standardised mean difference (SMD; if trials used different methods of measurement) with 95% CI for continuous outcomes.
Mortality data
We analysed mortality data using hospital death (mortality) or liver transplantation as outcomes. We used estimates of log hazard ratios and standard errors. If the trialists did not report these data, we calculated the log hazard ratios and standard errors if possible (Higgins 2011a). We used the generic inverse‐variance method to meta‐analyse survival data (see Section 9.4.3.2 of the Cochrane Handbook for Systematic Reviews of Interventions (Higgins 2011b).
Dealing with missing data
Dichotomous outcomes
If the trialists used the correct methodology (e.g. multiple imputation) to deal with missing data, we used these data in our primary analysis.
Continuous outcomes
The only continuous outcomes intended to be analysed were the secondary outcomes of pharmacokinetic data such as paracetamol concentrations or area under the paracetamol curve. If trialists used correct methodology (e.g. multiple imputation) to deal with missing data, we intended to use these data in our primary analysis. If standard deviations (SD) were not reported, we intended to calculate the SDs using data from the trial if possible. Missing pharmacokinetic data were calculated by using non‐linear mixed effects modelling, provided all individual participant data were available.
Assessment of heterogeneity
We assessed the presence of statistical heterogeneity using the Chi2 test with significance set at P < 0.10 and measure the level of heterogeneity using the I2 statistic (Higgins 2002; Higgins 2011b).
Assessment of reporting biases
We planned to use a funnel plot to assess reporting bias had we included 10 or more trials per comparison. Using the asymmetry of the funnel plot, we planned to assess the risk of bias. For dichotomous outcomes, we planned to test asymmetry using the Harbord test (Harbord 2006). For continuous outcomes, we planned to use the regression asymmetry test (Egger 1997) and the adjusted rank correlation (Begg 1994).
Data synthesis
We planned to base our primary conclusions on the results of the primary outcomes with a low risk of bias at the end of intervention. We considered the results of primary outcomes with high risk of bias, and secondary outcomes, outcomes at maximum follow‐up, sensitivity analyses, and subgroup analyses as hypothesis‐generating tests (Jakobsen 2014).
Meta‐analysis
We conducted the meta‐analyses according to the recommendations in the Cochrane Handbook for Systematic Reviews of Interventions (Higgins 2011a). We used the statistical software Review Manager 5 (RevMan 2014) provided by Cochrane to analyse data (RevMan 2014).
Assessment of significance
We planned to assess our intervention effects using both random‐effects model meta‐analyses (DerSimonian 1986) and fixed‐effect model meta‐analyses (DeMets 1987). We used the more conservative point estimate of the two (Jakobsen 2014). The more conservative point estimate was the estimate closest to zero effect. If the two estimates were equal, we used the estimate with the widest CI. We used three primary outcomes and, therefore, we considered a P value of 0.025 or less as statistically significant (Jakobsen 2014). We used the eight‐step procedure to assess if the thresholds for significance are crossed (Jakobsen 2014).
Trial Sequential Analysis
Traditional meta‐analysis runs the risk of random errors due to sparse data and repetitive testing of accumulating data when updating reviews. Therefore, we performed Trial Sequential Analysis (Thorlund 2011; TSA 2011; Wetterslev 2017) on the outcomes to calculate the required information size and assess the potential breach of the cumulative Z‐curve of the relevant trial sequential monitoring boundaries for benefit, harm, or futility to control for risks of type I errors and type II errors (Brok 2008; Wetterslev 2008; Brok 2009; Thorlund 2009; Wetterslev 2009; Thorlund 2010). A more detailed description of Trial Sequential Analysis can be found at www.ctu.dk/tsa/ (Thorlund 2011).
For dichotomous outcomes, we planned to estimate the required information size based on the proportion of participants with an outcome in the control group, a relative risk reduction of 20%, an alpha of 2.5% (Jakobsen 2014), a beta of 20%, and an assumed diversity of 20% as we had only one or two trials included in each Trial Sequential Analysis without any observable heterogeneity. For continuous outcomes, we planned to estimate the required information size based on the SD observed in the control group of trials with low risk of bias and a minimal relevant difference of 50% of this SD, an alpha of 2.5%, a beta of 20%, and the diversity suggested by the trials in the meta‐analysis.
Subgroup analysis and investigation of heterogeneity
We intended to conduct the following subgroup analyses.
-
Outcomes at a low risk of bias compared to outcomes at a high risk of bias.
-
Age of participants categorised into 10‐year groups.
-
Risk of hepatotoxicity at baseline (according to paracetamol concentration data).
However, due to insufficient data, these analyses could not be conducted.
Sensitivity analysis
To assess the potential impact of missing data for dichotomous outcomes, we intended to perform the following two sensitivity analyses.
-
'Best‐worst case' scenario: we assumed that all participants lost to follow‐up in the intervention group survived, had no serious adverse event, and had no morbidity; and all those participants with missing outcomes in the control group did not survive, had a serious adverse event, and had morbidity.
-
'Worst‐best case' scenario: we assumed that all participants lost to follow‐up in the intervention group survived, had a serious adverse event, and had morbidity; and that all those participants lost to follow‐up in the control group had survived, had no serious adverse event, and had no morbidity.
To assess the potential impact of missing SDs for continuous outcomes, we intended to perform the following sensitivity analysis.
-
Where SDs were missing and it was not possible to calculate them, we planned to impute SDs from trials with similar populations and low risk of bias. If we found no such trials, we intended to impute SDs from trials with a similar population. As the final option, we planned to impute SDs from all trials.
'Summary of findings' tables
We used GRADE to assess the quality of the evidence (Guyatt 2008) associated with each of the major outcomes in our review constructing 'Summary of findings' tables using GRADE software (ims.cochrane.org/revman/other‐resources/gradepro). The GRADE approach appraises the quality of a body of evidence based on the extent to which one can be confident that an estimate of effect or association reflects the item being assessed. The quality measure of a body of evidence considers the within‐study risk of bias, indirectness of the evidence, heterogeneity of data, imprecision of effect estimates, and risk of publication bias.
Results
Description of studies
Results of the search
See flow chart (Figure 1). An updated search was performed in October 2013 that identified 220 references. We excluded 63 as they were animal studies or studies that did not involve paracetamol ingestion. A further 61 were non‐randomised clinical studies, 31 were healthy volunteer studies and 25 were duplicate references. We reviewed 40 full‐text articles. Of these, we included 10 clinical trials and one quasi‐randomised clinical trial. One abandoned randomised clinical trial was identified in the clinical trials database. The search was updated in June 2015 and identified 44 new references of which two were randomised clinical trials, one was previously identified and one was reviewed and excluded as it was a randomised clinical trial of albumin dialysis with the Molecular Adsorbent Recirculating System (MARS) used for the treatment of fulminant liver failure. The search was updated again in January 2017, identifying 49 new references, four of which were randomised clinical trials that had been identified previously. See: Characteristics of included studies; Characteristics of excluded studies tables. Below, we describe the trials according to the assessed interventions.

Flow chart: search strategy and results.
Included studies
Prevention of absorption
One trial allocated participants to activated charcoal, ipecacuanha, gastric lavage, or no intervention (Underhill 1990). The primary outcome was the mean percentage fall in paracetamol concentration (from the first to the last sample (150 minutes).
Antidotes
Three trials randomised participants to different antidotes (methionine, cysteine, cysteamine, or dimercaprol) (Douglas 1976a; Hughes 1977; Hamlyn 1981). One trial randomised participants with paracetamol‐induced fulminant hepatic failure to acetylcysteine versus placebo (Keays 1991).
Some randomised clinical trials looked at differing acetylcysteine regimens to decrease the rate of adverse effects from acetylcysteine treatment (Kerr 2005; Bateman 2014). One trial randomised participants to receive either intravenous or oral acetylcysteine (Arefi 2013). Another trial randomised participants to intravenous or intravenous plus oral acetylcysteine. This trial excluded post hoc 40% of participants who vomited twice after oral acetylcysteine was given, and it was unclear what the treatment and outcomes were for these randomised participants (Eizadi‐Mood 2013). Two trials randomised participants to different infusion rates of intravenous acetylcysteine compared with the traditional 20.25‐hour intravenous regimen (Kerr 2005; Bateman 2014).
One multicentre randomised, blind clinical trial, started in 2010, was registered in the US by Cumberland Pharmaceuticals, and compared an intravenous acetylcysteine regimen with a two‐bag regimen (200 mg/kg over four hours followed by 100 mg/kg over 16 hours) versus the traditional acetylcysteine regimen (NCT01118663). This trial was terminated early after enrolling only 17 participants, although the number to be recruited was not reported (NCT01118663).
There was one quasi‐randomised trial that studied cimetidine plus acetylcysteine (Burkhart 1995).
Extracorporeal treatments
One trial randomised participants with acute paracetamol overdose to charcoal haemoperfusion versus no intervention (Gazzard 1974a).
Other interventions
One trial looked at ondansetron to decrease the risk of vomiting as an adjunct to acetylcysteine treatment (Bateman 2014). This was a part of the trial that assessed a modified 12‐hour acetylcysteine regimen.
Excluded studies
We excluded 33 for reasons given in the Characteristics of excluded studies table.
Studies awaiting classification
We found no studies awaiting classification.
Ongoing studies
We found no ongoing studies.
Risk of bias in included studies
Allocation (selection bias)
Generation of the allocation sequence was often not specified, and only five trials described details of randomisation (Douglas 1976a; Hamlyn 1981; Kerr 2005; Eizadi‐Mood 2013; Bateman 2014). Allocation concealment was similarly not described in detail, with most trials at unclear risk of bias, except for two randomised trials (Keays 1991; Bateman 2014).
Blinding (performance bias and detection bias)
All randomised trials were conducted unblinded except one, which used placebo but failed to mask the aroma (Keays 1991). Accordingly, we judged most trials to be at high risk of bias due to lack of blinding. In one trial, the control group was given supportive treatment in a different hospital, which may have seriously affected the value of this comparison group and questions how the randomisation was carried out (Underhill 1990). One trial of intravenous versus a combination of oral plus intravenous acetylcysteine had nausea and vomiting from acetylcysteine treatment as a primary outcome. However, participants were excluded and not analysed if they vomited twice after oral acetylcysteine, which resulted in exclusion of 40% of the participants from the analysis and biased the results (Eizadi‐Mood 2013).
Incomplete outcome data (attrition bias)
The trials varied in their reporting of missing or incomplete data; four trials were judged to be at low risk of bias (Gazzard 1974a; Douglas 1976a; Hughes 1977; Bateman 2014). Four trials did not mention if they had missing outcome data or how missing data were handled, so we judged them to be at unclear risk of attrition bias (Hamlyn 1981; Underhill 1990; Keays 1991; Arefi 2013). We judged two trials to be at high risk of attrition bias because both of them excluded a large number of participants from the analysis (Kerr 2005; Eizadi‐Mood 2013).
Selective reporting (reporting bias)
We judged six trials to be at low risk of reporting bias (Gazzard 1974a; Douglas 1976a; Hughes 1977; Hamlyn 1981; Keays 1991; Bateman 2014). We judged one trial to be at high risk of reporting bias because the trial authors did not report on their planned outcomes (Eizadi‐Mood 2013). In three trials, the risk of reporting bias was unclear (Underhill 1990; Kerr 2005; Arefi 2013). Arefi 2013 was not a registered trial and the primary outcome was unclear. Underhill 1990 did not report on the relevant clinical outcomes such as need for treatment with antidote, and Kerr 2005 had two investigators to make a judgement on the attribution of an event, and it is unclear whether bias might have been introduced in the process of adjudicating on events.
Other potential sources of bias
We judged all but two trials at unclear risk of bias for potential other sources of bias because these trials did not have a sample size calculation, did not perform intention to treat analysis, or did not report on the number of participants screened for randomisation or number of participants excluded from the trial or analysis. Eizadi‐Mood 2013 was at high risk of bias because of the lack of detail regarding the high number of participants excluded from the trial. Thus, only one trial was judged to be at low risk of bias for this domain (Bateman 2014).
In conclusion, the trials varied considerably for each risk of bias domain. Figure 2 shows the percentages across all included trials of each risk of bias item as judged by the review authors. Figure 3 shows the risk of bias in each study as judged by the review authors.
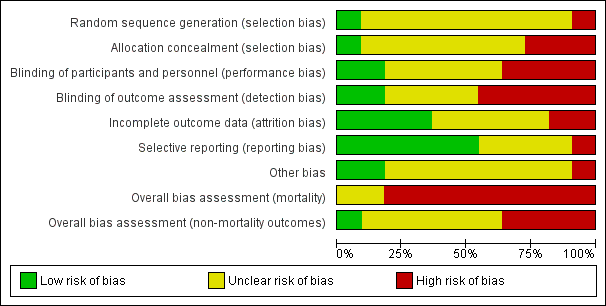
Risk of bias graph: review authors' judgements about each risk of bias item presented as percentages across all included studies.

Risk of bias summary: review authors' judgements about each risk of bias item for each included study.
Effects of interventions
See: Summary of findings for the main comparison Methionine and supportive treatment compared with supportive treatment for paracetamol (acetaminophen) overdose; Summary of findings 2 Cysteamine compared with no intervention for paracetamol (acetaminophen) overdose; Summary of findings 3 Cysteamine compared with dimercaprol for paracetamol (acetaminophen) overdose; Summary of findings 4 Cysteamine compared with methionine (randomised trials) for paracetamol (acetaminophen) overdose; Summary of findings 5 Standard intravenous acetylcysteine regimen (20.5 hour) compared with shorter intravenous acetylcysteine regimen (12 hour) for paracetamol (acetaminophen) overdose; Summary of findings 6 Oral compared with intravenous acetylcysteine for paracetamol (acetaminophen) overdose; Summary of findings 7 Intravenous acetylcysteine compared with placebo in people with fulminant hepatic failure for paracetamol (acetaminophen) overdose; Summary of findings 8 Initial infusion rate of intravenous acetylcysteine over 15 minutes compared with 60 minutes for paracetamol (acetaminophen) overdose; Summary of findings 9 Oral plus intravenous acetylcysteine compared with intravenous acetylcysteine for paracetamol (acetaminophen) overdose; Summary of findings 10 Charcoal haemoperfusion compared with no intervention for paracetamol (acetaminophen) overdose
The 11 included randomised clinical trials differed substantially in inclusion criteria, interventions, and outcome measures. Therefore, it was only possible to perform one meta‐analysis that addressed two of our outcomes. For an overview, we presented single trials in the meta‐analyses and Trial Sequential Analysis. Planned subgroup analyses was not performed due to the small number of trials and inadequate data to perform such analyses.
Activated charcoal, gastric lavage and ipecacuanha
Plasma paracetamol concentration
One small trial (60 participants) found that the mean percentage fall in plasma paracetamol concentration was significantly greater with activated charcoal (52.3%, SD 13.6%) compared with gastric lavage (39.3%, SD 14.7%) or ipecacuanha (40.7%, SD 18.3%) if given within four hours after ingestion (P = 0.03) (Underhill 1990). There was no significant difference between gastric lavage and ipecacuanha (P = 0.081), although both were more effective than no treatment at limiting the absorption of paracetamol. However, the time interval between ingestion and intervention in the different groups was not clearly reported. There were potential areas of bias with the control group. First, the control group was given supportive treatment in a different hospital, which questions how randomisation was carried out. Furthermore, supportive treatment was stopped early due to "ethical reasons," there was an increase in paracetamol levels in four out of five participants in this group between the first and the last sample compared to paracetamol levels falling in the intervention groups. Therefore, the value of this trial was limited.
Antidotes
Methionine versus no intervention
Mortality
Based on one trial, there was no beneficial effect of methionine compared with no intervention on mortality (OR not reported by authors, OR for mortality calculated using Fisher's exact test, OR 0.31, 95% CI 0.01 to 8.31; P = 1.00) (for comparison, see Analysis 1.1: Peto OR 0.14, 95% CI 0.00 to 6.82, that is less valid as we only have one trial) (Hamlyn 1981).
Hepatotoxicity
Compared with no intervention, methionine reduced the number of people with hepatotoxicity (OR not reported by authors, OR for hepatotoxicity calculated using Fisher's exact test; OR 0.05, 95% CI 0.004 to 0.51; P = 0.01; Analysis 1.2: OR 0.05, 95% CI 0.01 to 0.53). Trial Sequential Analysis (not shown) demonstrated that the diversity‐adjusted required information size (DARIS) was 9731 participants of which they only accrued 26 participants corresponding to 0.26% of DARIS. This DARIS was calculated based on a proportion of deaths of 10% in the control group, a relative risk reduction of 20%, an alpha of 2.5%, a beta of 20% (corresponding to a power of 80%), and an assumed diversity of 20%. The Trial Sequential Analysis‐adjusted CI could not be estimated due to the paucity of data. See summary of findings Table for the main comparison.
Cysteamine versus no intervention or methionine or dimercaprol
Mortality
Compared with no intervention, cysteamine had no effect on mortality (Analysis 2.1: Peto OR 0.53, 95% CI 0.05 to 5.22, 2 trials, 65 participants) (Douglas 1976a; Hamlyn 1981).
The Hamlyn 1981 trial compared cysteamine to methionine (27 participants). There were no deaths in either group (Analysis 3.1: Peto OR: not estimable).
One trial (52 participants) found no difference between cysteamine and dimercaprol on mortality (OR not reported, OR for mortality calculated using Fisher's exact test, OR 0.32, 95% CI 0.01 to 8.25; P = 1.00) (Analysis 4.1: Peto OR 0.14, 95% CI 0.00 to 6.82) (Hughes 1977). One participant who received dimercaprol died. See summary of findings Table 3.
Hepatotoxicity
Compared with no intervention, cysteamine seemed to decrease the risk of developing hepatotoxicity (Analysis 2.2: OR 0.09, 95% CI 0.02 to 0.35, 2 trials, 65 participants) (Douglas 1976a; Hamlyn 1981). Douglas and colleagues had a control group with higher paracetamol concentration before treatment (Douglas 1976a), which may have introduced bias into the comparison group. The Hamlyn 1981 trial was essentially a continuation of the Douglas 1976a trial, and results of four of the participants were used in both trials (Douglas 1976a; Hamlyn 1981). As it could not be determined which these participants were, the same participant data were analysed twice for these four people. Trial Sequential Analysis of cysteamine versus control on hepatotoxicity demonstrated that this effect was not statistically significant and the Trial Sequential Analysis‐adjusted CI ranged from 0.00 to 24.0 (Figure 4). See summary of findings Table 2.

Trial Sequential Analysis of cysteamine versus control on hepatotoxicity defined as aspartate aminotransferase (AST) above 1000 IU/L. The diversity‐adjusted required information size (DARIS) was 982 participants based on a proportion of 53% with the outcome in the control group (Pc); a risk reduction of 20%; an alpha (a) of 2.5%; a beta (b) of 20% (equivalent to a power of 80%); and an assumed diversity of 20%. As demonstrated the trial sequential monitoring boundaries for benefit, harm, or futility were crossed by the cumulative Z value.
Hamlyn 1981 found cysteamine and methionine to be equally as effective at reducing hepatotoxicity (OR not reported, OR for hepatotoxicity calculated using Fisher's exact test, OR 0.92, 95% CI 0.05 to 18.86, P = 1.0) (Analysis 3.2: OR 0.92, 95% CI 0.05 to 16.46). See summary of findings Table 4.
One trial (52 participants) comparing cysteamine and dimercaprol found that cysteamine was superior to dimercaprol in terms of the severity of hepatic necrosis found on liver biopsy (Hughes 1977). However, no evidence of a difference in effect was found when comparison was made of peak AST concentrations with a peak AST of 722 IU/L versus 754 IU/L in those receiving cysteamine and dimercaprol (Wilcoxon's rank sum test P=NS) (Analysis 4.2: mean difference: ‐32.00 95%CI ‐126.33 to 62.33) see summary of findings Table 3.
Adverse events
All trials reported that most participants given cysteamine had nausea and vomiting during its administration. Some participants also had severe headaches, one a transient truncal rash, and one developed severe malaise (Hamlyn 1981). Dimercaprol was given as a deep intramuscular injection, which all participants found painful; 9/26 participants developed severe abdominal pain (Hughes 1977).
Acetylcysteine
Mortality
One trial (50 participants) found that intravenous acetylcysteine compared with placebo in people with paracetamol‐induced fulminant hepatic failure reduced mortality with a difference in survival of 28% (Chi2 test utilised to assess difference in survival, P = 0.037; 95% CI for difference in survival 3% to 53%) (OR not reported, OR for mortality calculated using Fisher's exact test, OR 0.27, 95% CI 0.08 to 0.95; P = 0.07) (Analysis 5.1: Peto OR 0.29, 95% CI 0.09 to 0.94) (Keays 1991). As shown in Figure 5, this effect was also not statistically significant in a Trial Sequential Analysis and the Trial Sequential Analysis‐adjusted CI ranged from 0.01 to 15.8.

Trial Sequential Analysis of acetylcysteine versus placebo on mortality. The diversity‐adjusted required information size (DARIS) is 375 participants based on a proportion of 80% with the outcome in the control group (Pc); a risk reduction of 20% (Peto OR: POR); an alpha (a) of 2.5%; a beta (b) of 20% (equivalent to a power of 80%); and an assumed diversity of 20%. As demonstrated the trial sequential monitoring boundaries for benefit, harm, or futility were crossed by the cumulative Z value.
One trial (180 participants) found no difference between an initial intravenous dose of acetylcysteine administered over 15 minutes compared with administration for 60 minutes for mortality (OR for mortality not calculated by authors, Analysis 6.1: not estimable) (Kerr 2005).
Hepatotoxicity
One trial (180 participants) found no difference between an initial intravenous dose of acetylcysteine administered over 15 minutes compared with administration for 60 minutes (Kerr 2005) (OR for hepatotoxicity not calculated by authors, OR for hepatotoxicity using Fisher's exact test, OR 1.31, 95% CI 0.39 to 4.56; P = 0.75) (Analysis 6.2: OR 1.34, 95% CI 0.39 to 4.56).
One trial (222 participants) compared two different acetylcysteine regimens: a modified 12‐hour intravenous acetylcysteine regimen that had an initial lower loading dose given over two hours versus the standard 20.25‐hour schedule (Bateman 2014). Five participants developed hepatotoxicity, two allocated to the 12‐hour regimen versus three allocated to the 20.5‐hour regimen (OR not reported, calculated using Fisher's exact test, OR 0.67, 95% CI 0.12 to 3.33; P > 0.99) (for comparison see Analysis 7.2: OR 0.67, 95% CI 0.11 to 4.08; which is less valid as we only had one trial). See summary of findings Table 5.
One trial (66 participants) assessed oral acetylcysteine versus a standard 20.25‐hour intravenous acetylcysteine regimen and found no statistically significant difference in serum AST, ALT, bilirubin, and prothrombin time at 24, 48, and 72 hours but the numbers were small in both groups and the trial was not powered to show a difference in efficacy (Arefi 2013). See summary of findings Table 6.
Adverse events
There were no adverse events to acetylcysteine reported. See summary of findings Table 7.
Kerr 2005 found the incidence of drug‐related adverse events within two hours was 45% in the 15‐minute loading group versus 35% in the 60‐minute loading group (95% CI difference between the two groups ‐8% to 22% using the Chi2 test; P = 0.36). However, there seemed to be a decrease in the overall number of participants with occurrence of any adverse events (75% in the 15‐minute loading group versus 61% in the 60‐minute loading group; OR not reported, calculated using Fisher's exact test OR 0.51, 95% CI 0.27 to 0.96; P = 0.05) (Analysis 6.3: OR 0.51, 95% CI 0.27 to 0.96). However, in a Trial Sequential Analysis this effect was not significant and the Trial Sequential Analysis‐adjusted CI ranged from 0.36 to 11.0 (Figure 6). See summary of findings Table 8.

Trial Sequential Analysis of 15‐min infusion of acetylcysteine versus 60‐min infusion of acetylcysteine on any adverse event. The diversity‐adjusted required information size (DARIS) is 820 participants based on a proportion of 60% with the outcome in the control group (Pc); a risk reduction of 20%; an alpha (a) of 2.5%; a beta (b) of 20% (equivalent to a power of 80%); and an assumed diversity of 20%. As demonstrated the trial sequential monitoring boundaries for harm, benefit, or futility were crossed by the cumulative Z value.
One trial (222 participants) compared two different acetylcysteine regimens: a modified 12‐hour intravenous acetylcysteine regimen that had an initial lower loading dose given over two hours versus the standard 20.25‐hour schedule (Bateman 2014). The authors found that there was a reduction in the incidence of vomiting, retching, or need for antiemetics at two hours with the modified 12‐hour regimen (39/108 in the 12‐hour regimen group versus 71/109 in the 20.25‐hour regimen group; adjusted OR 0.26, 97.5% CI 0.13 to 0.52; P < 0.0001) (Analysis 7.3: OR 0.30, 95% CI 0.17 to 0.53) (note difference as Analysis 7.2 was unadjusted). Anaphylactoid reactions were categorised as mild, moderate, and severe, with those receiving the shorter regimen having a reduced rate of reactions (58/108 in the 12‐hour regimen group versus 75/100 in the 20.25‐hour regimen group) (OR for anaphylactoid reactions were not calculated by authors, OR using Fisher's exact test, OR 0.39, 95% CI 0.22 to 0.71; P = 0.002) (Analysis 7.5: unadjusted OR 0.39, 95% CI 0.21 to 0.70). The number of severe anaphylactoid reactions was also reduced with the shorter modified regimen versus the standard regimen (5/108 in the 12‐hour regimen group versus 31/100 in the 20.25‐hour regimen group; adjusted common OR 0.23, 97.5% CI 0.12 to 0.43; P < 0.0001). There was no difference in efficacy between the two regimens, but the trial was underpowered for this outcome. No deaths were recorded and accordingly, mortality could not be estimated (Analysis 7.1).
One trial (66 participants) assessed oral acetylcysteine versus a standard 20.25‐hour intravenous acetylcysteine regimen (Arefi 2013). Nausea and hypotension were more prevalent in the oral compared with the intravenous acetylcysteine treatment group (nausea: 19/33 (57.6%) participants in the oral group versus 11/33 (33.3%) participants in the intravenous group; P = 0.04) (Arefi 2013). See summary of findings Table 6.
One trial (40 participants) looked at a combination of intravenous plus oral acetylcysteine versus a standard 20.25‐hour intravenous acetylcysteine regimen (Eizadi‐Mood 2013). The main outcome was the rate of anaphylactoid reactions defined as nausea and vomiting, dyspnoea, and flushing. This trial post hoc excluded participants who vomited twice after oral acetylcysteine and did not include them in the intention‐to treat analysis. The authors found that 13.3% of participants who had intravenous plus oral acetylcysteine vomited versus 28.5% participants in the intravenous acetylcysteine group. However, adding the excluded 10 participants with vomiting increased this rate to 48% and reversed the conclusions of the trial (Eizadi‐Mood 2013). See summary of findings Table 9.
Ethylenediaminetetraacetic acid free acetylcysteine formulation
One trial registered by Cumberland Pharmaceuticals started in 2010 and was terminated due to lack of recruitment in 2013 (NCT01118663). This trial compared the efficacy and safety of a new acetylcysteine protocol and a changed ethylenediaminetetraacetic acid free acetylcysteine formulation. The new protocol studied was 200 mg/kg of intravenous acetylcysteine in 1 L of fluid over four hours followed by 100 mg/kg in 1 L of fluid over 16 hours versus the standard three‐bag regimen, with an initial 60‐minute loading. The intended primary outcome was the incidence of hepatotoxicity. Secondary outcomes included adverse events and percentage of participants requiring continuation of therapy beyond 21 hours. Preliminary results were reported (clinicaltrials.gov); the trial recruited only 17 participants, with reported adverse event rate of 2/7 participants with the new protocol (four‐hour loading) group versus 1/10 participants from the three‐bag, 60‐minute loading group. The type and severity of these adverse events were not reported. Two participants in each group did not complete the course of intravenous acetylcysteine. The numbers from this trial were too small to analyse (NCT01118663).
Extracorporeal treatment
Mortality
One trial studied charcoal haemoperfusion versus conventional treatment (gastric lavage and fresh frozen plasma and intravenous fluids as clinically indicated) (16 participants) (Gazzard 1974a). One participant allocated to the haemoperfusion group who had ingested 135 g of paracetamol died. There were no deaths in the control group. Accordingly, we found no benefit of charcoal haemoperfusion (Gazzard 1974a) (number of deaths reported only, using Fisher's exact test, OR 3.40, 95% CI 0.12 to 96.8; P = 1.00) (Analysis 8.1: Peto OR 7.39, 95% CI 0.15 to 372.4). The Trial Sequential Analysis‐adjusted CI could not be calculated. See summary of findings Table 10.
Plasma paracetamol concentration
One trial studied charcoal haemoperfusion versus conventional treatment (gastric lavage and fresh frozen plasma and intravenous fluids as clinically indicated) (16 participants) (Gazzard 1974a). The mean cumulative amount of paracetamol removed was 1.4 g.
Additional safety data from quasi‐randomised trials
Cimetidine
One quasi‐randomised trial studied cimetidine, with treatment allocation based on month enrolled (Burkhart 1995). As this trial was quasi‐randomised, it could only be used to assess for the risk of harm. This trial found no adverse events.
Discussion
As identified in this review, there are very few randomised clinical trials investigating interventions for paracetamol poisoning, with all the evidence considered to be of low or very low quality. It is important to note that strict bias criteria were utilised and a trial was considered at low risk of bias only if all criteria were met. In many of these studies this was not feasible because, for example, blinding for interventions such as activated charcoal or length of acetylcysteine treatment were not possible. Current practices are often based on observational and non‐randomised studies, with current treatments seeming to have resulted in a decrease in mortality. The management of paracetamol poisoning varies widely between countries; for example, whether treatment is based on dose ingested or nomograms, which nomogram line is used, whether acetylcysteine should be administered orally or intravenously, and length of treatment. Most recommendations advise to measure a plasma paracetamol concentration, and if this level is above a chosen risk‐line, then acetylcysteine is advocated (Dart 2006; Daly 2008). Many factors such as excess alcohol consumption, eating disorder, or use of enzyme‐inducing agents increase the risk of paracetamol hepatotoxicity, and these patient groups may need a lower threshold for treatment. However, most countries use a single nomogram line that has been lowered to essentially treat all people as high risk. Some guidelines suggest that liver biochemistry should be checked after treatment, and this is essential for symptomatic people, when treatment is delayed, with use of modified‐release formulation or large ingestions (Vale 1995; Chiew 2015). If the person has developed, or is at risk of developing, fulminant hepatic failure, acetylcysteine treatment has been suggested to be continued until recovery (Wolf 2007; Chiew 2015; Yoon 2016; Heard 2017). It should be noted that acetylcysteine or paracetamol overdose itself (or both) without evidence of liver injury may increase the INR, and management decisions should be based on the entire liver biochemistry (Whyte 2000; Schmidt 2002).
The methods used for decontamination include gastric lavage, activated charcoal, and ipecacuanha. The results from the one small randomised clinical trial were very low quality evidence that any of these measures can reduce the absorption of paracetamol, if given shortly after ingestion (Underhill 1990). One well‐known complication from all the three interventions is aspiration pneumonia (Liisanantti 2003). However, randomised trials in overdose have reported no increase of adverse events in people receiving activated charcoal (Cooper 2005; Eddleston 2008). Position statements on drug poisonings indicate that serious adverse events seem to be fewer in people receiving activated charcoal compared to ipecacuanha and gastric lavage (Vale 1995; Krenzelok 2004; Chyka 2005). Multiple observational and volunteer studies have investigated the effect of activated charcoal on paracetamol absorption (Buckley 1999a; Yeates 2000). These studies have shown that activated charcoal decreases the initial paracetamol concentration (Buckley 1999a; Duffull 2013; Chiew 2017). Accordingly, weak evidence indicated that activated charcoal is currently the best choice to prevent absorption of paracetamol. It appears most effective when given within two hours of ingestion, but the benefit may extend to four hours especially in larger overdoses (Buckley 1999a; Chiew 2017).
Various antidotes for paracetamol poisoning have been studied, all in small randomised trials (Douglas 1976a; Hughes 1977; Hamlyn 1981; Keays 1991). Acetylcysteine seems preferable to placebo/supportive treatment, dimercaprol, and cysteamine, in terms of adverse effects. However, a randomised clinical trial has not directly compared these treatments in terms of rates of acute liver injury or mortality. Acetylcysteine and methionine have similarly not been compared in a randomised clinical trial; however, the previous Cochrane Review concluded that both drugs demonstrated comparable effectiveness at decreasing the risk of hepatotoxicity (Brok 2006). The initial acetylcysteine study was an observational study that compared intravenous acetylcysteine (100 participants) to three groups, intravenous cysteamine (40 participants), intravenous methionine (20 participants), or supportive treatment alone (57 participants) (Prescott 1979). In this study, the comparison antidote groups were historical control groups treated three years earlier and supportive care groups 10 years earlier. They found intravenous acetylcysteine was highly effective in protecting against severe liver damage, renal failure, and death after paracetamol overdosage when given within eight to 10 hours of ingestion. Since this study was published, acetylcysteine has been recommended for paracetamol poisoning in most countries (Wolf 2007; Chiew 2015; Yoon 2016; Heard 2017). Historical data showed that the overall mortality rate has dropped from 3% (all poisonings (Clark 1973) or 5% (all above the probable risk‐line (Prescott 1979) to 0.4% in the 1980s after the introduction of acetylcysteine (Gunnell 1997)). Similarly, the rates of acute liver injury due to paracetamol toxicity have declined since the routine use of acetylcysteine. The major risk factor for developing acute liver injury following paracetamol ingestion was delayed time to treatment with acetylcysteine (Prescott 1979; Smilkstein 1988). Observational studies and meta‐analyses continue to show similar results with rates of hepatotoxicity reported in people receiving acetylcysteine treatment within eight hours ranging from 0% to 6% compared to people treated more than eight to 10 hours postingestion of 8% to 50% (Buckley 1999b; Kerr 2005; Brok 2006; Doyon 2009; Green 2013; Heard 2014). From the one small randomised clinical trial, survival among people with paracetamol‐induced fulminant hepatic failure was higher if treated with acetylcysteine (Keays 1991).
Acetylcysteine can be administered orally or intravenously. Two small studies in this review compared oral to intravenous acetylcysteine; however, both were at high risk of bias (Arefi 2013; Eizadi‐Mood 2013). One meta‐analysis of over 5000 participants admitted with a paracetamol overdose compared oral to intravenous acetylcysteine and showed similar rates of hepatotoxicity in (12.6% with oral versus 13.2% with intravenous). Treatment delays (beyond 10 hours) were associated with the highest risk of liver injury (Green 2013). Both oral and intravenous acetylcysteine were associated with adverse effects. These reactions range from mild to severe symptoms and include rash, nausea, vomiting, angioedema, tachycardia, bronchospasm, hypotension, and death (Mant 1984; Bailey 1998; Schmidt 2001; Kao 2003). The most common reactions from intravenous acetylcysteine are nausea, vomiting, and cutaneous systemic hypersensitivity reactions (Sandilands 2009). Oral acetylcysteine administration often results in rash, nausea, vomiting, and abdominal pain. The rates of adverse reactions vary greatly between observational studies. Reported rates depend on whether it was a prospective or retrospective study and which adverse effects were measured (e.g. total versus gastrointestinal versus systemic hypersensitivity reactions). There are many observational studies of acetylcysteine, a review that examined some of these larger studies reported that rates of adverse effects from acetylcysteine varied from 8.5% to 77% (Chiew 2016).
Trials of acetylcysteine have looked at different regimens to decrease the rate of adverse effects. There are four trials looking at different acetylcysteine regimens compared with the standard three‐bag intravenous acetylcysteine regimen (Kerr 2005; Arefi 2013; Eizadi‐Mood 2013; Bateman 2014). The primary outcomes of these trials were adverse effects of treatments and none were powered to look at efficacy. Various observational studies have looked at differing acetylcysteine regimens to decrease the rate of adverse reactions or decrease drug administration errors but again these were not powered to look at efficacy (Chiew 2016). Furthermore, there has been increasing concerns that the standard intravenous acetylcysteine doses are inadequate in people with very high initial paracetamol concentrations, who require higher doses of acetylcysteine (Rumack 2012; Chiew 2016). People with increased paracetamol concentration on presentation are at higher risk of liver injury even when intravenous acetylcysteine is administered early (Cairney 2016). Further studies are warranted to compare efficacy between different treatment regimens looking at both the dose and rate of acetylcysteine infusions.
Only one very small study looked at extracorporeal treatment, which showed no benefit from charcoal haemoperfusion (Gazzard 1974a). The Extracorporeal Treatments in Poisoning (EXTRIP) Workgroup, published recommendations in 2014, regarding paracetamol and extracorporeal treatment. EXTRIP searched for randomised clinical trials, observational studies, case reports, case series, and pharmacokinetic studies. From these, the EXTRIP panel concluded that paracetamol was dialysable and suggested extracorporeal treatments could be considered in cases of severe paracetamol poisoning, defined by paracetamol level, acidosis, or coma and also depending on antidote availability. They concluded that intermittent haemodialysis is the preferred extracorporeal treatment in people with paracetamol poisoning. Intermittent haemoperfusion or continuous renal replacement modalities are valid alternatives if intermittent haemodialysis is not available. Furthermore, acetylcysteine treatment should be continued during extracorporeal treatment at an increased rate (Gosselin 2014).
Since the late‐1980s, survival from acute liver failure from any cause has markedly improved, with a significant improvement in paracetamol‐induced acute liver failure. This is because of improved intensive care, earlier illness recognition, and use of emergency liver transplantation when required (Bernal 2013). Over this same period, transplant‐free survival in people with acute liver failure secondary to paracetamol has improved to nearly 70% (Reuben 2016). However, in people who develop irreversible liver damage, the ultimate treatment is liver transplantation.
There are various limitations in this review. First, for most interventions, there were only one or two small trials and most trials were at high risk of bias and at high risk of play of chance. Hence no greater certainty about treatment effects could be determined through meta‐analysis. Second, the interventions studied varied greatly and even those studying similar interventions varied in rates and mode of administration of the drugs meaning comparisons between various intervention options could not be made. Heterogeneity was high due to the varying interventions and participants. Much of the protocol outlined in the methods could not be applied to the studies included.
The results of this systematic review highlighted a lack of randomised clinical trials on interventions for paracetamol overdose, despite it being a very common drug for poisoning worldwide. Most of the included randomised clinical trials were small and some trials assessed interventions not used in the 21st century. Furthermore, no randomised clinical trials investigated the efficacy of acetylcysteine versus commonly available oral antidotes such as methionine. It is unlikely that a trial will be conducted comparing acetylcysteine with placebo, except perhaps in very low risk people. Research has focused on testing different acetylcysteine regimens with the aim to lower adverse effects or to shorten the duration of treatment, while maintaining or improving outcomes.
Summary of main results
The interventions to treat paracetamol poisoning can be divided into two main groups, those treatments that decrease serum paracetamol concentration, either by decontamination or by extracorporeal treatments and antidotes that decrease the amount or detoxify the toxic metabolite NAPQI.
Activated charcoal, gastric lavage and ipecacuanha
One randomised clinical trial found activated charcoal to be more effective than gastric lavage, ipecacuanha, or no intervention in preventing the absorption of paracetamol (Underhill 1990). There were various limitations to this trial.
Antidotes
Cysteamine, methionine, and dimercaprol
Two randomised trials found methionine or cysteamine treatment resulted in lower AST concentrations and less hepatic necrosis on liver biopsy when compared with no intervention (Douglas 1976a; Hamlyn 1981). There was no difference between the two antidotes in one trial (Hamlyn 1981), in terms of peak serum AST and rates of hepatic necrosis. In a further trial, cysteamine was superior to dimercaprol in terms of the severity of hepatic necrosis found on liver biopsy (Hughes 1977). Overall, cysteamine therapy was associated with a high rate of nausea and vomiting. There were few adverse events in participants given methionine and dimercaprol.
Acetylcysteine
One randomised clinical trial found that intravenous acetylcysteine increased survival in participants with paracetamol‐induced fulminant hepatic failure compared with placebo (Keays 1991). However, no randomised trials have assessed the effect of acetylcysteine in the acute treatment of paracetamol overdose. Four completed randomised clinical trials have studied differing regimens of acetylcysteine administration to decrease rates of adverse events but none of these were powered for efficacy (Kerr 2005; Arefi 2013; Eizadi‐Mood 2013; Bateman 2014). One trial was abandoned because of lack of enrolment (NCT01118663).
Extracorporeal treatments
The randomised clinical trial found involved haemoperfusion, we found no evidence to support or refute haemoperfusion for paracetamol overdose.
Acute hepatic failure
Most interventions used to treat acute fulminant liver failure were not investigated in this review, but, based on one small trial, it appeared that acetylcysteine administration improved survival in participants with fulminant hepatic failure from paracetamol (Keays 1991).
Children
There was less evidence on how to manage children who unintentionally ingest paracetamol. Children are rarely able to tell how much and when they have ingested the drug. Furthermore, the applicability of the recommended treatment line in young children has never been proven due to the paucity of data (Vale 1995).
Overall completeness and applicability of evidence
This review looked at many different treatment options for paracetamol overdose, each based on only one or very few randomised clinical trials and the quality of the evidence was found to be low or very low and incomplete. Most of the current recommendations for the treatment of paracetamol overdose are based on observational studies.
Quality of the evidence
In the 11 trials studied, the majority had multiple domains at high risks of bias (systematic errors, i.e. overestimation of benefits and underestimation of harms) as well as very small number of participants giving high risks of play of chance (random errors) and multiple items of high risks of bias. Thus, the quality of the evidence was assessed to be low or very low.
Potential biases in the review process
NB is an author on one of the trials included in this review (Kerr 2005). This risk of bias was minimised as other review authors determined if it could be included and assess risk of bias and extracted data.
Agreements and disagreements with other studies or reviews
We are not aware of any other systematic review of paracetamol overdose that covered all treatment options, besides the earlier versions of this review and the BMJ Clinical Evidence abbreviated reviews (Park 2015). The conclusions from the later review were broadly in line with those of this review. The findings of this review were not in conflict with existing guidelines including acetylcysteine in people at risk of hepatotoxicity or established acute liver injury (Lee 2011; Chiew 2015; Heard 2017).
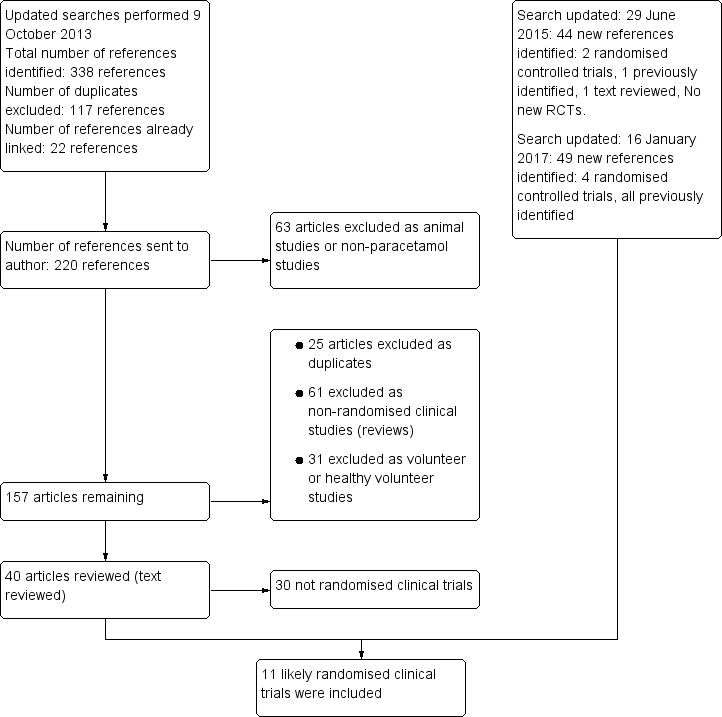
Flow chart: search strategy and results.

Risk of bias graph: review authors' judgements about each risk of bias item presented as percentages across all included studies.

Risk of bias summary: review authors' judgements about each risk of bias item for each included study.

Trial Sequential Analysis of cysteamine versus control on hepatotoxicity defined as aspartate aminotransferase (AST) above 1000 IU/L. The diversity‐adjusted required information size (DARIS) was 982 participants based on a proportion of 53% with the outcome in the control group (Pc); a risk reduction of 20%; an alpha (a) of 2.5%; a beta (b) of 20% (equivalent to a power of 80%); and an assumed diversity of 20%. As demonstrated the trial sequential monitoring boundaries for benefit, harm, or futility were crossed by the cumulative Z value.

Trial Sequential Analysis of acetylcysteine versus placebo on mortality. The diversity‐adjusted required information size (DARIS) is 375 participants based on a proportion of 80% with the outcome in the control group (Pc); a risk reduction of 20% (Peto OR: POR); an alpha (a) of 2.5%; a beta (b) of 20% (equivalent to a power of 80%); and an assumed diversity of 20%. As demonstrated the trial sequential monitoring boundaries for benefit, harm, or futility were crossed by the cumulative Z value.

Trial Sequential Analysis of 15‐min infusion of acetylcysteine versus 60‐min infusion of acetylcysteine on any adverse event. The diversity‐adjusted required information size (DARIS) is 820 participants based on a proportion of 60% with the outcome in the control group (Pc); a risk reduction of 20%; an alpha (a) of 2.5%; a beta (b) of 20% (equivalent to a power of 80%); and an assumed diversity of 20%. As demonstrated the trial sequential monitoring boundaries for harm, benefit, or futility were crossed by the cumulative Z value.

Comparison 1 Methionine versus no intervention, Outcome 1 Mortality.

Comparison 1 Methionine versus no intervention, Outcome 2 Hepatotoxicity (aspartate aminotransferase > 1000 IU/L).

Comparison 2 Cysteamine versus no intervention, Outcome 1 Mortality.
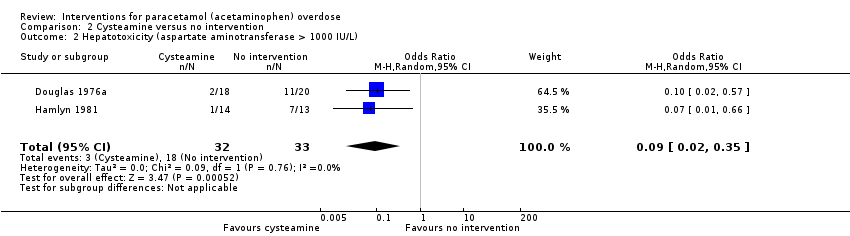
Comparison 2 Cysteamine versus no intervention, Outcome 2 Hepatotoxicity (aspartate aminotransferase > 1000 IU/L).

Comparison 3 Cysteamine versus methionine, Outcome 1 Mortality.
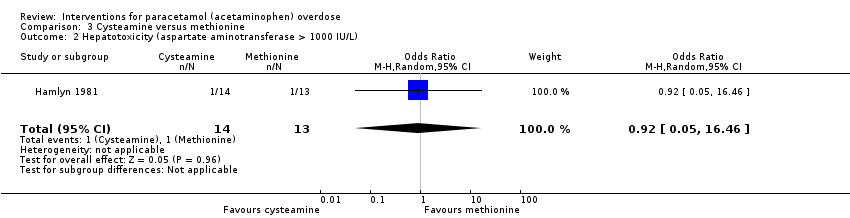
Comparison 3 Cysteamine versus methionine, Outcome 2 Hepatotoxicity (aspartate aminotransferase > 1000 IU/L).

Comparison 4 Cysteamine versus dimercaprol, Outcome 1 Mortality.

Comparison 4 Cysteamine versus dimercaprol, Outcome 2 Maximum alanine aminotransferase (IU/L).

Comparison 5 Intravenous acetylcysteine versus 'placebo' in people with fulminant hepatic failure, Outcome 1 Mortality.

Comparison 6 Initial dose over 60 minutes versus 15 minutes of intravenous acetylcysteine, Outcome 1 Mortality.
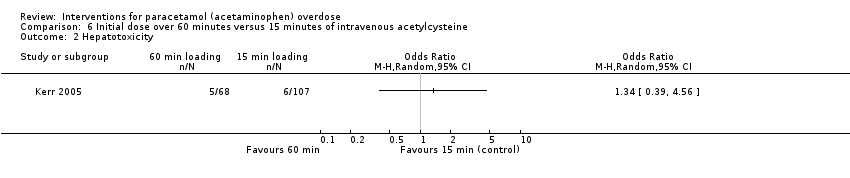
Comparison 6 Initial dose over 60 minutes versus 15 minutes of intravenous acetylcysteine, Outcome 2 Hepatotoxicity.

Comparison 6 Initial dose over 60 minutes versus 15 minutes of intravenous acetylcysteine, Outcome 3 Any adverse event.

Comparison 7 12‐hour intravenous acetylcysteine regimen versus 20.5‐hour regimen, Outcome 1 Mortality.

Comparison 7 12‐hour intravenous acetylcysteine regimen versus 20.5‐hour regimen, Outcome 2 Hepatotoxicity.
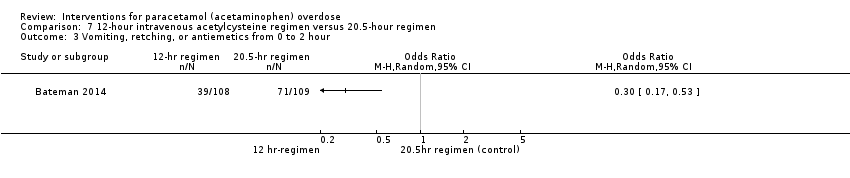
Comparison 7 12‐hour intravenous acetylcysteine regimen versus 20.5‐hour regimen, Outcome 3 Vomiting, retching, or antiemetics from 0 to 2 hour.

Comparison 7 12‐hour intravenous acetylcysteine regimen versus 20.5‐hour regimen, Outcome 4 Vomiting, retching, or antiemetics 0 to 12 hour.

Comparison 7 12‐hour intravenous acetylcysteine regimen versus 20.5‐hour regimen, Outcome 5 Anaphylactoid symptoms (all).

Comparison 8 Charcoal haemoperfusion versus no intervention, Outcome 1 Mortality.
| Methionine and supportive treatment compared with supportive treatment (randomised trials) for paracetamol (acetaminophen) overdose | ||||||
| Patient or population: people with paracetamol (acetaminophen) overdose | ||||||
| Outcomes | Illustrative comparative risks* (95% CI) | Relative effect | No of participants | Quality of the evidence | Comments | |
| Assumed risk | Corresponding risk | |||||
| Supportive treatment | Methionine and supportive treatment | |||||
| Mortality | Study population | Peto OR 0.14 | 26 | ⊕⊝⊝⊝ | The Trial Sequential Analysis‐adjusted CI could not be estimated due to the paucity of data. | |
| 77 per 1000 | 12 per 1000 | |||||
| Hepatotoxicity | Study population | OR 0.05 | 26 | ⊕⊕⊝⊝ | ‐ | |
| 615 per 1000 | 74 per 1000 | |||||
| *The basis for the assumed risk (e.g. the median control group risk across studies) is provided in footnotes. The corresponding risk (and its 95% confidence interval) is based on the assumed risk in the comparison group and the relative effect of the intervention (and its 95% CI). | ||||||
| GRADE Working Group grades of evidence | ||||||
| 1Downgraded one level for risk of bias (concerns regarding randomisation sequence generation and allocation concealment probably compromised). | ||||||
| Cysteamine compared with no intervention (randomised trials) for paracetamol (acetaminophen) overdose | ||||||
| Patient or population: people with paracetamol (acetaminophen) overdose | ||||||
| Outcomes | Illustrative comparative risks* (95% CI) | Relative effect | No of participants | Quality of the evidence | Comments | |
| Assumed risk | Corresponding risk | |||||
| No intervention | Cysteamine | |||||
| Mortality | Study population | Peto OR 0.53 | 65 | ⊕⊝⊝⊝ | ‐ | |
| 61 per 1000 | 33 per 1000 | |||||
| Hepatotoxicity (aspartate aminotransferase > 1000 IU/L) | Study population | OR 0.09 | 65 | ⊕⊕⊝⊝ | Trial Sequential Analysis‐adjusted CI ranged from 0.00 to 24.0. | |
| 545 per 1000 | 97 per 1000 | |||||
| *The basis for the assumed risk (e.g. the median control group risk across studies) is provided in footnotes. The corresponding risk (and its 95% confidence interval) is based on the assumed risk in the comparison group and the relative effect of the intervention (and its 95% CI). | ||||||
| GRADE Working Group grades of evidence | ||||||
| 1Downgraded one level because of risk of bias (method of randomisation had potential for bias and allocation concealment not specified). | ||||||
| Cysteamine compared with dimercaprol (randomised trials) for paracetamol (acetaminophen) overdose | ||||||
| Patient or population: people with paracetamol (acetaminophen) overdose | ||||||
| Outcomes | Illustrative comparative risks* (95% CI) | Relative effect | No of participants | Quality of the evidence | Comments | |
| Assumed risk | Corresponding risk | |||||
| Dimercaprol | Cysteamine | |||||
| Mortality | Study population | Peto OR 0.14 | 52 | ⊕⊝⊝⊝ | ‐ | |
| 38 per 1000 | 6 per 1000 | |||||
| Mean maximum alanine aminotransferase (IU/L) | The mean maximum alanine aminotransferase (IU/L) in the dimercaprol was 754 | The mean maximum alanine aminotransferase (IU/L) in the cysteamine group was 722 (IU/L) | ‐ | 52 | ⊕⊕⊝⊝ | Difference ‐32.00 (95% CI ‐512.9 to 448.9). The difference between the 2 groups was not significant. |
| *The basis for the assumed risk (e.g. the median control group risk across studies) is provided in footnotes. The corresponding risk (and its 95% confidence interval) is based on the assumed risk in the comparison group and the relative effect of the intervention (and its 95% CI). | ||||||
| GRADE Working Group grades of evidence | ||||||
| 1Downgraded two levels because of serious imprecision (due to small sample studied, low number of deaths, and confidence intervals wide). | ||||||
| Cysteamine compared with methionine (randomised trials) for paracetamol (acetaminophen) overdose | ||||||
| Patient or population: people with paracetamol (acetaminophen) overdose | ||||||
| Outcomes | Illustrative comparative risks* (95% CI) | Relative effect | No of participants | Quality of the evidence | Comments | |
| Assumed risk | Corresponding risk | |||||
| Methionine | Cysteamine | |||||
| Mortality | Study population | Not estimable | 27 | ⊕⊝⊝⊝ | ‐ | |
| 0 per 1000 | 0 per 1000 | |||||
| Hepatotoxicity (aspartate aminotransferase > 1000 U/L) | Study population | OR 0.92 | 27 | ⊕⊝⊝⊝ | ‐ | |
| 77 per 1000 | 71 per 1000 | |||||
| *The basis for the assumed risk (e.g. the median control group risk across studies) is provided in footnotes. The corresponding risk (and its 95% confidence interval) is based on the assumed risk in the comparison group and the relative effect of the intervention (and its 95% CI). | ||||||
| GRADE Working Group grades of evidence | ||||||
| 1Downgraded one level because of risk of bias (concerns regarding randomisation and allocation concealment not specified). | ||||||
| Standard intravenous acetylcysteine regimen (20.5 hours) compared with shorter (12 hours) protocol for paracetamol (acetaminophen) overdose | ||||||
| Patient or population: people with paracetamol (acetaminophen) overdose | ||||||
| Outcomes | Illustrative comparative risks* (95% CI) | Relative effect | No of participants | Quality of the evidence | Comments | |
| Assumed risk | Corresponding risk | |||||
| Standard intravenous acetylcysteine regimen (20.25 hours) | Shorter (12‐hour protocol) | |||||
| Mortality | Study population | Not estimable | 222 | ⊕⊝⊝⊝ | ‐ | |
| 0 per 1000 | 0 per 1000 | |||||
| Hepatotoxicity | Study population | OR 0.67 (0.11 to 4.08) | 202 (1 RCT) | ⊕⊝⊝⊝ | ‐ | |
| 30 per 1000 | 20 per 1000 (3 to 111) | |||||
| Vomiting, retching, or antiemetics from 0‐2 hours | Study population | OR 0.30 (0.17 to 0.53) | 217 | ⊕⊕⊝⊝ | ‐ | |
| 651 per 1000 | 359 per 1000 | |||||
| Vomiting, retching, or antiemetics 0‐12 hours | Study population | OR 0.40 (0.22 to 0.75) | 203 | ⊕⊕⊝⊝ | ‐ | |
| 784 per 1000 | 593 per 1000 | |||||
| Anaphylactoid symptoms | Study population | OR 0.39 (0.21 to 0.70) | 208 | ⊕⊕⊝⊝ | ‐ | |
| 750 per 1000 | 539 per 1000 | |||||
| *The basis for the assumed risk (e.g. the median control group risk across studies) is provided in footnotes. The corresponding risk (and its 95% confidence interval) is based on the assumed risk in the comparison group and the relative effect of the intervention (and its 95% CI). | ||||||
| GRADE Working Group grades of evidence | ||||||
| 1Downgraded one level because of indirectness (a large number of prospective participants excluded prior to randomisation: 1539 judged suitable for treatment, only 222 randomised). | ||||||
| Oral compared with intravenous acetylcysteine for paracetamol (acetaminophen) overdose | ||||||
| Patient or population: people with paracetamol (acetaminophen) overdose | ||||||
| Outcomes | Illustrative comparative risks* (95% CI) | Relative effect | No of participants | Quality of the evidence | Comments | |
| Assumed risk | Corresponding risk | |||||
| Intravenous acetylcysteine | Oral acetylcysteine | |||||
| Mortality | Study population | Not estimable | 66 | ⊕⊝⊝⊝ | ‐ | |
| 0 per 1000 | 0 per 1000 | |||||
| Hepatotoxicity | ‐ | ‐ | ‐ | ‐ | ‐ | Rates of hepatotoxicity not reported, only mean alanine aminotransferase between the 2 study groups. |
| Nausea | Study population | OR 2.71 | 66 | ⊕⊝⊝⊝ | ‐ | |
| 333 per 1000 | 575 per 1000 | |||||
| Vomiting | Study population | OR 2.10 | 66 | ⊕⊝⊝⊝ | ‐ | |
| 152 per 1000 | 273 per 1000 | |||||
| *The basis for the assumed risk (e.g. the median control group risk across studies) is provided in footnotes. The corresponding risk (and its 95% confidence interval) is based on the assumed risk in the comparison group and the relative effect of the intervention (and its 95% CI). | ||||||
| GRADE Working Group grades of evidence | ||||||
| 1Downgraded one level because of risk of bias (due to randomisation details or concealment allocation were not specified, participants were excluded from IV group if they developed an anaphylactoid reaction unresponsive to decreasing the administration rate. Unclear whether these participants were analysed and should have been included as intention‐to‐treat). | ||||||
| Intravenous acetylcysteine compared with placebo in people with fulminant hepatic failure (randomised trials) for paracetamol (acetaminophen) overdose | ||||||
| Patient or population: people with fulminant hepatic failure secondary to paracetamol (acetaminophen) overdose | ||||||
| Outcomes | Illustrative comparative risks* (95% CI) | Relative effect | No of participants | Quality of the evidence | Comments | |
| Assumed risk | Corresponding risk | |||||
| Placebo | Intravenous acetylcysteine | |||||
| Mortality | Study population | Peto OR 0.29 | 50 | ⊕⊕⊝⊝ | Trial Sequential Analysis‐adjusted CI ranged from 0.01 to 15.8. | |
| 800 per 1000 | 537 per 1000 | |||||
| *The basis for the assumed risk (e.g. the median control group risk across studies) is provided in footnotes. The corresponding risk (and its 95% confidence interval) is based on the assumed risk in the comparison group and the relative effect of the intervention (and its 95% CI). | ||||||
| GRADE Working Group grades of evidence | ||||||
| 1Downgraded one level because of risk of bias (randomisation and allocation concealment unclear). | ||||||
| Initial infusion rate of intravenous acetylcysteine over 15 minutes compared with 60 minutes (randomised trials) for paracetamol (acetaminophen) overdose | ||||||
| Patient or population: people with paracetamol (acetaminophen) overdose | ||||||
| Outcomes | Illustrative comparative risks* (95% CI) | Relative effect | No of participants | Quality of the evidence | Comments | |
| Assumed risk | Corresponding risk | |||||
| Initial infusion over 15 minutes | Initial infusion over 60 minutes | |||||
| Mortality | Study population | Not estimable | 180 | ⊕⊝⊝⊝ | ‐ | |
| 0 per 1000 | 0 per 1000 | |||||
| Hepatotoxicity | Study population | OR 1.34 (0.39 to 4.56) | 175 | ⊕⊝⊝⊝ | ‐ | |
| 56 per 1000 | 74 per 1000 | |||||
| Any adverse event | Study population | OR 0.51 (0.27 to 0.96) | 180 | ⊕⊕⊝⊝ | Trial Sequential Analysis‐adjusted CI ranged from 0.36 to 11.0. | |
| 752 per 1000 | 608 per 1000 | |||||
| *The basis for the assumed risk (e.g. the median control group risk across studies) is provided in footnotes. The corresponding risk (and its 95% confidence interval) is based on the assumed risk in the comparison group and the relative effect of the intervention (and its 95% CI). | ||||||
| GRADE Working Group grades of evidence | ||||||
| 1Downgraded one level because of risk of bias (possible bias due to method of randomisation via "randomisation slips" in a "closed box," many participants lost to follow‐up, and uneven numbers between the 2 treatment groups with many more participants in the 15‐minute infusion group). | ||||||
| Oral and intravenous acetylcysteine compared with intravenous acetylcysteine for paracetamol (acetaminophen) overdose | ||||||
| Patient or population: people with paracetamol (acetaminophen) overdose | ||||||
| Outcomes | Illustrative comparative risks* (95% CI) | Relative effect | No of participants | Quality of the evidence | Comments | |
| Assumed risk | Corresponding risk | |||||
| Intravenous acetylcysteine | Oral and intravenous acetylcysteine | |||||
| Mortality | Study population | Not estimable | 40 | ⊕⊝⊝⊝ | Primary outcome for this study was anaphylactoid reaction. Unable to analyse these results due to large number excluded from one arm.1 | |
| 0 per 1000 | 0 per 1000 | |||||
| Hepatotoxicity | ‐ | ‐ | ‐ | ‐ | ‐ | Not reported. |
| *The basis for the assumed risk (e.g. the median control group risk across studies) is provided in footnotes. The corresponding risk (and its 95% confidence interval) is based on the assumed risk in the comparison group and the relative effect of the intervention (and its 95% CI). | ||||||
| GRADE Working Group grades of evidence | ||||||
| 1Downgraded two levels because of serious risk of bias (randomisation sequence generation and allocation concealment not recorded, and a large number of participants excluded (10 excluded from the 25 randomised)). | ||||||
| Charcoal haemoperfusion compared with no intervention (randomised trials) for paracetamol (acetaminophen) overdose | ||||||
| Patient or population: people with paracetamol (acetaminophen) overdose | ||||||
| Outcomes | Illustrative comparative risks* (95% CI) | Relative effect | No of participants | Quality of the evidence | Comments | |
| Assumed risk | Corresponding risk | |||||
| No intervention | Charcoal haemoperfusion | |||||
| Mortality | Study population | Peto OR 7.39 | 16 | ⊕⊝⊝⊝ | Note very small numbers in this trial; only 8 in each group. With only 1 death in the charcoal haemoperfusion arm. The Trial Sequential Analysis‐adjusted CI could not be calculated. | |
| 0 per 1000 | 0 per 1000 | |||||
| *The basis for the assumed risk (e.g. the median control group risk across studies) is provided in footnotes. The corresponding risk (and its 95% confidence interval) is based on the assumed risk in the comparison group and the relative effect of the intervention (and its 95% CI). | ||||||
| GRADE Working Group grades of evidence | ||||||
| 1Downgraded one level because of risk of bias (randomisation sequence generation and allocation concealment not detailed). | ||||||
| Outcome or subgroup title | No. of studies | No. of participants | Statistical method | Effect size |
| 1 Mortality Show forest plot | 1 | Peto Odds Ratio (Peto, Fixed, 95% CI) | Totals not selected | |
| 2 Hepatotoxicity (aspartate aminotransferase > 1000 IU/L) Show forest plot | 1 | Odds Ratio (M‐H, Random, 95% CI) | Totals not selected | |
| Outcome or subgroup title | No. of studies | No. of participants | Statistical method | Effect size |
| 1 Mortality Show forest plot | 2 | 65 | Peto Odds Ratio (Peto, Fixed, 95% CI) | 0.53 [0.05, 5.22] |
| 2 Hepatotoxicity (aspartate aminotransferase > 1000 IU/L) Show forest plot | 2 | 65 | Odds Ratio (M‐H, Random, 95% CI) | 0.09 [0.02, 0.35] |
| Outcome or subgroup title | No. of studies | No. of participants | Statistical method | Effect size |
| 1 Mortality Show forest plot | 1 | Peto Odds Ratio (Peto, Fixed, 95% CI) | Totals not selected | |
| 2 Hepatotoxicity (aspartate aminotransferase > 1000 IU/L) Show forest plot | 1 | 27 | Odds Ratio (M‐H, Random, 95% CI) | 0.92 [0.05, 16.46] |
| Outcome or subgroup title | No. of studies | No. of participants | Statistical method | Effect size |
| 1 Mortality Show forest plot | 1 | Peto Odds Ratio (Peto, Fixed, 95% CI) | Totals not selected | |
| 2 Maximum alanine aminotransferase (IU/L) Show forest plot | 1 | Mean Difference (IV, Random, 95% CI) | Totals not selected | |
| Outcome or subgroup title | No. of studies | No. of participants | Statistical method | Effect size |
| 1 Mortality Show forest plot | 1 | Peto Odds Ratio (Peto, Fixed, 95% CI) | Totals not selected | |
| Outcome or subgroup title | No. of studies | No. of participants | Statistical method | Effect size |
| 1 Mortality Show forest plot | 1 | Peto Odds Ratio (Peto, Fixed, 95% CI) | Totals not selected | |
| 2 Hepatotoxicity Show forest plot | 1 | Odds Ratio (M‐H, Random, 95% CI) | Totals not selected | |
| 3 Any adverse event Show forest plot | 1 | Odds Ratio (M‐H, Random, 95% CI) | Totals not selected | |
| Outcome or subgroup title | No. of studies | No. of participants | Statistical method | Effect size |
| 1 Mortality Show forest plot | 1 | Peto Odds Ratio (Peto, Fixed, 95% CI) | Totals not selected | |
| 2 Hepatotoxicity Show forest plot | 1 | Odds Ratio (M‐H, Random, 95% CI) | Totals not selected | |
| 3 Vomiting, retching, or antiemetics from 0 to 2 hour Show forest plot | 1 | Odds Ratio (M‐H, Random, 95% CI) | Totals not selected | |
| 4 Vomiting, retching, or antiemetics 0 to 12 hour Show forest plot | 1 | Odds Ratio (M‐H, Random, 95% CI) | Totals not selected | |
| 5 Anaphylactoid symptoms (all) Show forest plot | 1 | Odds Ratio (M‐H, Random, 95% CI) | Totals not selected | |
| Outcome or subgroup title | No. of studies | No. of participants | Statistical method | Effect size |
| 1 Mortality Show forest plot | 1 | Peto Odds Ratio (Peto, Fixed, 95% CI) | Totals not selected | |