| 1 Death or dependency at end of follow‐up Show forest plot | 11 | 1582 | Odds Ratio (M‐H, Random, 95% CI) | 0.61 [0.46, 0.79] |
|
| 1.1 Acupuncture vs sham acupuncture | 4 | 262 | Odds Ratio (M‐H, Random, 95% CI) | 0.71 [0.43, 1.18] |
| 1.2 Acupuncture vs open control | 8 | 1320 | Odds Ratio (M‐H, Random, 95% CI) | 0.55 [0.37, 0.80] |
| 2 Death or dependency at end of follow‐up (> 3 months) Show forest plot | 8 | 1436 | Odds Ratio (M‐H, Random, 95% CI) | 0.67 [0.53, 0.85] |
|
| 2.1 Acupuncture vs sham acupuncture | 3 | 244 | Odds Ratio (M‐H, Random, 95% CI) | 0.67 [0.40, 1.12] |
| 2.2 Acupuncture vs open control | 6 | 1192 | Odds Ratio (M‐H, Random, 95% CI) | 0.62 [0.42, 0.93] |
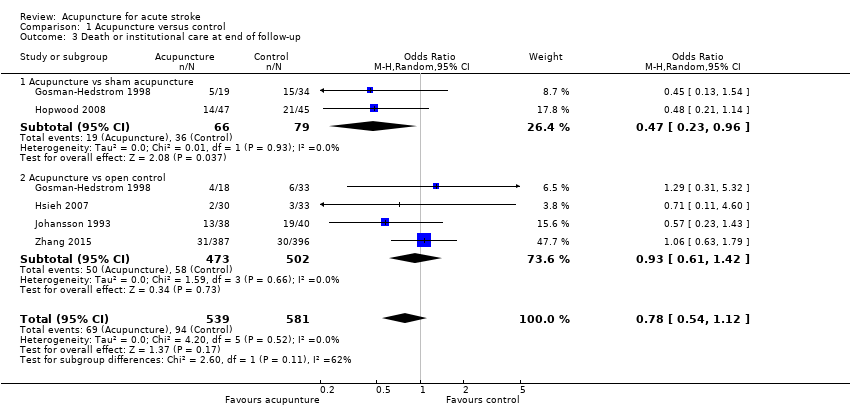
| 3 Death or institutional care at end of follow‐up Show forest plot | 5 | 1120 | Odds Ratio (M‐H, Random, 95% CI) | 0.78 [0.54, 1.12] |
|
| 3.1 Acupuncture vs sham acupuncture | 2 | 145 | Odds Ratio (M‐H, Random, 95% CI) | 0.47 [0.23, 0.96] |
| 3.2 Acupuncture vs open control | 4 | 975 | Odds Ratio (M‐H, Random, 95% CI) | 0.93 [0.61, 1.42] |
| 4 Change in global neurological deficit score at end of treatment period Show forest plot | 12 | 1086 | Std. Mean Difference (IV, Random, 95% CI) | 0.84 [0.36, 1.32] |
|
| 4.1 Acupuncture vs sham acupuncture | 1 | 53 | Std. Mean Difference (IV, Random, 95% CI) | 0.01 [‐0.55, 0.57] |
| 4.2 Acupuncture vs open control | 12 | 1033 | Std. Mean Difference (IV, Random, 95% CI) | 0.91 [0.41, 1.41] |
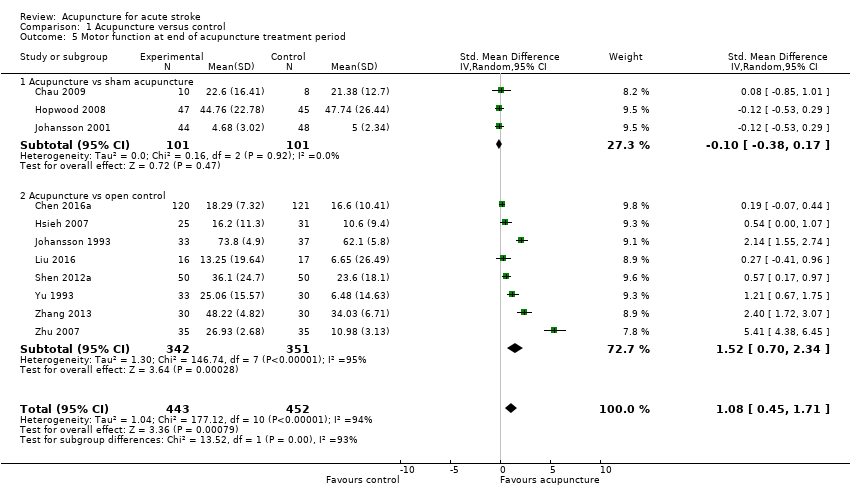
| 5 Motor function at end of acupuncture treatment period Show forest plot | 11 | 895 | Std. Mean Difference (IV, Random, 95% CI) | 1.08 [0.45, 1.71] |
|
| 5.1 Acupuncture vs sham acupuncture | 3 | 202 | Std. Mean Difference (IV, Random, 95% CI) | ‐0.10 [‐0.38, 0.17] |
| 5.2 Acupuncture vs open control | 8 | 693 | Std. Mean Difference (IV, Random, 95% CI) | 1.52 [0.70, 2.34] |
| 6 Motor function at end of follow‐up (> 3 months) Show forest plot | 3 | 186 | Std. Mean Difference (IV, Random, 95% CI) | 0.08 [‐0.21, 0.37] |
|
| 6.1 Acupuncture vs sham acupuncture | 2 | 144 | Std. Mean Difference (IV, Random, 95% CI) | ‐0.02 [‐0.35, 0.31] |
| 6.2 Acupuncture vs open control | 1 | 42 | Std. Mean Difference (IV, Random, 95% CI) | 0.44 [‐0.18, 1.05] |
| 7 Death within first 2 weeks Show forest plot | 18 | 1612 | Odds Ratio (M‐H, Random, 95% CI) | 0.91 [0.33, 2.55] |
|
| 7.1 Acupuncture vs sham acupuncture | 5 | 378 | Odds Ratio (M‐H, Random, 95% CI) | 1.20 [0.27, 5.26] |
| 7.2 Acupuncture vs open control | 14 | 1234 | Odds Ratio (M‐H, Random, 95% CI) | 0.71 [0.17, 2.96] |
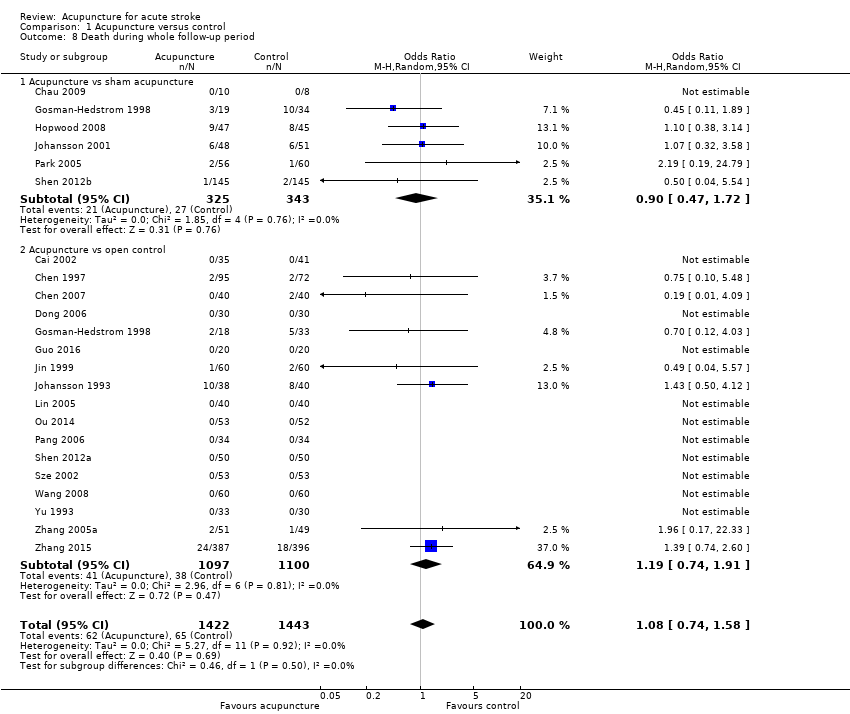
| 8 Death during whole follow‐up period Show forest plot | 22 | 2865 | Odds Ratio (M‐H, Random, 95% CI) | 1.08 [0.74, 1.58] |
|
| 8.1 Acupuncture vs sham acupuncture | 6 | 668 | Odds Ratio (M‐H, Random, 95% CI) | 0.90 [0.47, 1.72] |
| 8.2 Acupuncture vs open control | 17 | 2197 | Odds Ratio (M‐H, Random, 95% CI) | 1.19 [0.74, 1.91] |
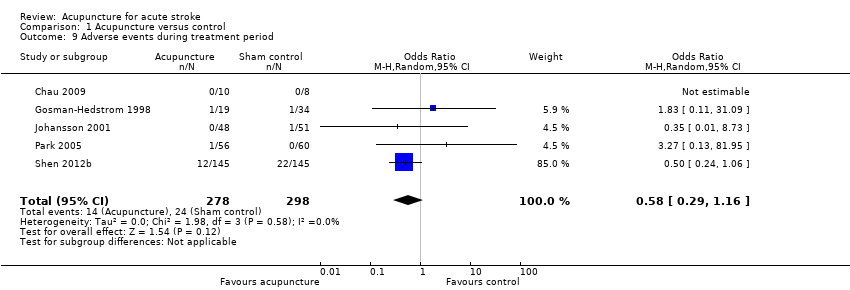
| 9 Adverse events during treatment period Show forest plot | 5 | 576 | Odds Ratio (M‐H, Random, 95% CI) | 0.58 [0.29, 1.16] |
|