Imunoglobulin untuk penyakit hemolitik alloimmune dalam kalangan neonat
Abstract
Background
Exchange transfusion and phototherapy have traditionally been used to treat jaundice and avoid the associated neurological complications. Because of the risks and burdens of exchange transfusion, intravenous immunoglobulin (IVIg) has been suggested as an alternative therapy for alloimmune hemolytic disease of the newborn (HDN) to reduce the need for exchange transfusion.
Objectives
To assess the effect and complications of IVIg in newborn infants with alloimmune HDN on the need for and number of exchange transfusions.
Search methods
We performed electronic searches of CENTRAL, PubMed, Embase (Ovid), Web of Science, CINAHL (EBSCOhost), Academic Search Premier, and the trial registers ClinicalTrials.gov and controlled‐trials.com in May 2017. We also searched reference lists of included and excluded trials and relevant reviews for further relevant studies.
Selection criteria
We considered all randomized and quasi‐randomized controlled trials of IVIg in the treatment of alloimmune HDN. Trials must have used predefined criteria for the use of IVIg and exchange transfusion therapy to be included.
Data collection and analysis
We used the standard methods of Cochrane and its Neonatal Review Group. We assessed studies for inclusion and two review authors independently assessed quality and extracted data. We discussed any differences of opinion to reach consensus. We contacted investigators for additional or missing information. We calculated risk ratio (RR), risk difference (RD) and number needed to treat for an additional beneficial outcome (NNTB) for categorical outcomes. We calculated mean difference (MD) for continuous variables. We used GRADE criteria to assess the risk of bias for major outcomes and to summarize the level of evidence.
Main results
Nine studies with 658 infants fulfilled the inclusion criteria. Term and preterm infants with Rh or ABO (or both) incompatibility were included. The use of exchange transfusion decreased significantly in the immunoglobulin treated group (typical RR 0.35, 95% CI 0.25 to 0.49; typical RD ‐0.22, 95% CI ‐0.27 to ‐0.16; NNTB 5). The mean number of exchange transfusions per infant was also significantly lower in the immunoglobulin treated group (MD ‐0.34, 95% CI ‐0.50 to ‐0.17). However, sensitivity analysis by risk of bias showed that in the only two studies in which the treatment was masked by use of a placebo and outcome assessment was blinded, the results differed; there was no difference in the need for exchange transfusions (RR 0.98, 95% CI 0.48 to 1.98) or number of exchange transfusions (MD ‐0.04, 95% CI ‐0.18 to 0.10). Two studies assessed long‐term outcomes and found no cases of kernicterus, deafness or cerebral palsy.
Authors' conclusions
Although overall results show a significant reduction in the need for exchange transfusion in infants treated with IVIg, the applicability of the results is limited because of low to very low quality of evidence. Furthermore, the two studies at lowest risk of bias show no benefit of IVIg in reducing the need for and number of exchange transfusions. Based on these results, we have insufficient confidence in the effect estimate for benefit of IVIg to make even a weak recommendation for the use of IVIg for the treatment of alloimmune HDN. Further studies are needed before the use of IVIg for the treatment of alloimmune HDN can be recommended, and should include blinding of the intervention by use of a placebo as well as sufficient sample size to assess the potential for serious adverse effects.
PICO
Ringkasan bahasa mudah
Imunoglobulin untuk penyakit hemolitik alloimmune dalam kalangan bayi baru lahir
Soalan ulasan
Adakah IVIg berkesan untuk mengurangkan keperluan pertukaran transfusi dalam kalangan bayi baru lahir dengan penyakit hemolitik ‘alloimmune’ dalam kalangan bayi baru lahir (HDN)?
Latarbelakang
Dalam HDN alloimmune, antibodi ibu (protein yang dihasilkan oleh sistem imun sebagai respon terhadap kehadiran bahan asing) dihasilkan terhadap sel‐sel darah janin. Antibodi‐antibodi ini dipindahkan melalui plasenta dan memusnahkan sel darah merah, yang membawa kepada anemia janin (kekurangan sel merah dalam bayi yang belum lahir). Transfusi darah intrauterus (dalam rahim) digunakan untuk merawat anemia janin yang teruk. Selepas lahir, antibodi kekal berterusan di dalam bayi dan menyebabkan hiperbilirubinemia (paras pigmen oren‐kuning darah (bilirubin, sisa buangan sel darah merah yang dimusnahkan) meningkat dengan risiko kerosakan otak yang serius (kernicterus) dan anemia. Rawatan tradisional hiperbilirubinemia terdiri daripada fototerapi (intensif) (rawatan cahaya) dan pertukaran transfusi (di mana darah bayi diganti dengan darah penderma, ET). Oleh kerana ET adalah prosedur invasif yang berisiko tinggi, rawatan alternatif seperti imunoglobulin intravena (IVIg), telah disiasat. IVIg difikirkan dapat mengurangkan kadar hemolisis dan seterusnya keperluan ET.
Ciri‐ciri kajian
Kami mencari kesusasteraan perubatan pada 19 Mei 2017 dan mendapati sembilan kajian rawak (kajian klinikal di mana orang secara rawak dimasukkan ke dalam satu daripada dua atau lebih kumpulan rawatan) atau kajian separa rawak (kuasi) (melibatkan 658 peserta) yang menilai kecekapan IVIg dalam kalangan bayi dengan HDN alloimmune.
Keputusan utama
Analisis semua kajian yang disertakan menunjukkan pengurangan keperluan dan jumlah ET dalam kalangan bayi yang dirawat dengan IVIg digabungkan dengan fototerapi berbanding bayi yang dirawat dengan fototerapi sahaja. Walau bagaimanapun, ini tidak disahkan dalam analisis dua kajian terkawal plasebo (di mana rawatan pura‐pura diberikan). Tiada perbezaan dalam keperluan untuk atau bilangan transfusi tambahan.
Kualiti bukti
Bukti dari kajian‐kajian adalah berkualiti sangat rendah. Walau bagaimanapun, dua kajian telah menggunakan plasebo, dengan itu meminimumkan bias dan membolehkan pembutaan penyelidik yang menilai respon. Kajian‐kajian tersebut adalah konsisten dengan satu sama lain dan menghasilkan bukti berkualiti sederhana (dengan bilangan kecil peserta yang terlibat (172) menjadikan satu‐satunya alasan untuk tidak menganggap tahap bukti sebagai tinggi) bahawa IVIg tidak berkesan dalam mencegah ET atau transfusi tambahan.
Kesimpulan
Berdasarkan semua kajian yang dimasukkan, kami tidak boleh membuat kesimpulan mengenai manfaat IVIg dalam mencegah ET atau transfusi tambahan. Walau bagaimanapun, kedua‐dua kajian terkawal plasebo memberikan kualiti bukti sederhana bahawa IVIg tidak berkesan dalam mencegah ET atau transfusi tambahan, oleh itu penggunaan rutinnya dalam HDN ‘alloimmune’ tidak disyorkan. Walau bagaimanapun, oleh kerana terdapat beberapa bukti bahawa IVIg mengurangkan hemolisis (dalam kajian makmal), kajian akan datang yang berkualiti tinggi diperlukan untuk menentukan sama ada IVIg mempunyai peranan terhad dalam kalangan sesetengah bayi dengan HDN ‘alloimmune’.
Authors' conclusions
Summary of findings
| Intravenous immunoglobulin plus phototherapy compared to phototherapy alone for alloimmune hemolytic disease in neonates | |||||
| Patient or population: neonates with alloimmune hemolytic disease Settings: ‐ Intervention: IVIg + phototherapy Comparison: phototherapy | |||||
| Outcomes | № of participants | Quality of the evidence | Relative effect | Anticipated absolute effects* (95% CI) | |
| Risk with phototherapy alone | Risk difference with IVIg + phototherapy | ||||
| Use of ET (≥ 1); all studies | 658 | ⊕⊝⊝⊝ | RR 0.35 | Study population | |
| 329 per 1000 | 214 fewer per 1000 | ||||
| Use of ET (≥ 1); placebo‐controlled studies | 172 | ⊕⊕⊕⊝ | RR 0.98 | Study population | |
| 153 per 1000 | 3 fewer per 1000 | ||||
| ETs performed per infant; all studies | 658 | ⊕⊝⊝⊝ | ‐ | The mean ETs per infant for all studies was 0 | MD 0.34 lower |
| ETs performed per infant; placebo‐controlled studies | 172 | ⊕⊕⊕⊝ | ‐ | The mean ETs per infant for placebo‐controlled studies was 0 | MD 0.04 lower |
| Use of top‐up transfusion in 1st week of life; all studies | 378 | ⊕⊕⊝⊝ | RR 1.05 | Study population | |
| 130 per 1000 | 6 more per 1000 | ||||
| Use of top‐up transfusion after 1st week of life; all studies | 507 | ⊕⊝⊝⊝ | RR 1.16 | Study population | |
| 219 per 1000 | 35 more per 1000 | ||||
| Maximum total serum bilirubin (µmol/L); all studies | 451 | ⊕⊝⊝⊝ | ‐ | The mean maximum serum bilirubin (µmol/L) for all studies was 0 | MD 25.39 lower |
| *The risk in the intervention group (and its 95% confidence interval) is based on the assumed risk in the comparison group and the relative effect of the intervention (and its 95% CI). CI: confidence interval; ET: exchange transfusion; IVIg: intravenous immunoglobulin; MD: mean difference; RCT: randomized controlled trial; RR: risk ratio. | |||||
| GRADE Working Group grades of evidence | |||||
| 1In three studies, the method of randomization was not stated and there was inadequate concealment of random sequence (selection bias). In seven studies, there was no blinding of personnel (performance bias) and in five studies, no blinding of outcome assessment (detection bias). Among other potential sources of bias were that mean bilirubin levels at study entry were already higher than the threshold for the outcome (ET) in one study, differences between study groups despite randomization (one study), postrandomization withdrawals or cross‐over between study groups (two studies) and criteria for ET differing between treatment arms (one study). 2Substantial heterogeneity: Chi2 = 34.63, df = 8 (P = 0.0003), I2 = 77%. 3Four studies did not clearly specify use of intensive phototherapy (which should be a routine intervention for infants at high risk of ET). 4Total number of participants in these two trials was low, increasing the risk of possible bias. 5Only a few infants needed a second ET. 6In one trial, the methods of randomization and allocation concealment were not stated. In two studies, there was no blinding of personnel (performance bias). 7Combined studies were underpowered for use of top‐up transfusion in 1st week. A total of 378 infants were enrolled in all four trials, and the overall frequency of top‐up transfusion was low (13.8%). 8Substantial heterogeneity: Chi2 = 15.60, df = 5 (P = 0.008); I2 = 68%. 9Due to small differences between treatment groups, the combined studies were underpowered for use of top‐up transfusion after 1st week. 10Four studies used no method of blinding the intervention. 11Substantial heterogeneity: Chi2 = 14.82, df = 5 (P = 0.01); I2 = 66%. 12Peak serum bilirubin in the control group varied 1.86‐fold between studies; there was considerably greater variation between studies than between groups within studies. | |||||
Background
Description of the condition
The use of anti‐D immunoglobulin prophylaxis in D‐negative women has led to a marked decline in Rh hemolytic disease of the newborn (HDN) (Urbaniak 2000). Sensitization can occur despite immunoprophylaxis, particularly if it is given too late or in insufficient dose. A proportion of HDN is caused by antibodies to antigens other than D and is, therefore, not preventable with anti‐D immunoglobulin. Fetal therapy has significantly improved outcome in Rh sensitized fetuses, but it does not comprehensively prevent need for neonatal treatment (van Kamp 2004). Primary modes of postnatal therapy include phototherapy and exchange transfusion (ET) to reduce risk of mortality and kernicterus. Top‐up transfusions are used to treat early and late anemia. In contemporary perinatal centers, 15% to 40% of neonates admitted for Rh or ABO HDN require at least one ET (Steiner 2007; Smits‐Wintjens 2011).
The safety of ET has been reported for over 50 years. Published mortality rates vary from 0.53% to 4.7% per infant (Boggs 1960; Panagopoulos 1969; Keenan 1985; Guaran 1992; Jackson 1997; Patra 2004; Badiee 2007). ET‐related death is more common in sick or premature infants than in healthy term infants (Boggs 1960; Keenan 1985; Jackson 1997; Steiner 2007). Risks related to ET include adverse cardiorespiratory events; catheter‐related complications; those related to the use of blood products; metabolic derangements; and other serious complications such as pulmonary hemorrhage, necrotizing enterocolitis and bowel perforation. In the last two decades, ET‐related risks have been reported to be as high as 74%, although the incidence of severe adverse events is approximately 3‐10% (Ip 2004; Patra 2004; Badiee 2007; Steiner 2007). Because improved perinatal care has reduced the need for ET, the complication rate could increase as clinicians become less experienced with the procedure (Steiner 2007). However, Steiner 2007 reported that over a 21‐year period, despite a sharp decline in the number of ETs performed, there was no increase in morbidity and mortality.
Description of the intervention
Intravenous immunoglobulin (IVIg) is an alternative therapy that may be effective in treating alloimmune HDN. In 1987, the first report of successful treatment of late anemia due to E‐incompatibility with IVIg was published (Hara 1987). Subsequent case reports and case series reported success of IVIg treatment in neonates with both Rh or ABO incompatibility (Kubo 1991; Sato 1991; Ergaz 1993). However, Hammerman 1996a found a reduced or no response to IVIg treatment in infants with ABO incompatibility who had early and severe hemolysis. Since the early 1990s, several quasi‐randomized or randomized controlled trials on the use of IVIg (including variations on timing of administration and dose) to reduce ET have been published (Alpay 1999; Dağoğlu 1995; Elalfy 2011; Miqdad 2004; Nasseri 2006; Rübo 1992; Santos 2013; Smits‐Wintjens 2011; Tanyer 2001; Atici 1996; Garcia 2004; Girish 2008; Hematyar 2011; Huang 2006; Liu 2016; Pishva 2000; Rübo 1996; Spinelli 2001; Voto 1995; Wang 2002).
The potential benefits of IVIg over ET include that the treatment is less complicated and less labor intensive. In addition, IVIg could allow safe treatment of some infants in less sophisticated neonatal units, or avoid delaying treatment while transferring infants for ET. Comprehensive assessment of IVIg in premature infants, particularly in the treatment of sepsis, has shown that it is safe and well tolerated (INIS Collaborative Group 2011). It is a well‐established therapy for alloimmune thrombocytopenia due to maternal and fetal human platelet antigen incompatibility (Winkelhorst 2017). The risk of transmission of viral infection is extremely low (Fischer 1988). Hemolysis and acute renal failure are uncommon complications of IVIg treatment (Copelan 1986). One study showed an increased incidence of sepsis in premature infants receiving prophylactic IVIg (Magny 1991). Since about 2010, several cases of necrotizing enterocolitis in infants with HDN treated with IVIg have been reported (Figueras‐Aloy 2010; Corvaglia 2012; Yang 2016+
). Other rare serious adverse effects of IVIg have been described in pediatric and adult cohorts, but not in newborns (Kumar 2006).
How the intervention might work
IVIg might reduce the rate of hemolysis in alloimmune HDN by nonspecific blockade of Fc‐receptors on the macrophages that are thought to mediate the destruction of antibody‐coated red cells (Urbaniak 1979). Ergaz 1995 demonstrated a decline in carboxyhemoglobin levels in four of five infants treated with IVIg for alloimmune HDN. Hammerman 1996b demonstrated a significant reduction in carboxyhemoglobin levels in 19 of 26 Coombs‐positive infants treated with IVIg. Carboxyhemoglobin levels are a sensitive index of hemolysis and hence these studies suggest that immunoglobulin could decrease hemolysis. IVIg is typically formulated in 6% to 12% solutions, so at doses of 0.5 g/kg to 1 g/kg the volume administered is 4 mL/kg to 16 mL/kg. It is possible that this is a sufficient fluid bolus to reduce bilirubin levels modestly through dilution, temporarily slowing their rate of rise and allowing more time for intensive phototherapy to have effect.
Why it is important to do this review
This is an update of a Cochrane Review first published in 2002. Although results of the previous review showed a significant reduction in the need for ET in infants treated with IVIg, the applicability of the results was limited because none of three included studies was at low risk of bias. Nevertheless, American Academy of Pediatrics (AAP) guidelines recommend the administration of 0.5 g/kg to 1 g/kg IVIg in alloimmune HDN if total serum bilirubin (TSB) is rising despite intensive phototherapy or if TSB level is within 34 µmol/L to 51 µmol/L (2 mg/dL to 3 mg/dL) of exchange level (AAP 2004). As a result of these guidelines, despite the equivocal conclusions of the previous Cochrane Review, the use of IVIg in alloimmune HDN has become widespread in many countries. However, supplies of IVIg are limited and it does present some hazards. Therefore, use of IVIg should be restricted to treatment of conditions for which it is of confirmed benefit.
Objectives
To assess the effect and complications of IVIg in newborn infants with alloimmune HDN on the need for and number of exchange transfusions.
Methods
Criteria for considering studies for this review
Types of studies
All randomized and quasi‐randomized controlled trials of IVIg in the treatment of alloimmune HDN.
Types of participants
Neonates with alloimmune HDN due to either Rh (or other red cell antigens) or ABO blood group antibodies with or without any other blood group antibodies.
Types of interventions
IVIg given for treatment of alloimmune HDN versus control (placebo or 'standard care'). Phototherapy, which is widely regarded as a safe and effective standard treatment may have been used in both IVIG and control groups. Early and late IVIg administration were defined (for this review) as IVIg started within (early) or after (late) the first 12 hours of life. Studies must have included predefined criteria for both IVIg and ET therapy.
Types of outcome measures
Primary outcomes
Efficacy:
-
use of ET (proportion of infants receiving one or more ETs);
-
ETs performed per infant.
Secondary outcomes
Efficacy:
-
use of top‐up transfusion(s) in first week of life (% of infants);
-
number of top‐up transfusions performed in first week of life per infant;
-
use of top‐up transfusion(s) after first week of life (% of infants);
-
number of top‐up transfusions performed after first week of life per infant;
-
maximum TSB (µmol/L (mg/dL));
-
duration of phototherapy (days);
-
duration of hospitalization (days);
-
incidence of sensorineural hearing loss (any severity);
-
incidence of kernicterus;
-
incidence of cerebral palsy.
Safety:
-
neonatal mortality;
-
incidence of adverse reactions possibly related to the use of IVIg or ET (statement of adverse events from individual trials only).
Search methods for identification of studies
Electronic searches
We performed electronic searches of the Cochrane Central Register of Controlled Trials (CENTRAL, the Cochrane Library), PubMed, Embase (Ovid), Web of Science, CINAHL (EBSCOhost), Emcare and Academic Search Premier. The subject query was applied in all databases taking into account the terminological differences between these databases. The query consisted of the combination of four subjects: immunoglobulins, alloimmune hemolytic jaundice, newborn infants and randomized controlled trials. Various synonyms and related terms for all subjects were used. Two search strategies were used: the first strategy was limited to randomized trials and systematic reviews, the second strategy included only the subjects immunoglobulins and alloimmune hemolytic disease (and synonyms and related terms for those subjects). The search was performed on 19 May 2017. The bibliographic databases yielded 1565 references in total of which titles and abstracts were screened. The complete search strategy is attached in the appendix "Complete Search Strategy." In addition to database searches, we searched the trial registers ClinicalTrials.gov and controlled‐trials.com. We applied no language restrictions.
Searching other resources
We searched the reference lists of all included and excluded trials and relevant reviews for further relevant studies.
Data collection and analysis
We used the standard method of Cochrane and its Neonatal Review Group.
Selection of studies
Two review authors independently screened the titles and abstracts of all references for possible inclusion using predefined criteria for inclusion (see below). We obtained a full‐text version of the article if a report appeared to meet inclusion criteria for the review, or if it was not clear based on title and abstract. We resolved any disagreements through discussion with other review authors.
The inclusion criteria for this review were:
-
randomized and quasi‐randomized controlled trials;
-
study compared IVIg with any definition of "standard care" plus placebo, or with any definition of "standard care" without placebo;
-
study included neonates with alloimmune HDN due to either ABO or Rh blood group antibodies with or without any other blood group antibodies;
-
study measured ETs (primary outcome) for each study arm or at least one of the secondary outcomes (see below) (or both) for each study arm;
-
study used predefined criteria for both IVIg and ET therapy.
Data extraction and management
Two review authors independently extracted data using a data collection form that was pilot tested before use. We resolved any disagreements through discussion and if necessary with the help of a third review author blinded to trial author, institution and journal of publication. One review author contacted authors of studies that did not report all required data or information. One review author entered data into Review Manager 5 (RevMan 2011; RevMan 2014), and at least one review author checked them.
Assessment of risk of bias in included studies
Two review authors independently assessed the risk of bias of included studies using the 'Risk of bias' tool as described in the Cochrane Handbook for Systematic Reviews of Interventions (Higgins 2011). The following items for risk of bias were assessed: random sequence generation, allocation concealment, blinding of participants and personnel, blinding of outcome assessment, incomplete outcome data, selective reporting and other sources of bias. Each item was rated as 'low risk of bias', 'unclear risk of bias' or 'high risk of bias.' Any differences of opinion were discussed with a third blinded review author until consensus was reached. For selective reporting, we used the following criteria to rate a study as 'low risk of bias:'
-
for studies enrolling neonates with Rh or both Rh and ABO HDN: reporting (in paper or subsequent correspondence) at least one outcome related to each of ET, bilirubin and top‐up transfusion, plus adverse effects and hospitalization.
-
for studies enrolling only neonates with ABO HDN: reporting (in paper or subsequent correspondence) at least one outcome related to each of ET and bilirubin, plus adverse effects and hospitalization. Top‐up transfusion was not considered to be a preferred outcome measure because anemia requiring treatment is an unusual consequence of ABO alloimmune hemolysis;
-
study protocols or methods section of papers should not describe an intention to report outcomes that were not subsequently reported in the paper.
Measures of treatment effect
We calculated the risk ratio (RR) and risk difference (RD) for categorical outcomes, such as the incidence of ET. We calculated the mean difference (MD) for continuous variables, such as the maximum bilirubin level. We also calculated the number needed to treat for an additional beneficial outcome (NNTB) to avoid ET, where the assumed control risk was derived from the mean baseline risk from the studies (Schünemann 2013). We presented 95% confidence intervals (CI).
Dealing with missing data
We contacted investigators for missing information about study design, results or both.
Assessment of heterogeneity
We assessed clinical heterogeneity by determining whether clinical characteristics of participants, interventions, outcome measures and timing of outcome measurements were similar for included studies. We assessed statistical heterogeneity using Chi2 and I2 tests. An I2 statistic of 50% or greater was considered as substantial or considerable heterogeneity according to the Cochrane Handbook for Systematic Reviews of Interventions (Higgins 2011).
Assessment of reporting biases
We contacted investigators to request missing outcome data when selective reporting bias was suspected based on the criteria described under Assessment of risk of bias in included studies.
If the data remained unavailable and the absence was thought to introduce serious bias, the study was excluded.
Data synthesis
We used Review Manager 5 to synthesize the available data (RevMan 2014). Whether we used a fixed‐effect model or a random‐effects model depended on the level of clinical heterogeneity and the results of the Chi2 test and I2 statistic for heterogeneity (Higgins 2011). If there was substantial heterogeneity, we used a random‐effects model was used and examined the sources of heterogeneity. If there was no substantial statistical heterogeneity, we used a fixed‐effect model.
Quality of evidence
We used the GRADE approach, as outlined in the GRADE Handbook (Schünemann 2013), to assess the quality of evidence for the following (clinically relevant) outcomes:
-
use of ET (proportion of infants receiving one or more ETs; assessment for all studies and separately for placebo‐controlled studies;
-
ETs per infant; assessment for all studies and separately for placebo‐controlled studies;
-
use of top‐up transfusion(s) in first week of life (% of infants); all studies;
-
use of top‐up transfusion(s) after first week of life (% of infants); all studies;
-
maximum serum bilirubin; all studies.
Two review authors independently assessed the quality of the evidence for each of the outcomes. We considered evidence from randomized controlled trials as high quality but downgraded the evidence one level for serious (or two levels for very serious) limitations based upon the following: design (risk of bias), consistency across studies, directness of the evidence, precision of estimates and presence of publication bias. We used the GRADEpro Guideline Development Tool to create a 'Summary of findings' table to report the quality of the evidence (GRADEpro GDT).
The GRADE approach results in an assessment of the quality of a body of evidence in one of four grades.
-
High: we are very confident that the true effect lies close to that of the estimate of the effect.
-
Moderate: we are moderately confident in the effect estimate: the true effect is likely to be close to the estimate of the effect, but there is a possibility that it is substantially different.
-
Low: our confidence in the effect estimate is limited: the true effect may be substantially different from the estimate of the effect.
-
Very low: we have very little confidence in the effect estimate: the true effect is likely to be substantially different from the estimate of effect.
Subgroup analysis and investigation of heterogeneity
Subgroup analyses were conducted to determine if effects depend on:
-
population:
-
-
Rh incompatibility;
-
gestational age at birth (less than 37 weeks and 37 weeks or greater);
-
-
intervention:
-
-
early administration of IVIg: start of IVIg 12 hours or less after birth;
-
late administration of IVIg: start of IVIg more than 12 hours after birth;
-
single versus multiple doses.
-
As in contemporary care intensive phototherapy is standard care for ABO incompatibility and therefore ETs hardly ever occur in this subgroup nowadays, no subgroup analysis was performed for ABO incompatibility only.
Sensitivity analysis
We conducted a sensitivity analysis based on whether or not the included studies used a placebo and treatment blinding (which had potential to reduce performance bias and detection bias). The two studies that used a placebo were also at low risk of other forms of bias in that they used random sequence generation, allocation concealment, reported complete outcome data for all prespecified outcomes and did not have other apparent risks of bias.
Results
Description of studies
See Characteristics of included studies; Characteristics of excluded studies; and Characteristics of studies awaiting classification tables.
Results of the search
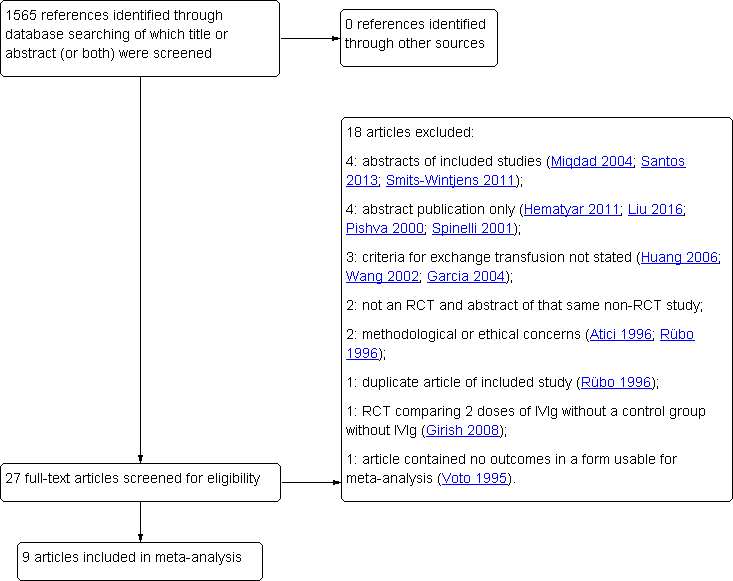
The search conducted up to 19 May 2017 identified 1565 references (see: Appendix 1). After title and abstract screening, the full text of 27 references was screened. After full text screening, nine studies were included in the meta‐analysis (Rübo 1992; Dağoğlu 1995; Alpay 1999; Tanyer 2001; Miqdad 2004; Nasseri 2006; Elalfy 2011; Smits‐Wintjens 2011; Santos 2013). Details of the studies are given in the Characteristics of included studies table. Eleven studies were permanently excluded from this review. Details of these studies are given in the Characteristics of excluded studies table. We found no additional studies searching reference lists of included and excluded studies and relevant reviews. A flow diagram of the study selection process is presented in Figure 1. No additional studies were included after an additional search for ongoing studies in the trial registers ClinicalTrials.gov and controlled‐trials.com.

Flow diagram of study selection process. IVIg: intravenous immunoglobulin; RCT: randomized controlled trial.
Included studies
The review included nine randomized controlled trials published between 1992 and 2013.
Participants
The nine studies included 658 participants. Five studies included only infants with Rh incompatibility (Rübo 1992; Dağoğlu 1995; Elalfy 2011; Smits‐Wintjens 2011; Santos 2013). One study included only infants with ABO incompatibility (Miqdad 2004). Two studies enrolled mostly infants with ABO incompatibility but also some with Rh incompatibility and both ABO and Rh incompatibility (Alpay 1999: 93 ABO, 16 Rh, seven both; Nasseri 2006: 21 ABO, 13 Rh). Tanyer 2001 included 34 infants with ABO incompatibility, 18 with Rh incompatibility, two with "subgroup" incompatibility and seven with "more than one incompatibilities." Only Nasseri 2006 reported results for each type of incompatibility separately and Alpay 1999 provided this information through correspondence. Four studies enrolled only term infants of 37 weeks of gestation or greater (Alpay 1999; Tanyer 2001; Nasseri 2006; Elalfy 2011). None of the studies only included premature infants of less than 37 weeks of gestation. Rübo 1992 did not describe details of the gestational age at birth of enrolled infants. Santos 2013 and Smits‐Wintjens 2011 provided outcomes for term and preterm infants separately.
Interventions
Seven of nine studies that met the inclusion criteria examined the effect of a single dose of IVIg in combination with phototherapy (Rübo 1992; Dağoğlu 1995; Alpay 1999; Miqdad 2004; Elalfy 2011; Smits‐Wintjens 2011; Santos 2013). One study examined multiple doses (Nasseri 2006), and one study compared groups treated with a single dose or multiple doses with a control group (Tanyer 2001), but was inconsistent in describing which group received a single dose or multiple doses of IVIg and therefore this study was excluded from the (planned) subgroup analysis of single and multiple doses. Two studies used a placebo in addition to phototherapy for the control groups (Smits‐Wintjens 2011; Santos 2013). The intensity and topography of phototherapy fits the definition of intensive phototherapy in only three studies (Elalfy 2011; Smits‐Wintjens 2011; Santos 2013). Tanyer 2001 used an obsolete model with three overhead lights from a single angle and Miqdad 2004 did not use a phototherapy blanket beneath the baby. The remainder of included studies did not describe the intensity and topography of phototherapy in sufficient detail to allow a conclusion as to whether it is reasonable to describe it as intensive phototherapy. Five studies started IVIg 12 hours or less after birth (Rübo 1992; Dağoğlu 1995; Elalfy 2011; Smits‐Wintjens 2011; Santos 2013), and three studies started IVIg more than 12 hours after birth (Alpay 1999; Tanyer 2001; Nasseri 2006). Miqdad 2004 started IVIg within 12 hours in nine neonates and more than 12 hours in 47 neonates, but they did not report outcomes for early and late IVIg administration separately.
Since phototherapy was used in both treatment and control groups in all studies and is now considered standard of care in HDN, this review is effectively an analysis of the effectiveness of IVIg plus phototherapy versus phototherapy alone.
Outcomes
All included studies reported ET as the primary outcome. Six studies reported mean (or median) number of ETs per infant (Nasseri 2006; Smits‐Wintjens 2011) or supplied enough data to calculate these (Rübo 1992; Dağoğlu 1995; Tanyer 2001; Elalfy 2011). The authors of four studies provided unpublished data (standard deviation or mean, or both) for ET (Alpay 1999; Miqdad 2004; Smits‐Wintjens 2011; Santos 2013). Four studies reported the maximum bilirubin level (Rübo 1992; Dağoğlu 1995; Smits‐Wintjens 2011; Santos 2013). Two studies provided unpublished data on maximum bilirubin levels (Alpay 1999; Elalfy 2011). Although all studies commented on the duration of phototherapy in their results, only seven studies reported or subsequently provided the numerical data (Alpay 1999; Tanyer 2001; Miqdad 2004; Nasseri 2006; Elalfy 2011; Smits‐Wintjens 2011; Santos 2013). These studies all used predefined criteria for commencing phototherapy but not all for ceasing it. Six studies reported or subsequently provided numerical data on the duration of hospitalization (Alpay 1999; Miqdad 2004; Nasseri 2006; Elalfy 2011; Smits‐Wintjens 2011; Santos 2013). Only two studies reported (after correspondence) predefined criteria for hospital discharge (Miqdad 2004; Santos 2013). Six studies included top‐up transfusion as an outcome (Rübo 1992; Dağoğlu 1995; Alpay 1999; Miqdad 2004; Nasseri 2006; Smits‐Wintjens 2011). Three studies provided additional data on top‐up transfusions (Elalfy 2011; Smits‐Wintjens 2011; Santos 2013). Smits‐Wintjens 2011 did not report top‐up transfusions separately for the first week and after the first week of life, but subsequently provided this information. Elalfy 2011 had a follow‐up period of only one week after discharge. Three studies reported predefined criteria for top‐up transfusions (Alpay 1999; Nasseri 2006; Smits‐Wintjens 2011), and one study later provided data through correspondence (Santos 2013). All studies reported short‐term adverse events. None of the included studies reported data on neurodevelopmental outcomes. Two studies provided additional information on neurodevelopmental outcomes (Miqdad 2004; Santos 2013).
Excluded studies
We excluded 11 studies. One study only compared groups with a high or a low dose of IVIg (Girish 2008), and four studies were only reported in abstract form and our request for additional information was not (sufficiently) answered (Pishva 2000; Spinelli 2001; Hematyar 2011; Liu 2016). Three studies did not report predefined criteria for the primary outcome ET (Wang 2002; Garcia 2004; Huang 2006). One study did not report any outcome in a usable form for meta‐analysis (Voto 1995). Two studies were excluded due to methodological or ethical (or both) concerns (Atici 1996; Rübo 1996). Details of excluded studies are given in the Characteristics of excluded studies table.
Additional data
We attempted to contact the authors of all studies (except for the six studies that were identified for the previous review (Rübo 1992; Dağoğlu 1995; Voto 1995; Alpay 1999; Spinelli 2001; Tanyer 2001) to request further methodological information and results. We successfully contacted the authors of 11 papers (Rübo 1992; Rübo 1996; Alpay 1999; Miqdad 2004; Huang 2006; Elalfy 2011; Hematyar 2011; Smits‐Wintjens 2011; Santos 2013) (including contact for the previous review) ) in order to obtain additional data or to assist with the determination to include or exclude the study.
Risk of bias in included studies
For details of risk of bias of included studies, see the Characteristics of included studies table and Figure 2.

Risk of bias summary: review authors' judgments about each risk of bias item for each included study.
Allocation
Only five studies reported an adequate method of randomization (Dağoğlu 1995; Miqdad 2004; Elalfy 2011; Smits‐Wintjens 2011; Santos 2013). Miqdad 2004 and Elalfy 2011 provided information on randomization method only through correspondence. One quasi‐randomized controlled trial allocated participants by order of admission (Tanyer 2001). This study was rated as high risk of bias for both random sequence generation and allocation concealment. Alpay 1999 did not state what method of randomisation was used either in the paper or in response to a query from the review authors, commenting only that that the group allocation was decided by attending neonatologists who differed from those who were conducting the study, which we construed to mean that the allocation was not random, and that the allocation was at high risk of bias. Nasseri 2006 and Rübo 1992 stated that babies were randomly assigned to treatment groups but did not provide any detail about the method used and the allocation was therefore considered at unclear risk of bias.
Blinding
Only two studies used a placebo in the control group (Smits‐Wintjens 2011; Santos 2013), and were therefore rated as low risk for performance bias and detection bias. After correspondence with the authors of two additional studies, the risk of detection bias was rated as low; Miqdad 2004 explained that data were kept and entered to their database by personnel who were not involved in the management of the cases and Elalfy 2011 explained that the person who performed the randomization was different from the one who conducted the study and the one who analyzed the data. None of the other studies described any method of blinding of intervention after allocation and, therefore, they were rated as high risk of bias on both items.
Incomplete outcome data
Reporting of outcome data was at low risk of bias in seven studies (Rübo 1992; Dağoğlu 1995; Alpay 1999; Tanyer 2001; Miqdad 2004; Nasseri 2006; Smits‐Wintjens 2011; Santos 2013). For six of these studies, there were no missing data. In Rübo 1992, the amount of and reasons for missing data were similar between groups (low risk). One study was at high risk of bias because of a substantial amount of missing data on bilirubin levels (Elalfy 2011).
Selective reporting
Reporting bias was suspected in four studies because important outcomes were either not reported or were not reported in a form that was useable for meta‐analysis, or that allowed judgment about local treatment practices (e.g. if the authors only stated that there was no significant difference between groups) (Rübo 1992; Dağoğlu 1995; Tanyer 2001; Elalfy 2011). The remaining studies were at low risk of bias.
Other potential sources of bias
Elalfy 2011 had non‐random cross‐over after randomization and another study used an additional criterion for ET in the control group only (Miqdad 2004). These two studies were at high risk of bias. Dağoğlu 1995 used post‐randomization consent and although follow‐up was complete for all infants for whom consent was obtained, four infants (two randomized to each arm of the study) were excluded because consent was withheld. Two infants were also excluded post‐randomization in one other study because of "protocol violations" but no details were given (Rübo 1992). The latter two studies were rated at unclear risk of bias because the review authors were unable to assess the impact of these withdrawals on overall outcomes. Three other studies were rated as unclear risk of bias (Alpay 1999; Nasseri 2006), or low risk of bias (Smits‐Wintjens 2011) for a potential risk of bias. For details see 'Risk of bias' tables.
Effects of interventions
Intravenous immunoglobulin plus phototherapy versus control (phototherapy only)
Primary outcomes
Exchange transfusion
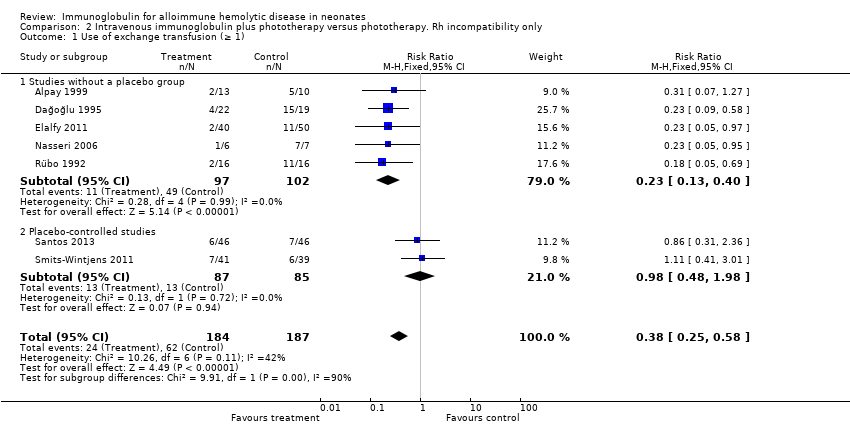
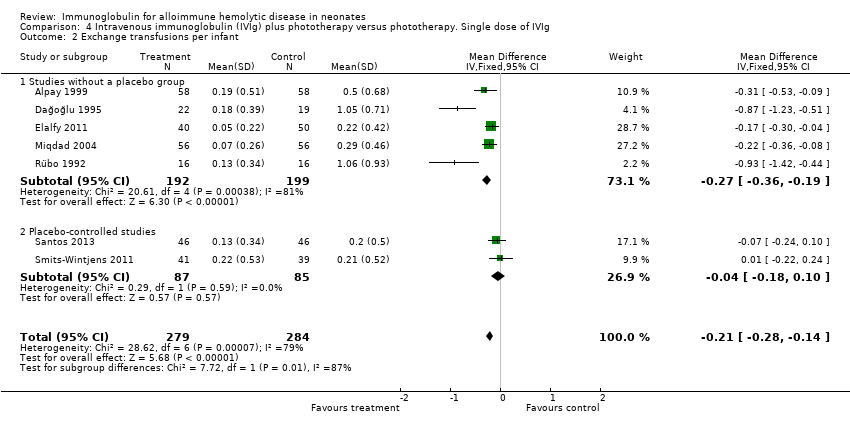
The results of nine included studies could be entered into the meta‐analysis (Rübo 1992; Dağoğlu 1995; Alpay 1999; Tanyer 2001; Miqdad 2004; Nasseri 2006; Elalfy 2011; Smits‐Wintjens 2011; Santos 2013). Most studies found a statistically significant reduction in the use of ET for IVIg treated infants (Rübo 1992; Dağoğlu 1995; Alpay 1999; Tanyer 2001; Miqdad 2004; Nasseri 2006; Elalfy 2011). Two studies concluded that the use of (one or more) ETs was not reduced despite using early IVIg in combination with phototherapy (Smits‐Wintjens 2011; Santos 2013). The meta‐analysis of all nine studies (658 participants) showed that IVIg reduced the need for an ET (typical RR 0.35, 95% CI 0.25 to 0.49; typical RD ‐0.22, 95% CI ‐0.27 to ‐0.16; NNTB 5) (Analysis 1.1). However, overall, we rated this as very low quality evidence, because, although it was derived from randomized trials, there was very serious risk of bias in most trials, and moderate heterogeneity and serious indirectness, related to the fact that some trials did not use intensive phototherapy, which would be considered standard practice.
Subgroup analysis of infants with only Rh incompatibility supported a reduction in the use of ET with IVIg treatment (371 participants, typical RR 0.38, 95% CI 0.25 to 0.58; NNTB 5) (Analysis 2.1) (Rübo 1992; Dağoğlu 1995; Alpay 1999; Nasseri 2006; Elalfy 2011; Smits‐Wintjens 2011; Santos 2013).
In only those infants born at 37 weeks of gestation or greater, IVIg reduced the use of ETs (391 participants, typical RR 0.39, 95% CI 0.25 to 0.61; NNTB 6) (Analysis 6.1) (Alpay 1999; Tanyer 2001; Nasseri 2006; Elalfy 2011; Santos 2013; Smits‐Wintjens 2011). In the subgroup of infants born at less than 37 weeks of gestation, IVIg did not reduce the use of ETs (82 participants, typical RR 0.77, 95% CI 0.31 to 1.91; NNTB 20) (data not shown) (Smits‐Wintjens 2011; Santos 2013).
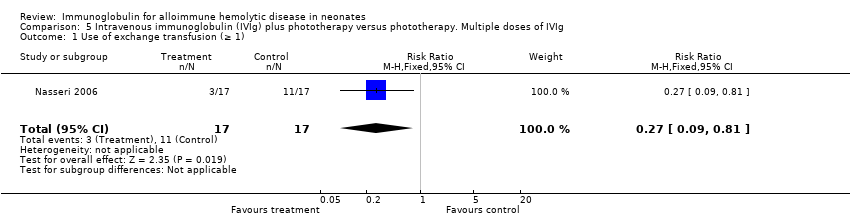
Five studies found reductions in the use of ET where IVIg was used 12 hours or less after birth (335 participants, typical RR 0.41, 95% CI 0.26 to 0.66; NNTB 6) (Analysis 3.1) (Rübo 1992; Dağoğlu 1995; Elalfy 2011; Smits‐Wintjens 2011; Santos 2013). Reductions were also found in the three studies which used IVIg more than 12 hours after birth (211 participants, typical RR 0.31, 95% CI 0.18 to 0.53; NNTB 4) (data not shown) (Alpay 1999; Tanyer 2001; Nasseri 2006). Subgroup analyses of infants receiving a single dose of IVIg and infants receiving multiples doses of IVIg supported a reduction in the use of ET with IVIg treatment, although there was insufficient evidence to support a dose‐response effect (single dose of IVIg: 563 participants, typical RR 0.37, 95% CI 0.26 to 0.53; NNTB 6; Analysis 4.1 (Rübo 1992; Dağoğlu 1995; Alpay 1999; Miqdad 2004; Elalfy 2011; Smits‐Wintjens 2011; Santos 2013); multiple doses of IVIg: 34 participants, RR 0.27, 95% CI 0.09 to 0.81; NNTB 1; Analysis 5.1 (Nasseri 2006)).
However, despite these apparently promising results, analysis of the only two placebo‐controlled studies at low risk of all forms of bias showed no reduction in the use of ET (172 participants, typical RR 0.98, 95% CI 0.48 to 1.98) (Analysis 1.1.2) (Smits‐Wintjens 2011; Santos 2013). Furthermore, when all studies were considered, heterogeneity was moderate for use of ET (Chi2 = 11.32, degrees of freedom (df) = 8 (P = 0.18); I2 = 29%) and was high for ETs per infant (Tau2 = 0.04; Chi2 = 36.77, df = 8 (P < 0.0001); I2 = 78%), whereas the results of both these outcomes for the placebo‐controlled trials were highly consistent (I2 = 0% for both). We rated the quality of evidence from the two placebo‐controlled studies as moderate, downgrading it only for imprecision because of the low total number of participants.
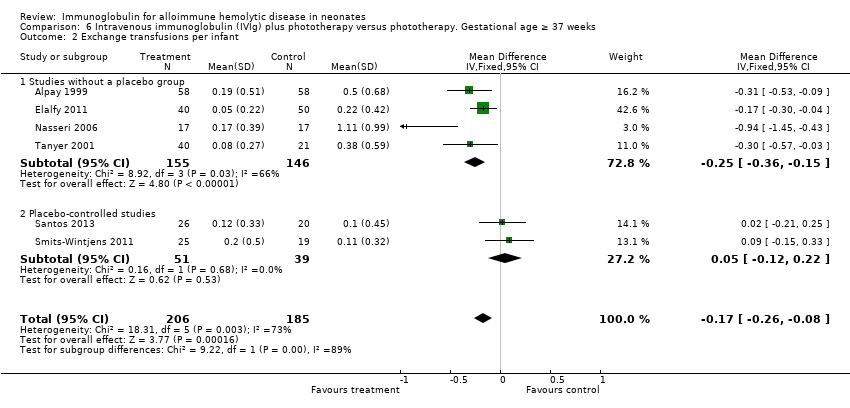
Overall, immunoglobulin treatment also led to a reduction in the mean number of ETs per infant (658 participants, MD ‐0.34, 95% CI ‐0.50 to ‐0.17). We assessed the level of evidence from the whole group of studies as very low, again downgrading the evidence from randomized trials because of very serious risk of bias, high heterogeneity, indirectness and imprecision. In contrast, analysis of the two placebo‐controlled studies were consistent with each other and when considered alone, yielded moderate quality of evidence that IVIg did not reduce the number of ETs (172 participants, MD ‐0.04, 95% CI ‐0.18 to 0.10) (Analysis 1.2.2).
Secondary outcomes
Top‐up transfusions during and after the first week
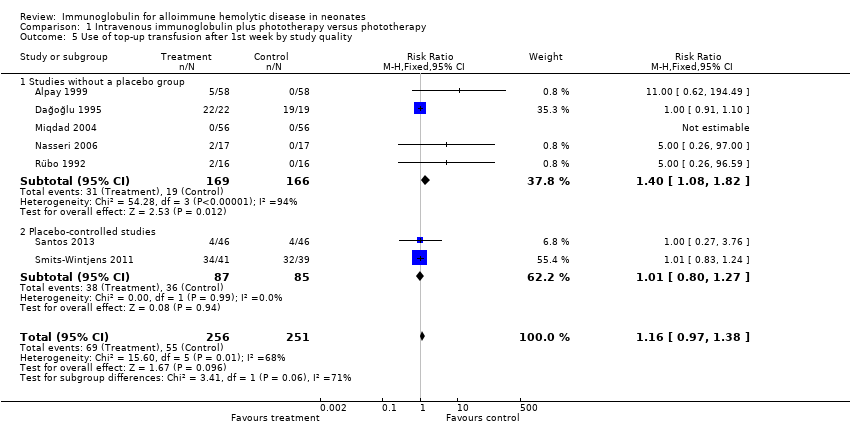
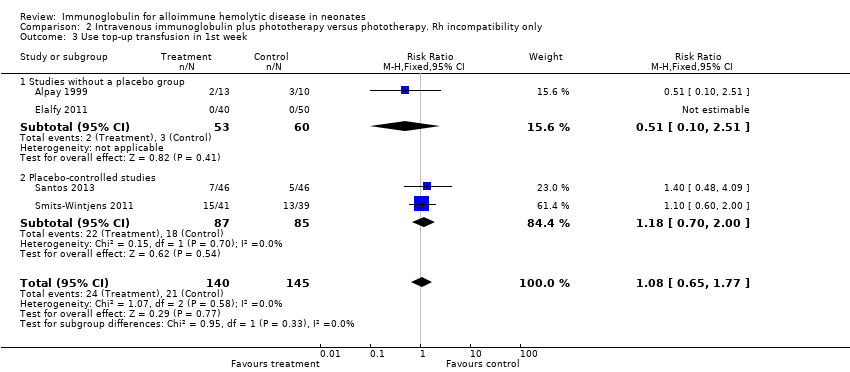
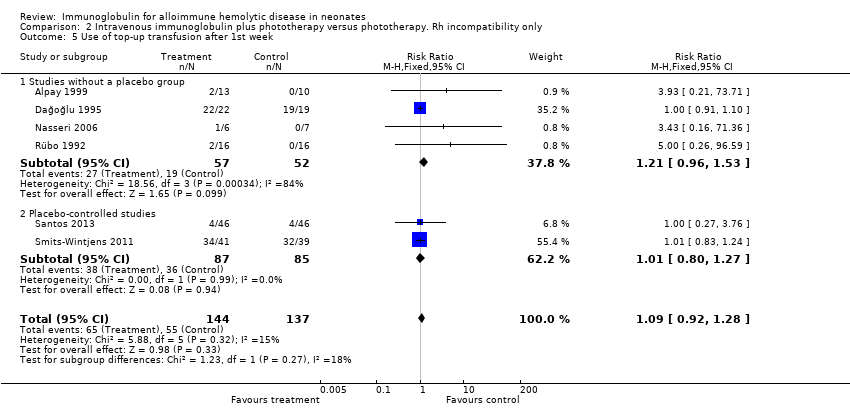
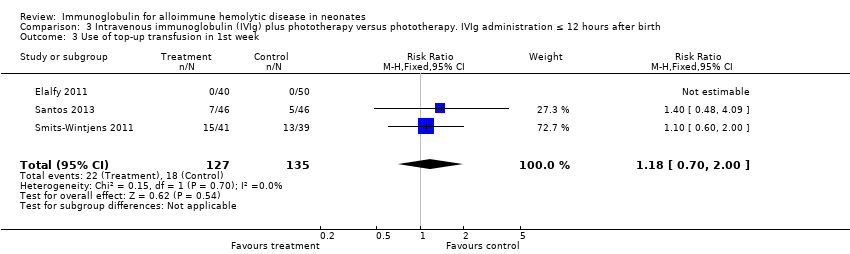
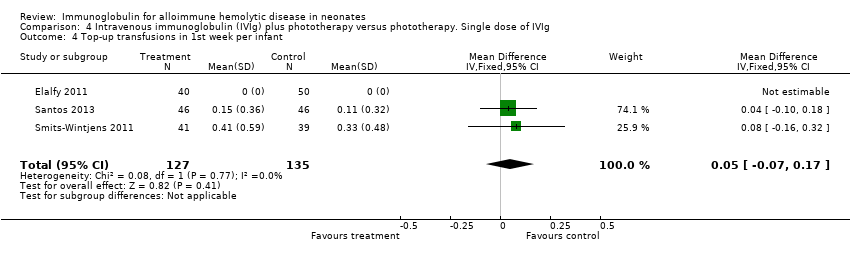
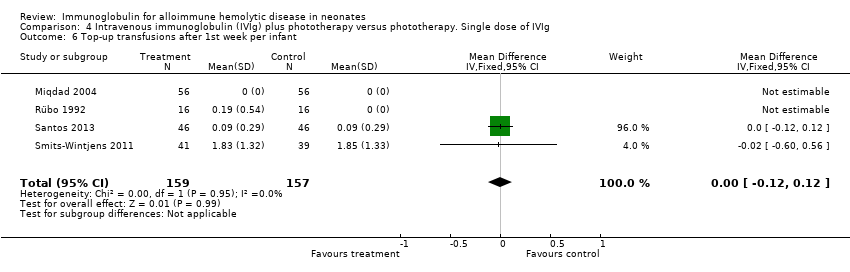
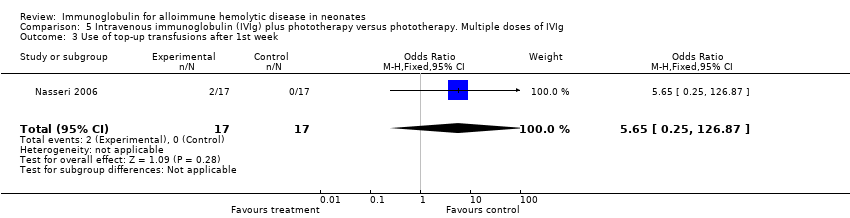
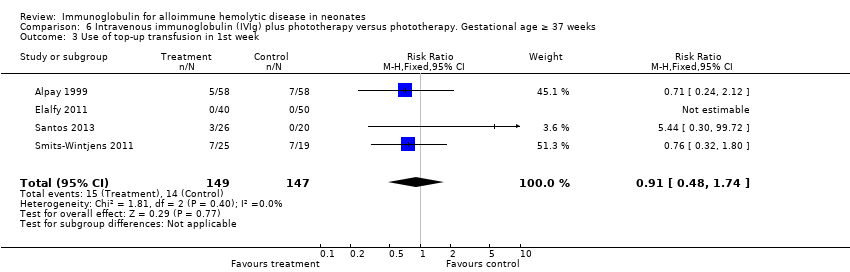
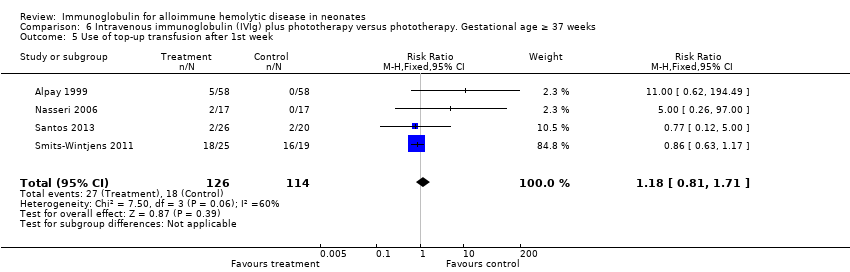
The results of four studies could be entered in the meta‐analysis of the use of top‐up transfusions in the first week of life (Alpay 1999; Elalfy 2011; Smits‐Wintjens 2011; Santos 2013) and of seven studies for the use of top‐up transfusions after the first week of life (Rübo 1992; Dağoğlu 1995; Alpay 1999; Miqdad 2004; Nasseri 2006; Smits‐Wintjens 2011; Santos 2013). IVIg did not increase the need for top‐up transfusions during the first week (378 participants, typical RR 1.05, 95% CI 0.65 to 1.69) (Analysis 1.3) or in the period after the first week (507 participants, typical RR 1.16, 95% CI 0.97 to 1.38) (Analysis 1.5). IVIg also did not increase the need for top‐up transfusions in the first week and after the first week of life in the following subgroups: infants with Rh incompatibility only (first week: typical RR 1.08, 95% CI 0.65 to 1.77 (Analysis 2.3); after first week: typical RR 1.09, 95% CI 0.92 to 1.28 (Analysis 2.5)); infants born 37 weeks or more of gestation (first week: typical RR 0.91, 95% CI 0.48 to 1.74 (Analysis 6.3); after first week: typical RR 1.18, 95% CI 0.81 to 1.71 (Analysis 6.5)); infants born less than 37 weeks of gestation (first week: typical RR 1.39, 95% CI 0.70 to 2.73; after first week: typical RR 1.24, 95% CI 0.93 to 1.67 (data not shown)); infants treated with IVIg 12 hours or less after birth (first week: typical RR 1.18, 95% CI 0.70 to 2.00 (Analysis 3.3); after first week: typical RR 1.04, 95% CI 0.89 to 1.22 (Analysis 3.5)); and in infants treated with a single dose of IVIg (first week: typical RR 1.05, 95% CI 0.65 to 1.69 (Analysis 4.3); after first week: typical RR 1.13, 95% CI 0.95 to 1.33 (Analysis 4.5)). Although the need for top‐up transfusions during the first week of life was not increased for the subgroup of infants treated with IVIg more than 12 hours after birth (typical RR 0.71, 95% CI 0.24 to 2.12) (data not shown), the need for top‐up transfusions after the first week of life was increased with late IVIg treatment (typical RR 8.00, 95% CI 1.03 to 62.26) (data not shown). However, the CIs were very large and the lower CI limit was nearly one. For infants treated with multiple IVIg doses, the use of top‐up transfusions after the first week of life was not increased (typical RR 5.65, 95% CI 0.25 to 126.87) (Analysis 5.3) and not estimable for the first week of life.
For the subgroup of infants included in placebo‐controlled studies only, at low risk of all forms of bias, the need for top‐up transfusions in the first week of life and thereafter was also not altered in infants treated with IVIg (first week: 172 participants, typical RR 1.18, 95% CI 0.70 to 2.00 (Analysis 1.3.2); after first week: typical RR 1.01, 95% CI 0.80 to 1.27 (Analysis 1.5.2)) (Smits‐Wintjens 2011; Santos 2013).
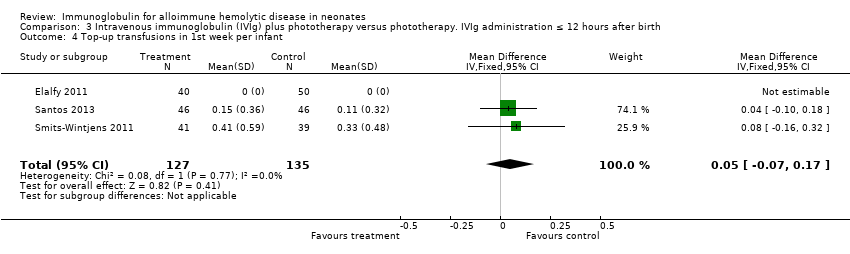
Smits‐Wintjens 2011 and Santos 2013 were the only studies included in the analysis of the number of top‐up transfusions per infant. In the first week of life and thereafter, the number of top‐up transfusions was not altered in IVIg treated infants (first week: MD 0.05, 95% CI ‐0.07 to 0.17 (Analysis 1.4); after first week: MD ‐0.00, 95% CI ‐0.12 to 0.12 (Analysis 1.6)).
When all studies reporting these outcomes were considered, there was low to very low quality evidence (downgraded for risk of serious to very serious bias, and serious imprecision) that IVIg did not alter the risk of early or late top‐up transfusion. These results were consistent with the findings of the placebo‐controlled trials.
Maximum total serum bilirubin
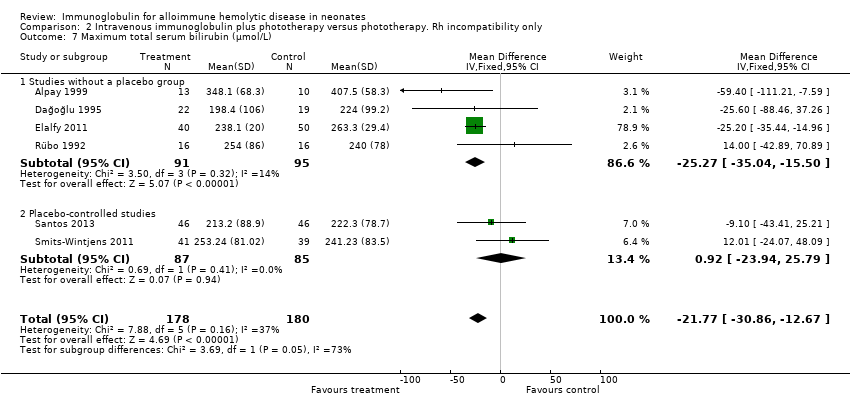
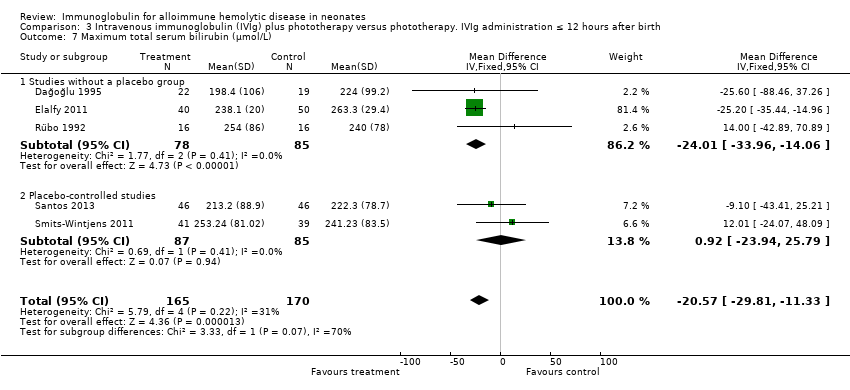
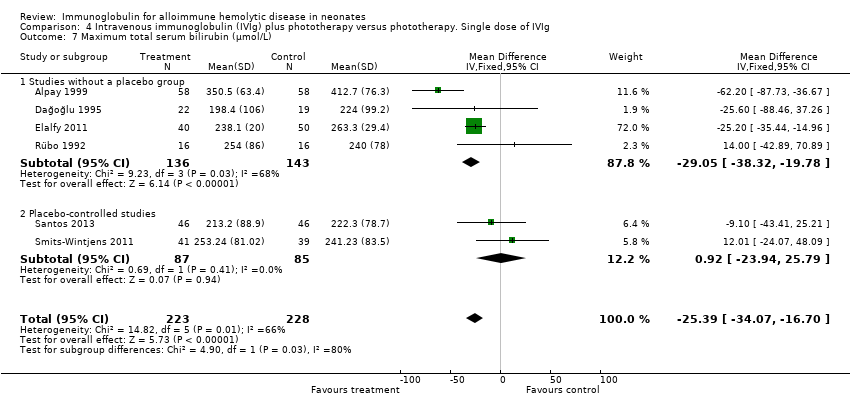
Six studies reported results for maximum serum bilirubin (Rübo 1992; Dağoğlu 1995; Alpay 1999; Elalfy 2011; Smits‐Wintjens 2011; Santos 2013). The meta‐analysis of all six studies showed that the mean maximum serum bilirubin decreased by 25.39 µmol/L in infants receiving IVIg (MD ‐25.39 µmol/L, 95% CI ‐34.07 to ‐16.70) (Analysis 1.7). Furthermore, subgroup analyses showed that IVIg decreased maximum bilirubin levels in infants with Rh incompatibility, infants of more than 37 weeks of gestation, infants treated early or late, and infants treated with a single dose of IVIg. However, subgroup analyses of the only two placebo‐controlled studies (Smits‐Wintjens 2011; Santos 2013) and of infants born at less than 37 weeks of gestation (Smits‐Wintjens 2011; Santos 2013) showed that IVIg did not reduce maximum serum bilirubin (placebo‐controlled trials: MD 0.93 µmol/L, 95% CI ‐23.94 to 25.79 (Analysis 1.7.2); infants born at less than 37 weeks of gestation: MD ‐18.91 µmol/L, 95% CI ‐54.49 to 16.68 (data not shown)). The quality of evidence regarding maximum serum bilirubin was very low, with evidence from six randomized controlled trials downgraded for risk of bias and serious inconsistency; (heterogeneity: Chi2 = 14.82, df = 5 (P = 0.01); I2 = 66%). Of note, the peak serum bilirubin in the control groups varied nearly two‐fold between studies, indicating that there were likely to be very different thresholds for ET between the studies.
Duration of phototherapy
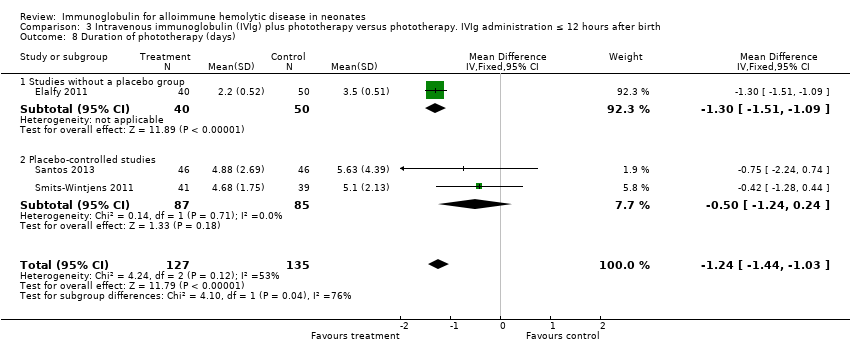
Results of seven studies could be included in the meta‐analysis of the duration of phototherapy (Alpay 1999; Tanyer 2001; Miqdad 2004; Nasseri 2006; Elalfy 2011; Smits‐Wintjens 2011; Santos 2013). Although all studies gave criteria for commencing phototherapy, only five studies described or provided predefined criteria for ceasing phototherapy (Alpay 1999; Tanyer 2001; Elalfy 2011; Smits‐Wintjens 2011; Santos 2013). Analysis of all seven studies showed that duration of phototherapy decreased by 0.98 days with IVIg treatment (MD ‐0.98 days, 95% CI ‐1.31 to ‐0.66) (Analysis 1.8). All subgroup analyses showed a decrease in duration of phototherapy in IVIg‐treated infants varying from a mean decrease of 1.12 days in infants treated with a single dose of IVIg (MD ‐1.12 days, 95% CI ‐1.30 to ‐0.94) (Analysis 4.8) to 1.24 days in infants treated with IVIg 12 hours or less after birth (MD ‐1.24 days, 95% CI ‐1.44 to ‐1.03 (Analysis 3.8)). However, as for maximum bilirubin levels, analyses of the two placebo‐controlled studies and of infants born less than 37 weeks of gestation showed no reduction in duration of phototherapy (placebo‐controlled trials: MD ‐0.50 days, 95% CI ‐1.24 to 0.24 (Analysis 1.8.2); infants born less than 37 weeks of gestation: MD ‐0.91 days, 95% CI ‐1.96 to 0.14) (data not shown)).
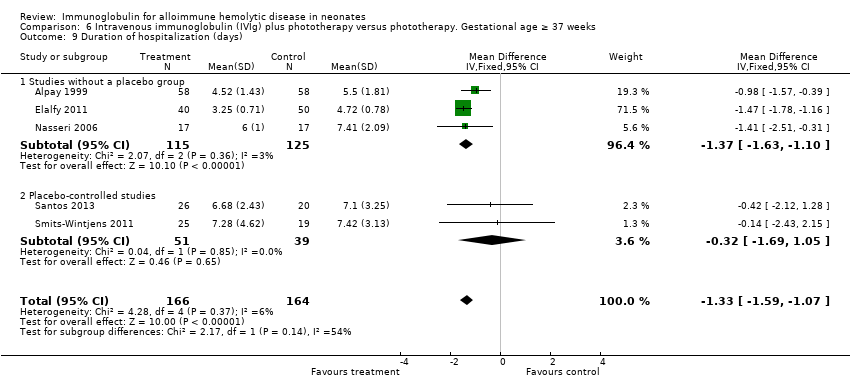
Duration of hospitalization
Results of six studies could be entered in the meta‐analysis (Alpay 1999; Miqdad 2004; Nasseri 2006; Elalfy 2011; Smits‐Wintjens 2011; Santos 2013). None of these studies described predefined criteria for hospital discharge and only two studies provided them through correspondence (Miqdad 2004; Santos 2013). The analysis showed that IVIg treatment shortened duration of hospitalization by 1.34 days (MD ‐1.34 days, 95% CI ‐1.60 to ‐1.09) (data not shown). All subgroup analyses showed a shorter duration of hospitalization with IVIg treatment (data not shown).
Incidence of adverse reactions
All studies reported or subsequently provided data on adverse reactions, although for most of the trials, we did not know any details of what protocols were used to identify adverse events or how they were defined. Nine studies reported that there were no adverse reactions of IVIg treatment (Rübo 1992; Dağoğlu 1995; Alpay 1999; Tanyer 2001; Miqdad 2004; Nasseri 2006; Elalfy 2011; Smits‐Wintjens 2011; Santos 2013). None of the adverse reactions were necrotizing enterocolitis. In the study by Alpay 1999, two control infants receiving ET developed hypoglycemia and hypocalcemia after ET. In the study by Rübo 1992, one control infant who required ET developed sepsis and one control infant who required ET developed inspissated bile syndrome. However, the authors stated that a causal relationship with ET could not be established in either infant. In the study by Dağoğlu 1995, one control infant developed inspissated bile syndrome. Miqdad 2004 described that "no immediate adverse effects related to IVIg were noted, including fever, allergic reactions, volume overload or hemolysis;" however, they also stated that "ten of the babies who had ET, from both groups, had to be treated for blood culture‐positive or clinical sepsis." In the study by Smits‐Wintjens 2011 one infant from the IVIg group developed a Bacillus cereus sepsis with brain abscesses a few days after ET. Sterility tests on the used IVIg batches and cultures of all donor blood products used for intrauterine transfer (IUT) and ET were sterile. The sepsis may have been related to the umbilical venous catheterization and ET. A case report provided information on this exceptional case (Smits‐Wintjens 2010).
Long‐term outcomes
Only two studies had a relatively long follow‐up period of one year (Santos 2013) and two years (Miqdad 2004). In both studies, there were no cases of kernicterus, deafness or cerebral palsy. All participants of the Smits‐Wintjens 2011 study were included in a subsequent long‐term follow‐up study and neurodevelopmental outcome in children of at least two years of age was equal in children treated with IVIg and children treated with placebo (van Klink 2016). The authors stated that their findings may have been limited by a small sample size.
Neonatal mortality
None of the studies reported neonatal mortality data.
Incidence of adverse reactions possibly related to the use of intravenous immunoglobulin or exchange transfusion
None of the studies reported Incidence of adverse reactions possibly related to the use of IVIg or ET.
Discussion
Summary of main results
Data from nine studies with 658 participants provided limited evidence that IVIg treatment in neonates with alloimmune HDN reduced the need for ET. Although this review update showed a significant reduction in the need for ET, most of the included studies were at high risk of bias. IVIg treatment was also associated with a significant reduction in maximum bilirubin level and duration of phototherapy when all included studies were analyzed and for most of the subgroup analyses based on type of alloimmunization, gestational age at birth, and timing and number of doses of IVIg. Duration of hospitalization was significantly reduced when analyzing all studies that reported this outcome and for almost all subgroup analyses, including the analysis of studies at low risk of bias only. Although there was some evidence that IVIg reduced hemolysis and shortened hospital stay, these results should be interpreted with considerable caution because the studies reporting these benefits were not blinded, only two studies used predefined criteria for hospital discharge, and criteria for stopping phototherapy were not reported in most studies. In addition, since the late 1980s, guidelines for phototherapy have recommended using it more promptly for infants at risk of hemolysis (Gartner 1987). In many hospitals, the quality of phototherapy has also improved over the years. Nevertheless, the quality/intensity of phototherapy can still vary today, especially in low‐resource settings and if good quality control is not applied. The incidence of late top‐up transfusions is an important outcome, especially in areas where follow‐up of infants is difficult or where supply of safe blood for transfusion is limited. However, as thresholds for top‐up transfusions in neonates vary widely, this outcome is susceptible to bias, particularly in unblinded studies. Seven of nine studies were included in the analysis of the incidence of top‐up transfusion after the first week of life (Rübo 1992; Dağoğlu 1995; Alpay 1999; Miqdad 2004; Nasseri 2006; Smits‐Wintjens 2011; Santos 2013). However, only five of the seven studies used predefined criteria for top‐up transfusions (Alpay 1999; Miqdad 2004; Nasseri 2006; Smits‐Wintjens 2011; Santos 2013). In addition, the predefined criteria varied between studies, thus conclusions were limited. Data on adverse events of IVIg seemed to indicate that it can be used safely. Although we found reports of a higher incidence of NEC in infants with HDN treated with IVIg in the literature (Corvaglia 2012; Figueras‐Aloy 2010; Yang 2016), there were no cases of NEC in the current meta‐analysis.
Importantly however, subgroup analysis of the only two studies that were placebo‐controlled, blinded, at low risk of all forms of bias, including 172 participants, were very consistent with each other and showed that IVIg treatment had no effect on the need for ET or the number of ETs per infant (Smits‐Wintjens 2011; Santos 2013). As for ET, analysis of these two studies at low risk of bias demonstrated no difference in maximum bilirubin level and duration of phototherapy.
Overall completeness and applicability of evidence
This review included all (quasi‐) randomized controlled trials on the use of IVIg in alloimmune HDN. We identified 27 trials, of which nine trials, comprising 658 infants, fulfilled inclusion criteria for the review. The only two included studies that were placebo‐controlled comprising a total of 172 infants, enrolled only infants with Rh HDN and the intervention consisted of a single dose of 0.5 g/kg to 0.75 g/kg IVIg administered within four to six hours after birth (Smits‐Wintjens 2011; Santos 2013). Santos 2013 included infants of 32 gestational weeks or greater and Smits‐Wintjens 2011 included infants of 35 gestational weeks or greater. Criteria for phototherapy and ET were similar in both studies. Evidence from subgroup analysis of these two studies with 172 participants showed that early administration of IVIg in a single dose of 0.5 g/kg to 0.75 g/kg did not reduce ETs or had other benefits in the treatment of Rh HDN. There was no clear evidence from this review that a higher dose improved efficacy. The only randomized controlled trial comparing the effect of two doses of IVIg in Rh HDN showed that 0.5 g/kg and 1 g/kg had a similar effect on the duration of phototherapy, duration of hospitalization and ET requirements (Girish 2008). However, this study was not powered to detect a difference in the need for ET. Only two studies examined long‐term neurodevelopmental outcome, which found no cases of kernicterus, deafness or cerebral palsy in a follow‐up period of one year (Santos 2013) and two years (Miqdad 2004). All participants of the Smits‐Wintjens 2011 study were included in a subsequent long‐term follow‐up study and neurodevelopmental outcome in children of at least two years of age was equal in children treated with IVIg and children treated with placebo (van Klink 2016).
American Academy of Pediatrics guidelines of 2004 recommend the administration of 0.5 g/kg to 1 g/kg IVIg in alloimmune HDN if TSB is rising despite intensive phototherapy or if TSB level is within 34 µmol/L to 51 µmol/L (2 to 3 mg/dL) of exchange level (AAP 2004). Based on the results of this review and because IVIg administration is not completely without risks (Copelan 1986; Magny 1991; Figueras‐Aloy 2010), and supplies of IVIg are limited, we do not recommend routine use of IVIg. However, since there is some evidence that it reduces hemolysis and it appears safe in infants with alloimmune HDN, it might be reasonable to consider using it in special circumstances, such as during transfer of an infant to a location that can perform an ET, where the risk of ET is considered to be much higher than usual, such as in very or extremely low birth weight infants, or in the context of a future research study.
Quality of the evidence
The quality of included studies ranged from fulfilling none of the 'risk of bias' criteria to fulfilling all criteria (see 'Risk of bias' section of Characteristics of included studies table, and summary of findings Table for the main comparison). Only two of nine trials fulfilled all criteria to be rated as high‐quality studies. We made the decision to evaluate the quality of evidence using GRADE criteria separately for the seven studies at high risk of bias and the two studies at low risk of bias, because evaluation of the seven studies at high risk of bias as a group also demonstrated other concerns including inconsistency and indirectness. For the outcomes of use and number of ETs in the first week, the quality of evidence from the seven studies at high risk of bias was very low, whereas the evidence from the two studies at low risk of bias was moderate (downgraded only for small number of participants). For the outcome of top‐up transfusions after the first week, we evaluated the level of evidence only for Rh HDN and only for the two studies at low risk of bias, because we deemed this outcome to usually be irrelevant for infants with ABO incompatibility (who are at much lower risk of late anemia) and because of incomplete reporting of data in other studies. The evidence was of very low quality. Analysis of the effect of IVIg on the need for ET in infants with ABO incompatibility included only three studies at high risk of bias (Alpay 1999; Miqdad 2004; Nasseri 2006), because other studies only enrolled infants with Rh HDN, did not use predefined criteria for top‐up transfusion or did not provide sufficient detail to separate Rh‐ and ABO‐affected infants. The quality of evidence for IVIg for ABO incompatibility was very low (GRADE analysis not shown). For several of the secondary outcomes of the review, the RR (or other relevant statistic) was not estimable for included studies (no events in either intervention or control groups), highlighting the extent to which these studies were seriously underpowered. In summary, we considered that the evidence from the two trials at low risk of bias provided a sufficient quality of evidence to guide practice.
It was unclear why placebo‐controlled, high‐quality trials yielded such different results. Possibilities included that when administration of IVIg was not compared with use of a placebo administered in similar dose and over similar duration, there were differences in timing of the next bilirubin measurement, meaning that in IVIg‐treated infants, there was longer exposure to phototherapy before the decision about ET was made. Another possibility was that there was bias in the decision to perform an ET, influenced by knowledge of group allocation. A third possibility was that rather than a specific immunomodulatory effect, IVIg (and where used, the placebo solution) has a sufficient non‐specific dilutional effect to change the rate of rise of bilirubin, altering duration of exposure to phototherapy and decision making about ET.
Potential biases in the review process
We tried to minimize bias by working with two review authors who independently assessed eligibility for inclusion of trials, extracted data and assessed risk of bias. However, we were aware that these parts of the review process were based on personal judgment because reviewing research is influenced by prior beliefs. In addition, one included trial was performed by two of the five review authors. Nevertheless, we attempted to review all studies in a similar way. In addition, we were unable to contact authors of all potentially eligible studies and, therefore, we could not include all available data. While the translator of the Turkish included study was a medical doctor from Turkish parents, he may have missed some details regarding the risk of bias of that study.
Agreements and disagreements with other studies or reviews
The overall findings of this review were consistent with previous systematic reviews. Louis 2014 included 12 studies (813 participants) and concurred with our finding that high‐quality studies found no effect of IVIg, whereas low‐quality studies found IVIg effective in HDN. Gottstein 2003 included three studies that were also included in our review (Rübo 1992; Dağoğlu 1995; Alpay 1999), and one study that was excluded from our review (Voto 1995). They concluded that with IVIg treatment significantly fewer infants required ET. Duration of hospitalization and phototherapy were also significantly reduced in their review. However, based on our judgment, none of their included studies was of high quality. Two Chinese systematic reviews (Li 2010a; Li 2010b) also found a reduction in ET requirements, duration of phototherapy and hospitalization but concluded that well‐designed trials with a larger sample size were required for further evaluation of the efficacy and safety of IVIg. Until the date we conducted our search, our review was the most recent, extensive and up‐to‐date review of all randomized and quasi‐randomized trials on the effect of IVIg in alloimmune HDN.
Flow diagram of study selection process. IVIg: intravenous immunoglobulin; RCT: randomized controlled trial.
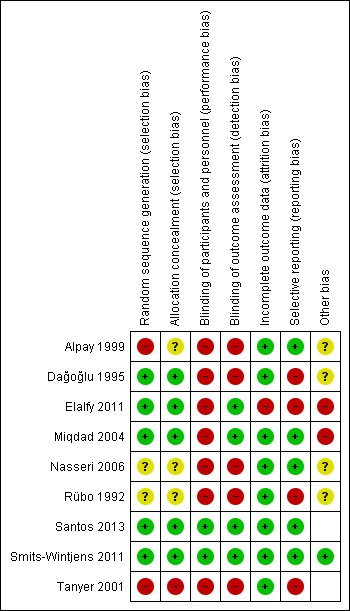
Risk of bias summary: review authors' judgments about each risk of bias item for each included study.

Comparison 1 Intravenous immunoglobulin plus phototherapy versus phototherapy, Outcome 1 Use of exchange transfusion (≥ 1).

Comparison 1 Intravenous immunoglobulin plus phototherapy versus phototherapy, Outcome 2 Exchange transfusions per infant, by study quality.

Comparison 1 Intravenous immunoglobulin plus phototherapy versus phototherapy, Outcome 3 Use of top‐up transfusion in 1st week by study quality.
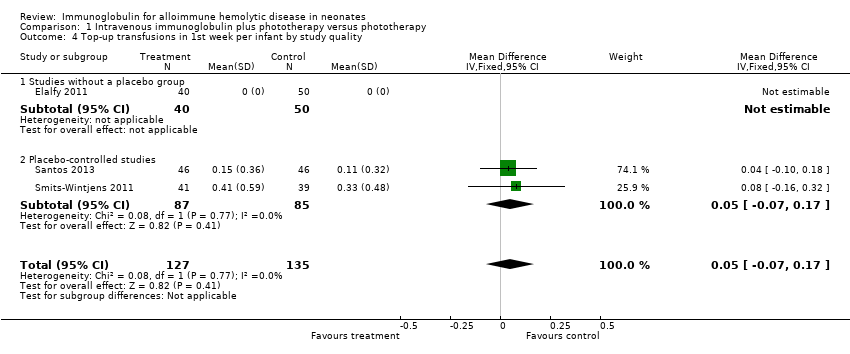
Comparison 1 Intravenous immunoglobulin plus phototherapy versus phototherapy, Outcome 4 Top‐up transfusions in 1st week per infant by study quality.
Comparison 1 Intravenous immunoglobulin plus phototherapy versus phototherapy, Outcome 5 Use of top‐up transfusion after 1st week by study quality.

Comparison 1 Intravenous immunoglobulin plus phototherapy versus phototherapy, Outcome 6 Top‐up transfusions after first week per infant, by study quality.

Comparison 1 Intravenous immunoglobulin plus phototherapy versus phototherapy, Outcome 7 Maximum total serum bilirubin (µmol/L) by study quality.

Comparison 1 Intravenous immunoglobulin plus phototherapy versus phototherapy, Outcome 8 Duration of phototherapy (days) by study quality.
Comparison 2 Intravenous immunoglobulin plus phototherapy versus phototherapy. Rh incompatibility only, Outcome 1 Use of exchange transfusion (≥ 1).

Comparison 2 Intravenous immunoglobulin plus phototherapy versus phototherapy. Rh incompatibility only, Outcome 2 Exchange transfusions per infant.
Comparison 2 Intravenous immunoglobulin plus phototherapy versus phototherapy. Rh incompatibility only, Outcome 3 Use top‐up transfusion in 1st week.

Comparison 2 Intravenous immunoglobulin plus phototherapy versus phototherapy. Rh incompatibility only, Outcome 4 Top‐up transfusions in 1st week per infant.
Comparison 2 Intravenous immunoglobulin plus phototherapy versus phototherapy. Rh incompatibility only, Outcome 5 Use of top‐up transfusion after 1st week.

Comparison 2 Intravenous immunoglobulin plus phototherapy versus phototherapy. Rh incompatibility only, Outcome 6 Top‐up transfusions after 1st week per infant.
Comparison 2 Intravenous immunoglobulin plus phototherapy versus phototherapy. Rh incompatibility only, Outcome 7 Maximum total serum bilirubin (µmol/L).

Comparison 2 Intravenous immunoglobulin plus phototherapy versus phototherapy. Rh incompatibility only, Outcome 8 Duration of phototherapy (days).

Comparison 3 Intravenous immunoglobulin (IVIg) plus phototherapy versus phototherapy. IVIg administration ≤ 12 hours after birth, Outcome 1 Use of exchange transfusion (≥ 1).

Comparison 3 Intravenous immunoglobulin (IVIg) plus phototherapy versus phototherapy. IVIg administration ≤ 12 hours after birth, Outcome 2 Exchange transfusions per infant.
Comparison 3 Intravenous immunoglobulin (IVIg) plus phototherapy versus phototherapy. IVIg administration ≤ 12 hours after birth, Outcome 3 Use of top‐up transfusion in 1st week.
Comparison 3 Intravenous immunoglobulin (IVIg) plus phototherapy versus phototherapy. IVIg administration ≤ 12 hours after birth, Outcome 4 Top‐up transfusions in 1st week per infant.

Comparison 3 Intravenous immunoglobulin (IVIg) plus phototherapy versus phototherapy. IVIg administration ≤ 12 hours after birth, Outcome 5 Use of top‐up transfusions after 1st week.

Comparison 3 Intravenous immunoglobulin (IVIg) plus phototherapy versus phototherapy. IVIg administration ≤ 12 hours after birth, Outcome 6 Top‐up transfusions after 1st week per infant.
Comparison 3 Intravenous immunoglobulin (IVIg) plus phototherapy versus phototherapy. IVIg administration ≤ 12 hours after birth, Outcome 7 Maximum total serum bilirubin (µmol/L).
Comparison 3 Intravenous immunoglobulin (IVIg) plus phototherapy versus phototherapy. IVIg administration ≤ 12 hours after birth, Outcome 8 Duration of phototherapy (days).

Comparison 4 Intravenous immunoglobulin (IVIg) plus phototherapy versus phototherapy. Single dose of IVIg, Outcome 1 Use of exchange transfusion (≥ 1).
Comparison 4 Intravenous immunoglobulin (IVIg) plus phototherapy versus phototherapy. Single dose of IVIg, Outcome 2 Exchange transfusions per infant.

Comparison 4 Intravenous immunoglobulin (IVIg) plus phototherapy versus phototherapy. Single dose of IVIg, Outcome 3 Use of top‐up transfusions in 1st week.
Comparison 4 Intravenous immunoglobulin (IVIg) plus phototherapy versus phototherapy. Single dose of IVIg, Outcome 4 Top‐up transfusions in 1st week per infant.

Comparison 4 Intravenous immunoglobulin (IVIg) plus phototherapy versus phototherapy. Single dose of IVIg, Outcome 5 Use of top‐up transfusion after 1st week.
Comparison 4 Intravenous immunoglobulin (IVIg) plus phototherapy versus phototherapy. Single dose of IVIg, Outcome 6 Top‐up transfusions after 1st week per infant.
Comparison 4 Intravenous immunoglobulin (IVIg) plus phototherapy versus phototherapy. Single dose of IVIg, Outcome 7 Maximum total serum bilirubin (µmol/L).

Comparison 4 Intravenous immunoglobulin (IVIg) plus phototherapy versus phototherapy. Single dose of IVIg, Outcome 8 Duration of phototherapy (days).
Comparison 5 Intravenous immunoglobulin (IVIg) plus phototherapy versus phototherapy. Multiple doses of IVIg, Outcome 1 Use of exchange transfusion (≥ 1).

Comparison 5 Intravenous immunoglobulin (IVIg) plus phototherapy versus phototherapy. Multiple doses of IVIg, Outcome 2 Exchange transfusions per infant.
Comparison 5 Intravenous immunoglobulin (IVIg) plus phototherapy versus phototherapy. Multiple doses of IVIg, Outcome 3 Use of top‐up transfusions after 1st week.

Comparison 5 Intravenous immunoglobulin (IVIg) plus phototherapy versus phototherapy. Multiple doses of IVIg, Outcome 4 Duration of phototherapy (days).

Comparison 6 Intravenous immunoglobulin (IVIg) plus phototherapy versus phototherapy. Gestational age ≥ 37 weeks, Outcome 1 Use of exchange transfusion (≥ 1).
Comparison 6 Intravenous immunoglobulin (IVIg) plus phototherapy versus phototherapy. Gestational age ≥ 37 weeks, Outcome 2 Exchange transfusions per infant.
Comparison 6 Intravenous immunoglobulin (IVIg) plus phototherapy versus phototherapy. Gestational age ≥ 37 weeks, Outcome 3 Use of top‐up transfusion in 1st week.

Comparison 6 Intravenous immunoglobulin (IVIg) plus phototherapy versus phototherapy. Gestational age ≥ 37 weeks, Outcome 4 Top‐up transfusions in 1st week per infant.
Comparison 6 Intravenous immunoglobulin (IVIg) plus phototherapy versus phototherapy. Gestational age ≥ 37 weeks, Outcome 5 Use of top‐up transfusion after 1st week.

Comparison 6 Intravenous immunoglobulin (IVIg) plus phototherapy versus phototherapy. Gestational age ≥ 37 weeks, Outcome 6 Top‐up transfusions after 1st week per infant.

Comparison 6 Intravenous immunoglobulin (IVIg) plus phototherapy versus phototherapy. Gestational age ≥ 37 weeks, Outcome 7 Maximum total serum bilirubin (µmol/L).

Comparison 6 Intravenous immunoglobulin (IVIg) plus phototherapy versus phototherapy. Gestational age ≥ 37 weeks, Outcome 8 Duration of phototherapy (days).
Comparison 6 Intravenous immunoglobulin (IVIg) plus phototherapy versus phototherapy. Gestational age ≥ 37 weeks, Outcome 9 Duration of hospitalization (days).
| Intravenous immunoglobulin plus phototherapy compared to phototherapy alone for alloimmune hemolytic disease in neonates | |||||
| Patient or population: neonates with alloimmune hemolytic disease Settings: ‐ Intervention: IVIg + phototherapy Comparison: phototherapy | |||||
| Outcomes | № of participants | Quality of the evidence | Relative effect | Anticipated absolute effects* (95% CI) | |
| Risk with phototherapy alone | Risk difference with IVIg + phototherapy | ||||
| Use of ET (≥ 1); all studies | 658 | ⊕⊝⊝⊝ | RR 0.35 | Study population | |
| 329 per 1000 | 214 fewer per 1000 | ||||
| Use of ET (≥ 1); placebo‐controlled studies | 172 | ⊕⊕⊕⊝ | RR 0.98 | Study population | |
| 153 per 1000 | 3 fewer per 1000 | ||||
| ETs performed per infant; all studies | 658 | ⊕⊝⊝⊝ | ‐ | The mean ETs per infant for all studies was 0 | MD 0.34 lower |
| ETs performed per infant; placebo‐controlled studies | 172 | ⊕⊕⊕⊝ | ‐ | The mean ETs per infant for placebo‐controlled studies was 0 | MD 0.04 lower |
| Use of top‐up transfusion in 1st week of life; all studies | 378 | ⊕⊕⊝⊝ | RR 1.05 | Study population | |
| 130 per 1000 | 6 more per 1000 | ||||
| Use of top‐up transfusion after 1st week of life; all studies | 507 | ⊕⊝⊝⊝ | RR 1.16 | Study population | |
| 219 per 1000 | 35 more per 1000 | ||||
| Maximum total serum bilirubin (µmol/L); all studies | 451 | ⊕⊝⊝⊝ | ‐ | The mean maximum serum bilirubin (µmol/L) for all studies was 0 | MD 25.39 lower |
| *The risk in the intervention group (and its 95% confidence interval) is based on the assumed risk in the comparison group and the relative effect of the intervention (and its 95% CI). CI: confidence interval; ET: exchange transfusion; IVIg: intravenous immunoglobulin; MD: mean difference; RCT: randomized controlled trial; RR: risk ratio. | |||||
| GRADE Working Group grades of evidence | |||||
| 1In three studies, the method of randomization was not stated and there was inadequate concealment of random sequence (selection bias). In seven studies, there was no blinding of personnel (performance bias) and in five studies, no blinding of outcome assessment (detection bias). Among other potential sources of bias were that mean bilirubin levels at study entry were already higher than the threshold for the outcome (ET) in one study, differences between study groups despite randomization (one study), postrandomization withdrawals or cross‐over between study groups (two studies) and criteria for ET differing between treatment arms (one study). 2Substantial heterogeneity: Chi2 = 34.63, df = 8 (P = 0.0003), I2 = 77%. 3Four studies did not clearly specify use of intensive phototherapy (which should be a routine intervention for infants at high risk of ET). 4Total number of participants in these two trials was low, increasing the risk of possible bias. 5Only a few infants needed a second ET. 6In one trial, the methods of randomization and allocation concealment were not stated. In two studies, there was no blinding of personnel (performance bias). 7Combined studies were underpowered for use of top‐up transfusion in 1st week. A total of 378 infants were enrolled in all four trials, and the overall frequency of top‐up transfusion was low (13.8%). 8Substantial heterogeneity: Chi2 = 15.60, df = 5 (P = 0.008); I2 = 68%. 9Due to small differences between treatment groups, the combined studies were underpowered for use of top‐up transfusion after 1st week. 10Four studies used no method of blinding the intervention. 11Substantial heterogeneity: Chi2 = 14.82, df = 5 (P = 0.01); I2 = 66%. 12Peak serum bilirubin in the control group varied 1.86‐fold between studies; there was considerably greater variation between studies than between groups within studies. | |||||
| Outcome or subgroup title | No. of studies | No. of participants | Statistical method | Effect size |
| 1 Use of exchange transfusion (≥ 1) Show forest plot | 9 | 658 | Risk Ratio (M‐H, Fixed, 95% CI) | 0.35 [0.25, 0.49] |
| 1.1 Studies without a placebo group | 7 | 486 | Risk Ratio (M‐H, Fixed, 95% CI) | 0.26 [0.18, 0.39] |
| 1.2 Placebo‐controlled studies | 2 | 172 | Risk Ratio (M‐H, Fixed, 95% CI) | 0.98 [0.48, 1.98] |
| 2 Exchange transfusions per infant, by study quality Show forest plot | 9 | 658 | Mean Difference (IV, Random, 95% CI) | ‐0.34 [‐0.50, ‐0.17] |
| 2.1 Studies without a placebo group | 7 | 486 | Mean Difference (IV, Random, 95% CI) | ‐0.44 [‐0.64, ‐0.25] |
| 2.2 Placebo‐controlled studies | 2 | 172 | Mean Difference (IV, Random, 95% CI) | ‐0.04 [‐0.18, 0.10] |
| 3 Use of top‐up transfusion in 1st week by study quality Show forest plot | 4 | 378 | Risk Ratio (M‐H, Fixed, 95% CI) | 1.05 [0.65, 1.69] |
| 3.1 Studies without a placebo group | 2 | 206 | Risk Ratio (M‐H, Fixed, 95% CI) | 0.71 [0.24, 2.12] |
| 3.2 Placebo‐controlled studies | 2 | 172 | Risk Ratio (M‐H, Fixed, 95% CI) | 1.18 [0.70, 2.00] |
| 4 Top‐up transfusions in 1st week per infant by study quality Show forest plot | 3 | 262 | Mean Difference (IV, Fixed, 95% CI) | 0.05 [‐0.07, 0.17] |
| 4.1 Studies without a placebo group | 1 | 90 | Mean Difference (IV, Fixed, 95% CI) | 0.0 [0.0, 0.0] |
| 4.2 Placebo‐controlled studies | 2 | 172 | Mean Difference (IV, Fixed, 95% CI) | 0.05 [‐0.07, 0.17] |
| 5 Use of top‐up transfusion after 1st week by study quality Show forest plot | 7 | 507 | Risk Ratio (M‐H, Fixed, 95% CI) | 1.16 [0.97, 1.38] |
| 5.1 Studies without a placebo group | 5 | 335 | Risk Ratio (M‐H, Fixed, 95% CI) | 1.40 [1.08, 1.82] |
| 5.2 Placebo‐controlled studies | 2 | 172 | Risk Ratio (M‐H, Fixed, 95% CI) | 1.01 [0.80, 1.27] |
| 6 Top‐up transfusions after first week per infant, by study quality Show forest plot | 4 | 316 | Mean Difference (IV, Fixed, 95% CI) | ‐0.00 [‐0.12, 0.12] |
| 6.1 Studies without a placebo group | 2 | 144 | Mean Difference (IV, Fixed, 95% CI) | 0.0 [0.0, 0.0] |
| 6.2 Placebo‐controlled studies | 2 | 172 | Mean Difference (IV, Fixed, 95% CI) | ‐0.00 [‐0.12, 0.12] |
| 7 Maximum total serum bilirubin (µmol/L) by study quality Show forest plot | 6 | 451 | Mean Difference (IV, Fixed, 95% CI) | ‐25.39 [‐34.07, ‐16.70] |
| 7.1 Studies without a placebo group | 4 | 279 | Mean Difference (IV, Fixed, 95% CI) | ‐29.05 [‐38.32, ‐19.78] |
| 7.2 Placebo‐controlled studies | 2 | 172 | Mean Difference (IV, Fixed, 95% CI) | 0.93 [‐23.94, 25.79] |
| 8 Duration of phototherapy (days) by study quality Show forest plot | 7 | 585 | Mean Difference (IV, Random, 95% CI) | ‐0.98 [‐1.31, ‐0.66] |
| 8.1 Studies without a placebo group | 5 | 413 | Mean Difference (IV, Random, 95% CI) | ‐1.06 [‐1.41, ‐0.72] |
| 8.2 Placebo‐controlled studies | 2 | 172 | Mean Difference (IV, Random, 95% CI) | ‐0.50 [‐1.24, 0.24] |
| Outcome or subgroup title | No. of studies | No. of participants | Statistical method | Effect size |
| 1 Use of exchange transfusion (≥ 1) Show forest plot | 7 | 371 | Risk Ratio (M‐H, Fixed, 95% CI) | 0.38 [0.25, 0.58] |
| 1.1 Studies without a placebo group | 5 | 199 | Risk Ratio (M‐H, Fixed, 95% CI) | 0.23 [0.13, 0.40] |
| 1.2 Placebo‐controlled studies | 2 | 172 | Risk Ratio (M‐H, Fixed, 95% CI) | 0.98 [0.48, 1.98] |
| 2 Exchange transfusions per infant Show forest plot | 7 | 371 | Mean Difference (IV, Fixed, 95% CI) | ‐0.25 [‐0.34, ‐0.16] |
| 2.1 Studies without a placebo group | 5 | 199 | Mean Difference (IV, Fixed, 95% CI) | ‐0.39 [‐0.51, ‐0.28] |
| 2.2 Placebo‐controlled studies | 2 | 172 | Mean Difference (IV, Fixed, 95% CI) | ‐0.04 [‐0.18, 0.10] |
| 3 Use top‐up transfusion in 1st week Show forest plot | 4 | 285 | Risk Ratio (M‐H, Fixed, 95% CI) | 1.08 [0.65, 1.77] |
| 3.1 Studies without a placebo group | 2 | 113 | Risk Ratio (M‐H, Fixed, 95% CI) | 0.51 [0.10, 2.51] |
| 3.2 Placebo‐controlled studies | 2 | 172 | Risk Ratio (M‐H, Fixed, 95% CI) | 1.18 [0.70, 2.00] |
| 4 Top‐up transfusions in 1st week per infant Show forest plot | 3 | 262 | Mean Difference (IV, Fixed, 95% CI) | 0.05 [‐0.07, 0.17] |
| 4.1 Studies without a placebo group | 1 | 90 | Mean Difference (IV, Fixed, 95% CI) | 0.0 [0.0, 0.0] |
| 4.2 Placebo‐controlled studies | 2 | 172 | Mean Difference (IV, Fixed, 95% CI) | 0.05 [‐0.07, 0.17] |
| 5 Use of top‐up transfusion after 1st week Show forest plot | 6 | 281 | Risk Ratio (M‐H, Fixed, 95% CI) | 1.09 [0.92, 1.28] |
| 5.1 Studies without a placebo group | 4 | 109 | Risk Ratio (M‐H, Fixed, 95% CI) | 1.21 [0.96, 1.53] |
| 5.2 Placebo‐controlled studies | 2 | 172 | Risk Ratio (M‐H, Fixed, 95% CI) | 1.01 [0.80, 1.27] |
| 6 Top‐up transfusions after 1st week per infant Show forest plot | 3 | 204 | Mean Difference (IV, Fixed, 95% CI) | ‐0.00 [‐0.12, 0.12] |
| 7 Maximum total serum bilirubin (µmol/L) Show forest plot | 6 | 358 | Mean Difference (IV, Fixed, 95% CI) | ‐21.77 [‐30.86, ‐12.67] |
| 7.1 Studies without a placebo group | 4 | 186 | Mean Difference (IV, Fixed, 95% CI) | ‐25.27 [‐35.04, ‐15.50] |
| 7.2 Placebo‐controlled studies | 2 | 172 | Mean Difference (IV, Fixed, 95% CI) | 0.92 [‐23.94, 25.79] |
| 8 Duration of phototherapy (days) Show forest plot | 5 | 298 | Mean Difference (IV, Fixed, 95% CI) | ‐1.23 [‐1.43, ‐1.02] |
| 8.1 Studies without a placebo group | 3 | 126 | Mean Difference (IV, Fixed, 95% CI) | ‐1.28 [‐1.49, ‐1.07] |
| 8.2 Placebo‐controlled studies | 2 | 172 | Mean Difference (IV, Fixed, 95% CI) | ‐0.50 [‐1.24, 0.24] |
| Outcome or subgroup title | No. of studies | No. of participants | Statistical method | Effect size |
| 1 Use of exchange transfusion (≥ 1) Show forest plot | 5 | 335 | Risk Ratio (M‐H, Fixed, 95% CI) | 0.41 [0.26, 0.66] |
| 1.1 Studies without a placebo group | 3 | 163 | Risk Ratio (M‐H, Fixed, 95% CI) | 0.22 [0.11, 0.42] |
| 1.2 Placebo‐controlled studies | 2 | 172 | Risk Ratio (M‐H, Fixed, 95% CI) | 0.98 [0.48, 1.98] |
| 2 Exchange transfusions per infant Show forest plot | 5 | 335 | Mean Difference (IV, Fixed, 95% CI) | ‐0.19 [‐0.28, ‐0.10] |
| 2.1 Studies without a placebo group | 3 | 163 | Mean Difference (IV, Fixed, 95% CI) | ‐0.30 [‐0.42, ‐0.18] |
| 2.2 Placebo‐controlled studies | 2 | 172 | Mean Difference (IV, Fixed, 95% CI) | ‐0.04 [‐0.18, 0.10] |
| 3 Use of top‐up transfusion in 1st week Show forest plot | 3 | 262 | Risk Ratio (M‐H, Fixed, 95% CI) | 1.18 [0.70, 2.00] |
| 4 Top‐up transfusions in 1st week per infant Show forest plot | 3 | 262 | Mean Difference (IV, Fixed, 95% CI) | 0.05 [‐0.07, 0.17] |
| 5 Use of top‐up transfusions after 1st week Show forest plot | 4 | 245 | Risk Ratio (M‐H, Fixed, 95% CI) | 1.04 [0.89, 1.22] |
| 6 Top‐up transfusions after 1st week per infant Show forest plot | 3 | 204 | Mean Difference (IV, Fixed, 95% CI) | ‐0.00 [‐0.12, 0.12] |
| 7 Maximum total serum bilirubin (µmol/L) Show forest plot | 5 | 335 | Mean Difference (IV, Fixed, 95% CI) | ‐20.57 [‐29.81, ‐11.33] |
| 7.1 Studies without a placebo group | 3 | 163 | Mean Difference (IV, Fixed, 95% CI) | ‐24.01 [‐33.96, ‐14.06] |
| 7.2 Placebo‐controlled studies | 2 | 172 | Mean Difference (IV, Fixed, 95% CI) | 0.92 [‐23.94, 25.79] |
| 8 Duration of phototherapy (days) Show forest plot | 3 | 262 | Mean Difference (IV, Fixed, 95% CI) | ‐1.24 [‐1.44, ‐1.03] |
| 8.1 Studies without a placebo group | 1 | 90 | Mean Difference (IV, Fixed, 95% CI) | ‐1.30 [‐1.51, ‐1.09] |
| 8.2 Placebo‐controlled studies | 2 | 172 | Mean Difference (IV, Fixed, 95% CI) | ‐0.50 [‐1.24, 0.24] |
| Outcome or subgroup title | No. of studies | No. of participants | Statistical method | Effect size |
| 1 Use of exchange transfusion (≥ 1) Show forest plot | 7 | 563 | Risk Ratio (M‐H, Fixed, 95% CI) | 0.37 [0.26, 0.53] |
| 1.1 Studies without a placebo group | 5 | 391 | Risk Ratio (M‐H, Fixed, 95% CI) | 0.27 [0.17, 0.42] |
| 1.2 Placebo‐controlled studies | 2 | 172 | Risk Ratio (M‐H, Fixed, 95% CI) | 0.98 [0.48, 1.98] |
| 2 Exchange transfusions per infant Show forest plot | 7 | 563 | Mean Difference (IV, Fixed, 95% CI) | ‐0.21 [‐0.28, ‐0.14] |
| 2.1 Studies without a placebo group | 5 | 391 | Mean Difference (IV, Fixed, 95% CI) | ‐0.27 [‐0.36, ‐0.19] |
| 2.2 Placebo‐controlled studies | 2 | 172 | Mean Difference (IV, Fixed, 95% CI) | ‐0.04 [‐0.18, 0.10] |
| 3 Use of top‐up transfusions in 1st week Show forest plot | 4 | 378 | Risk Ratio (M‐H, Fixed, 95% CI) | 1.05 [0.65, 1.69] |
| 4 Top‐up transfusions in 1st week per infant Show forest plot | 3 | 262 | Mean Difference (IV, Fixed, 95% CI) | 0.05 [‐0.07, 0.17] |
| 5 Use of top‐up transfusion after 1st week Show forest plot | 6 | 473 | Risk Ratio (M‐H, Fixed, 95% CI) | 1.13 [0.95, 1.33] |
| 6 Top‐up transfusions after 1st week per infant Show forest plot | 4 | 316 | Mean Difference (IV, Fixed, 95% CI) | ‐0.00 [‐0.12, 0.12] |
| 7 Maximum total serum bilirubin (µmol/L) Show forest plot | 6 | 451 | Mean Difference (IV, Fixed, 95% CI) | ‐25.39 [‐34.07, ‐16.70] |
| 7.1 Studies without a placebo group | 4 | 279 | Mean Difference (IV, Fixed, 95% CI) | ‐29.05 [‐38.32, ‐19.78] |
| 7.2 Placebo‐controlled studies | 2 | 172 | Mean Difference (IV, Fixed, 95% CI) | 0.92 [‐23.94, 25.79] |
| 8 Duration of phototherapy (days) Show forest plot | 5 | 490 | Mean Difference (IV, Fixed, 95% CI) | ‐1.12 [‐1.30, ‐0.94] |
| 8.1 Studies without a placebo group | 3 | 318 | Mean Difference (IV, Fixed, 95% CI) | ‐1.16 [‐1.34, ‐0.97] |
| 8.2 Placebo‐controlled studies | 2 | 172 | Mean Difference (IV, Fixed, 95% CI) | ‐0.50 [‐1.24, 0.24] |
| Outcome or subgroup title | No. of studies | No. of participants | Statistical method | Effect size |
| 1 Use of exchange transfusion (≥ 1) Show forest plot | 1 | 34 | Risk Ratio (M‐H, Fixed, 95% CI) | 0.27 [0.09, 0.81] |
| 2 Exchange transfusions per infant Show forest plot | 1 | 34 | Mean Difference (IV, Fixed, 95% CI) | ‐0.94 [‐1.45, ‐0.43] |
| 3 Use of top‐up transfusions after 1st week Show forest plot | 1 | 34 | Odds Ratio (M‐H, Fixed, 95% CI) | 5.65 [0.25, 126.87] |
| 4 Duration of phototherapy (days) Show forest plot | 1 | 34 | Mean Difference (IV, Fixed, 95% CI) | ‐1.47 [‐2.52, ‐0.42] |
| Outcome or subgroup title | No. of studies | No. of participants | Statistical method | Effect size |
| 1 Use of exchange transfusion (≥ 1) Show forest plot | 6 | 391 | Risk Ratio (M‐H, Fixed, 95% CI) | 0.39 [0.25, 0.61] |
| 1.1 Studies without a placebo group | 4 | 301 | Risk Ratio (M‐H, Fixed, 95% CI) | 0.29 [0.18, 0.49] |
| 1.2 Placebo‐controlled studies | 2 | 90 | Risk Ratio (M‐H, Fixed, 95% CI) | 1.78 [0.49, 6.42] |
| 2 Exchange transfusions per infant Show forest plot | 6 | 391 | Mean Difference (IV, Fixed, 95% CI) | ‐0.17 [‐0.26, ‐0.08] |
| 2.1 Studies without a placebo group | 4 | 301 | Mean Difference (IV, Fixed, 95% CI) | ‐0.25 [‐0.36, ‐0.15] |
| 2.2 Placebo‐controlled studies | 2 | 90 | Mean Difference (IV, Fixed, 95% CI) | 0.05 [‐0.12, 0.22] |
| 3 Use of top‐up transfusion in 1st week Show forest plot | 4 | 296 | Risk Ratio (M‐H, Fixed, 95% CI) | 0.91 [0.48, 1.74] |
| 4 Top‐up transfusions in 1st week per infant Show forest plot | 3 | 180 | Mean Difference (IV, Fixed, 95% CI) | ‐0.01 [‐0.35, 0.33] |
| 5 Use of top‐up transfusion after 1st week Show forest plot | 4 | 240 | Risk Ratio (M‐H, Fixed, 95% CI) | 1.18 [0.81, 1.71] |
| 6 Top‐up transfusions after 1st week per infant Show forest plot | 2 | 90 | Mean Difference (IV, Fixed, 95% CI) | ‐0.03 [‐0.20, 0.13] |
| 7 Maximum total serum bilirubin (µmol/L) Show forest plot | 4 | 296 | Mean Difference (IV, Fixed, 95% CI) | ‐26.81 [‐35.97, ‐17.65] |
| 7.1 Studies without a placebo group | 2 | 206 | Mean Difference (IV, Fixed, 95% CI) | ‐30.33 [‐39.83, ‐20.82] |
| 7.2 Placebo‐controlled studies | 2 | 90 | Mean Difference (IV, Fixed, 95% CI) | 19.47 [‐15.00, 53.94] |
| 8 Duration of phototherapy (days) Show forest plot | 6 | 391 | Mean Difference (IV, Fixed, 95% CI) | ‐1.20 [‐1.38, ‐1.01] |
| 8.1 Studies without a placebo group | 4 | 301 | Mean Difference (IV, Fixed, 95% CI) | ‐1.25 [‐1.44, ‐1.06] |
| 8.2 Placebo‐controlled studies | 2 | 90 | Mean Difference (IV, Fixed, 95% CI) | 0.18 [‐0.75, 1.12] |
| 9 Duration of hospitalization (days) Show forest plot | 5 | 330 | Mean Difference (IV, Fixed, 95% CI) | ‐1.33 [‐1.59, ‐1.07] |
| 9.1 Studies without a placebo group | 3 | 240 | Mean Difference (IV, Fixed, 95% CI) | ‐1.37 [‐1.63, ‐1.10] |
| 9.2 Placebo‐controlled studies | 2 | 90 | Mean Difference (IV, Fixed, 95% CI) | ‐0.32 [‐1.69, 1.05] |