Tambahan kalsium dan fosforus kepada susu ibu untuk bayi lahir pramatang
Referencias
References to studies included in this review
References to studies excluded from this review
References to studies awaiting assessment
Additional references
References to other published versions of this review
Characteristics of studies
Characteristics of included studies [ordered by study ID]
| Methods | Parallel randomised controlled trial | |
| Participants | Number of babies: 40 Gestational age (mean (SD)): intervention: 33.3 (1.7); control: 33.3 (1.8) Inclusion criteria: gestational age < 37 weeks and birth weight < 2500 grams; medically stable and breastfed only Exclusion criteria: "Neonates with TPN and being nil per oral (NPO) for more than one week, receiving medications interfering with vitamin D metabolism (anticonvulsants, diuretics, corticosteroids etc.), those with sepsis syndrome, significant respiratory, neurologic, renal, genetic, cardiovascular, hepatic or gastrointestinal diseases as well as neonates whose mothers had osteomalacia, diabetes, parathyroid gland disease and renal disorders were excluded from the study” (Subjects and Methods, p.636) Setting: Valie‐e‐Asr Hospital of Zanjan City, in Iran Timing: December 2010‐June 2011 | |
| Interventions | Intervention: calcium 45 mg/kg/d and phosphorus 24 mg/kg/d supplement (in addition to breast milk and vitamin D) (n = 20) vs Control: breast milk and Vitamin D only (n = 20) | |
| Outcomes | Prespecified outcomes: ‐ Serum calcium, phosphorus and alkaline phosphatase levels ‐ measured every 2 weeks ‐ Growth parameters (weight, height, head circumference) ‐ measured every 2 weeks ‐ Osteopenia ‐ assessed by wrist X‐ray at end of study | |
| Notes | Funding: not stated Intention‐to‐treat analysis: yes | |
| Risk of bias | ||
| Bias | Authors' judgement | Support for judgement |
| Random sequence generation (selection bias) | Unclear risk | "Randomly divided into two groups" (p.636) |
| Allocation concealment (selection bias) | Unclear risk | This was not stated |
| Blinding of participants and personnel (performance bias) | Unclear risk | Clinician: "All neonates received supplements and/or vitamin D at the ages of 10 days to 6 weeks by mothers under the supervision of a qualified person who did not have any role in data analysis" (p.636) Although they did not have a role in data analysis, this does not mean that they were blinded |
| Blinding of outcome assessment (detection bias) | Low risk | Outcome assessor was not aware of the study "At the 6th week, an x‐ray of left wrist + physical exam was done by an expert and a pediatrician without being informed about the research project" (p.636) |
| Incomplete outcome data (attrition bias) | Low risk | No loss to follow‐up was reported |
| Selective reporting (reporting bias) | Low risk | All outcomes specified were reported |
| Other bias | Low risk | Groups were similar at baseline |
Characteristics of excluded studies [ordered by study ID]
| Study | Reason for exclusion |
| Published in abstract form only, with no clinical results available (data lost) | |
| Both intervention and control groups received supplementation | |
| No randomisation to unsupplemented control group | |
| Supplementation with calcium, phosphate and protein. This study is included in the review on multi‐component fortification (Brown 2016) | |
| Mineral supplementation was provided in the form of multi‐component fortifier or premature formula. This study is included in the multi‐component fortification review (Brown 2016) | |
| Comparision of unsupplemented human milk vs human milk supplemented with calcium and with calcium and phosphorus. Concerns about the randomisation process and disparity between control and treatment groups | |
| Intervention performed on preterm infants at discharge from hospital | |
| Supplementation of human milk with a multi‐component fortifier vs supplementation with phosphate alone. This study is included in the review on multi‐component fortification (Brown 2016) | |
| No prespecified clinical outcomes. All outcomes biochemical | |
| No prespecified clinical outcomes. Outcomes biochemical (urinary calcium and phosphate losses) | |
| Not randomised | |
| Not randomised |
Characteristics of studies awaiting assessment [ordered by study ID]
| Methods | Not known |
| Participants | Not known |
| Interventions | Not known |
| Outcomes | Not known |
| Notes |
| Methods | "Randomized controlled trial" |
| Participants | 37 preterm infants with birth weight < 1500 g or gestational age < 34 weeks |
| Interventions | Two different doses of calcium (75 vs 230 mg/kg/d) and phosphorus (50 vs 110 mg/kg/d) were prescribed; laboratory and sonographic data were then documented and evaluated |
| Outcomes | Nephrocalcinosis |
| Notes | Unclear if this study meets inclusion criteria for this review. Study authors are being contacted |
Data and analyses
| Outcome or subgroup title | No. of studies | No. of participants | Statistical method | Effect size |
| 1 Weight (g) Show forest plot | 1 | Mean Difference (IV, Fixed, 95% CI) | Subtotals only | |
| Analysis 1.1  Comparison 1 Calcium supplementation versus no calcium supplementation, Outcome 1 Weight (g). | ||||
| 1.1 Weight at 2 weeks | 1 | 40 | Mean Difference (IV, Fixed, 95% CI) | 52.5 [‐155.44, 260.44] |
| 1.2 Weight at 4 weeks | 1 | 40 | Mean Difference (IV, Fixed, 95% CI) | 60.00 [‐151.39, 271.39] |
| 1.3 Weight at 6 weeks | 1 | 40 | Mean Difference (IV, Fixed, 95% CI) | 138.5 [‐82.16, 359.16] |
| 2 Length (cm) Show forest plot | 1 | Mean Difference (IV, Fixed, 95% CI) | Subtotals only | |
| Analysis 1.2  Comparison 1 Calcium supplementation versus no calcium supplementation, Outcome 2 Length (cm). | ||||
| 2.1 Length at 2 weeks | 1 | 40 | Mean Difference (IV, Fixed, 95% CI) | 0.34 [‐1.36, 2.04] |
| 2.2 Length at 4 weeks | 1 | 40 | Mean Difference (IV, Fixed, 95% CI) | 0.47 [‐1.20, 2.14] |
| 2.3 Length at 6 weeks | 1 | 40 | Mean Difference (IV, Fixed, 95% CI) | 0.77 [‐0.93, 2.47] |
| 3 Head circumference (cm) Show forest plot | 1 | Mean Difference (IV, Fixed, 95% CI) | Subtotals only | |
| Analysis 1.3  Comparison 1 Calcium supplementation versus no calcium supplementation, Outcome 3 Head circumference (cm). | ||||
| 3.1 Head circumference at 2 weeks | 1 | 40 | Mean Difference (IV, Fixed, 95% CI) | 0.19 [‐0.42, 0.80] |
| 3.2 Head circumference at 4 weeks | 1 | 40 | Mean Difference (IV, Fixed, 95% CI) | 0.22 [‐0.39, 0.83] |
| 3.3 Head circumference at 6 weeks | 1 | 40 | Mean Difference (IV, Fixed, 95% CI) | 0.33 [‐0.30, 0.96] |
| 4 Serum alkaline phosphatase Show forest plot | 1 | Mean Difference (IV, Fixed, 95% CI) | Subtotals only | |
| Analysis 1.4  Comparison 1 Calcium supplementation versus no calcium supplementation, Outcome 4 Serum alkaline phosphatase. | ||||
| 4.1 Serum ALP at 2 weeks | 1 | 40 | Mean Difference (IV, Fixed, 95% CI) | ‐36.35 [‐91.14, 18.44] |
| 4.2 Serum ALP at 4 weeks | 1 | 40 | Mean Difference (IV, Fixed, 95% CI) | ‐34.90 [‐81.23, 11.43] |
| 4.3 Serum ALP at 6 weeks | 1 | 40 | Mean Difference (IV, Fixed, 95% CI) | ‐56.85 [‐101.27, ‐12.43] |
| 5 Osteopenia Show forest plot | 1 | 40 | Risk Ratio (M‐H, Fixed, 95% CI) | 0.62 [0.33, 1.15] |
| Analysis 1.5  Comparison 1 Calcium supplementation versus no calcium supplementation, Outcome 5 Osteopenia. | ||||

Study flow diagram (2016).
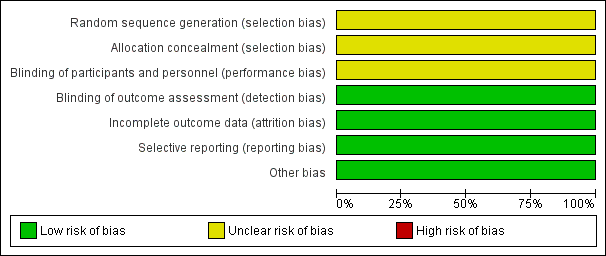
Risk of bias graph: review authors' judgements about each risk of bias item presented as percentages across all included studies.

Risk of bias summary: review authors' judgements about each risk of bias item for each included study.
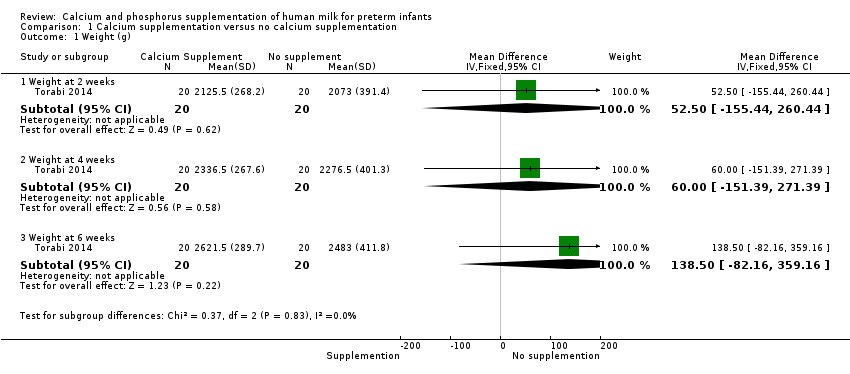
Comparison 1 Calcium supplementation versus no calcium supplementation, Outcome 1 Weight (g).

Comparison 1 Calcium supplementation versus no calcium supplementation, Outcome 2 Length (cm).

Comparison 1 Calcium supplementation versus no calcium supplementation, Outcome 3 Head circumference (cm).

Comparison 1 Calcium supplementation versus no calcium supplementation, Outcome 4 Serum alkaline phosphatase.

Comparison 1 Calcium supplementation versus no calcium supplementation, Outcome 5 Osteopenia.
| Calcium supplementation compared with no calcium supplementation for preterm infants | ||||||
| Patient or population: preterm hospitalised infants | ||||||
| Outcomes | Anticipated absolute effects* (95% CI) | Relative effect | Number of participants | Quality of the evidence | Comments | |
| Risk with no calcium/phosphorus supplementation | Risk with calcium/phosphorus supplementation | |||||
| Weight (g) ‐ weight at 6 weeks | Mean weight (g) ‐ weight at 6 weeks was 2483 g | MD 138.5 g higher | ‐ | 40 | ⊕⊕⊝⊝ | |
| Length (cm) ‐ length at 6 weeks | Mean length (cm) ‐ length at 6 weeks was 47.04 cm | MD 0.77 cm higher | ‐ | 40 | ⊕⊕⊝⊝ | |
| Head circumference (cm) ‐ head circumference at 6 weeks | Mean head circumference (cm) ‐ head circumference at 6 weeks was 34.31 cm | MD 0.33 cm higher | ‐ | 40 | ⊕⊕⊝⊝ | |
| Bone fracture (neonatal) ‐ not measured | ‐ | ‐ | ‐ | ‐ | ‐ | This was not a prespecified outcome; included study did not report this outcome |
| Growth (childhood/adulthood) ‐ not measured | ‐ | ‐ | ‐ | ‐ | ‐ | Included study provided no follow‐up into childhood |
| Bone mineral density (infant/childhood/adulthood) ‐ not measured | ‐ | ‐ | ‐ | ‐ | ‐ | Included study provided no follow‐up into childhood |
| Fracture (childhood/adulthood) ‐ not measured | ‐ | ‐ | ‐ | ‐ | ‐ | Included study provided no follow‐up into childhood |
| *Risk in the intervention group (and its 95% confidence interval) is based on assumed risk in the comparison group and the relative effect of the intervention (and its 95% CI) | ||||||
| GRADE Working Group grades of evidence | ||||||
| aRisk of bias: insufficient evidence to judge methods of randomisation, allocation concealment or blinding of personnel ‐ downgraded one level bImprecision: wide confidence intervals and data from a single small study ‐ downgraded one level cImprecision: evidence from a single small study ‐ downgraded one level | ||||||
| Outcome or subgroup title | No. of studies | No. of participants | Statistical method | Effect size |
| 1 Weight (g) Show forest plot | 1 | Mean Difference (IV, Fixed, 95% CI) | Subtotals only | |
| 1.1 Weight at 2 weeks | 1 | 40 | Mean Difference (IV, Fixed, 95% CI) | 52.5 [‐155.44, 260.44] |
| 1.2 Weight at 4 weeks | 1 | 40 | Mean Difference (IV, Fixed, 95% CI) | 60.00 [‐151.39, 271.39] |
| 1.3 Weight at 6 weeks | 1 | 40 | Mean Difference (IV, Fixed, 95% CI) | 138.5 [‐82.16, 359.16] |
| 2 Length (cm) Show forest plot | 1 | Mean Difference (IV, Fixed, 95% CI) | Subtotals only | |
| 2.1 Length at 2 weeks | 1 | 40 | Mean Difference (IV, Fixed, 95% CI) | 0.34 [‐1.36, 2.04] |
| 2.2 Length at 4 weeks | 1 | 40 | Mean Difference (IV, Fixed, 95% CI) | 0.47 [‐1.20, 2.14] |
| 2.3 Length at 6 weeks | 1 | 40 | Mean Difference (IV, Fixed, 95% CI) | 0.77 [‐0.93, 2.47] |
| 3 Head circumference (cm) Show forest plot | 1 | Mean Difference (IV, Fixed, 95% CI) | Subtotals only | |
| 3.1 Head circumference at 2 weeks | 1 | 40 | Mean Difference (IV, Fixed, 95% CI) | 0.19 [‐0.42, 0.80] |
| 3.2 Head circumference at 4 weeks | 1 | 40 | Mean Difference (IV, Fixed, 95% CI) | 0.22 [‐0.39, 0.83] |
| 3.3 Head circumference at 6 weeks | 1 | 40 | Mean Difference (IV, Fixed, 95% CI) | 0.33 [‐0.30, 0.96] |
| 4 Serum alkaline phosphatase Show forest plot | 1 | Mean Difference (IV, Fixed, 95% CI) | Subtotals only | |
| 4.1 Serum ALP at 2 weeks | 1 | 40 | Mean Difference (IV, Fixed, 95% CI) | ‐36.35 [‐91.14, 18.44] |
| 4.2 Serum ALP at 4 weeks | 1 | 40 | Mean Difference (IV, Fixed, 95% CI) | ‐34.90 [‐81.23, 11.43] |
| 4.3 Serum ALP at 6 weeks | 1 | 40 | Mean Difference (IV, Fixed, 95% CI) | ‐56.85 [‐101.27, ‐12.43] |
| 5 Osteopenia Show forest plot | 1 | 40 | Risk Ratio (M‐H, Fixed, 95% CI) | 0.62 [0.33, 1.15] |