Leche materna con suplemento de calcio y fósforo para lactantes prematuros
Información
- DOI:
- https://doi.org/10.1002/14651858.CD003310.pub2Copiar DOI

- Base de datos:
-
- Cochrane Database of Systematic Reviews
- Versión publicada:
-
- 26 febrero 2017see what's new
- Tipo:
-
- Intervention
- Etapa:
-
- Review
- Grupo Editorial Cochrane:
-
Grupo Cochrane de Neonatología
- Copyright:
-
- Copyright © 2017 The Cochrane Collaboration. Published by John Wiley & Sons, Ltd.
Cifras del artículo
Altmetric:
Citado por:
Autores
Contributions of authors
Jane Harding was an author of the original version of this review. She contributed to the update, interpreted results and provided feedback on versions throughout the process.
Julie Brown was responsible for preparation of drafts of the updated review in 2016. She conducted study selection and data extraction and double‐checked data entry.
Jess Wilson conducted study selection and data extraction and double‐checked data entry.
Sources of support
Internal sources
-
National Women's Hospital, Auckland, New Zealand.
-
University of Auckland, Auckland, New Zealand.
External sources
-
Eunice Kennedy Shriver National Institute of Child Health and Human Development, National Institutes of Health, Department of Health and Human Services, USA.
Editorial support of the Cochrane Neonatal Review Group has been Federally funded by the Eunice Kennedy Shriver National Institute of Child Health and Human Development, National Institutes of Health, Department of Health and Human Services, USA, under Contract No. HHSN275201600005C
-
National Institute for Health Research, UK.
Editorial support for Cochrane Neonatal has been funded by a UK National Institute of Health Research Grant (NIHR) Cochrane Programme Grant (13/89/12). The views expressed in this publication are those of the review authors and are not necessarily those of the NHS, the NIHR or the UK Department of Health
Declarations of interest
None known.
Acknowledgements
We would like to acknowledge the contributions of Carl Kuschel and Vazhkudai S Kumaran to the first version of this review in 2001 (Kuschel 1998).
Version history
| Published | Title | Stage | Authors | Version |
| 2017 Feb 26 | Calcium and phosphorus supplementation of human milk for preterm infants | Review | Jane E Harding, Jess Wilson, Julie Brown | |
| 2001 Oct 23 | Calcium and phosphorus supplementation of human milk for preterm infants | Review | Carl A Kuschel, Jane E Harding, Vazhkudai S Kumaran | |
Differences between protocol and review
We have updated the text of this review to reflect new methods of reporting for Cochrane reviews and have included the GRADE assessment and summary of findings Table for the main comparison. We have expanded methodological aspects of the review as per standard Cochrane Neonatal Review Group procedure.
Keywords
MeSH
Medical Subject Headings (MeSH) Keywords
Medical Subject Headings Check Words
Humans; Infant, Newborn;
PICO

Study flow diagram (2016).
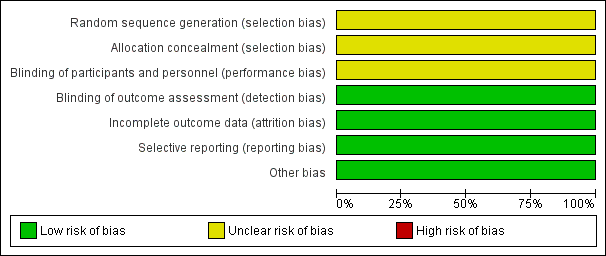
Risk of bias graph: review authors' judgements about each risk of bias item presented as percentages across all included studies.

Risk of bias summary: review authors' judgements about each risk of bias item for each included study.
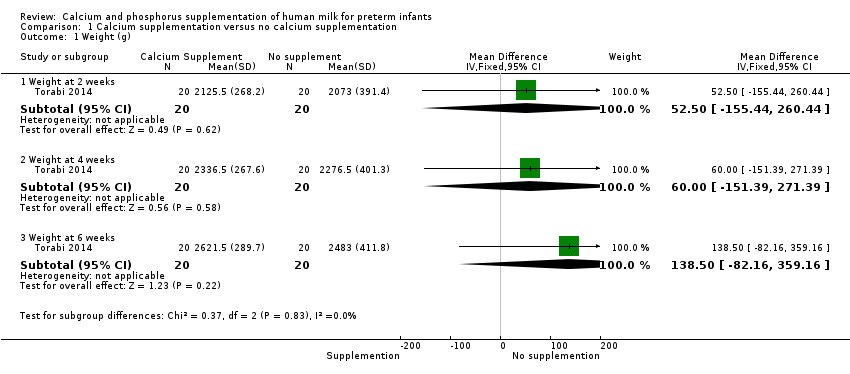
Comparison 1 Calcium supplementation versus no calcium supplementation, Outcome 1 Weight (g).

Comparison 1 Calcium supplementation versus no calcium supplementation, Outcome 2 Length (cm).

Comparison 1 Calcium supplementation versus no calcium supplementation, Outcome 3 Head circumference (cm).

Comparison 1 Calcium supplementation versus no calcium supplementation, Outcome 4 Serum alkaline phosphatase.

Comparison 1 Calcium supplementation versus no calcium supplementation, Outcome 5 Osteopenia.
| Calcium supplementation compared with no calcium supplementation for preterm infants | ||||||
| Patient or population: preterm hospitalised infants | ||||||
| Outcomes | Anticipated absolute effects* (95% CI) | Relative effect | Number of participants | Quality of the evidence | Comments | |
| Risk with no calcium/phosphorus supplementation | Risk with calcium/phosphorus supplementation | |||||
| Weight (g) ‐ weight at 6 weeks | Mean weight (g) ‐ weight at 6 weeks was 2483 g | MD 138.5 g higher | ‐ | 40 | ⊕⊕⊝⊝ | |
| Length (cm) ‐ length at 6 weeks | Mean length (cm) ‐ length at 6 weeks was 47.04 cm | MD 0.77 cm higher | ‐ | 40 | ⊕⊕⊝⊝ | |
| Head circumference (cm) ‐ head circumference at 6 weeks | Mean head circumference (cm) ‐ head circumference at 6 weeks was 34.31 cm | MD 0.33 cm higher | ‐ | 40 | ⊕⊕⊝⊝ | |
| Bone fracture (neonatal) ‐ not measured | ‐ | ‐ | ‐ | ‐ | ‐ | This was not a prespecified outcome; included study did not report this outcome |
| Growth (childhood/adulthood) ‐ not measured | ‐ | ‐ | ‐ | ‐ | ‐ | Included study provided no follow‐up into childhood |
| Bone mineral density (infant/childhood/adulthood) ‐ not measured | ‐ | ‐ | ‐ | ‐ | ‐ | Included study provided no follow‐up into childhood |
| Fracture (childhood/adulthood) ‐ not measured | ‐ | ‐ | ‐ | ‐ | ‐ | Included study provided no follow‐up into childhood |
| *Risk in the intervention group (and its 95% confidence interval) is based on assumed risk in the comparison group and the relative effect of the intervention (and its 95% CI) | ||||||
| GRADE Working Group grades of evidence | ||||||
| aRisk of bias: insufficient evidence to judge methods of randomisation, allocation concealment or blinding of personnel ‐ downgraded one level bImprecision: wide confidence intervals and data from a single small study ‐ downgraded one level cImprecision: evidence from a single small study ‐ downgraded one level | ||||||
| Outcome or subgroup title | No. of studies | No. of participants | Statistical method | Effect size |
| 1 Weight (g) Show forest plot | 1 | Mean Difference (IV, Fixed, 95% CI) | Subtotals only | |
| 1.1 Weight at 2 weeks | 1 | 40 | Mean Difference (IV, Fixed, 95% CI) | 52.5 [‐155.44, 260.44] |
| 1.2 Weight at 4 weeks | 1 | 40 | Mean Difference (IV, Fixed, 95% CI) | 60.00 [‐151.39, 271.39] |
| 1.3 Weight at 6 weeks | 1 | 40 | Mean Difference (IV, Fixed, 95% CI) | 138.5 [‐82.16, 359.16] |
| 2 Length (cm) Show forest plot | 1 | Mean Difference (IV, Fixed, 95% CI) | Subtotals only | |
| 2.1 Length at 2 weeks | 1 | 40 | Mean Difference (IV, Fixed, 95% CI) | 0.34 [‐1.36, 2.04] |
| 2.2 Length at 4 weeks | 1 | 40 | Mean Difference (IV, Fixed, 95% CI) | 0.47 [‐1.20, 2.14] |
| 2.3 Length at 6 weeks | 1 | 40 | Mean Difference (IV, Fixed, 95% CI) | 0.77 [‐0.93, 2.47] |
| 3 Head circumference (cm) Show forest plot | 1 | Mean Difference (IV, Fixed, 95% CI) | Subtotals only | |
| 3.1 Head circumference at 2 weeks | 1 | 40 | Mean Difference (IV, Fixed, 95% CI) | 0.19 [‐0.42, 0.80] |
| 3.2 Head circumference at 4 weeks | 1 | 40 | Mean Difference (IV, Fixed, 95% CI) | 0.22 [‐0.39, 0.83] |
| 3.3 Head circumference at 6 weeks | 1 | 40 | Mean Difference (IV, Fixed, 95% CI) | 0.33 [‐0.30, 0.96] |
| 4 Serum alkaline phosphatase Show forest plot | 1 | Mean Difference (IV, Fixed, 95% CI) | Subtotals only | |
| 4.1 Serum ALP at 2 weeks | 1 | 40 | Mean Difference (IV, Fixed, 95% CI) | ‐36.35 [‐91.14, 18.44] |
| 4.2 Serum ALP at 4 weeks | 1 | 40 | Mean Difference (IV, Fixed, 95% CI) | ‐34.90 [‐81.23, 11.43] |
| 4.3 Serum ALP at 6 weeks | 1 | 40 | Mean Difference (IV, Fixed, 95% CI) | ‐56.85 [‐101.27, ‐12.43] |
| 5 Osteopenia Show forest plot | 1 | 40 | Risk Ratio (M‐H, Fixed, 95% CI) | 0.62 [0.33, 1.15] |