早産児に対する母乳のカルシウムおよびリン補充
アブストラクト
背景
早産児は、骨におけるカルシウムとリンの貯蔵量が少ない状態で生まれる。早期産の母乳はカルシウムとリンが不十分で、早産児の十分な成長の推定必要量を満たしていない。母乳へのカルシウムとリンの補充は、早産児の成長と発達を改善する可能性がある。
目的
母乳へのカルシウムとリンの補充は、重大な有害作用をもたらすことなく、早産児の成長と骨代謝を改善するのかについて評価すること。
検索戦略
Cochrane Neonatal Review Groupの標準的な検索方法でCochrane Central Register of Controlled Trials (CENTRAL、2016年、第3号)を、PubMedでMEDLINE(1966年から2016年4月14日まで)を検索し、Embase(1980年から2016年4月14日まで)、およびCumulative Index to Nursing and Allied Health Literature(CINAHL、1982年から2016年4月14日まで)も検索した。また、臨床試験データベース(2016年5月11日)、および検索で得たランダム化比較試験や準ランダム化試験に関する論文の文献リストも検索した。
選択基準
入院中の早産児を対象に、母乳へのカルシウムやリンの補充と非補充を比較したランダム化および準ランダム化試験を適格とし、本レビューで選択した。
データ収集と分析
2名のレビュー著者(JB、JW)がそれぞれデータを抽出し、Cochrane Neonatal Review Groupの標準的な方法で試験の質を評価した。リスク比(RR)として二値データを、平均差(MD)として連続データを、95%信頼区間(CI)を付して報告した。Grading of Recommendations Assessment, Development and Evaluation(GRADE)法を用いてエビデンスの質を評価した。
主な結果
本稿は、適格な試験がなかった2001年のレビューの最新版である。乳児40例を対象とした1件の試験が本レビューの選択基準を満たした。GRADE基準に基づき、エビデンスの質は低いと判断したが、バイアスのリスク(ランダム化の方法、割りつけの隠蔽化(コンシールメント)、ブラインド化(盲検化)に関する報告が不十分)や不正確性(信頼区間が広い、単一の小規模試験のデータ)によるためである。新生児の成長アウトカム(体重、身長、頭囲)について、報告されたいずれかの時点で(生後2、4、6週)、カルシウムおよびリンの補充と非補充の差を示すエビデンスはみられなかった。生後6週時点では、カルシウム/リンの補充群で血清アルカリホスファターゼ濃度が低下した(MD ‐56.85 IU/L、95% CI ‐101.27 ~ ‐12.43、1件のランダム化比較試験(RCT)、n = 乳児40例)。治験責任医師は、12~ 8カ月時点の成長に関するデータ、新生児の骨折、栄養不耐性、授乳、本レビューで事前に定めたいずれかの小児期アウトカム(骨折・成長・神経発達アウトカム)を提示していなかった。
著者の結論
入院中の早産児40例のみを対象に、母乳へのカルシウムやリンの補充と非補充を比較した1件の小規模試験を同定した。我々は、エビデンスの質が低いと判断した。また、成長や骨折など臨床的に重要なアウトカムについて、両群間の差を示すエビデンスはみられなかった。生後6週時点で、補充群の血清アルカリホスファターゼ濃度が低下したが、臨床的に重要ではないと考えられる。入院中の早産児において、母乳にカルシウムやリンを補充する際の利益や有害性について判断するには、エビデンスが不十分であると結論づける。本介入に関するさらなる試験の実施は有益ではないと考えられる。多成分を含む強化母乳が使われるようになり、カルシウムやリンのみを母乳に補充することはもはや一般的ではない。異なるミネラル組成の多成分強化について、臨床的に重要なアウトカムに対する影響を、新生児期やその後の幼児期に評価する試験を将来的に検討すべきである。
PICO
一般語訳
母乳へのカルシウムやリンの補充は早産児の成長と発達を改善するのか?
論点
乳児の出生が早すぎる場合(早産)、健康な骨や成長に必要とされるカルシウムやリンなどのミネラル貯蔵量が非常に少ない。母乳には、早産児に十分なミネラルが含まれていないことがある。
重要である理由
カルシウムやリンは、健康な骨や正常な成長と発達に必要である。早産で生まれた乳児でカルシウムやリンの摂取量が不十分な場合、骨折や発育不全を起こすことがある。
どのようなエビデンスが得られたか?
2016年4月にエビデンスを探し、乳児40例を対象とした1件のランダム化比較試験を同定した。治験責任医師は、カルシウムやリンを補充した乳児では、アルカリホスファターゼ濃度(骨の成長に関わる酵素)がわずかに低下したと報告していた。カルシウムやリンを補充した母乳を与えた乳児と非補充の乳児では、成長に差がないことがわかった。1件の小規模試験によるエビデンスであり、エビデンスの質は低いと判断した。研究者らは、これらの乳児について小児期までの追跡調査に関する報告はしていない。
意味するもの
早産児に対するカルシウムやリンの補充が骨や成長に利益をもたらすかどうか判断するには、エビデンスが不十分である。現在では、早産児の成長と発達を促進するさまざまなミネラルなど多くの成分を含む強化母乳が利用されるようになり、カルシウムとリンのみの補充はほとんど行われていない。そのため、多成分強化母乳に含まれるミネラル補充の早産児に対する影響を調べ、臨床的に重要なアウトカムを小児期まで評価する試験を、将来的に実施することを提案する。
Authors' conclusions
Summary of findings
| Calcium supplementation compared with no calcium supplementation for preterm infants | ||||||
| Patient or population: preterm hospitalised infants | ||||||
| Outcomes | Anticipated absolute effects* (95% CI) | Relative effect | Number of participants | Quality of the evidence | Comments | |
| Risk with no calcium/phosphorus supplementation | Risk with calcium/phosphorus supplementation | |||||
| Weight (g) ‐ weight at 6 weeks | Mean weight (g) ‐ weight at 6 weeks was 2483 g | MD 138.5 g higher | ‐ | 40 | ⊕⊕⊝⊝ | |
| Length (cm) ‐ length at 6 weeks | Mean length (cm) ‐ length at 6 weeks was 47.04 cm | MD 0.77 cm higher | ‐ | 40 | ⊕⊕⊝⊝ | |
| Head circumference (cm) ‐ head circumference at 6 weeks | Mean head circumference (cm) ‐ head circumference at 6 weeks was 34.31 cm | MD 0.33 cm higher | ‐ | 40 | ⊕⊕⊝⊝ | |
| Bone fracture (neonatal) ‐ not measured | ‐ | ‐ | ‐ | ‐ | ‐ | This was not a prespecified outcome; included study did not report this outcome |
| Growth (childhood/adulthood) ‐ not measured | ‐ | ‐ | ‐ | ‐ | ‐ | Included study provided no follow‐up into childhood |
| Bone mineral density (infant/childhood/adulthood) ‐ not measured | ‐ | ‐ | ‐ | ‐ | ‐ | Included study provided no follow‐up into childhood |
| Fracture (childhood/adulthood) ‐ not measured | ‐ | ‐ | ‐ | ‐ | ‐ | Included study provided no follow‐up into childhood |
| *Risk in the intervention group (and its 95% confidence interval) is based on assumed risk in the comparison group and the relative effect of the intervention (and its 95% CI) | ||||||
| GRADE Working Group grades of evidence | ||||||
| aRisk of bias: insufficient evidence to judge methods of randomisation, allocation concealment or blinding of personnel ‐ downgraded one level bImprecision: wide confidence intervals and data from a single small study ‐ downgraded one level cImprecision: evidence from a single small study ‐ downgraded one level | ||||||
Background
Description of the condition
Human milk is the recommended nutritional source for full‐term infants during at least the first six months of postnatal life (http://www.who.int/nutrition/topics/exclusive_breastfeeding/en/). For this group, breast milk supplies adequate substrate to meet the infant's nutritional demands and provides the infant with other substances that may afford some physiological advantage (e.g. immunoglobulins, gastrointestinal hormones). Breastfeeding may also contribute to maternal‐infant bonding.
Description of the intervention
Human milk is recommended for enteral feeding of all preterm infants (American Academy of Pediatrics 2014). However, human milk provides insufficient quantities of various nutrients, including calcium and phosphorus, to meet the estimated needs of these infants.
Two‐thirds of fetal body mineral content is acquired during the third trimester of pregnancy (Itani 1991). Therefore, preterm infants are born with low skeletal stores of calcium and phosphorus and require very high quantities of these minerals if they are to attain adequate postnatal skeletal growth. These requirements may not be met by feeding human milk alone (Bhatia 2007). Observational studies have shown that preterm infants fed human milk alone may have hypophosphataemia (Atkinson 1983), radiological evidence of poor bone mineralisation (Atkinson 1983; Rowe 1979) and elevated alkaline phosphatase activity (Rowe 1984), and all of this may be associated with fractures and lower than expected growth rates (Bhatia 2007). Furthermore, early bone mineral content may predict peak bone mineral density and therefore lifelong fracture risk (Winsloe 2009). On the other hand, calcium and phosphorus supplements can be associated with adverse effects such as hypercalcaemia, feed intolerance (Bozzetti 2009) and elevated calcium, all of which are associated with nephrocalcinosis and renal damage in preterm infants (Schell‐Feith 2010). Concern about development of metabolic bone disease might lead parents and clinicians to give formula rather than persisting with expressing and giving breast milk when such a decision is considered. For this reason, provision of supplements might influence the likelihood of continued breastfeeding and hence developmental outcomes.
How the intervention might work
Supplementation of human milk with calcium and phosphorus may improve body mineral stores and maintain or improve bone metabolism while improving growth.
Why it is important to do this review
We conducted this review to establish whether supplementing human milk with calcium and phosphorus leads to improved bone metabolism and growth outcomes for preterm infants.
Objectives
To determine whether addition of calcium and phosphorus supplements to human milk leads to improved growth and bone metabolism of preterm infants without significant adverse effects.
Methods
Criteria for considering studies for this review
Types of studies
We included randomised controlled trials (RCTs) and quasi‐RCTs, including cluster‐randomised trials but not cross‐over trials (inappropriate study design). We included both published and unpublished studies and studies published only as abstracts, if assessment of study quality was possible and if they fulfilled other criteria for inclusion.
Types of participants
Preterm infants (< 37 weeks gestational age) receiving care within a hospital setting.
Types of interventions
Randomised controlled trials comparing human milk supplemented with calcium and/or phosphorus versus unsupplemented human milk.
Types of outcome measures
Primary outcomes
-
Growth to discharge (including weight and z score, length and z score, head circumference and z score)
-
Growth at 12 to 18 months (including weight and z score, length and z score, head circumference and z score)
-
Bone metabolism (including serum alkaline phosphatase (ALP), bone mineral content (BMC), timing defined by the trialist)
Secondary outcomes
Neonatal outcomes
-
Incidence of fractures
-
Adverse effects including significant hypercalcaemia (> 3 mmol/L), nephrocalcinosis, impaired renal function
-
Feed intolerance
-
Breastfeeding (any) at discharge
Childhood/adulthood outcomes
-
Incidence of fracture
-
Growth (weight, height, age determined by trialist)
-
Neurodevelopmental outcomes (as defined by trialist)
Search methods for identification of studies
Electronic searches
We used the criteria and standard methods of Cochrane and the Cochrane Neonatal Review Group (see the Cochrane Neonatal Group search strategy for specialized register).
We conducted a comprehensive search that included the Cochrane Central Register of Controlled Trials (CENTRAL; 2016, Issue 3) in the Cochrane Library; MEDLINE via PubMed (1966 to 14 April 2016); Embase (1980 to 14 April 2016); and the Cumulative Index to Nursing and Allied Health Literature (CINAHL; 1982 to 14 April 2016) using the following search terms: (calcium OR phosphorus) AND (human milk OR breast milk OR breastmilk OR milk), plus database‐specific limiters for RCTs and neonates (see Appendix 1 for full search strategies for each database). We applied no language restrictions.
We searched (11 May 2016) clinical trials registries for ongoing and recently completed trials (clinicaltrials.gov; the World Health Organization’s International Trials Registry and Platform www.whoint/ictrp/search/en/;the ISRCTN Registry).
Searching other resources
We searched the reference lists of included trials to identify unpublished and ongoing research.
Data collection and analysis
Selection of studies
For the 2016 update of this review, two review authors (JB, JW) independently examined titles and abstracts identified through electronic and manual searches, retrieved full texts of potential trials for inclusion, examined full texts for eligibility and made decisions on study inclusion or exclusion. A third review author (JH) was available to resolve disagreements.
Data extraction and management
We developed and piloted a data extraction form before gathering data. When available, we extracted data including reference source, eligibility criteria, study methods, participant characteristics, intervention and control details and clinical outcomes. Two review authors independently extracted data (JB. JW) and resolved disagreements by discussion or by referral to a third review author (JH). One review author (JW) entered data into Cochrane statistical software (Review Manager 2013) and a second review author (JB) checked the entered data for accuracy.
Assessment of risk of bias in included studies
Two review authors (JB, JW) independently assessed risk of bias for each study by using the criteria outlined in the Cochrane Handbook for Systematic Reviews of Interventions (Higgins 2011). We encountered no disagreements.
Random sequence generation (checking for possible selection bias)
For each included study, we described the method used to generate the allocation sequence in sufficient detail to allow assessment of whether it should produce comparable groups.
We assessed the method as having:
-
low risk of bias (any truly random process, e.g. random number table, computer random number generator);
-
high risk of bias (any non‐random process, e.g. odd or even date of birth, hospital or clinic record number); or
-
unclear risk of bias.
Allocation concealment (checking for possible selection bias)
For each included study, we described the method used to conceal allocation to interventions before assignment and assessed whether intervention allocation could have been foreseen in advance of or during recruitment, or changed after assignment.
We assessed the method as having:
-
low risk of bias (e.g. telephone or central randomisation, consecutively numbered sealed opaque envelopes);
-
high risk of bias (open random allocation, e.g. unsealed or non‐opaque envelopes, alternation, date of birth); or
-
unclear risk of bias.
Blinding of participants and personnel (checking for possible performance bias)
For each included study, we described the methods used, if any, to blind study participants and personnel from which intervention a participant received. We considered studies to be at low risk of bias if they were blinded, or if we judged that lack of blinding would be unlikely to affect results.
We assessed the method as having:
-
low, high or unclear risk of bias for participants; and
-
low, high or unclear risk of bias for personnel.
Blinding of outcome assessment (checking for possible detection bias)
For each included study, we described the methods used, if any, to blind outcome assessors from knowledge of which intervention a participant received.
We assessed methods used to blind outcome assessment as having low, high or unclear risk of bias.
Incomplete outcome data (checking for possible attrition bias due to the quantity, nature and handling of incomplete outcome data)
For each included study, we described completeness of data including attrition and exclusions from analysis. We stated whether attrition and exclusions were reported as well as numbers included in the analysis at each stage (compared with total randomised participants), reasons for attrition or exclusion when reported and whether missing data were balanced across groups or were related to outcomes. When sufficient information was reported, we planned to re‐include missing data in the analyses undertaken.
We assessed the method as having:
-
low risk of bias (e.g. no missing outcome data, missing outcome data balanced across groups);
-
high risk of bias (e.g. numbers or reasons for missing data imbalanced across groups, 'as treated' analysis done with substantial departure of intervention received from intervention assigned at randomisation); or
-
unclear risk of bias.
Other sources of bias
We described for each included study any important concerns that we had about other possible sources of bias.
We assessed whether each study was free of other problems that could put it at risk of bias and assigned each study as folllows.
-
Low risk of other bias.
-
High risk of other bias.
-
Unclear risk of other bias.
Measures of treatment effect
We used the numbers of events in control and intervention groups of each study to calculate risk ratios (RRs) with 95% confidence intervals (CIs) for dichotomous data. We calculated mean differences (MDs) between treatment groups when outcomes were measured in the same way for continuous data, reported with 95% CIs.
Unit of analysis issues
The unit of analysis was the infant.
Dealing with missing data
When possible, we carried out analyses on an intention‐to‐treat basis for all outcomes and analysed all participants in the treatment group to which they were randomised, regardless of the actual treatment received. We attempted to contact the original investigators to request missing data, when possible. When high levels of attrition were observed (> 20%), we had planned to conduct sensitivity analyses to assess the influence of attrition bias. However, with only one included trial, we were unable to assess the effect of attrition bias.
Assessment of heterogeneity
We considered whether clinical and methodological characteristics of included studies were sufficiently similar for meta‐analysis to provide a clinically meaningful summary. We had planned to do this by assessing statistical heterogeneity using the Chi2 test and the I2 statistic. We classified heterogeneity as none (< 25%), low (25% to 49%), moderate (50% to 74%) or high (> 75%). We were going to consider an I2 measurement greater than 50% and a low P value (< 0.10) in the Chi2 test for heterogeneity to indicate substantial heterogeneity (Higgins 2011). We planned that when we detected substantial heterogeneity, we would explore possible explanations by performing sensitivity/subgroup analyses. However, with only one included trial, we were unable to make an assessment of heterogeneity.
Assessment of reporting biases
Reporting biases arise when dissemination of research findings is influenced by the nature and direction of results. Some types of reporting bias including publication bias, multiple publication bias and language bias reduce the likelihood that all studies eligible for a review will be retrieved. We aimed to conduct a comprehensive search for eligible studies and looked for duplication of data. We planned to assess publication bias by visually inspecting a funnel plot, if we had identified enough studies (≥ 10 trials). However, with only one included trial, we were unable to assess publication bias.
Two review authors examined the methods of each study for prespecified outcomes. If all prespecified outcomes were reported in the results, we assigned the study low risk of bias. If any prespecified outcomes were not reported in the results, we considered the study to carry higher risk of bias. If review authors uncovered reporting bias that could, in their opinion, introduce serious bias, we had planned to conduct a sensitivity analysis to determine the effects of including and excluding these studies in the analysis.
Data synthesis
We evaluated studies for bias, as above, and planned to restrict meta‐analysis if bias would be compounded. We had planned to use a fixed‐effect meta‐analysis to combine data when it was reasonable to assume that studies were estimating the same underlying treatment effects. If evidence of clinical heterogeneity was sufficient to suggest that underlying treatment effects differed between trials, or if we detected substantial statistical heterogeneity, we had planned to undertake sensitivity and subgroup analyses to attempt to explain the heterogeneity. However, with only one included trial, we were unable to perform any meta‐analyses.
Quality of evidence
We used the Grading of Recommendations Assessment, Development and Evaluation (GRADE) approach, as outlined in the GRADE Handbook (Guyatt 2011a; Guyatt 2011b; Guyatt 2011c; Guyatt 2011d; Guyatt 2011e; Schünemann 2013), to assess the quality of evidence for the following (clinically relevant) outcomes.
-
Growth at discharge.
-
Bone mineral density (neonatal).
-
Fractures (neonatal).
-
Growth (childhood).
-
Bone mineral density (childhood).
-
Fractures (childhood).
Two review authors (JB, JW) independently assessed the quality of the evidence for each outcome above. We considered evidence from RCTs as high quality but downgraded the evidence one level for serious (or two levels for very serious) limitations based on the following: design (risk of bias), consistency across studies, directness of the evidence, precision of estimates and presence of publication bias. We used the GradePro GDT Guideline Development Tool to create a ‘Summary of findings’ table to report the quality of the evidence.
The GRADE approach results in an assessment of the quality of a body of evidence based on four grades.
-
High: We are very confident that the true effect lies close to the estimate of effect.
-
Moderate: We are moderately confident in the effect estimate: The true effect is likely to be close to the estimate of effect but may be substantially different.
-
Low: Our confidence in the effect estimate is limited: The true effect may be substantially different from the estimate of effect.
-
Very low: We have very little confidence in the effect estimate: The true effect is likely to be substantially different from the estimate of effect.
We summarised data from selected outcomes in summary of findings Table for the main comparison.
Subgroup analysis and investigation of heterogeneity
We planned to perform subgroup analyses to assess effects of calcium supplementation alone, phosphorus supplementation alone and combined supplementation with calcium and phosphorus. Trials were insufficient for subgroup analyses.
Sensitivity analysis
For this 2016 update, we were unable to conduct sensitivity analysis owing to lack of evidence.
Results
Description of studies
Results of the search
For the 2001 review, review authors identified no included studies, excluded 11 studies (Characteristics of excluded studies) and found one study that was awaiting assessment (Characteristics of studies awaiting classification). For this 2016 update, searches yielded 808 potential studies, and we excluded 804 of these. We assessed three studies (four publications) for eligibility. We included one trial (two publications) (Torabi 2014), excluded one (Carroll 2011) and classified one as awaiting assessment (Characteristics of studies awaiting classification). See Figure 1.

Study flow diagram (2016).
Included studies
We included one trial (two publications) in this 2016 updated review (Torabi 2014).
-
Participants: Investigators randomised 40 infants born before 37 weeks gestation with birth weight below 2.5 kg.
-
Setting: The trial was conducted in Iran.
-
Interventions and comparisons: Researchers compared breast milk supplemented with calcium, phosphorus and vitamin D versus breast milk and vitamin D only.
-
Outcomes: Data showed growth to discharge, bone metabolism and osteopenia. Study authors provided no data on growth at 12 to 18 months, adverse effects, feed intolerance or breastfeeding at discharge and no data on other prespecified childhood/adulthood outcomes of this review (bone metabolism, incidence of fractures).
Excluded studies
Review authors excluded 11 studies in 2001 (Characteristics of excluded studies). We excluded one study for the 2016 update, as both intervention and control groups received supplementation (Carroll 2011).
Risk of bias in included studies
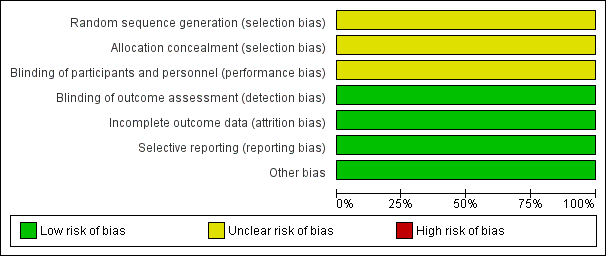
Risk of bias graph: review authors' judgements about each risk of bias item presented as percentages across all included studies.

Risk of bias summary: review authors' judgements about each risk of bias item for each included study.
Allocation
Randomisation
Torabi 2014 reported that participants were "randomly divided into two groups"; we judged this trial to have unclear risk of bias for randomisation.
Allocation concealment
We judged Torabi 2014 to have unclear risk of bias for allocation concealment owing to lack of methodological details.
Blinding
Performance bias
We judged Torabi 2014 to have unclear risk of performance bias owing to lack of methodological detail.
Detection bias
We judged Torabi 2014 to have low risk of detection bias, as outcome assessors were blinded to treatment allocation.
Incomplete outcome data
We judged Torabi 2014 to have low risk of attrition bias, as investigators identified no losses to follow‐up.
Selective reporting
Torabi 2014 reported all prespecified outcomes, and we judged the trial to have low risk of reporting bias.
Other potential sources of bias
We identified no other sources of bias.
Effects of interventions
Calcium and phosphorus supplementation versus no supplementation
Primary outcomes
Growth to discharge
Weight (grams (g))
Torabi 2014 found no evidence of a difference in weight between infants who received calcium and phosphorus supplementation and those given no supplementation at two weeks (MD 52.50 g, 95% CI ‐155.44 to 260.44; one RCT; n = 40 infants), four weeks (MD 60.00 g, 95% CI ‐151.39 to 271.39; one RCT; n = 40 infants) or six weeks (MD 138.50 g, 95% CI ‐82.16 to 359.16; one RCT; n = 40 infants) postnatal age. We judged the evidence to be of low quality and downgraded the quality for risk of bias (insufficient details to judge randomisation, allocation concealment or blinding of personnel) and imprecision (wide confidence intervals, single small trial).
Length (cm)
Torabi 2014 found no evidence of a difference in length between infants who received calcium and phosphorus supplementation and those given no supplementation at two weeks (MD 0.34 cm, 95%CI ‐1.36 to 2.04; one RCT; n = 40 infants), four weeks (MD 0.47 cm; 95%CI ‐1.20 to 2.14; one RCT; n = 40 infants) or six weeks (MD 0.77 cm, 95% CI ‐0.93 to 2.47; one RCT; n = 40 infants). We judged the evidence to be of low quality and downgraded the quality for risk of bias (insufficient details to judge randomisation, allocation concealment or blinding of personnel) and imprecision (single small trial).
Head circumference (cm)
Torabi 2014 found no evidence of a difference in head circumference between infants who received calcium and phosphorus supplementation and those given no supplementation at two weeks (MD 0.19 cm, 95%CI ‐0.42 to 0.80; one RCT; n = 40 infants), four weeks (MD 0.22 cm, 95%CI ‐0.39 to 0.83; one RCT; n = 40 infants) or six weeks (MD 0.33 cm, 95%CI ‐0.30 to 0.96; one RCT; n = 40 infants). We judged the evidence to be of low quality and downgraded the quality for risk of bias (insufficient details to judge randomisation, allocation concealment or blinding of personnel) and imprecision (single small trial).
Bone metabolism
Serum alkaline phosphatase (ALP) (IU/L)
Torabi 2014 found no evidence of a difference in ALP between infants who received calcium and phosphorus supplementation and those given no supplementation at two weeks (MD ‐36.35 IU/L, 95% CI ‐91.14 to 18.44; one RCT; n = 40 infants) or four weeks (MD ‐34.90 IU/L, 95% CI ‐81.23 to 11.43; one RCT; n = 40 infants) but found that supplementation was associated with a decrease in serum ALP levels at six weeks postnatal age (MD ‐56.85 IU/L, 95% CI ‐101.27 to ‐12.43; one RCT; n = 40 infants).
Other outcomes of interest (not prespecified)
Torabi 2014 reported osteopenia measured by wrist x‐ray at six weeks postnatal age. Data showed no evidence of a difference between infants who received calcium and phosphorus supplementation and those given no supplementation (RR 0.62, 95% CI 0.33 to 1.15; one RCT; n = 40 infants).
Researchers provided no data on growth‐related outcomes at 12 to 18 months.
Secondary outcomes
Neonatal outcomes
Researchers provided no data on incidence of fracture, adverse effects, feed intolerance or breastfeeding at discharge.
Childhood/adulthood outcomes
Incidence of fracture
Investigators provided no data for this outcome.
Neurodevelopmental outcomes
Investigators provided no data for these outcomes.
Discussion
Summary of main results
For this updated review conducted in 2016, we included one trial of 40 infants that compared supplementation with calcium and phosphorus versus no supplementation in hospitalised preterm infants. We found no evidence of a difference between infants supplemented with calcium and phosphorus and those given no supplementation for the primary outcomes of this review of growth and bone metabolism, except for a small decrease in alkaline phosphatase (ALP) concentrations at six weeks among infants who received calcium and phosphorus supplementation. Review authors considered this decrease unlikely to be of clinical significance. Evidence was based on the findings of a single small trial, which did not report long‐term outcomes for childhood and adulthood (summary of findings Table for the main comparison).
Overall completeness and applicability of evidence
High‐quality evidence is insufficient to reveal whether supplementation with calcium and phosphorus improved growth and bone health of hospitalised preterm infants. In the single trial included in this review, infants were born relatively large (mean gestation 33 weeks) and therefore were at low risk of metabolic bone disease. These findings may not be applicable to smaller and more preterm infants at greater risk of bone disease who may be more likely to benefit from supplements, if such a benefit can occur. Supplementation with calcium and phosphorus alone is no longer common practice. The Cochrane systematic review on multi‐component human milk fortification has provided evidence superseding the evidence provided in this review (Brown 2016).
Quality of the evidence
This updated review includes one trial of 40 infants. The evidence is limited by lack of methodological detail and imprecision. We were not able to make judgements about risk of bias. Evidence was based on data from a single small trial including wide confidence intervals associated with the summary treatment effect. Using GRADE criteria (GradePro GDT), we judged the evidence to be of low quality.
Potential biases in the review process
We have tried to minimise bias in the review process by having two independent review authors conduct data selection and extraction. We double‐checked the data entered. We believe that we have a conducted a systematic and thorough search of the literature using multiple electronic databases and clinical trials registries without restrictions on language, date of publication or status of publication (published or unpublished).
Agreements and disagreements with other studies or reviews
We identified no other studies or reviews reporting on comparison of calcium and phosphorus supplementation of human milk for preterm infants versus no fortification. Supplementation with calcium and phosphorus alone is no longer common practice, but calcium and phosphorus are commonly included in multi‐component human milk fortifiers that are widely used. We refer the reader to the Cochrane review titled "Multi‐nutrient fortification of human milk for preterm infants" (Brown 2016).

Study flow diagram (2016).

Risk of bias graph: review authors' judgements about each risk of bias item presented as percentages across all included studies.

Risk of bias summary: review authors' judgements about each risk of bias item for each included study.
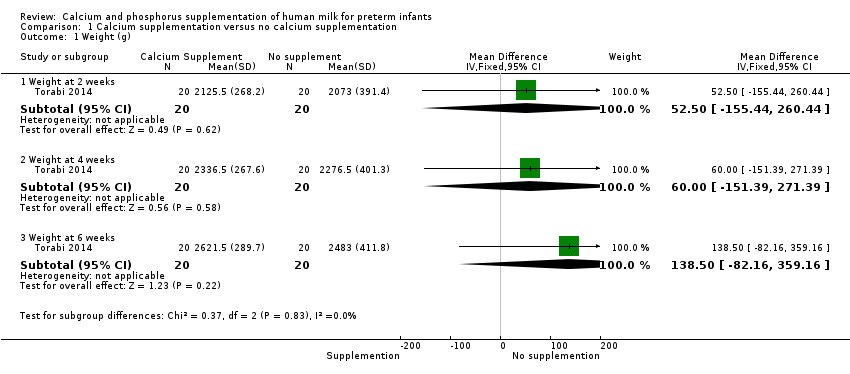
Comparison 1 Calcium supplementation versus no calcium supplementation, Outcome 1 Weight (g).

Comparison 1 Calcium supplementation versus no calcium supplementation, Outcome 2 Length (cm).

Comparison 1 Calcium supplementation versus no calcium supplementation, Outcome 3 Head circumference (cm).

Comparison 1 Calcium supplementation versus no calcium supplementation, Outcome 4 Serum alkaline phosphatase.

Comparison 1 Calcium supplementation versus no calcium supplementation, Outcome 5 Osteopenia.
| Calcium supplementation compared with no calcium supplementation for preterm infants | ||||||
| Patient or population: preterm hospitalised infants | ||||||
| Outcomes | Anticipated absolute effects* (95% CI) | Relative effect | Number of participants | Quality of the evidence | Comments | |
| Risk with no calcium/phosphorus supplementation | Risk with calcium/phosphorus supplementation | |||||
| Weight (g) ‐ weight at 6 weeks | Mean weight (g) ‐ weight at 6 weeks was 2483 g | MD 138.5 g higher | ‐ | 40 | ⊕⊕⊝⊝ | |
| Length (cm) ‐ length at 6 weeks | Mean length (cm) ‐ length at 6 weeks was 47.04 cm | MD 0.77 cm higher | ‐ | 40 | ⊕⊕⊝⊝ | |
| Head circumference (cm) ‐ head circumference at 6 weeks | Mean head circumference (cm) ‐ head circumference at 6 weeks was 34.31 cm | MD 0.33 cm higher | ‐ | 40 | ⊕⊕⊝⊝ | |
| Bone fracture (neonatal) ‐ not measured | ‐ | ‐ | ‐ | ‐ | ‐ | This was not a prespecified outcome; included study did not report this outcome |
| Growth (childhood/adulthood) ‐ not measured | ‐ | ‐ | ‐ | ‐ | ‐ | Included study provided no follow‐up into childhood |
| Bone mineral density (infant/childhood/adulthood) ‐ not measured | ‐ | ‐ | ‐ | ‐ | ‐ | Included study provided no follow‐up into childhood |
| Fracture (childhood/adulthood) ‐ not measured | ‐ | ‐ | ‐ | ‐ | ‐ | Included study provided no follow‐up into childhood |
| *Risk in the intervention group (and its 95% confidence interval) is based on assumed risk in the comparison group and the relative effect of the intervention (and its 95% CI) | ||||||
| GRADE Working Group grades of evidence | ||||||
| aRisk of bias: insufficient evidence to judge methods of randomisation, allocation concealment or blinding of personnel ‐ downgraded one level bImprecision: wide confidence intervals and data from a single small study ‐ downgraded one level cImprecision: evidence from a single small study ‐ downgraded one level | ||||||
| Outcome or subgroup title | No. of studies | No. of participants | Statistical method | Effect size |
| 1 Weight (g) Show forest plot | 1 | Mean Difference (IV, Fixed, 95% CI) | Subtotals only | |
| 1.1 Weight at 2 weeks | 1 | 40 | Mean Difference (IV, Fixed, 95% CI) | 52.5 [‐155.44, 260.44] |
| 1.2 Weight at 4 weeks | 1 | 40 | Mean Difference (IV, Fixed, 95% CI) | 60.00 [‐151.39, 271.39] |
| 1.3 Weight at 6 weeks | 1 | 40 | Mean Difference (IV, Fixed, 95% CI) | 138.5 [‐82.16, 359.16] |
| 2 Length (cm) Show forest plot | 1 | Mean Difference (IV, Fixed, 95% CI) | Subtotals only | |
| 2.1 Length at 2 weeks | 1 | 40 | Mean Difference (IV, Fixed, 95% CI) | 0.34 [‐1.36, 2.04] |
| 2.2 Length at 4 weeks | 1 | 40 | Mean Difference (IV, Fixed, 95% CI) | 0.47 [‐1.20, 2.14] |
| 2.3 Length at 6 weeks | 1 | 40 | Mean Difference (IV, Fixed, 95% CI) | 0.77 [‐0.93, 2.47] |
| 3 Head circumference (cm) Show forest plot | 1 | Mean Difference (IV, Fixed, 95% CI) | Subtotals only | |
| 3.1 Head circumference at 2 weeks | 1 | 40 | Mean Difference (IV, Fixed, 95% CI) | 0.19 [‐0.42, 0.80] |
| 3.2 Head circumference at 4 weeks | 1 | 40 | Mean Difference (IV, Fixed, 95% CI) | 0.22 [‐0.39, 0.83] |
| 3.3 Head circumference at 6 weeks | 1 | 40 | Mean Difference (IV, Fixed, 95% CI) | 0.33 [‐0.30, 0.96] |
| 4 Serum alkaline phosphatase Show forest plot | 1 | Mean Difference (IV, Fixed, 95% CI) | Subtotals only | |
| 4.1 Serum ALP at 2 weeks | 1 | 40 | Mean Difference (IV, Fixed, 95% CI) | ‐36.35 [‐91.14, 18.44] |
| 4.2 Serum ALP at 4 weeks | 1 | 40 | Mean Difference (IV, Fixed, 95% CI) | ‐34.90 [‐81.23, 11.43] |
| 4.3 Serum ALP at 6 weeks | 1 | 40 | Mean Difference (IV, Fixed, 95% CI) | ‐56.85 [‐101.27, ‐12.43] |
| 5 Osteopenia Show forest plot | 1 | 40 | Risk Ratio (M‐H, Fixed, 95% CI) | 0.62 [0.33, 1.15] |