Scolaris Content Display Scolaris Content Display

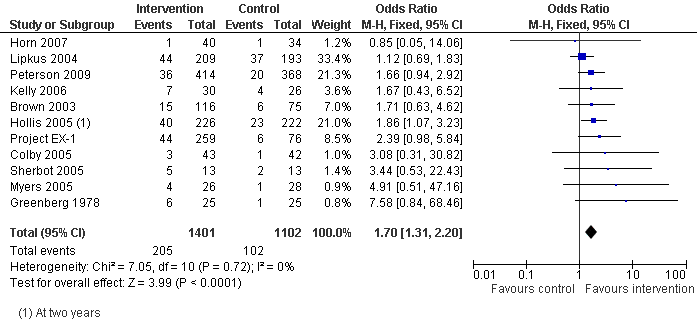
Forest plot of comparison: 3 Motivational enhancement vs brief interventions, cessation at 6 months or longer.
Figuras y tablas -
Figure 1

Forest plot of comparison: 3 Motivational enhancement vs brief interventions, cessation at 6 months or longer.

Comparison 1 Effect sizes for all studies with extractable data, Outcome 1 Subgroups by abstinence definition.
Figuras y tablas -
Analysis 1.1

Comparison 1 Effect sizes for all studies with extractable data, Outcome 1 Subgroups by abstinence definition.

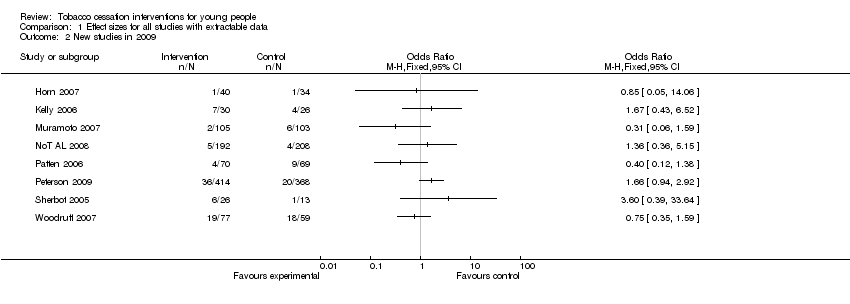
Comparison 1 Effect sizes for all studies with extractable data, Outcome 2 New studies in 2009.
Figuras y tablas -
Analysis 1.2

Comparison 1 Effect sizes for all studies with extractable data, Outcome 2 New studies in 2009.

Comparison 2 TTM vs standard care or dietary advice, Outcome 1 Cessation at 1 year.
Figuras y tablas -
Analysis 2.1

Comparison 2 TTM vs standard care or dietary advice, Outcome 1 Cessation at 1 year.

Comparison 2 TTM vs standard care or dietary advice, Outcome 2 Cessation at 2 years.
Figuras y tablas -
Analysis 2.2

Comparison 2 TTM vs standard care or dietary advice, Outcome 2 Cessation at 2 years.

Comparison 3 Motivational enhancement vs brief interventions, Outcome 1 Cessation at 6 months or longer.
Figuras y tablas -
Analysis 3.1

Comparison 3 Motivational enhancement vs brief interventions, Outcome 1 Cessation at 6 months or longer.

Comparison 3 Motivational enhancement vs brief interventions, Outcome 2 Complex interventions including Motivational Interviewing.
Figuras y tablas -
Analysis 3.2

Comparison 3 Motivational enhancement vs brief interventions, Outcome 2 Complex interventions including Motivational Interviewing.

Comparison 4 Interventions including Cognitive Behavioural Techniques, Outcome 1 Cessation at 6 months or longer.
Figuras y tablas -
Analysis 4.1

Comparison 4 Interventions including Cognitive Behavioural Techniques, Outcome 1 Cessation at 6 months or longer.

Comparison 5 NoT vs brief interventions, Outcome 1 Cessation at 6 months or longer.
Figuras y tablas -
Analysis 5.1

Comparison 5 NoT vs brief interventions, Outcome 1 Cessation at 6 months or longer.

Comparison 6 Pharmacological interventions, Outcome 1 Point prevalence abstinence at six months.
Figuras y tablas -
Analysis 6.1

Comparison 6 Pharmacological interventions, Outcome 1 Point prevalence abstinence at six months.

Comparison 7 Web‐based interventions, Outcome 1 30 day PPA at 6 months.
Figuras y tablas -
Analysis 7.1

Comparison 7 Web‐based interventions, Outcome 1 30 day PPA at 6 months.

Comparison 7 Web‐based interventions, Outcome 2 7 day ppa at 12 months.
Figuras y tablas -
Analysis 7.2

Comparison 7 Web‐based interventions, Outcome 2 7 day ppa at 12 months.

Comparison 7 Web‐based interventions, Outcome 3 30 day abstinence at 12m.
Figuras y tablas -
Analysis 7.3

Comparison 7 Web‐based interventions, Outcome 3 30 day abstinence at 12m.

Comparison 8 Complex interventions using M I, Social cognitive theory, CBT or/and TTM, Outcome 1 Biochemically verified 6 month continuous abstinence.
Figuras y tablas -
Analysis 8.1

Comparison 8 Complex interventions using M I, Social cognitive theory, CBT or/and TTM, Outcome 1 Biochemically verified 6 month continuous abstinence.

Comparison 8 Complex interventions using M I, Social cognitive theory, CBT or/and TTM, Outcome 2 6 month continuous cessation.
Figuras y tablas -
Analysis 8.2

Comparison 8 Complex interventions using M I, Social cognitive theory, CBT or/and TTM, Outcome 2 6 month continuous cessation.

Comparison 8 Complex interventions using M I, Social cognitive theory, CBT or/and TTM, Outcome 3 Cessation at 6 months, ≧ 7days ppa.
Figuras y tablas -
Analysis 8.3

Comparison 8 Complex interventions using M I, Social cognitive theory, CBT or/and TTM, Outcome 3 Cessation at 6 months, ≧ 7days ppa.

Comparison 9 Russell Standards, Outcome 1 Biochemically verified 6 month continuous abstinence.
Figuras y tablas -
Analysis 9.1

Comparison 9 Russell Standards, Outcome 1 Biochemically verified 6 month continuous abstinence.

Comparison 1. Effect sizes for all studies with extractable data

Outcome or subgroup title

No. of studies

No. of participants

Statistical method

Effect size

1 Subgroups by abstinence definition Show forest plot

23

Odds Ratio (M‐H, Fixed, 95% CI)

Totals not selected

1.1 Sustained or prolonged abstinence

4

Odds Ratio (M‐H, Fixed, 95% CI)

0.0 [0.0, 0.0]

1.2 30 day point prevalence abstinence

5

Odds Ratio (M‐H, Fixed, 95% CI)

0.0 [0.0, 0.0]

1.3 7 day point prevalence abstinence

11

Odds Ratio (M‐H, Fixed, 95% CI)

0.0 [0.0, 0.0]

1.4 Other abstinence measure

8

Odds Ratio (M‐H, Fixed, 95% CI)

0.0 [0.0, 0.0]

2 New studies in 2009 Show forest plot

8

Odds Ratio (M‐H, Fixed, 95% CI)

Totals not selected

Figuras y tablas -
Comparison 1. Effect sizes for all studies with extractable data
Comparison 2. TTM vs standard care or dietary advice

Outcome or subgroup title

No. of studies

No. of participants

Statistical method

Effect size

1 Cessation at 1 year Show forest plot

2

1537

Odds Ratio (M‐H, Fixed, 95% CI)

1.70 [1.25, 2.33]

2 Cessation at 2 years Show forest plot

2

1537

Odds Ratio (M‐H, Fixed, 95% CI)

1.38 [0.99, 1.92]

Figuras y tablas -
Comparison 2. TTM vs standard care or dietary advice
Comparison 3. Motivational enhancement vs brief interventions

Outcome or subgroup title

No. of studies

No. of participants

Statistical method

Effect size

1 Cessation at 6 months or longer Show forest plot

11

2503

Odds Ratio (M‐H, Fixed, 95% CI)

1.70 [1.31, 2.20]

2 Complex interventions including Motivational Interviewing Show forest plot

5

1419

Odds Ratio (M‐H, Fixed, 95% CI)

1.93 [1.28, 2.90]

Figuras y tablas -
Comparison 3. Motivational enhancement vs brief interventions
Comparison 4. Interventions including Cognitive Behavioural Techniques

Outcome or subgroup title

No. of studies

No. of participants

Statistical method

Effect size

1 Cessation at 6 months or longer Show forest plot

8

Odds Ratio (M‐H, Fixed, 95% CI)

Totals not selected

Figuras y tablas -
Comparison 4. Interventions including Cognitive Behavioural Techniques
Comparison 5. NoT vs brief interventions

Outcome or subgroup title

No. of studies

No. of participants

Statistical method

Effect size

1 Cessation at 6 months or longer Show forest plot

4

1073

Odds Ratio (M‐H, Fixed, 95% CI)

1.77 [1.00, 3.11]

Figuras y tablas -
Comparison 5. NoT vs brief interventions
Comparison 6. Pharmacological interventions

Outcome or subgroup title

No. of studies

No. of participants

Statistical method

Effect size

1 Point prevalence abstinence at six months Show forest plot

3

Odds Ratio (M‐H, Fixed, 95% CI)

Totals not selected

1.1 Nicotine patch + bupropion versus nicotine patch + placebo

1

Odds Ratio (M‐H, Fixed, 95% CI)

0.0 [0.0, 0.0]

1.2 Nicotine patch versus placebo

1

Odds Ratio (M‐H, Fixed, 95% CI)

0.0 [0.0, 0.0]

1.3 Nicotine gum versus placebo

1

Odds Ratio (M‐H, Fixed, 95% CI)

0.0 [0.0, 0.0]

1.4 Bupropion vs placebo

1

Odds Ratio (M‐H, Fixed, 95% CI)

0.0 [0.0, 0.0]

Figuras y tablas -
Comparison 6. Pharmacological interventions
Comparison 7. Web‐based interventions

Outcome or subgroup title

No. of studies

No. of participants

Statistical method

Effect size

1 30 day PPA at 6 months Show forest plot

1

139

Odds Ratio (M‐H, Fixed, 95% CI)

0.40 [0.12, 1.38]

2 7 day ppa at 12 months Show forest plot

2

1225

Odds Ratio (M‐H, Fixed, 95% CI)

1.30 [0.92, 1.85]

3 30 day abstinence at 12m Show forest plot

1

448

Odds Ratio (M‐H, Fixed, 95% CI)

2.04 [1.24, 3.35]

Figuras y tablas -
Comparison 7. Web‐based interventions
Comparison 8. Complex interventions using M I, Social cognitive theory, CBT or/and TTM

Outcome or subgroup title

No. of studies

No. of participants

Statistical method

Effect size

1 Biochemically verified 6 month continuous abstinence Show forest plot

2

456

Odds Ratio (M‐H, Fixed, 95% CI)

1.22 [0.76, 1.96]

2 6 month continuous cessation Show forest plot

2

836

Odds Ratio (M‐H, Fixed, 95% CI)

1.79 [1.04, 3.09]

3 Cessation at 6 months, ≧ 7days ppa Show forest plot

1

402

Odds Ratio (M‐H, Fixed, 95% CI)

1.12 [0.69, 1.83]

Figuras y tablas -
Comparison 8. Complex interventions using M I, Social cognitive theory, CBT or/and TTM
Comparison 9. Russell Standards

Outcome or subgroup title

No. of studies

No. of participants

Statistical method

Effect size

1 Biochemically verified 6 month continuous abstinence Show forest plot

2

456

Odds Ratio (M‐H, Fixed, 95% CI)

1.22 [0.76, 1.96]

Figuras y tablas -
Comparison 9. Russell Standards