Efecto del momento adecuado para el pinzamiento del cordón umbilical y otras estrategias para influir en la transfusión placentaria durante el parto prematuro en los resultados maternos y del lactante
Información
- DOI:
- https://doi.org/10.1002/14651858.CD003248.pub4Copiar DOI

- Base de datos:
-
- Cochrane Database of Systematic Reviews
- Versión publicada:
-
- 17 septiembre 2019see what's new
- Tipo:
-
- Intervention
- Etapa:
-
- Review
- Grupo Editorial Cochrane:
-
Grupo Cochrane de Embarazo y parto
- Copyright:
-
- Copyright © 2019 The Cochrane Collaboration. Published by John Wiley & Sons, Ltd.
Cifras del artículo
Altmetric:
Citado por:
Autores
Contributions of authors
For this update
Gill Gyte (GG) undertook the data extraction and data entry with assistance from Heike Rabe (HR), Jose Diaz‐Rosello (JDR) and Lelia Duley (LD). HR, JDR and LD contributed clinical knowledge and input. GG conducted the GRADE assessments and drafted the results section. Review authors assessed the studies independently. HR and LD did not assess their own studies and GG did not assess the study on which she was a co‐applicant.
For previous versions of the review
Graham Reynolds (GR) prepared the first draft of the protocol and commented on the second draft. HR commented on the first draft of the protocol and wrote the second draft.
All review authors assessed studies independently. HR did not assess her own study. HR and GR entered study data. GR wrote the 'Methodological quality of included studies' section. HR completed all other sections of the review. JDR completed the corrections to the statistics. All three review authors commented on the review and agreed on the conclusion.
For the update of this review, the process of assessing the eligible studies and extracting the data were followed in the same way as described as above. HR updated the data tables and updated the text of the review. JDR and Therese Dowswell (TD) corrected the statistics. TD and LD introduced the risk of bias tables, and revised the text of the review. All review authors agreed on the updated version of the review.
Sources of support
Internal sources
-
University of Liverpool, UK.
External sources
-
No sources of support, UK.
Declarations of interest
Heike Rabe is main author for two included studies in this review (Rabe 2000; Rabe 2011). Studies by the contact author, which may be relevant for inclusion in this review, were not assessed by herself but by the co‐authors who, in agreement with the Cochrane Pregnancy and Childbirth group, have named other experts in the field for this purpose.
Jose Diaz‐Rossello ‐ none known.
Lelia Duley has been awarded an NIHR research grant for a programme of work which includes a pilot trial of timing of cord clamping for preterm births (CORD Pilot 2018), and a prospective meta‐analysis.
Gillian Gyte was a co‐applicant on one of the included studies in this review (CORD Pilot 2018). She also has received royalties from John Wiley & Son in respect of ‘A Cochrane Pocket Handbook – Pregnancy and Childbirth' Hofmeyr GJ et al. 2008.
Acknowledgements
Diane Elbourne who undertook the first Cohrane Review on this topic (Elbourne 1995).
Therese Dowswell who provided considerable input into the 2012 publication (Rabe 2012).
Graham Reynolds for his editorial and clinical contributions to previous versions of this review.
W Oh, M McDonnell, M Nelle, S Kinmond, J Mercer, N Aladangady A Katheria and H Rabe who kindly provided additional information regarding their studies. The information about randomisation for the trials by W Oh and M Nelle was directly obtained from the authors. The review authors thank the authors for supplying the information.
Jon Dorling, Donna Winterbank‐Scott, Lambert Felix, Anna Cuthbert all provided help with data extraction of information from the studies. Aidan Tan provided very helpful translations of the three Chinese papers.
As part of the pre‐publication editorial process, this review has been commented on by five peers (an editor and four referees who are external to the editorial team) and the Group's Statistical Adviser. The authors are grateful to the following peer reviewers for their time and comments: Prof NJ Shaw, Liverpool Women's Hospital; Andrew D Weeks, University of Liverpool; Jamie B Warren MD MPH, Oregon Health & Science University; Serena Xodo MD, Clinic of Obstetrics and Gynecology, Academic Hospital of Udine, Udine (Italy).
This project was supported by the National Institute for Health Research, via Cochrane Infrastructure funding to Cochrane Pregnancy and Childbirth. The views and opinions expressed therein are those of the authors and do not necessarily reflect those of the Systematic Reviews Programme, NIHR, NHS or the Department of Health.
Version history
| Published | Title | Stage | Authors | Version |
| 2019 Sep 17 | Effect of timing of umbilical cord clamping and other strategies to influence placental transfusion at preterm birth on maternal and infant outcomes | Review | Heike Rabe, Gillian ML Gyte, José L Díaz‐Rossello, Lelia Duley | |
| 2012 Aug 15 | Effect of timing of umbilical cord clamping and other strategies to influence placental transfusion at preterm birth on maternal and infant outcomes | Review | Heike Rabe, Jose Luis Diaz‐Rossello, Lelia Duley, Therese Dowswell | |
| 2004 Oct 18 | Early versus delayed umbilical cord clamping in preterm infants | Review | Heike Rabe, Graham J Reynolds, Jose Luis Diaz‐Rosello | |
| 2001 Jul 23 | Delayed cord clamping in preterm infants | Protocol | Heike Rabe, Graham J Reynolds | |
Differences between protocol and review
We set up separate comparisons for delayed cord clamping and umbilical cord milking.
HR, LD and GG modified the list of outcomes choosing seven primary outcomes to assist the assessment using GRADE software.
We removed the following outcomes: Requirement for resuscitation; Apgar scores at 1,5 and 10 minutes; Use of exogenous surfactant; Days of oxygen dependency; Oxygen dependency at 28 days; Treatment for hyperbilirubinaemia with blood exchange transfusion; Blood counts at six and 12 months of age (haemoglobin and ferritin); Maternal death.
We added the following new outcomes: Apgar < eight at five minutes: Duration of respiratory support; Home oxygen; Mean arterial blood pressure in early hours after birth; Hydrocephalis; Neurosensory disability at two to three years; Cerebral Palsy; Late sepsis; Treatment for retinopathy of prematurity; Severe visual impairment; Length of infant stay in NICU; Maternal blood transfusion; Maternal postpartum infection; Breastfeeding initiation; Fully breastfeeding or mixed breast & formula feeding at discharge.
We changed the following outcomes: 'Maternal blood loss greater than 500 mL' to 'Maternal blood loss of 500 mL or greater'; ‘Hypothermia’ to ‘Temperature < 36o within 1 hour of birth’; ‘Oxygen dependency at 36 weeks to CLD with this definition; Chronic lung disease (Northway Stage two, three or four) to CLD (oxygen dependency at 36 weeks corrected for gestational age)’; ‘Volume (colloid, sodium chloride 0.9%, blood transfusion) administration for hypotension during the first 24 hours of life’ to ‘Blood transfusion in infant’; 'Maternal bonding to infant' to 'Bonding'
Due to lack of data for previously intended subgroups (Position of the baby relative to the placenta; Whether the mother had oxytocin before cord clamping; With or without milking of the cord; Mode of birth), we chose to look at gestation and type of intervention only.
We updated the methods including the use of GRADE as recommended by Cochrane's MECIR standards and incorporated four new 'Summary of findings' tables.
We updated the Plain language summary to reflect the Cochrane Pregnancy and Childbirth Group's guidance on this.
We searched ClinicalTrials.gov and the WHO International Clinical Trials Registry Platform (ICTRP) for unpublished, planned and ongoing trial reports.
Notes
The title of the previously published protocol was 'Early versus delayed cord clamping in preterm infants'.
Keywords
MeSH
Medical Subject Headings (MeSH) Keywords
Medical Subject Headings Check Words
Female; Humans; Infant, Newborn; Pregnancy;
PICO
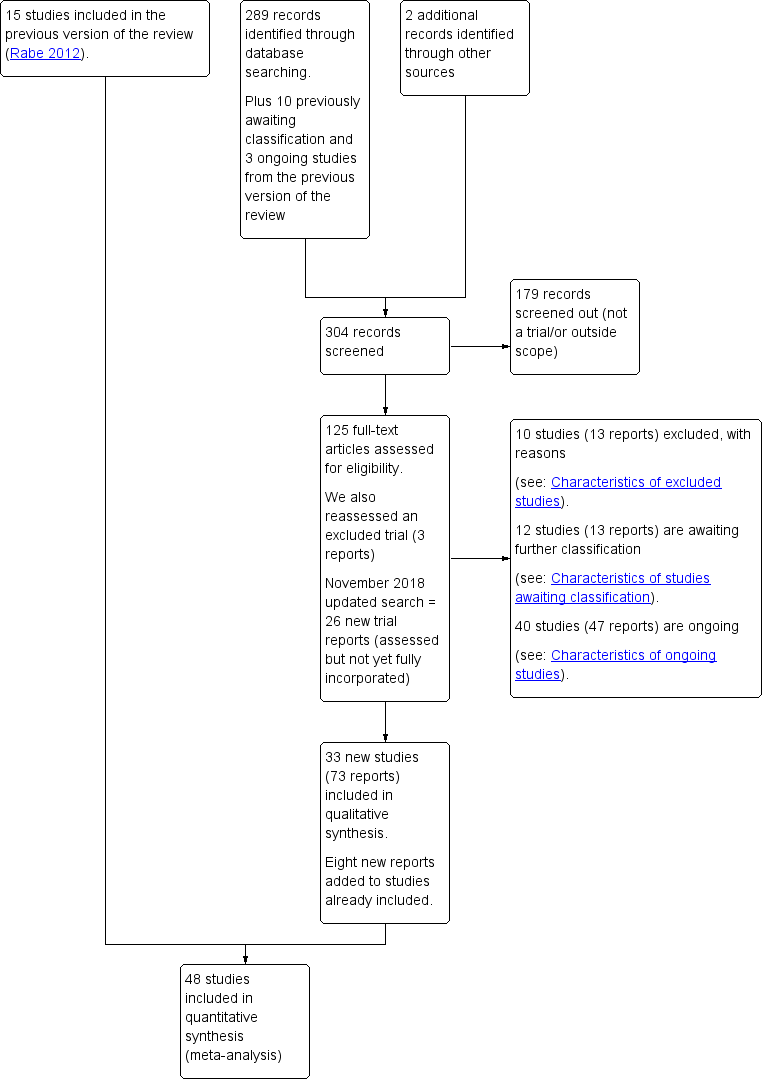
Study flow diagram.
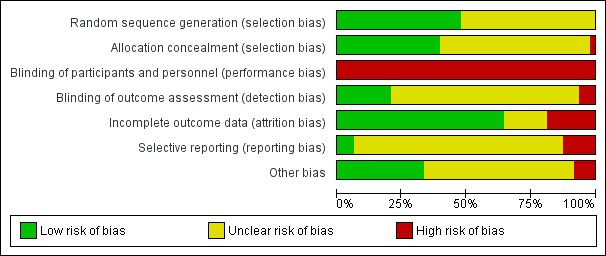
'Risk of bias' graph: review authors' judgements about each risk of bias item presented as percentages across all included studies.

'Risk of bias' summary: review authors' judgements about each risk of bias item for each included study.

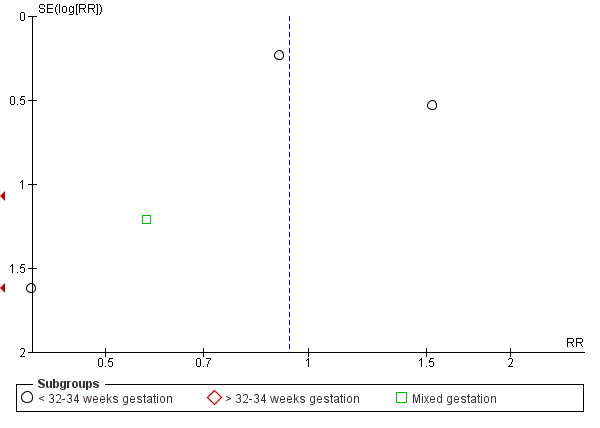
Funnel plot of comparison: 1 DCC with immediate neonatal care after cord clamping vs ECC (subgroup analysis by gestation), outcome: 1.1 Death of baby (up to discharge).
Funnel plot of comparison: 1 DCC with immediate neonatal care after cord clamping vs ECC (subgroup analysis by gestation), outcome: 1.3 Severe intraventricular haemorrhage (IVH grades 3, 4).
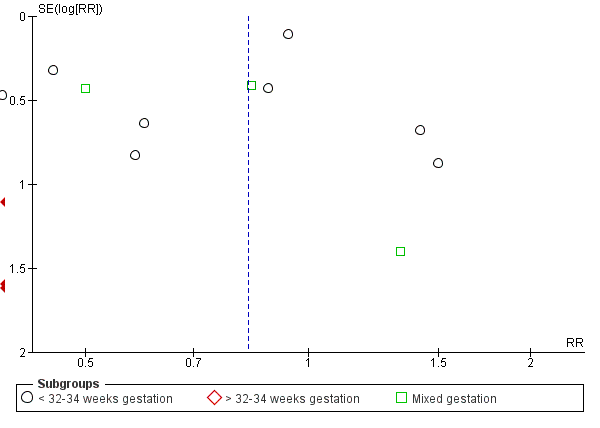
Funnel plot of comparison: 1 DCC with immediate neonatal care after cord clamping vs ECC (subgroup analysis by gestation), outcome: 1.4 Intraventricular haemorrhage (IVH, all grades).
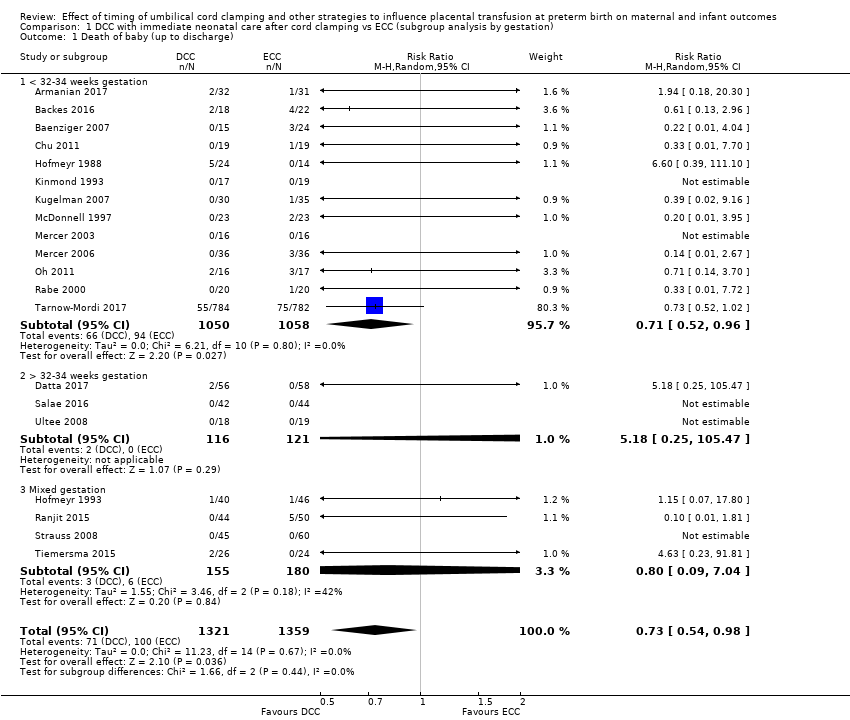
Comparison 1 DCC with immediate neonatal care after cord clamping vs ECC (subgroup analysis by gestation), Outcome 1 Death of baby (up to discharge).

Comparison 1 DCC with immediate neonatal care after cord clamping vs ECC (subgroup analysis by gestation), Outcome 3 Severe intraventricular haemorrhage (IVH grades 3, 4).

Comparison 1 DCC with immediate neonatal care after cord clamping vs ECC (subgroup analysis by gestation), Outcome 4 Intraventricular haemorrhage (IVH, all grades).

Comparison 1 DCC with immediate neonatal care after cord clamping vs ECC (subgroup analysis by gestation), Outcome 5 Periventricular leukomalacia (PVL).

Comparison 1 DCC with immediate neonatal care after cord clamping vs ECC (subgroup analysis by gestation), Outcome 6 Chronic lung disease (CLD) ‐ oxygen supplement at 36 weeks (corrected for gestation).

Comparison 1 DCC with immediate neonatal care after cord clamping vs ECC (subgroup analysis by gestation), Outcome 7 Maternal blood loss of 500 mL or greater.
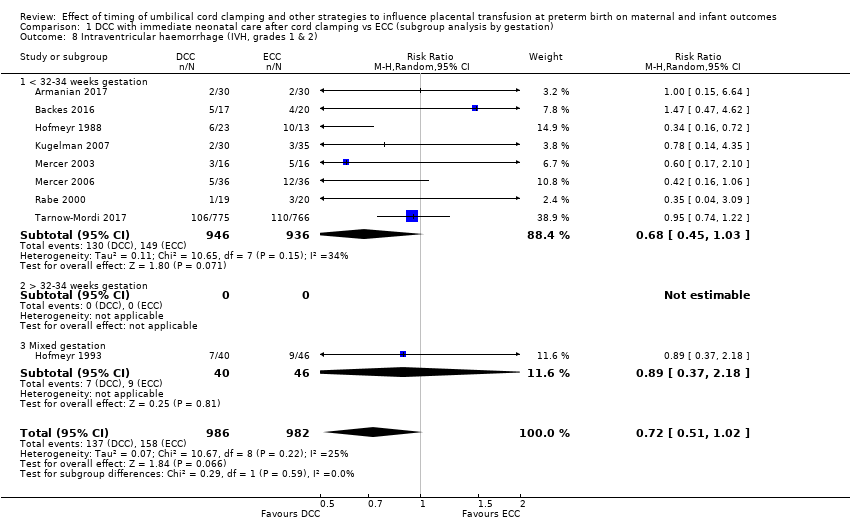
Comparison 1 DCC with immediate neonatal care after cord clamping vs ECC (subgroup analysis by gestation), Outcome 8 Intraventricular haemorrhage (IVH, grades 1 & 2).

Comparison 1 DCC with immediate neonatal care after cord clamping vs ECC (subgroup analysis by gestation), Outcome 9 Necrotising enterocolitis (NEC) confirmed by X‐ray or laparotomy).
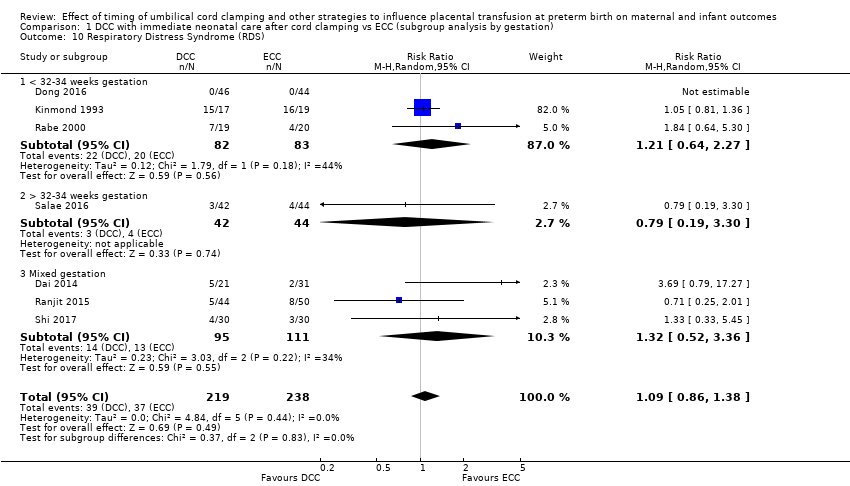
Comparison 1 DCC with immediate neonatal care after cord clamping vs ECC (subgroup analysis by gestation), Outcome 10 Respiratory Distress Syndrome (RDS).

Comparison 1 DCC with immediate neonatal care after cord clamping vs ECC (subgroup analysis by gestation), Outcome 11 Respiratory support (ventilator or CPAP).
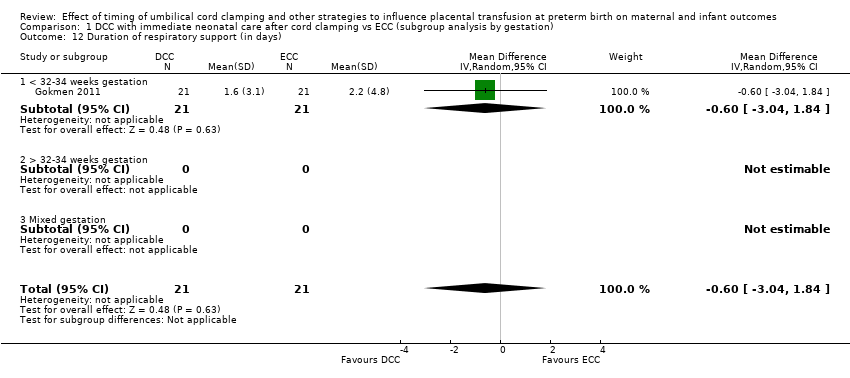
Comparison 1 DCC with immediate neonatal care after cord clamping vs ECC (subgroup analysis by gestation), Outcome 12 Duration of respiratory support (in days).
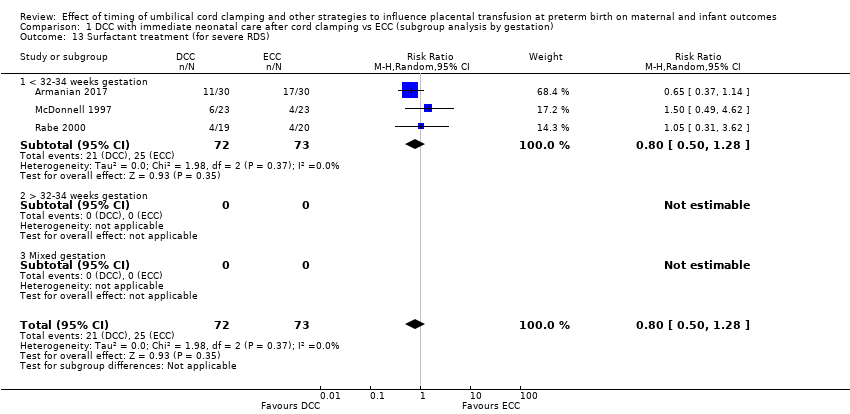
Comparison 1 DCC with immediate neonatal care after cord clamping vs ECC (subgroup analysis by gestation), Outcome 13 Surfactant treatment (for severe RDS).

Comparison 1 DCC with immediate neonatal care after cord clamping vs ECC (subgroup analysis by gestation), Outcome 14 Treatment for Patent Ductus Arteriosus (PDA) (medical and/or surgical).

Comparison 1 DCC with immediate neonatal care after cord clamping vs ECC (subgroup analysis by gestation), Outcome 15 Treatment for Retinopathy of Prematurity (RoP).
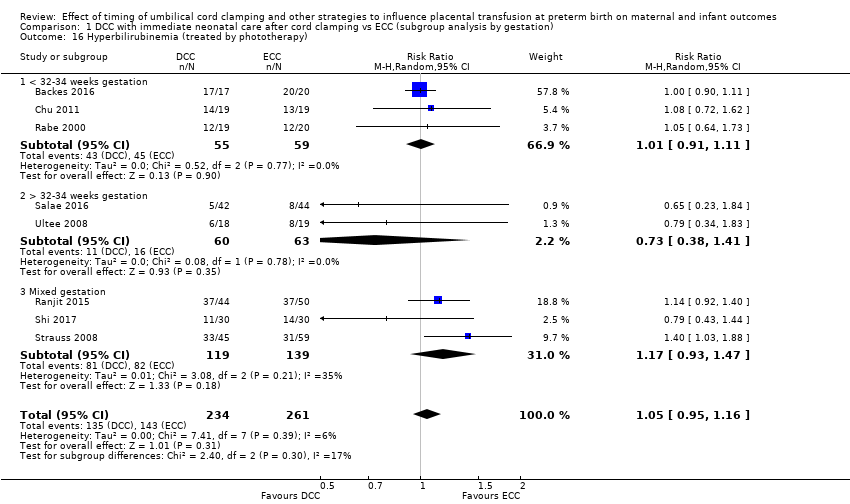
Comparison 1 DCC with immediate neonatal care after cord clamping vs ECC (subgroup analysis by gestation), Outcome 16 Hyperbilirubinemia (treated by phototherapy).
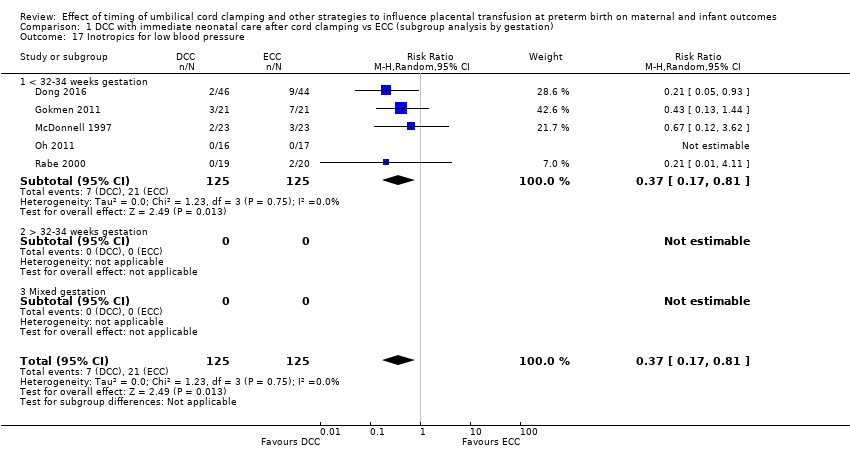
Comparison 1 DCC with immediate neonatal care after cord clamping vs ECC (subgroup analysis by gestation), Outcome 17 Inotropics for low blood pressure.
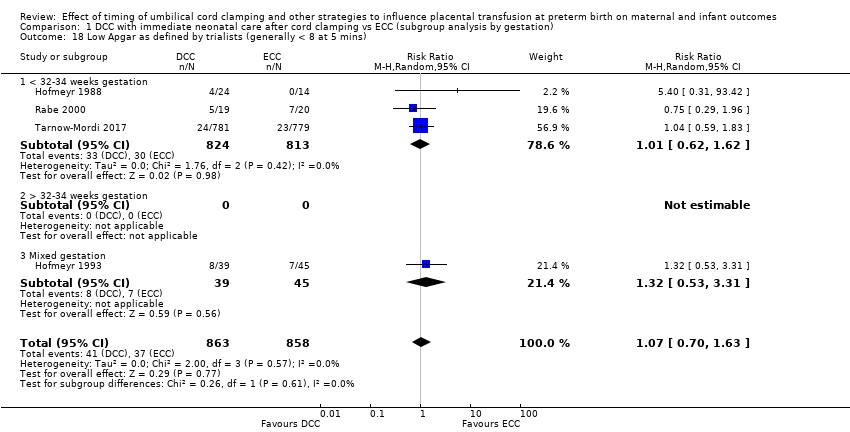
Comparison 1 DCC with immediate neonatal care after cord clamping vs ECC (subgroup analysis by gestation), Outcome 18 Low Apgar as defined by trialists (generally < 8 at 5 mins).
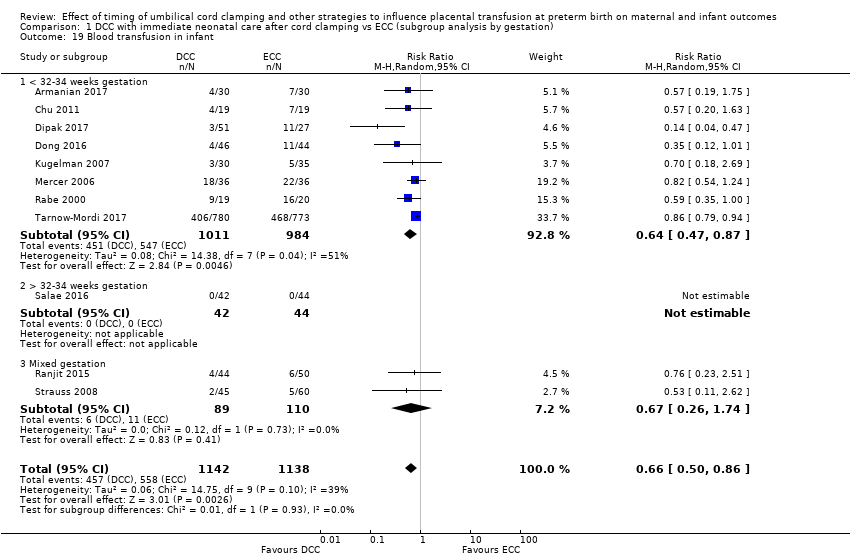
Comparison 1 DCC with immediate neonatal care after cord clamping vs ECC (subgroup analysis by gestation), Outcome 19 Blood transfusion in infant.
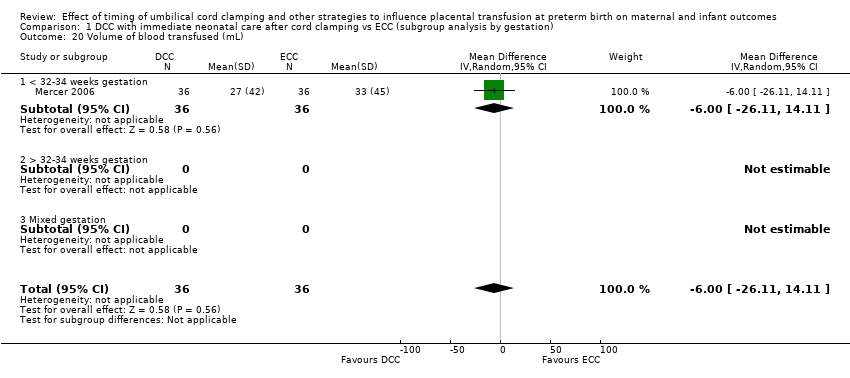
Comparison 1 DCC with immediate neonatal care after cord clamping vs ECC (subgroup analysis by gestation), Outcome 20 Volume of blood transfused (mL).
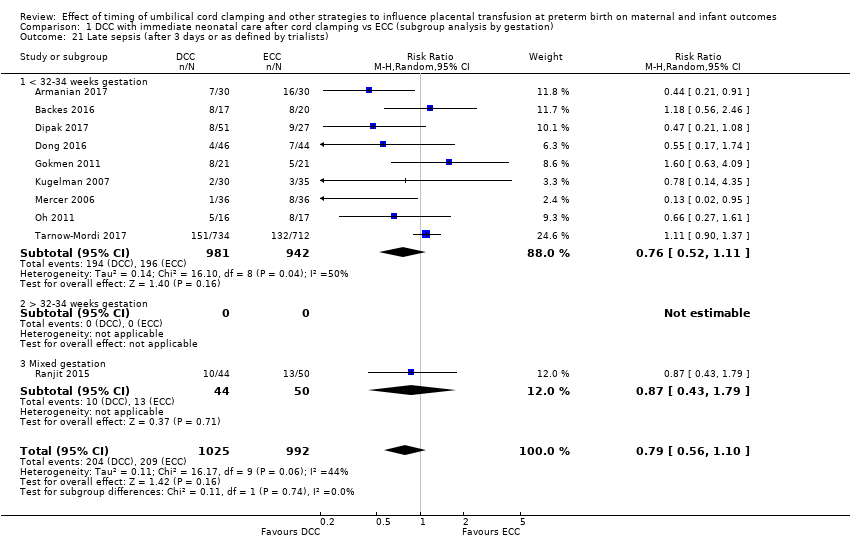
Comparison 1 DCC with immediate neonatal care after cord clamping vs ECC (subgroup analysis by gestation), Outcome 21 Late sepsis (after 3 days or as defined by trialists).
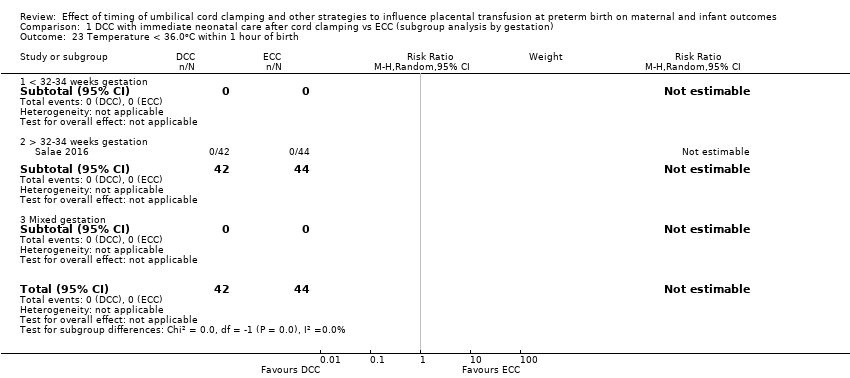
Comparison 1 DCC with immediate neonatal care after cord clamping vs ECC (subgroup analysis by gestation), Outcome 23 Temperature < 36.0oC within 1 hour of birth.

Comparison 1 DCC with immediate neonatal care after cord clamping vs ECC (subgroup analysis by gestation), Outcome 24 Hb within 1st 24 hour of birth (g/dL).

Comparison 1 DCC with immediate neonatal care after cord clamping vs ECC (subgroup analysis by gestation), Outcome 25 Mean arterial blood pressure in early hours after birth (mm Hg).

Comparison 1 DCC with immediate neonatal care after cord clamping vs ECC (subgroup analysis by gestation), Outcome 27 Home oxygen.

Comparison 1 DCC with immediate neonatal care after cord clamping vs ECC (subgroup analysis by gestation), Outcome 33 Blood transfusion for mother.

Comparison 1 DCC with immediate neonatal care after cord clamping vs ECC (subgroup analysis by gestation), Outcome 39 Fully breastfed or mixed feeding at infant discharge.
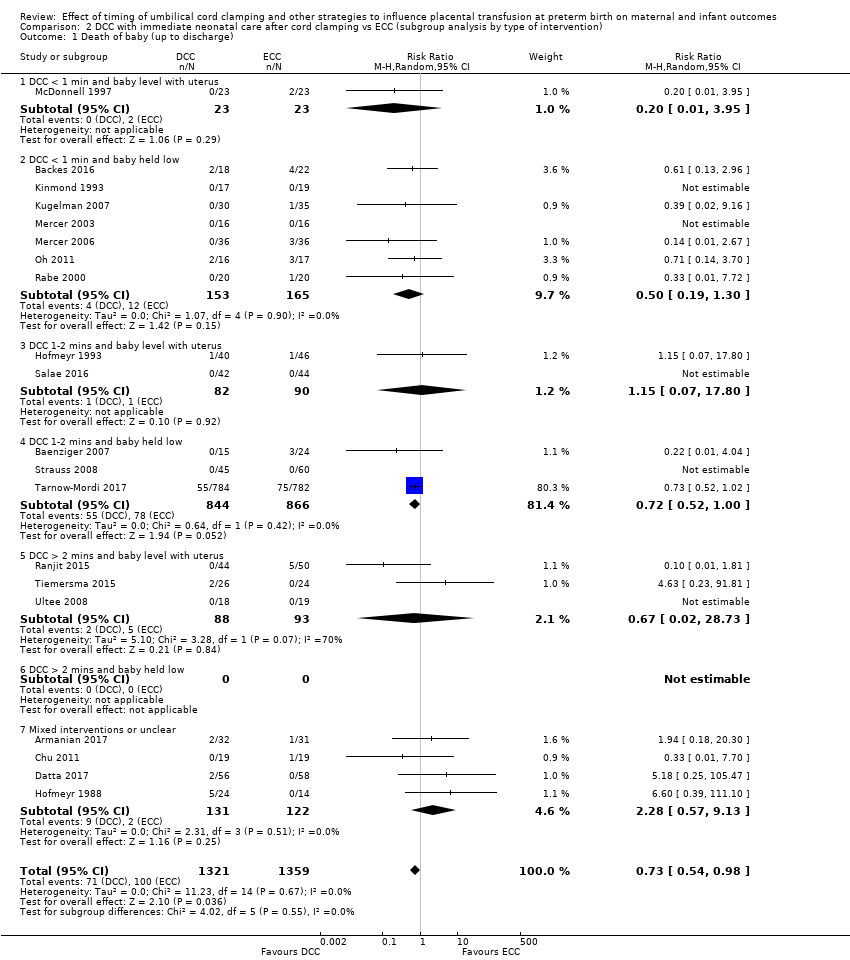
Comparison 2 DCC with immediate neonatal care after cord clamping vs ECC (subgroup analysis by type of intervention), Outcome 1 Death of baby (up to discharge).

Comparison 2 DCC with immediate neonatal care after cord clamping vs ECC (subgroup analysis by type of intervention), Outcome 3 Severe intraventricular haemorrhage (IVH grades 3, 4).

Comparison 2 DCC with immediate neonatal care after cord clamping vs ECC (subgroup analysis by type of intervention), Outcome 4 Intraventricular haemorrhage (IVH, all grades).
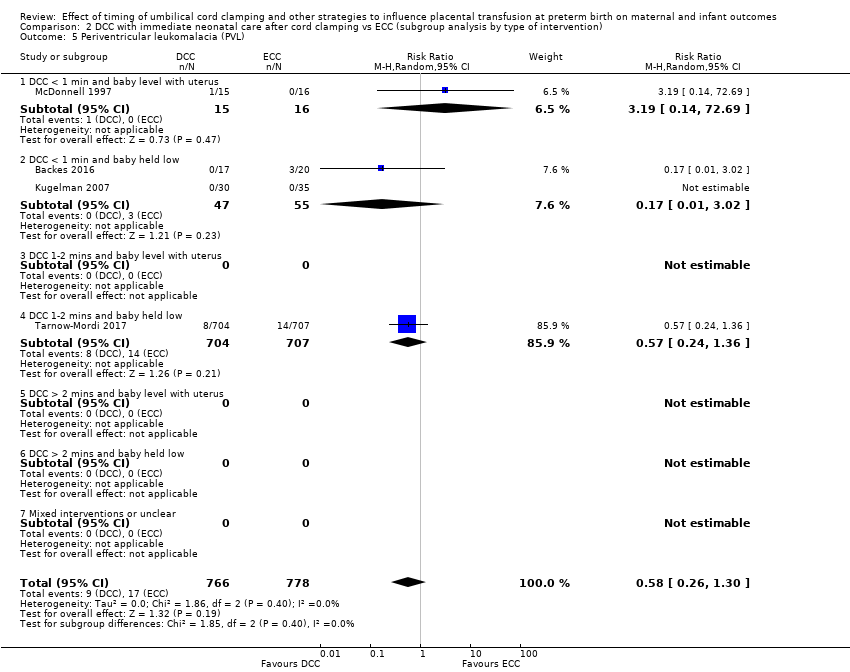
Comparison 2 DCC with immediate neonatal care after cord clamping vs ECC (subgroup analysis by type of intervention), Outcome 5 Periventricular leukomalacia (PVL).

Comparison 2 DCC with immediate neonatal care after cord clamping vs ECC (subgroup analysis by type of intervention), Outcome 6 Chronic lung disease (CLD) ‐ oxygen supplement at 36 weeks (corrected for gestation).

Comparison 2 DCC with immediate neonatal care after cord clamping vs ECC (subgroup analysis by type of intervention), Outcome 7 Maternal blood loss of 500 mL or greater.
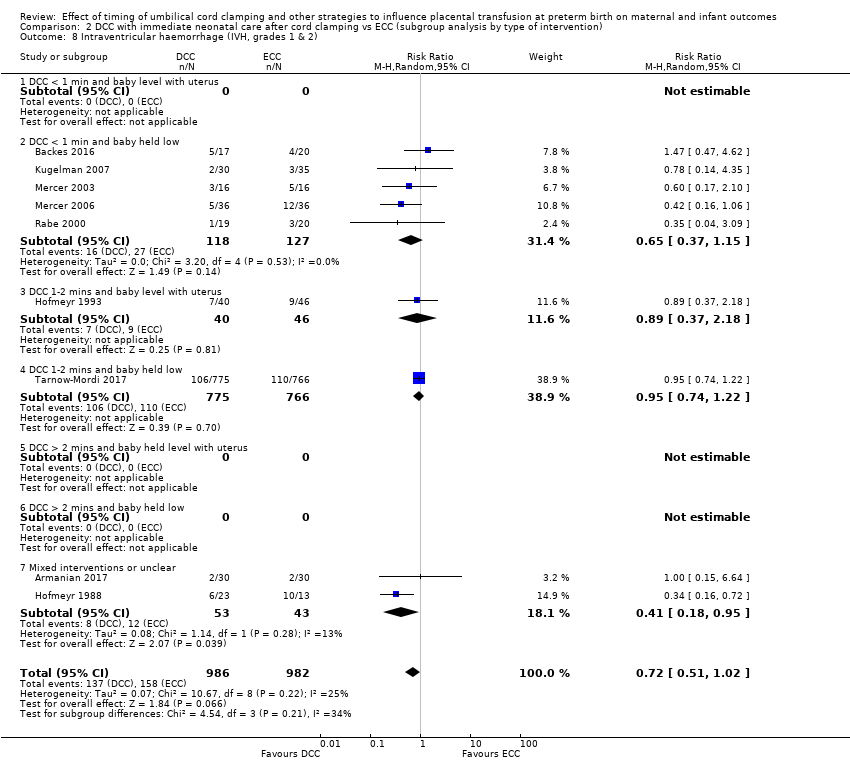
Comparison 2 DCC with immediate neonatal care after cord clamping vs ECC (subgroup analysis by type of intervention), Outcome 8 Intraventricular haemorrhage (IVH, grades 1 & 2).
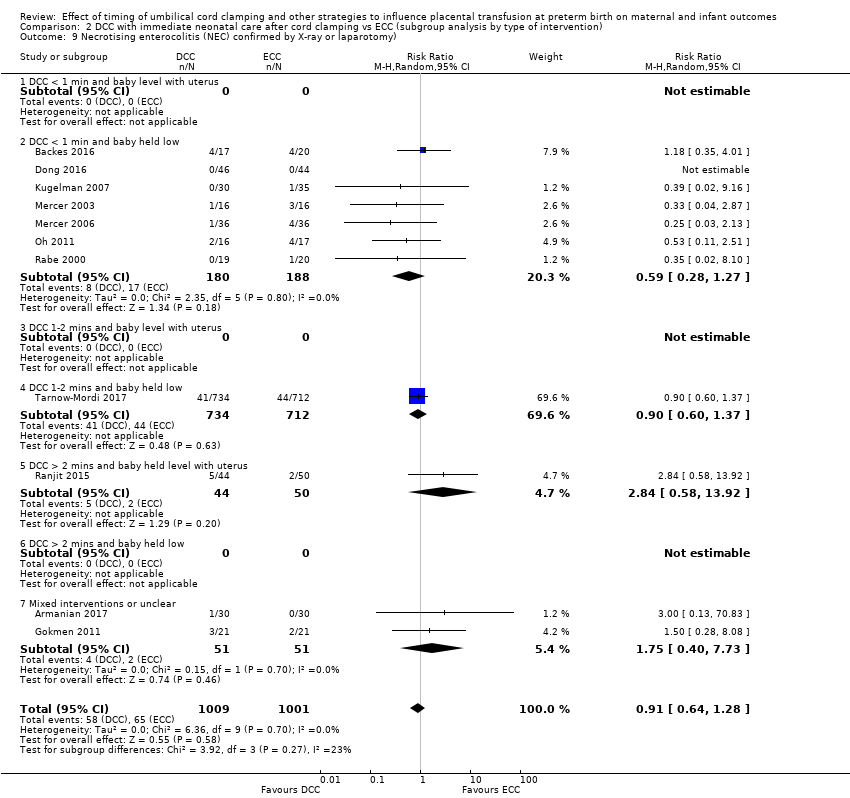
Comparison 2 DCC with immediate neonatal care after cord clamping vs ECC (subgroup analysis by type of intervention), Outcome 9 Necrotising enterocolitis (NEC) confirmed by X‐ray or laparotomy).

Comparison 2 DCC with immediate neonatal care after cord clamping vs ECC (subgroup analysis by type of intervention), Outcome 10 Respiratory Distress Syndrome (RDS).

Comparison 2 DCC with immediate neonatal care after cord clamping vs ECC (subgroup analysis by type of intervention), Outcome 11 Respiratory support (ventilator or CPAP).
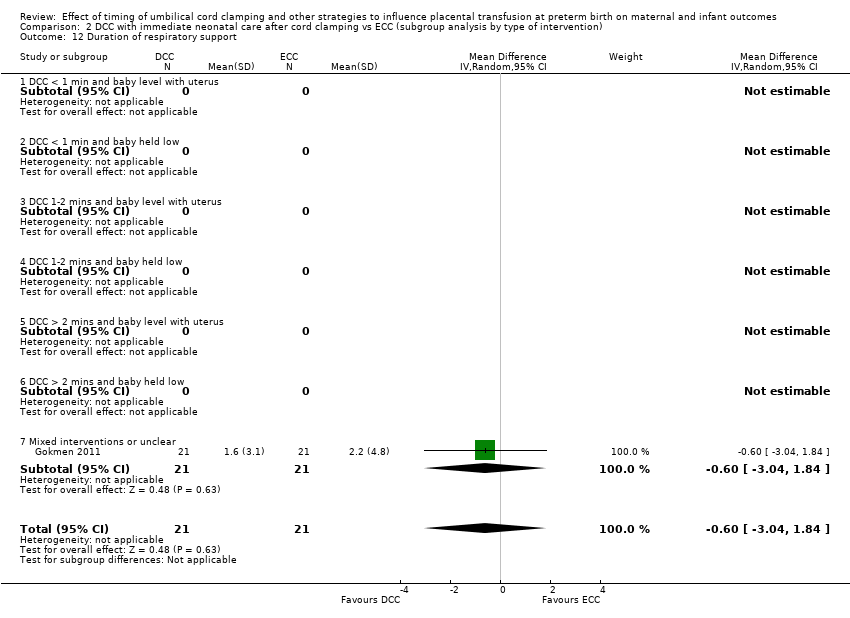
Comparison 2 DCC with immediate neonatal care after cord clamping vs ECC (subgroup analysis by type of intervention), Outcome 12 Duration of respiratory support.

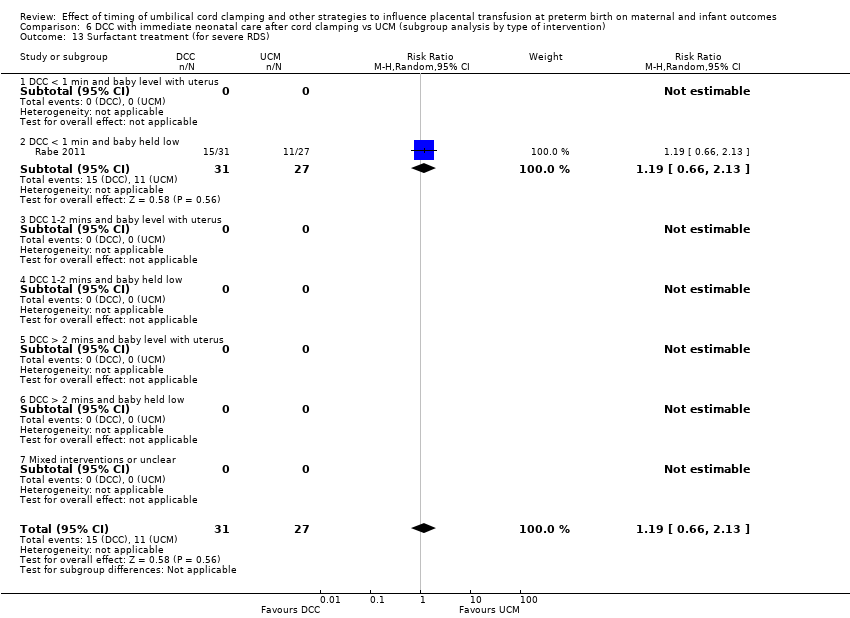
Comparison 2 DCC with immediate neonatal care after cord clamping vs ECC (subgroup analysis by type of intervention), Outcome 13 Surfactant treatment (for severe RDS).
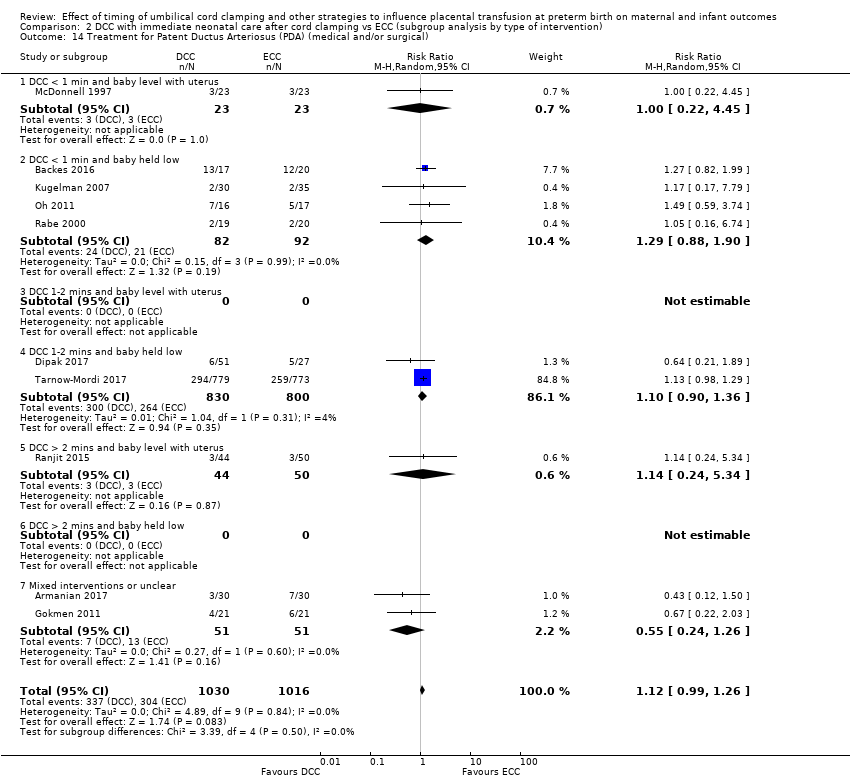
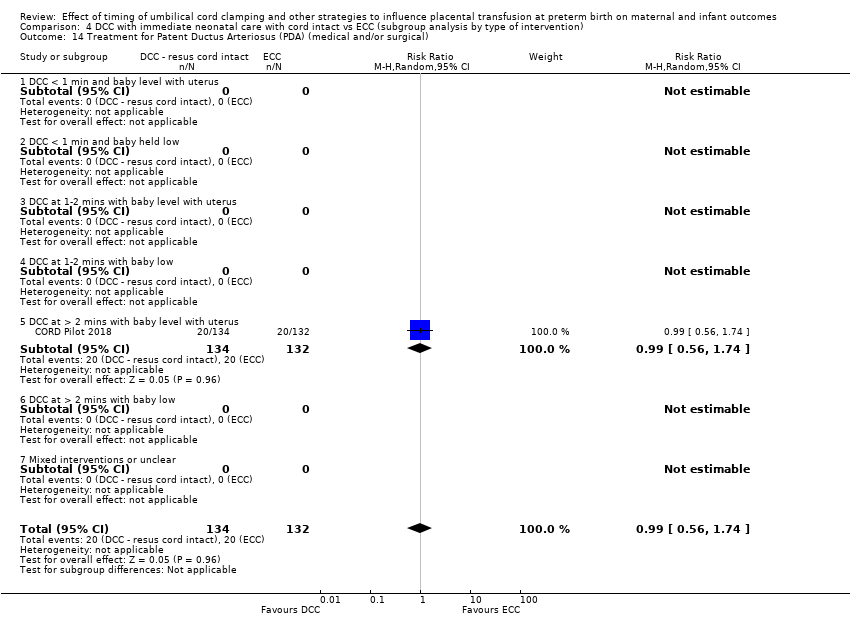
Comparison 2 DCC with immediate neonatal care after cord clamping vs ECC (subgroup analysis by type of intervention), Outcome 14 Treatment for Patent Ductus Arteriosus (PDA) (medical and/or surgical).
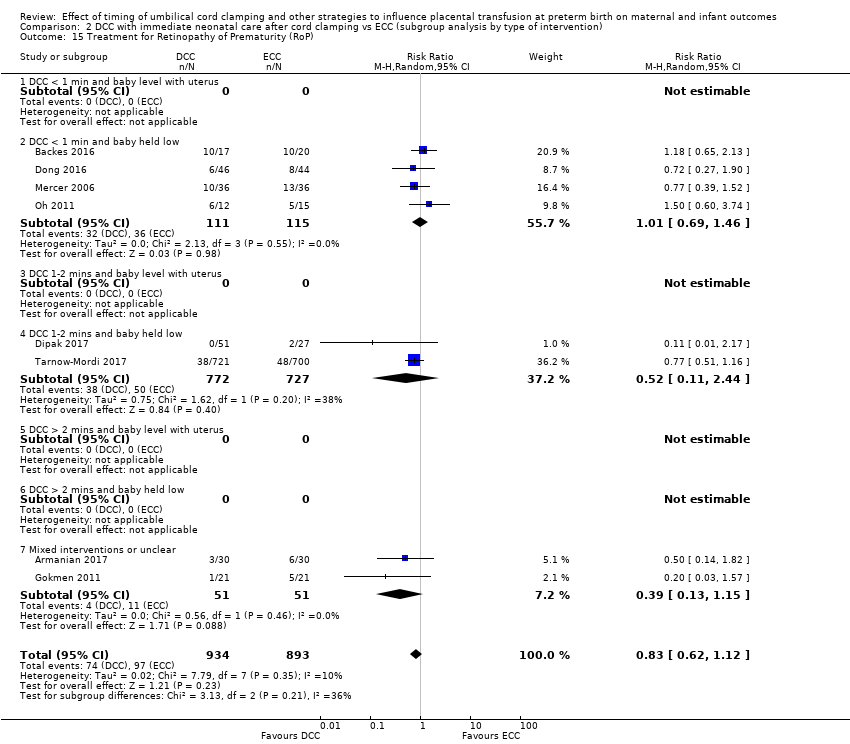
Comparison 2 DCC with immediate neonatal care after cord clamping vs ECC (subgroup analysis by type of intervention), Outcome 15 Treatment for Retinopathy of Prematurity (RoP).

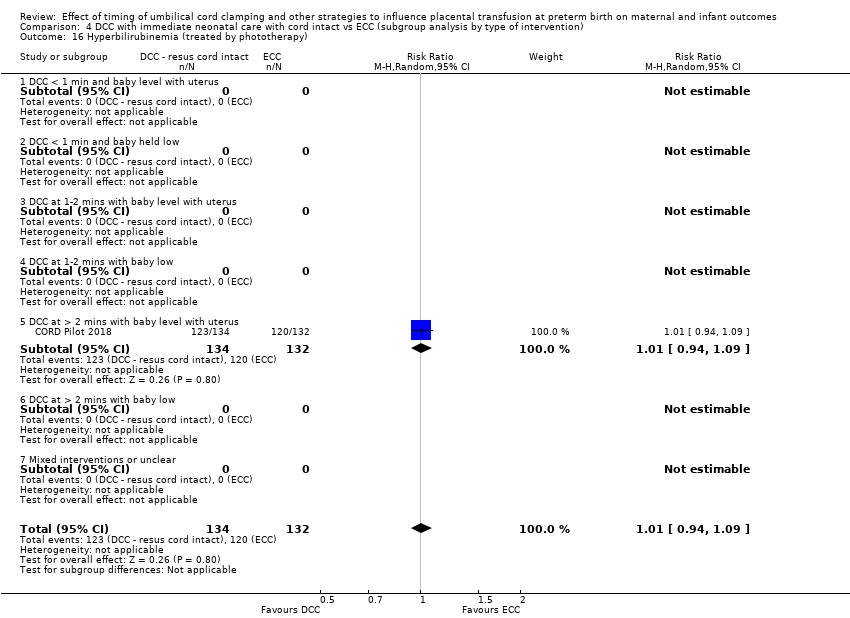
Comparison 2 DCC with immediate neonatal care after cord clamping vs ECC (subgroup analysis by type of intervention), Outcome 16 Hyperbilirubinemia (treated by phototherapy).

Comparison 2 DCC with immediate neonatal care after cord clamping vs ECC (subgroup analysis by type of intervention), Outcome 17 Inotropics for low blood pressure.

Comparison 2 DCC with immediate neonatal care after cord clamping vs ECC (subgroup analysis by type of intervention), Outcome 18 Low Apgar as defined by trialists (generally < 8 at 5 mins).
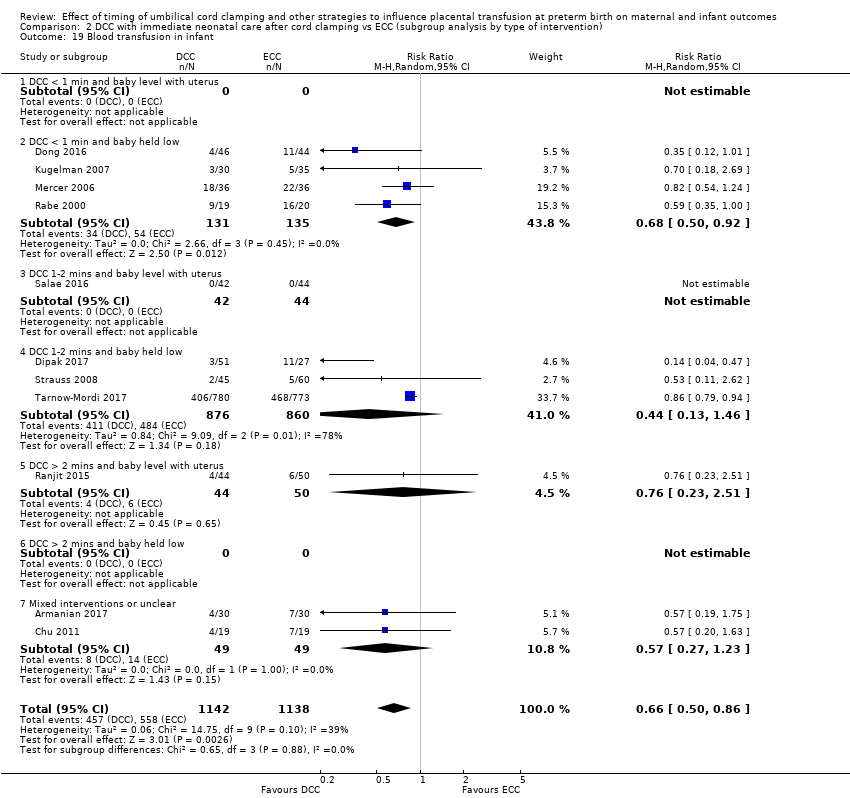
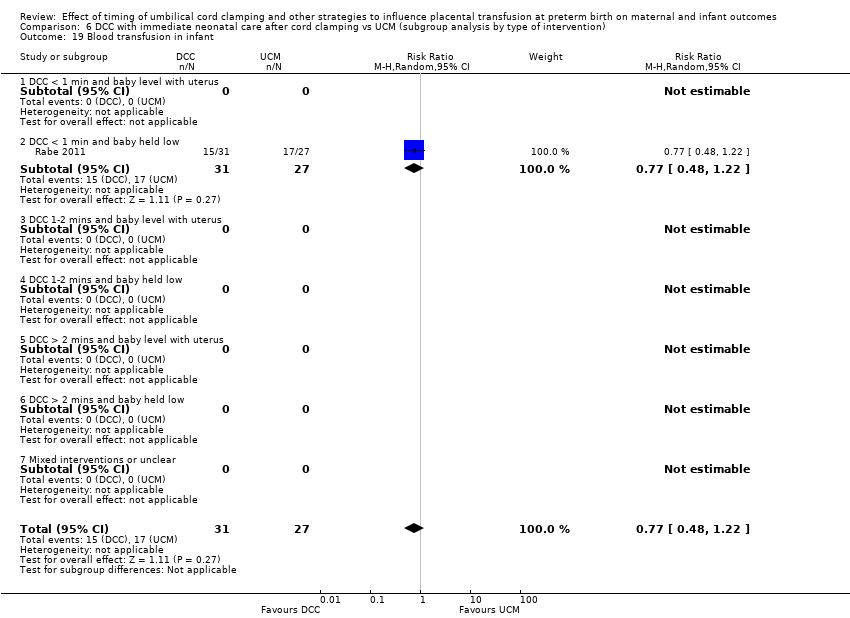
Comparison 2 DCC with immediate neonatal care after cord clamping vs ECC (subgroup analysis by type of intervention), Outcome 19 Blood transfusion in infant.

Comparison 2 DCC with immediate neonatal care after cord clamping vs ECC (subgroup analysis by type of intervention), Outcome 20 Volume of blood transfused (mL).
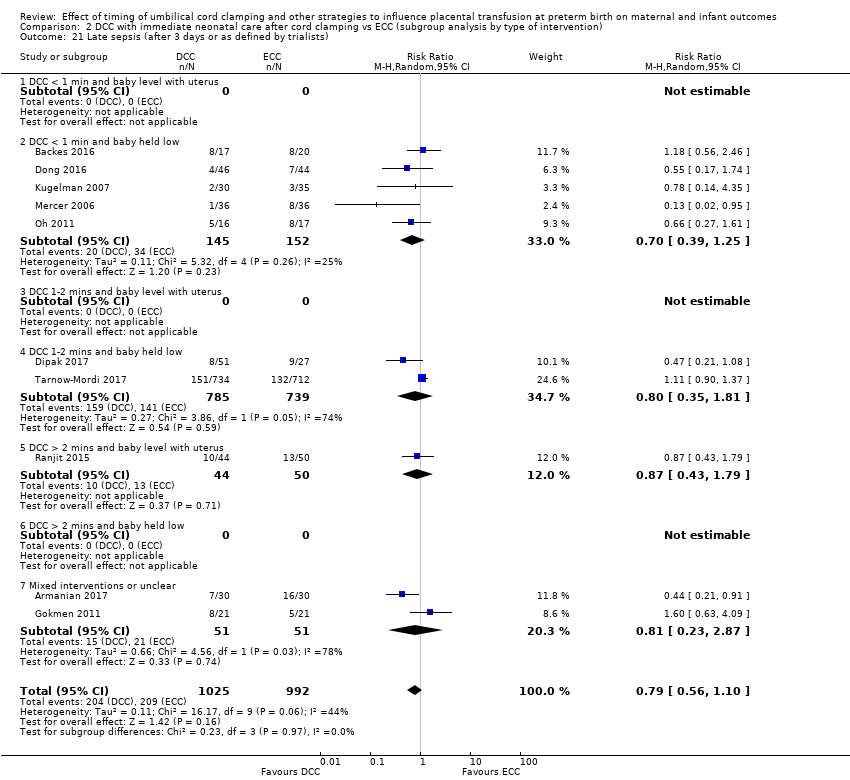
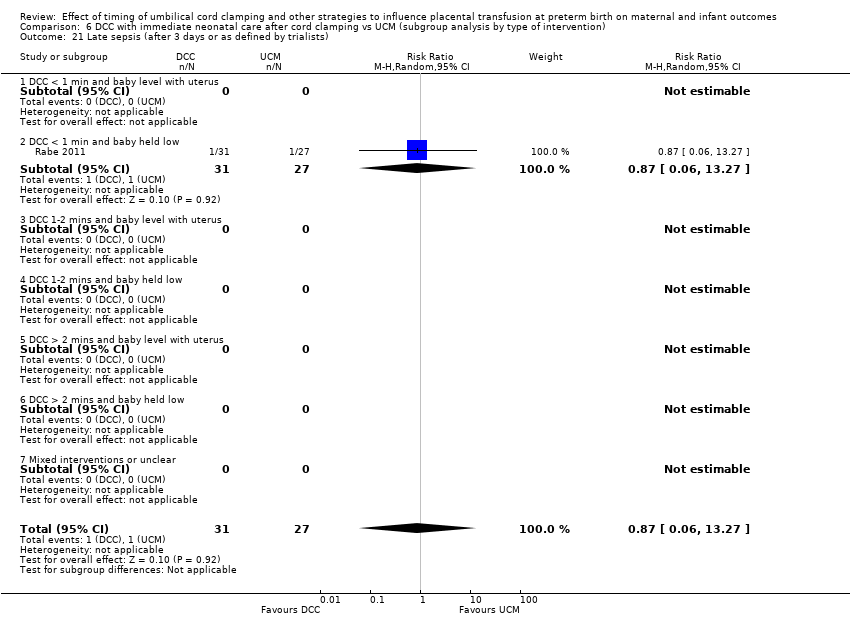
Comparison 2 DCC with immediate neonatal care after cord clamping vs ECC (subgroup analysis by type of intervention), Outcome 21 Late sepsis (after 3 days or as defined by trialists).
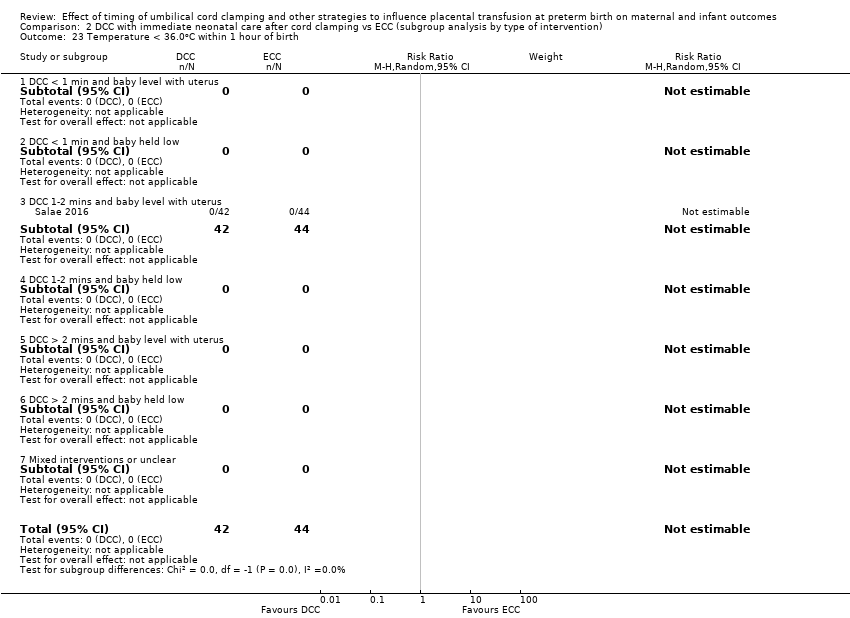
Comparison 2 DCC with immediate neonatal care after cord clamping vs ECC (subgroup analysis by type of intervention), Outcome 23 Temperature < 36.0oC within 1 hour of birth.
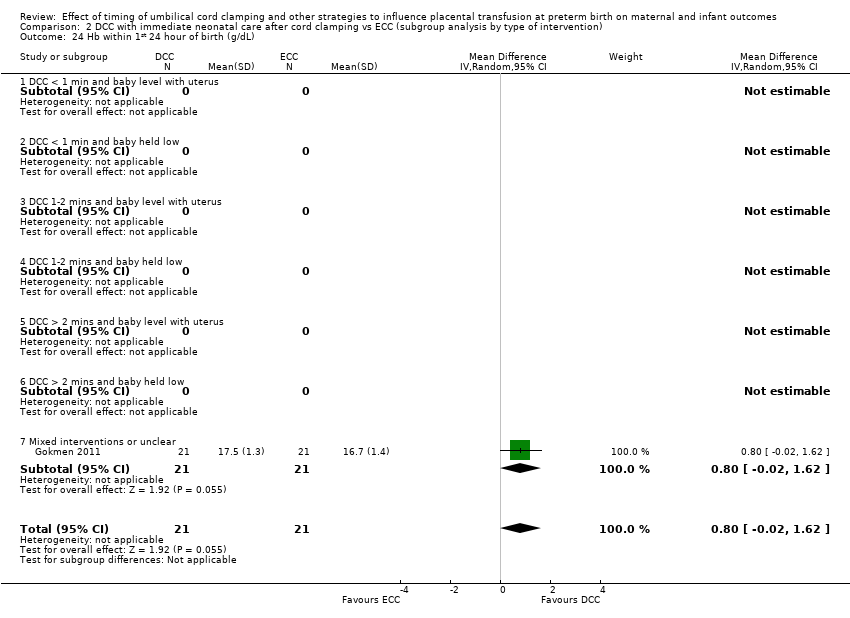
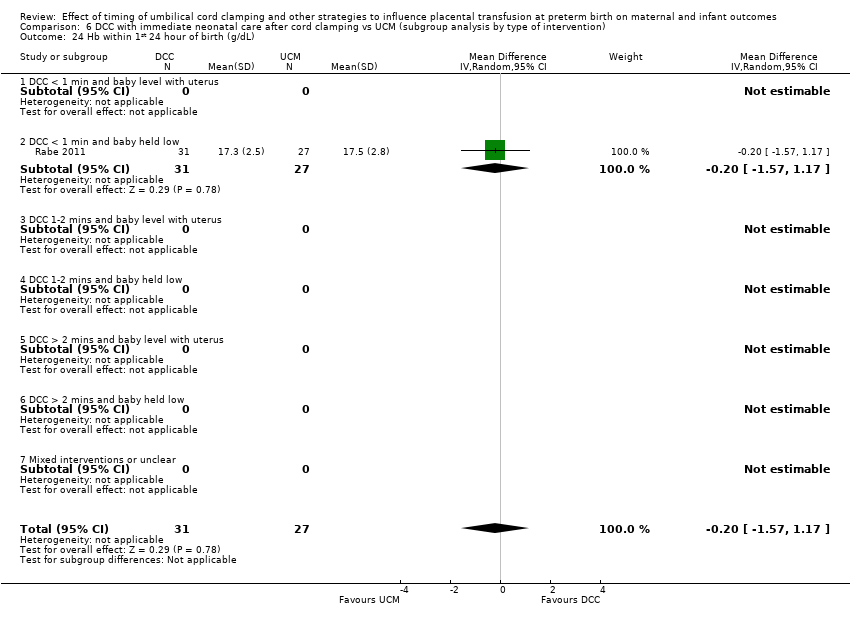
Comparison 2 DCC with immediate neonatal care after cord clamping vs ECC (subgroup analysis by type of intervention), Outcome 24 Hb within 1st 24 hour of birth (g/dL).

Comparison 2 DCC with immediate neonatal care after cord clamping vs ECC (subgroup analysis by type of intervention), Outcome 25 Mean arterial blood pressure in early hours after birth (mm Hg).

Comparison 2 DCC with immediate neonatal care after cord clamping vs ECC (subgroup analysis by type of intervention), Outcome 27 Home oxygen.

Comparison 2 DCC with immediate neonatal care after cord clamping vs ECC (subgroup analysis by type of intervention), Outcome 33 Blood transfusion for mother.

Comparison 2 DCC with immediate neonatal care after cord clamping vs ECC (subgroup analysis by type of intervention), Outcome 39 Fully breastfed or mixed feeding at infant discharge.

Comparison 2 DCC with immediate neonatal care after cord clamping vs ECC (subgroup analysis by type of intervention), Outcome 42 Neurosensory disability at 7 months (Bailey's MDI < 70) ‐ not prespecified.

Comparison 3 DCC with immediate neonatal care with cord intact vs ECC (subgroup analysis by gestation), Outcome 1 Death of baby (up to discharge).
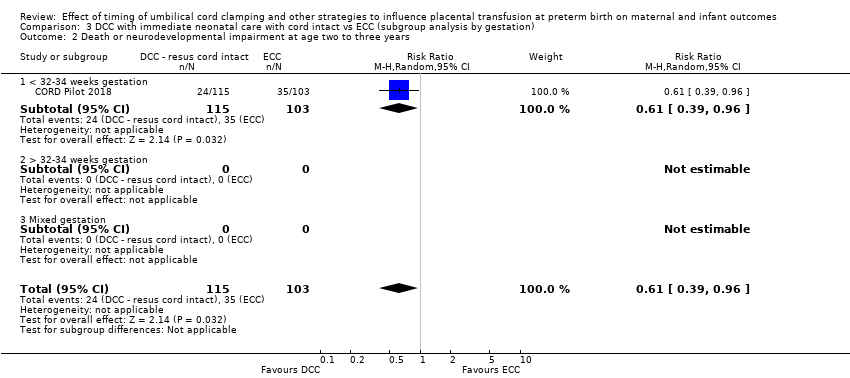
Comparison 3 DCC with immediate neonatal care with cord intact vs ECC (subgroup analysis by gestation), Outcome 2 Death or neurodevelopmental impairment at age two to three years.
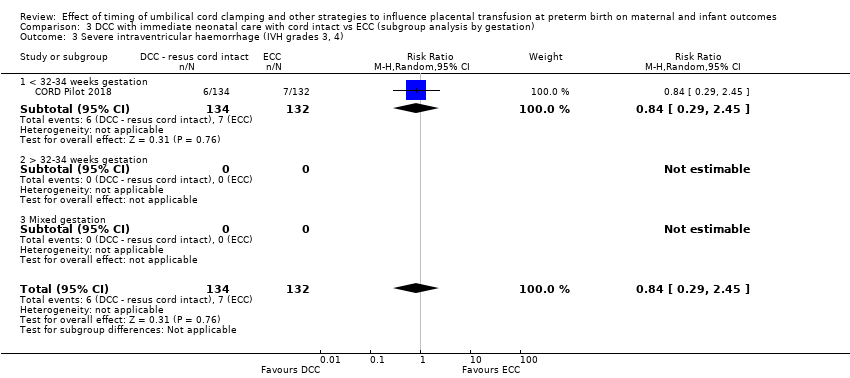
Comparison 3 DCC with immediate neonatal care with cord intact vs ECC (subgroup analysis by gestation), Outcome 3 Severe intraventricular haemorrhage (IVH grades 3, 4).
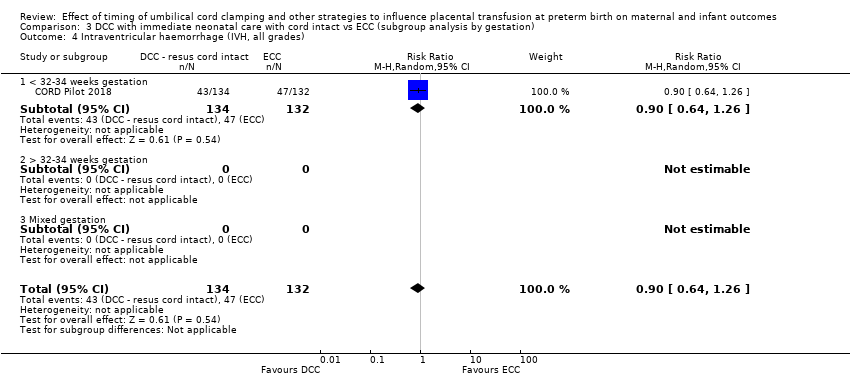
Comparison 3 DCC with immediate neonatal care with cord intact vs ECC (subgroup analysis by gestation), Outcome 4 Intraventricular haemorrhage (IVH, all grades).

Comparison 3 DCC with immediate neonatal care with cord intact vs ECC (subgroup analysis by gestation), Outcome 5 Periventricular leukomalacia (PVL).
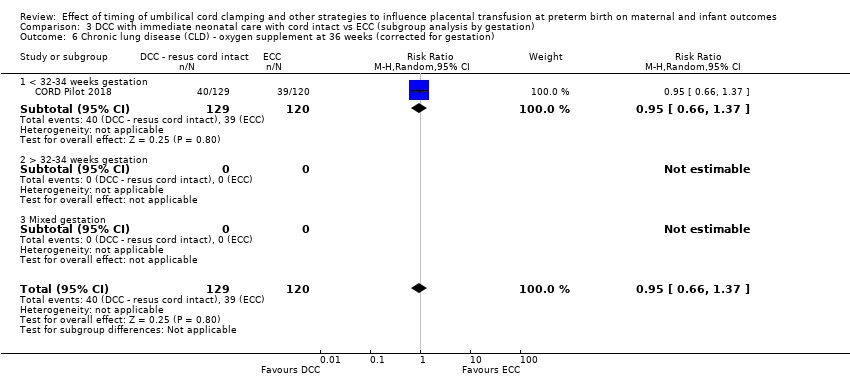
Comparison 3 DCC with immediate neonatal care with cord intact vs ECC (subgroup analysis by gestation), Outcome 6 Chronic lung disease (CLD) ‐ oxygen supplement at 36 weeks (corrected for gestation).
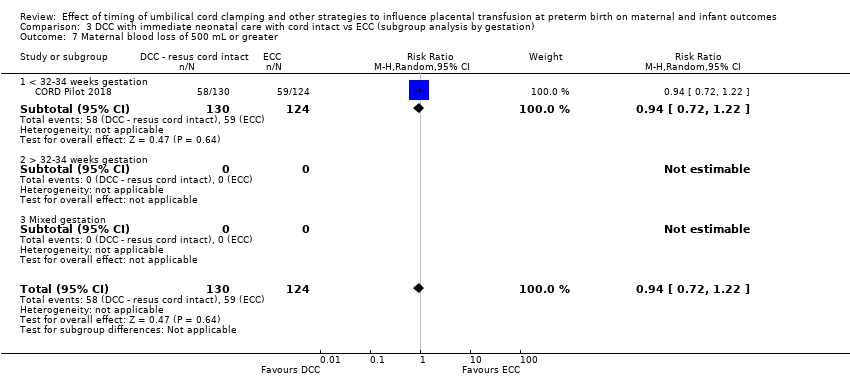
Comparison 3 DCC with immediate neonatal care with cord intact vs ECC (subgroup analysis by gestation), Outcome 7 Maternal blood loss of 500 mL or greater.

Comparison 3 DCC with immediate neonatal care with cord intact vs ECC (subgroup analysis by gestation), Outcome 8 Intraventricular haemorrhage (IVH, grades 1 & 2).
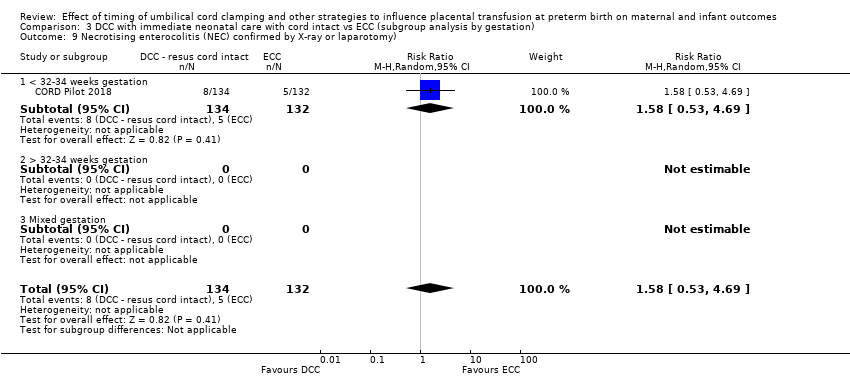
Comparison 3 DCC with immediate neonatal care with cord intact vs ECC (subgroup analysis by gestation), Outcome 9 Necrotising enterocolitis (NEC) confirmed by X‐ray or laparotomy).
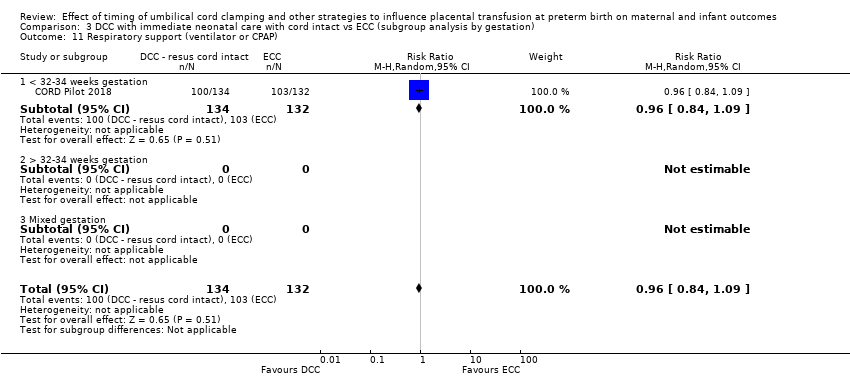
Comparison 3 DCC with immediate neonatal care with cord intact vs ECC (subgroup analysis by gestation), Outcome 11 Respiratory support (ventilator or CPAP).

Comparison 3 DCC with immediate neonatal care with cord intact vs ECC (subgroup analysis by gestation), Outcome 14 Treatment for Patent Ductus Arteriosus (PDA) (medical and/or surgical).

Comparison 3 DCC with immediate neonatal care with cord intact vs ECC (subgroup analysis by gestation), Outcome 15 Treatment for Retinopathy of Prematurity (RoP).
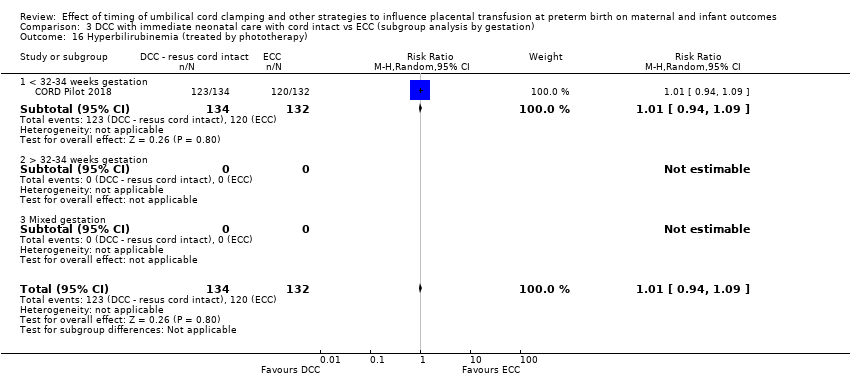
Comparison 3 DCC with immediate neonatal care with cord intact vs ECC (subgroup analysis by gestation), Outcome 16 Hyperbilirubinemia (treated by phototherapy).

Comparison 3 DCC with immediate neonatal care with cord intact vs ECC (subgroup analysis by gestation), Outcome 19 Blood transfusion in infant.

Comparison 3 DCC with immediate neonatal care with cord intact vs ECC (subgroup analysis by gestation), Outcome 21 Late sepsis (after 3 days or as defined by trialists).
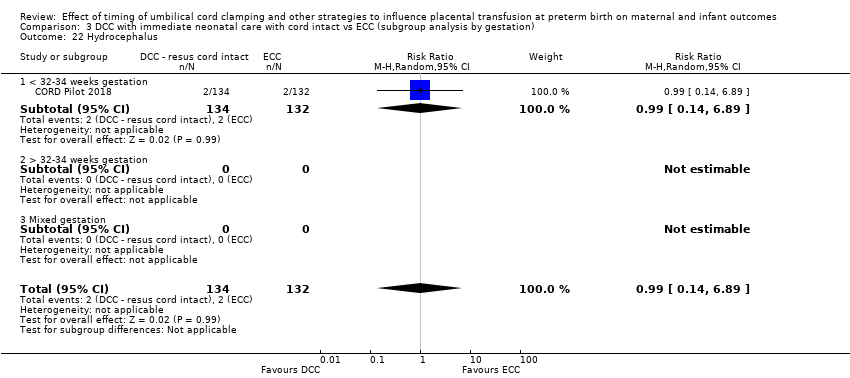
Comparison 3 DCC with immediate neonatal care with cord intact vs ECC (subgroup analysis by gestation), Outcome 22 Hydrocephalus.

Comparison 3 DCC with immediate neonatal care with cord intact vs ECC (subgroup analysis by gestation), Outcome 23 Temperature < 36.0oC within 1 hour of birth.

Comparison 3 DCC with immediate neonatal care with cord intact vs ECC (subgroup analysis by gestation), Outcome 28 Neurodevelopmental impairment at age two to three years.

Comparison 3 DCC with immediate neonatal care with cord intact vs ECC (subgroup analysis by gestation), Outcome 31 Manual removal of placenta (denominator = vaginal births).
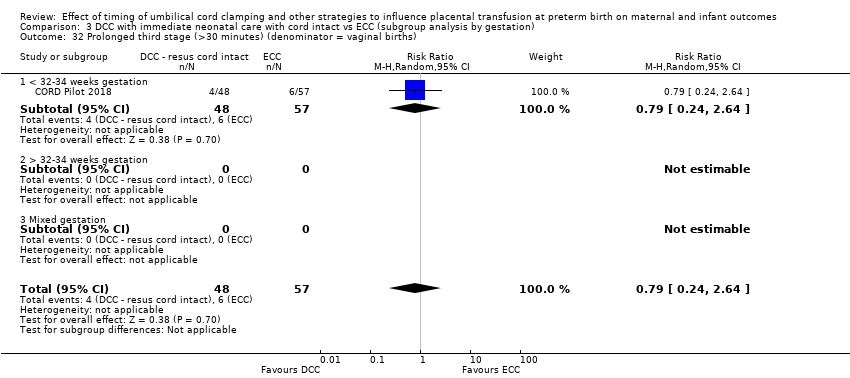
Comparison 3 DCC with immediate neonatal care with cord intact vs ECC (subgroup analysis by gestation), Outcome 32 Prolonged third stage (>30 minutes) (denominator = vaginal births).
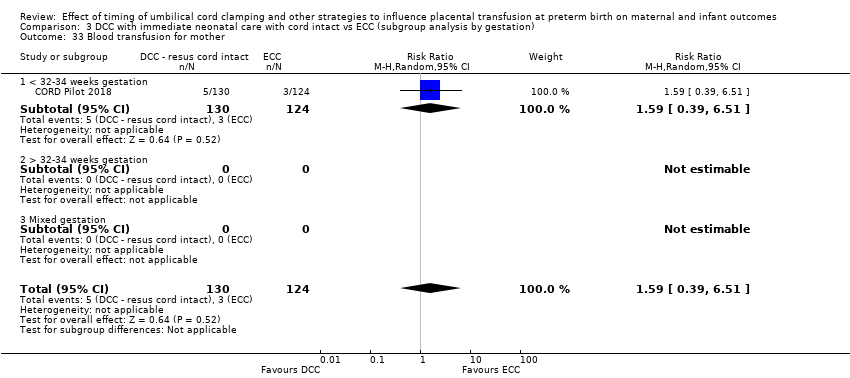
Comparison 3 DCC with immediate neonatal care with cord intact vs ECC (subgroup analysis by gestation), Outcome 33 Blood transfusion for mother.
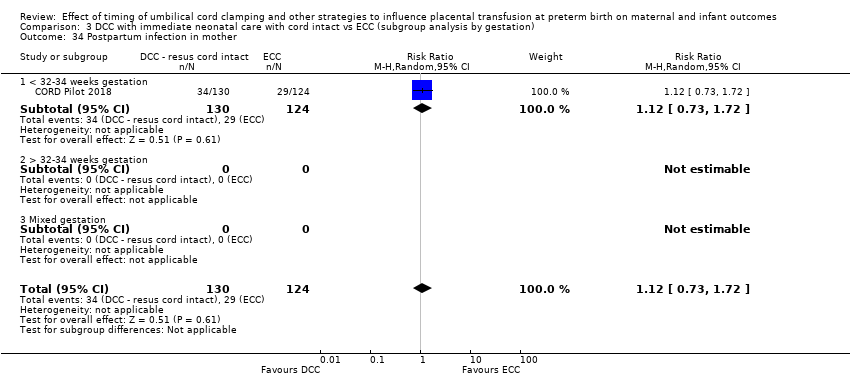
Comparison 3 DCC with immediate neonatal care with cord intact vs ECC (subgroup analysis by gestation), Outcome 34 Postpartum infection in mother.

Comparison 3 DCC with immediate neonatal care with cord intact vs ECC (subgroup analysis by gestation), Outcome 39 Fully breastfed or mixed feeding at infant discharge.
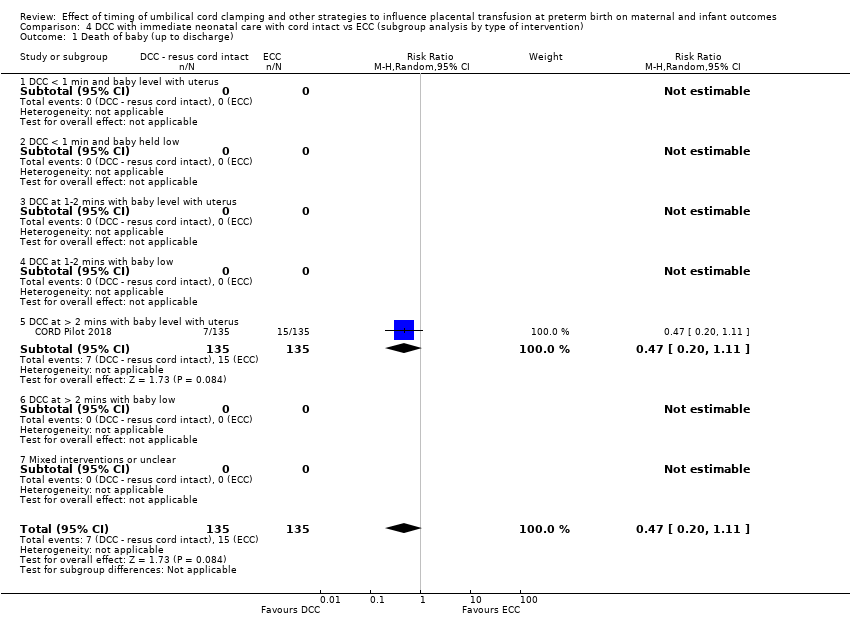
Comparison 4 DCC with immediate neonatal care with cord intact vs ECC (subgroup analysis by type of intervention), Outcome 1 Death of baby (up to discharge).

Comparison 4 DCC with immediate neonatal care with cord intact vs ECC (subgroup analysis by type of intervention), Outcome 2 Death or neurodevelopmental impairment at age two to three years.

Comparison 4 DCC with immediate neonatal care with cord intact vs ECC (subgroup analysis by type of intervention), Outcome 3 Severe intraventricular haemorrhage (IVH grades 3, 4).

Comparison 4 DCC with immediate neonatal care with cord intact vs ECC (subgroup analysis by type of intervention), Outcome 4 Intraventricular haemorrhage (IVH, all grades).

Comparison 4 DCC with immediate neonatal care with cord intact vs ECC (subgroup analysis by type of intervention), Outcome 5 Periventricular leukomalacia (PVL).

Comparison 4 DCC with immediate neonatal care with cord intact vs ECC (subgroup analysis by type of intervention), Outcome 6 Chronic lung disease (CLD) ‐ oxygen supplement at 36 weeks (corrected for gestation).

Comparison 4 DCC with immediate neonatal care with cord intact vs ECC (subgroup analysis by type of intervention), Outcome 7 Maternal blood loss of 500 mL or greater.

Comparison 4 DCC with immediate neonatal care with cord intact vs ECC (subgroup analysis by type of intervention), Outcome 8 Intraventricular haemorrhage (IVH, grades 1 & 2).

Comparison 4 DCC with immediate neonatal care with cord intact vs ECC (subgroup analysis by type of intervention), Outcome 9 Necrotising enterocolitis (NEC) confirmed by X‐ray or laparotomy).

Comparison 4 DCC with immediate neonatal care with cord intact vs ECC (subgroup analysis by type of intervention), Outcome 11 Respiratory support (ventilator or CPAP).
Comparison 4 DCC with immediate neonatal care with cord intact vs ECC (subgroup analysis by type of intervention), Outcome 14 Treatment for Patent Ductus Arteriosus (PDA) (medical and/or surgical).

Comparison 4 DCC with immediate neonatal care with cord intact vs ECC (subgroup analysis by type of intervention), Outcome 15 Treatment for Retinopathy of Prematurity (RoP).
Comparison 4 DCC with immediate neonatal care with cord intact vs ECC (subgroup analysis by type of intervention), Outcome 16 Hyperbilirubinemia (treated by phototherapy).
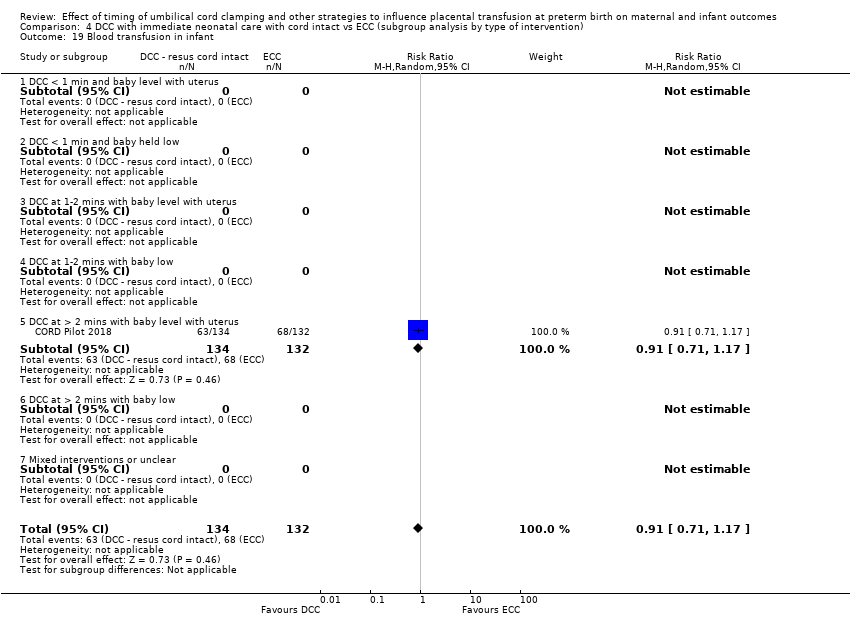
Comparison 4 DCC with immediate neonatal care with cord intact vs ECC (subgroup analysis by type of intervention), Outcome 19 Blood transfusion in infant.
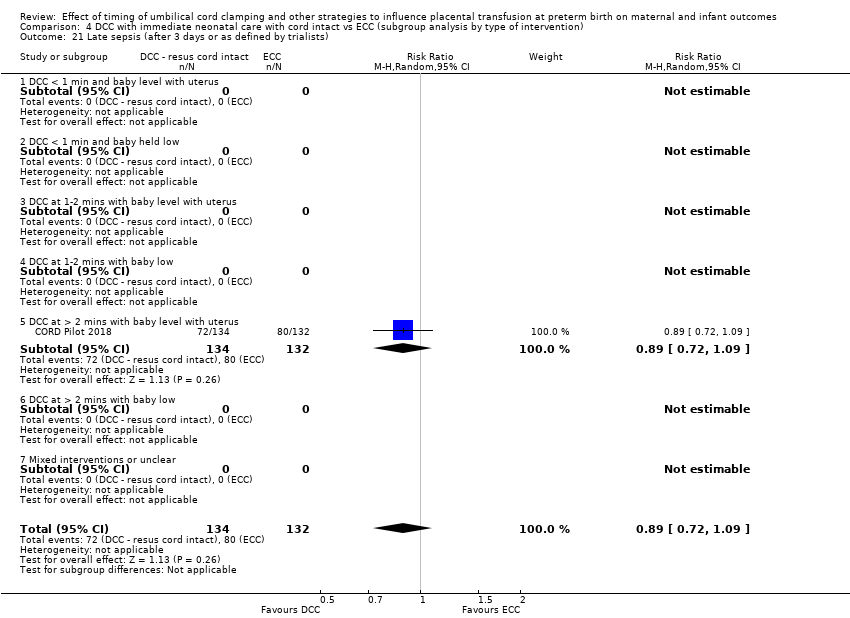
Comparison 4 DCC with immediate neonatal care with cord intact vs ECC (subgroup analysis by type of intervention), Outcome 21 Late sepsis (after 3 days or as defined by trialists).

Comparison 4 DCC with immediate neonatal care with cord intact vs ECC (subgroup analysis by type of intervention), Outcome 22 Hydrocephalus.

Comparison 4 DCC with immediate neonatal care with cord intact vs ECC (subgroup analysis by type of intervention), Outcome 23 Temperature < 36.0oC within 1 hour of birth.

Comparison 4 DCC with immediate neonatal care with cord intact vs ECC (subgroup analysis by type of intervention), Outcome 28 Neurodevelopmental impairment at age two to three years.

Comparison 4 DCC with immediate neonatal care with cord intact vs ECC (subgroup analysis by type of intervention), Outcome 31 Manual removal of placenta (denominator = vaginal births).
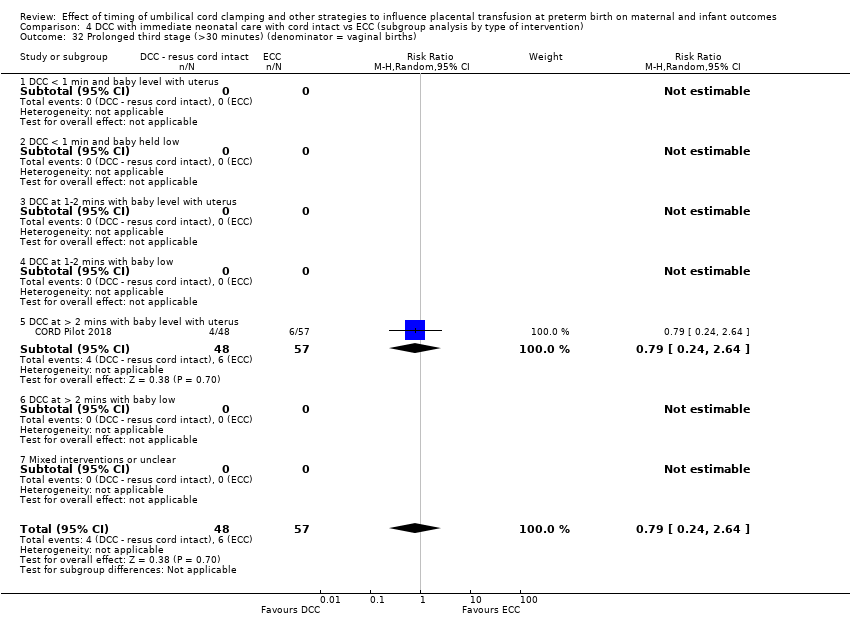
Comparison 4 DCC with immediate neonatal care with cord intact vs ECC (subgroup analysis by type of intervention), Outcome 32 Prolonged third stage (>30 minutes) (denominator = vaginal births).
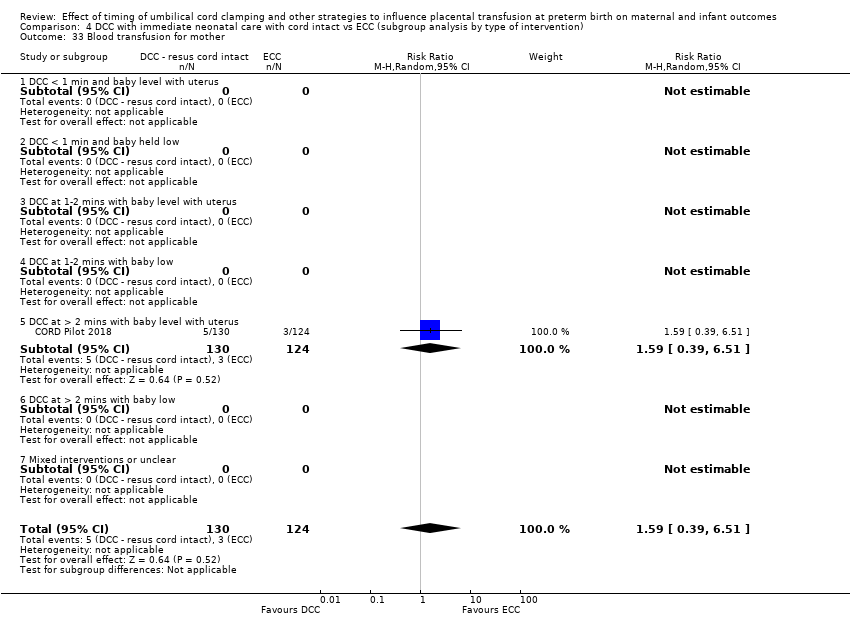
Comparison 4 DCC with immediate neonatal care with cord intact vs ECC (subgroup analysis by type of intervention), Outcome 33 Blood transfusion for mother.
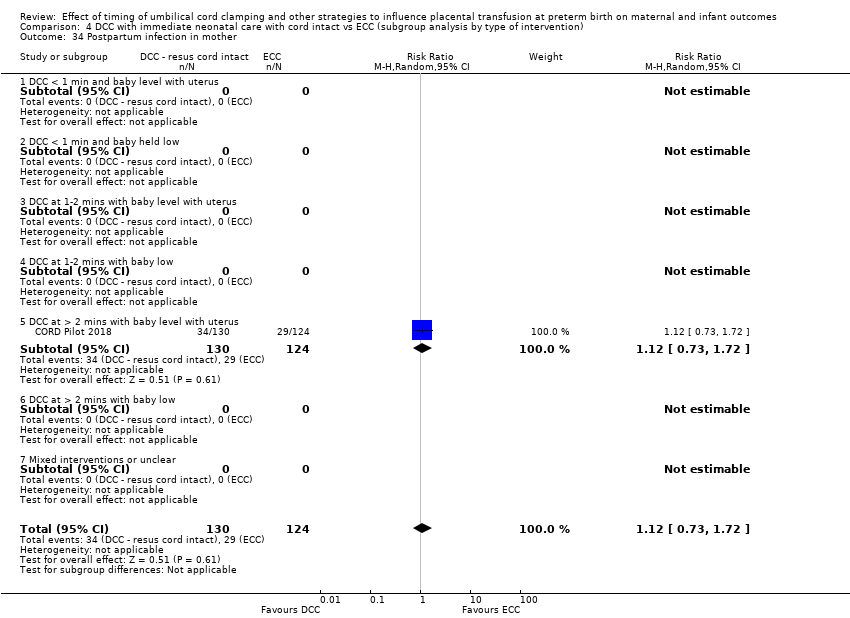
Comparison 4 DCC with immediate neonatal care with cord intact vs ECC (subgroup analysis by type of intervention), Outcome 34 Postpartum infection in mother.

Comparison 4 DCC with immediate neonatal care with cord intact vs ECC (subgroup analysis by type of intervention), Outcome 39 Fully breastfed or mixed feeding at infant discharge.

Comparison 5 DCC with immediate neonatal care after cord clamping vs UCM (subgroup analysis by gestation), Outcome 1 Death of baby (up to discharge).

Comparison 5 DCC with immediate neonatal care after cord clamping vs UCM (subgroup analysis by gestation), Outcome 2 Death or neurodevelopmental impairment at age two to three years.
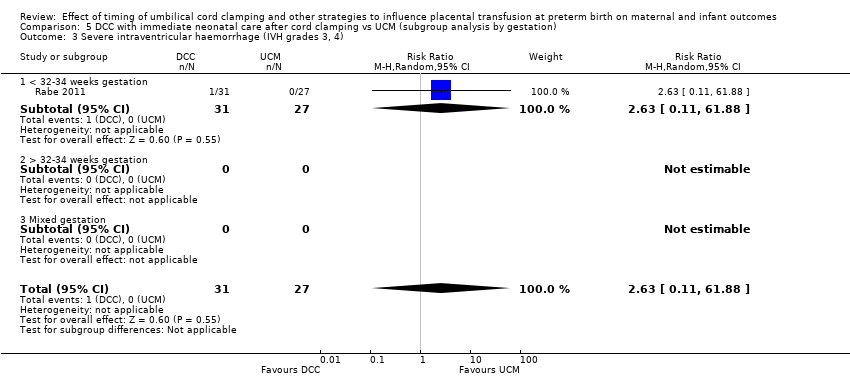
Comparison 5 DCC with immediate neonatal care after cord clamping vs UCM (subgroup analysis by gestation), Outcome 3 Severe intraventricular haemorrhage (IVH grades 3, 4).
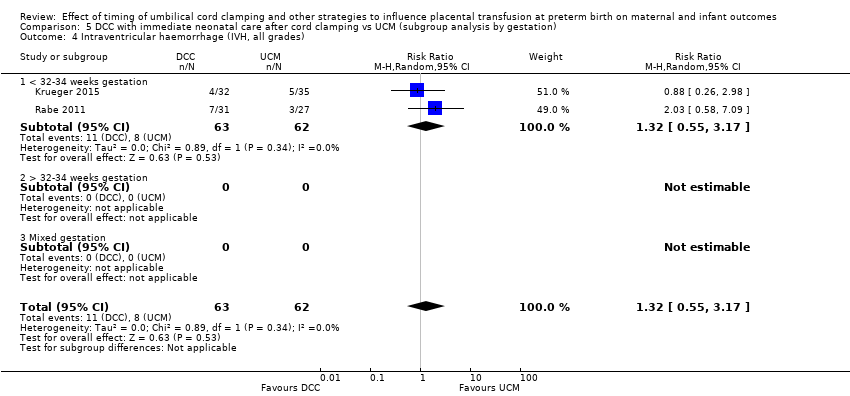
Comparison 5 DCC with immediate neonatal care after cord clamping vs UCM (subgroup analysis by gestation), Outcome 4 Intraventricular haemorrhage (IVH, all grades).

Comparison 5 DCC with immediate neonatal care after cord clamping vs UCM (subgroup analysis by gestation), Outcome 5 Periventricular leukomalacia (PVL).
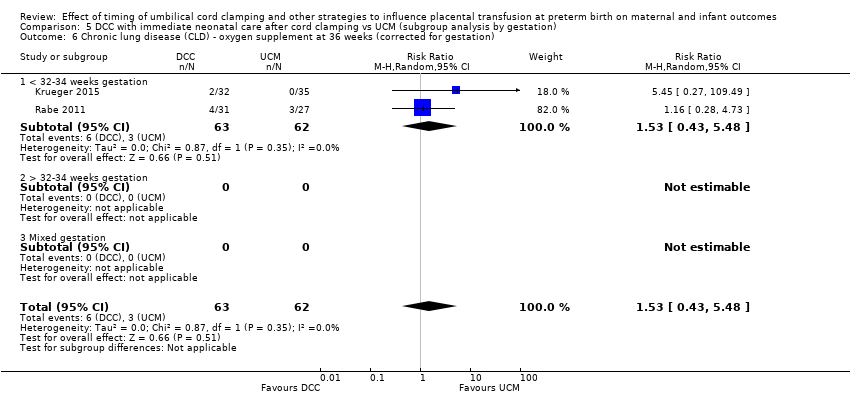
Comparison 5 DCC with immediate neonatal care after cord clamping vs UCM (subgroup analysis by gestation), Outcome 6 Chronic lung disease (CLD) ‐ oxygen supplement at 36 weeks (corrected for gestation).
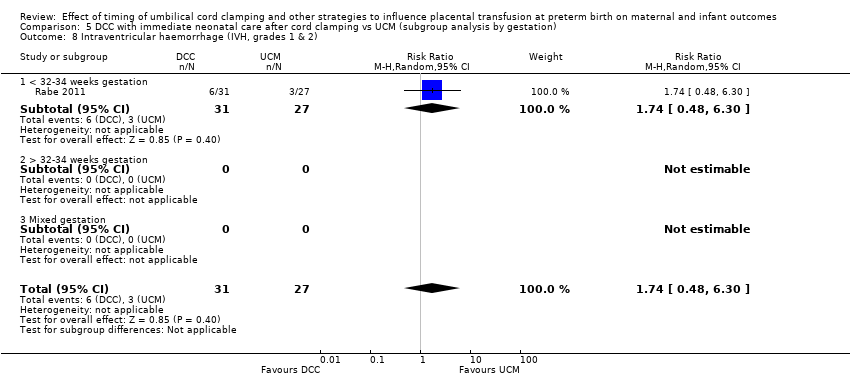
Comparison 5 DCC with immediate neonatal care after cord clamping vs UCM (subgroup analysis by gestation), Outcome 8 Intraventricular haemorrhage (IVH, grades 1 & 2).

Comparison 5 DCC with immediate neonatal care after cord clamping vs UCM (subgroup analysis by gestation), Outcome 9 Necrotising enterocolitis (NEC) confirmed by X‐ray or laparotomy).
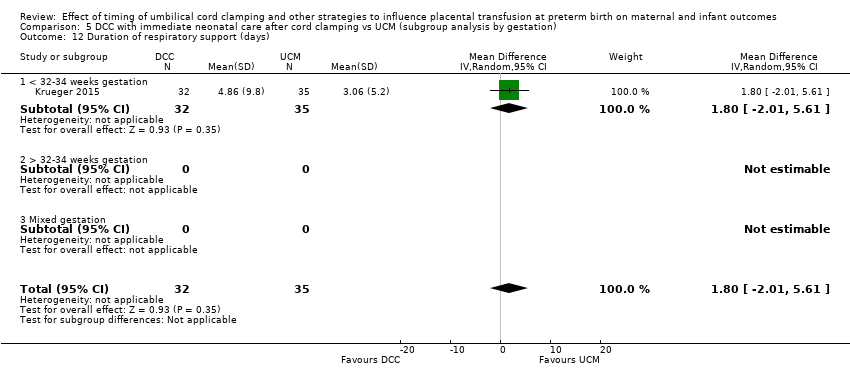
Comparison 5 DCC with immediate neonatal care after cord clamping vs UCM (subgroup analysis by gestation), Outcome 12 Duration of respiratory support (days).
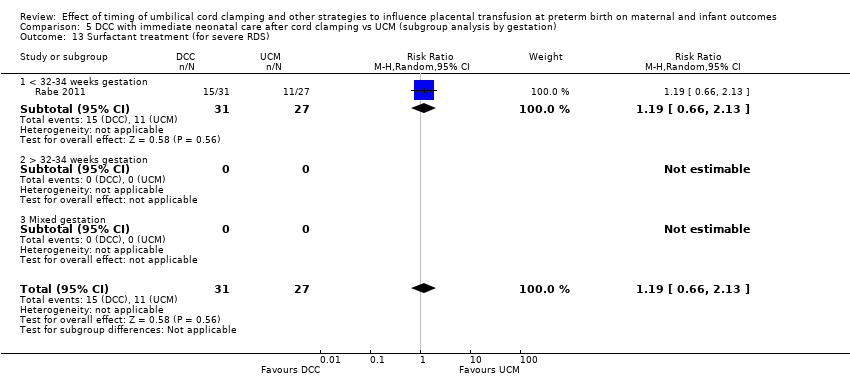
Comparison 5 DCC with immediate neonatal care after cord clamping vs UCM (subgroup analysis by gestation), Outcome 13 Surfactant treatment (for severe RDS).
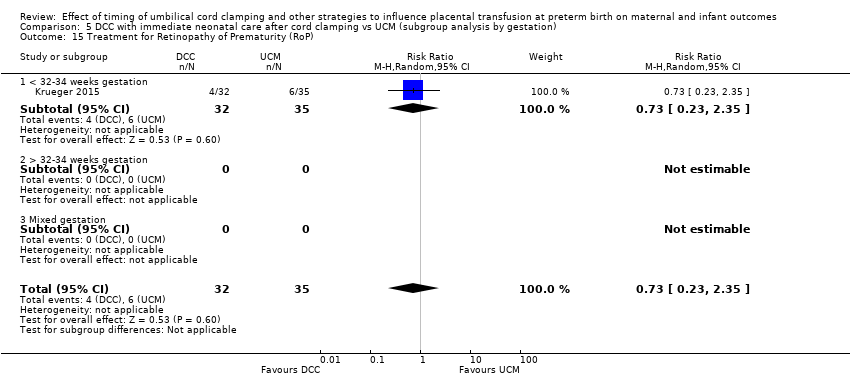
Comparison 5 DCC with immediate neonatal care after cord clamping vs UCM (subgroup analysis by gestation), Outcome 15 Treatment for Retinopathy of Prematurity (RoP).

Comparison 5 DCC with immediate neonatal care after cord clamping vs UCM (subgroup analysis by gestation), Outcome 19 Blood transfusion in infant.
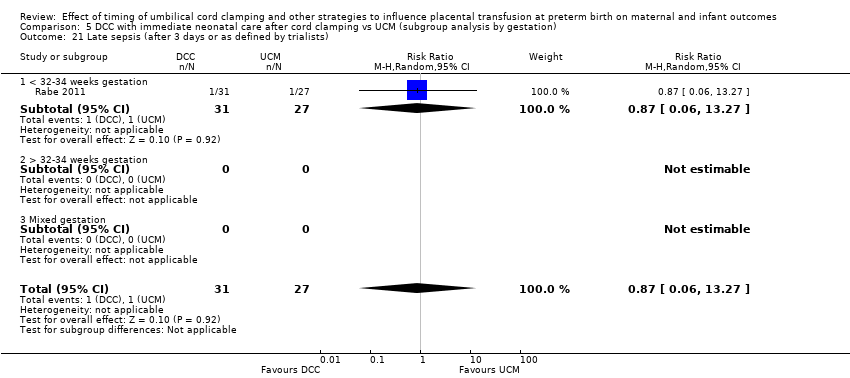
Comparison 5 DCC with immediate neonatal care after cord clamping vs UCM (subgroup analysis by gestation), Outcome 21 Late sepsis (after 3 days or as defined by trialists).
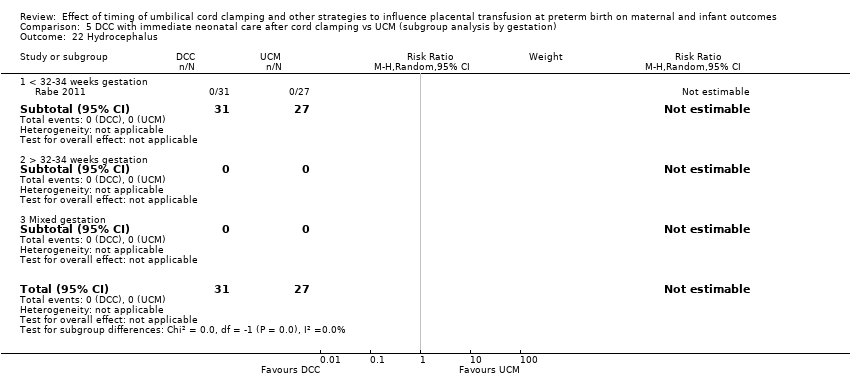
Comparison 5 DCC with immediate neonatal care after cord clamping vs UCM (subgroup analysis by gestation), Outcome 22 Hydrocephalus.
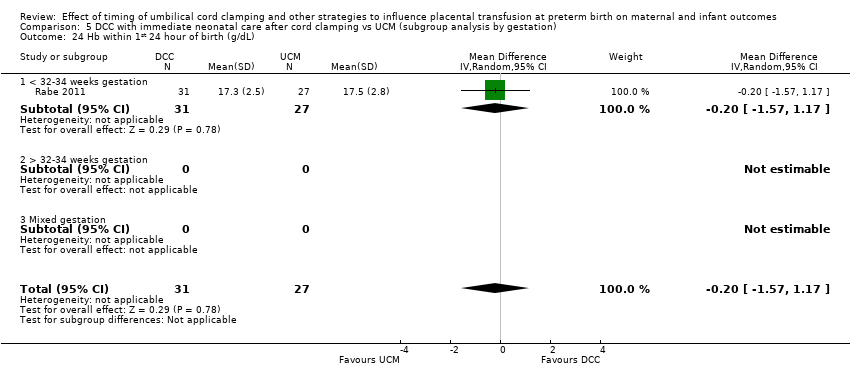
Comparison 5 DCC with immediate neonatal care after cord clamping vs UCM (subgroup analysis by gestation), Outcome 24 Hb within 1st 24 hour of birth (g/dL).

Comparison 5 DCC with immediate neonatal care after cord clamping vs UCM (subgroup analysis by gestation), Outcome 27 Home oxygen.

Comparison 5 DCC with immediate neonatal care after cord clamping vs UCM (subgroup analysis by gestation), Outcome 28 Neurodevelopmental impairment at age two to three years.

Comparison 5 DCC with immediate neonatal care after cord clamping vs UCM (subgroup analysis by gestation), Outcome 29 Severe visual impairment.

Comparison 5 DCC with immediate neonatal care after cord clamping vs UCM (subgroup analysis by gestation), Outcome 30 Cerebral palsy (CP).
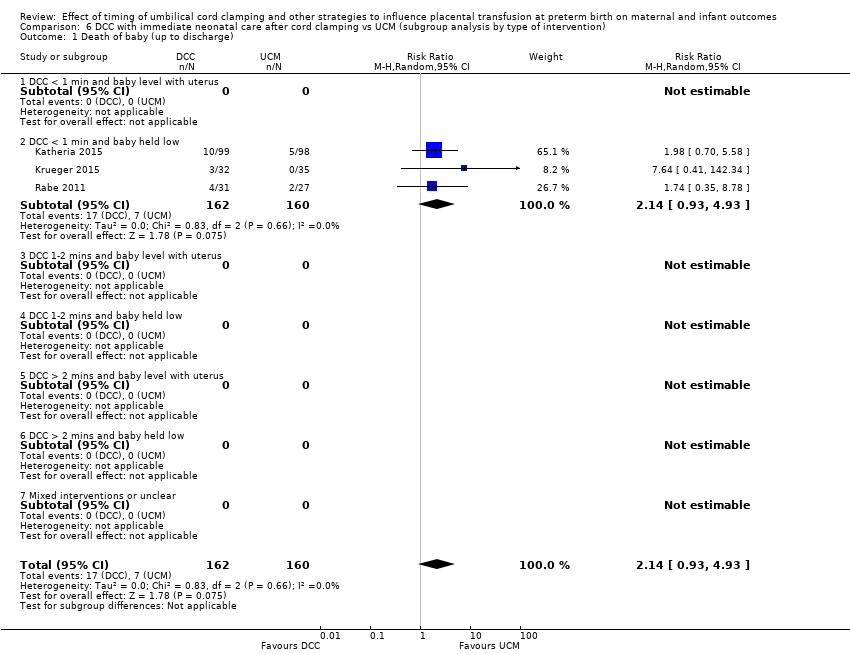
Comparison 6 DCC with immediate neonatal care after cord clamping vs UCM (subgroup analysis by type of intervention), Outcome 1 Death of baby (up to discharge).
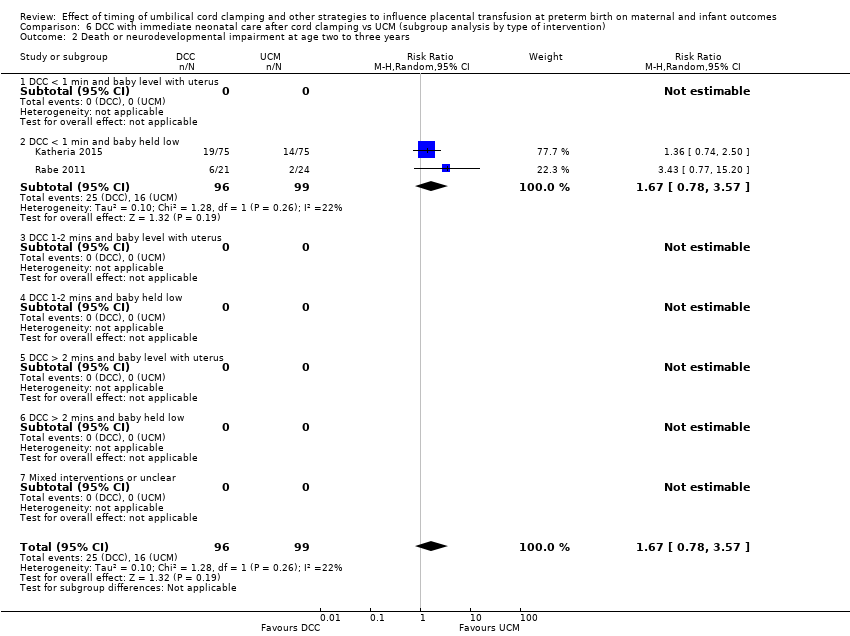
Comparison 6 DCC with immediate neonatal care after cord clamping vs UCM (subgroup analysis by type of intervention), Outcome 2 Death or neurodevelopmental impairment at age two to three years.
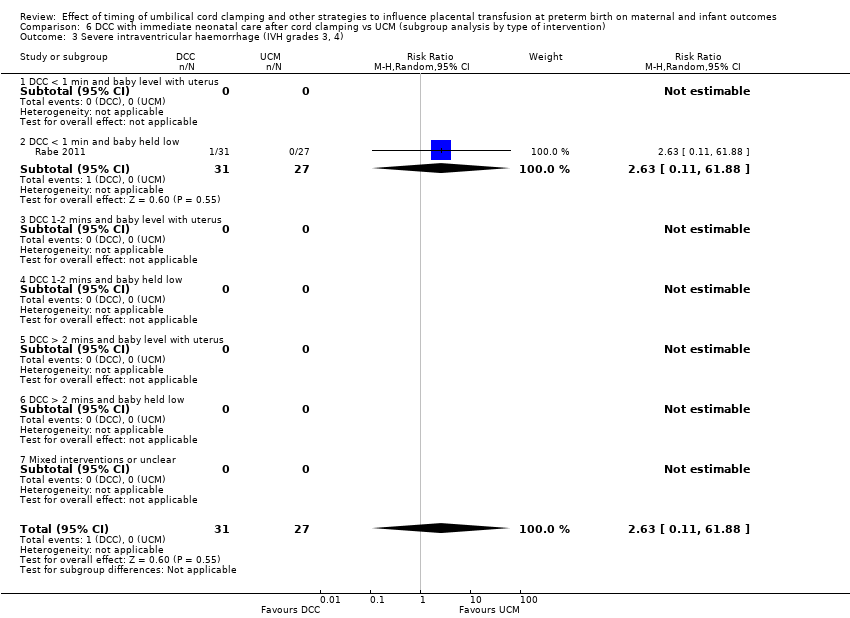
Comparison 6 DCC with immediate neonatal care after cord clamping vs UCM (subgroup analysis by type of intervention), Outcome 3 Severe intraventricular haemorrhage (IVH grades 3, 4).

Comparison 6 DCC with immediate neonatal care after cord clamping vs UCM (subgroup analysis by type of intervention), Outcome 4 Intraventricular haemorrhage (IVH, all grades).
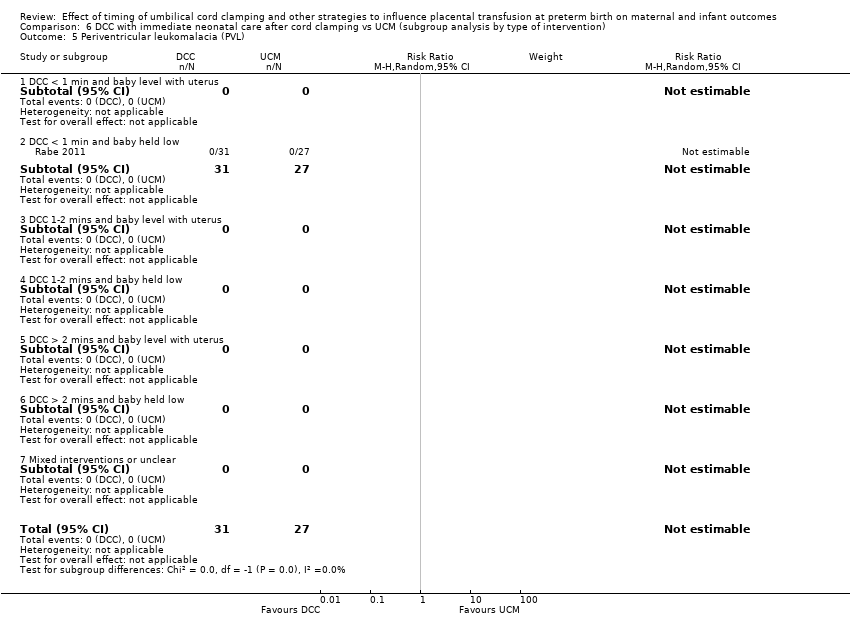
Comparison 6 DCC with immediate neonatal care after cord clamping vs UCM (subgroup analysis by type of intervention), Outcome 5 Periventricular leukomalacia (PVL).
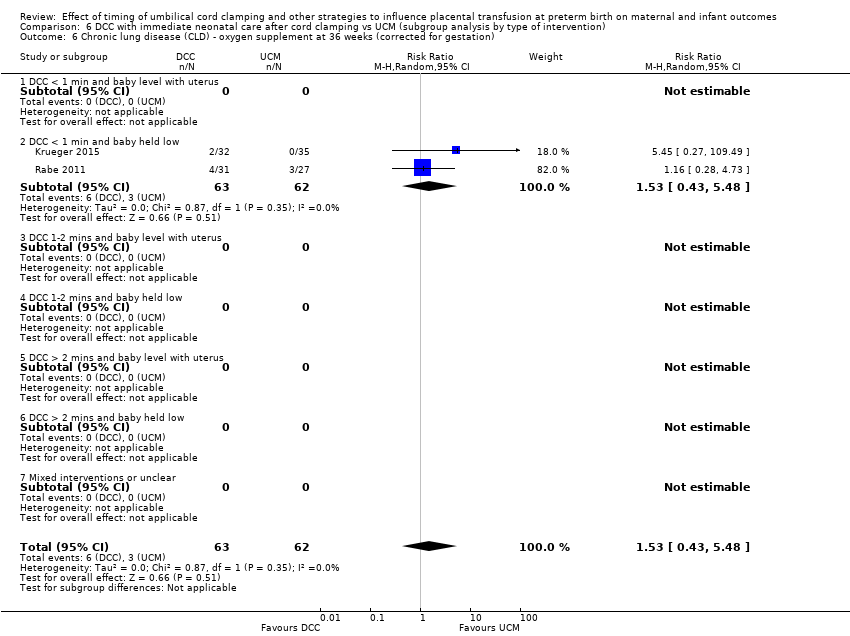
Comparison 6 DCC with immediate neonatal care after cord clamping vs UCM (subgroup analysis by type of intervention), Outcome 6 Chronic lung disease (CLD) ‐ oxygen supplement at 36 weeks (corrected for gestation).
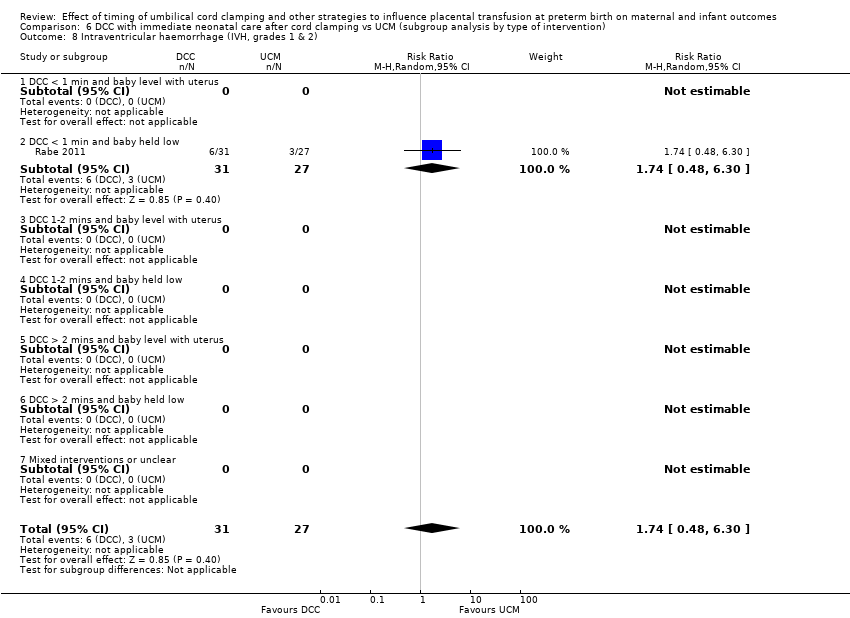
Comparison 6 DCC with immediate neonatal care after cord clamping vs UCM (subgroup analysis by type of intervention), Outcome 8 Intraventricular haemorrhage (IVH, grades 1 & 2).
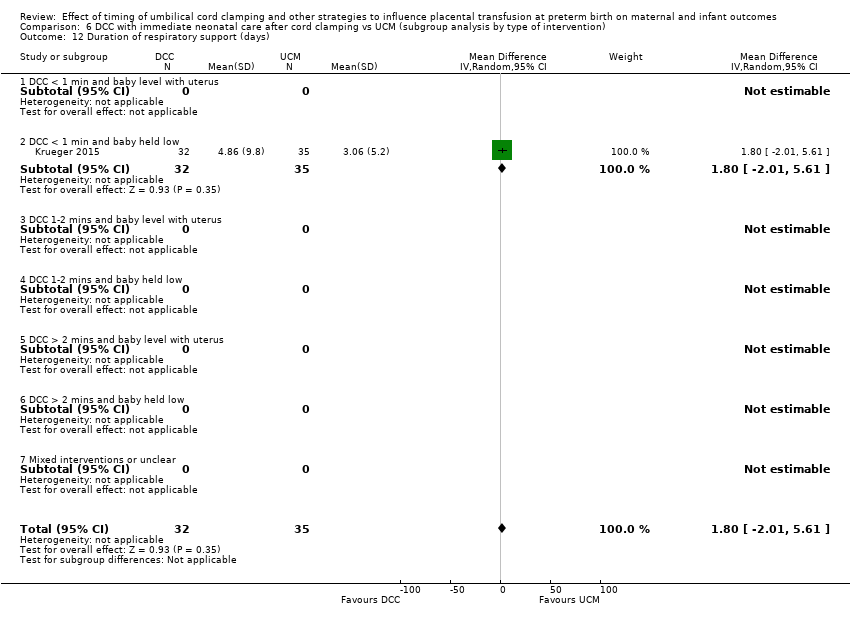
Comparison 6 DCC with immediate neonatal care after cord clamping vs UCM (subgroup analysis by type of intervention), Outcome 12 Duration of respiratory support (days).
Comparison 6 DCC with immediate neonatal care after cord clamping vs UCM (subgroup analysis by type of intervention), Outcome 13 Surfactant treatment (for severe RDS).

Comparison 6 DCC with immediate neonatal care after cord clamping vs UCM (subgroup analysis by type of intervention), Outcome 15 Treatment for Retinopathy of Prematurity (RoP).
Comparison 6 DCC with immediate neonatal care after cord clamping vs UCM (subgroup analysis by type of intervention), Outcome 19 Blood transfusion in infant.
Comparison 6 DCC with immediate neonatal care after cord clamping vs UCM (subgroup analysis by type of intervention), Outcome 21 Late sepsis (after 3 days or as defined by trialists).

Comparison 6 DCC with immediate neonatal care after cord clamping vs UCM (subgroup analysis by type of intervention), Outcome 22 Hydrocephalus.
Comparison 6 DCC with immediate neonatal care after cord clamping vs UCM (subgroup analysis by type of intervention), Outcome 24 Hb within 1st 24 hour of birth (g/dL).

Comparison 6 DCC with immediate neonatal care after cord clamping vs UCM (subgroup analysis by type of intervention), Outcome 27 Home oxygen.
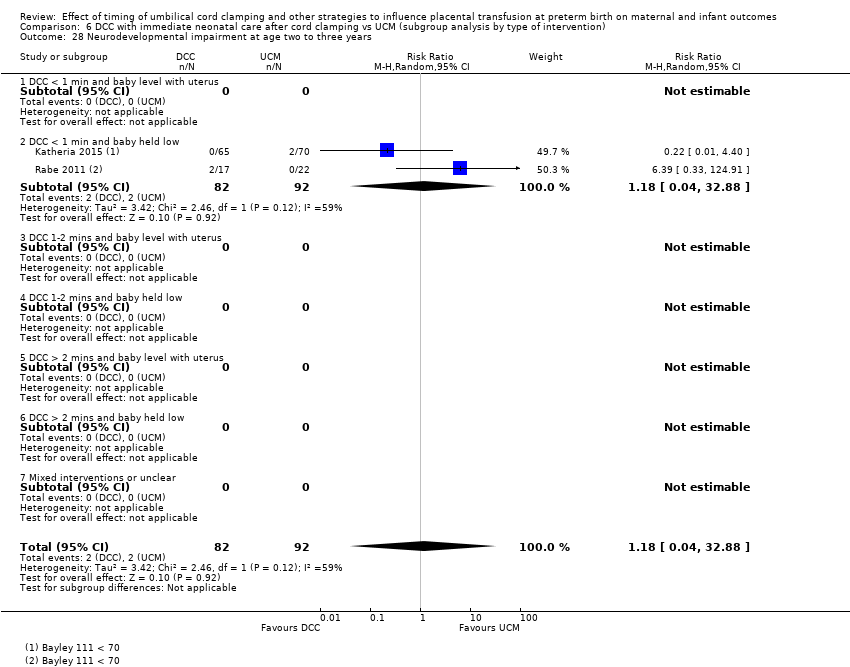
Comparison 6 DCC with immediate neonatal care after cord clamping vs UCM (subgroup analysis by type of intervention), Outcome 28 Neurodevelopmental impairment at age two to three years.
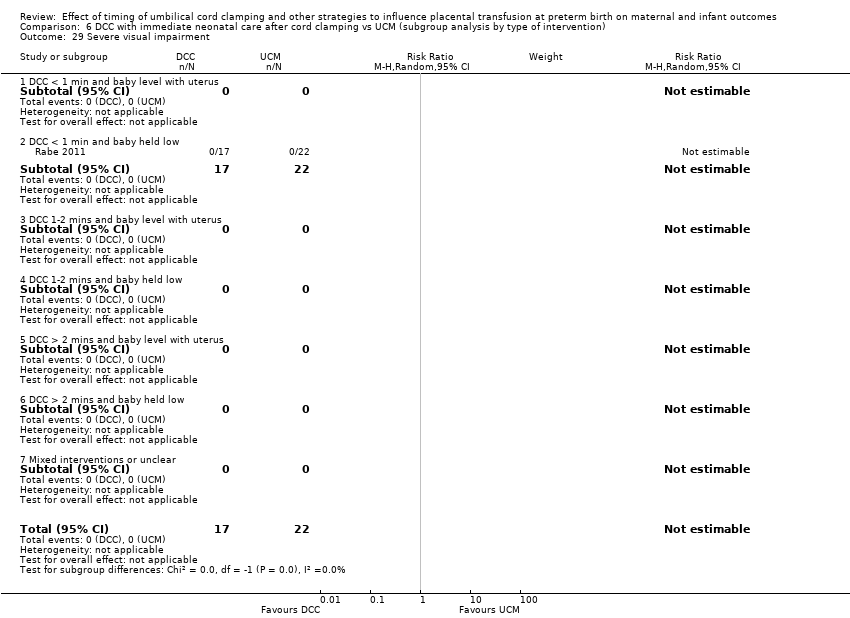
Comparison 6 DCC with immediate neonatal care after cord clamping vs UCM (subgroup analysis by type of intervention), Outcome 29 Severe visual impairment.

Comparison 6 DCC with immediate neonatal care after cord clamping vs UCM (subgroup analysis by type of intervention), Outcome 30 Cerebral palsy (CP).
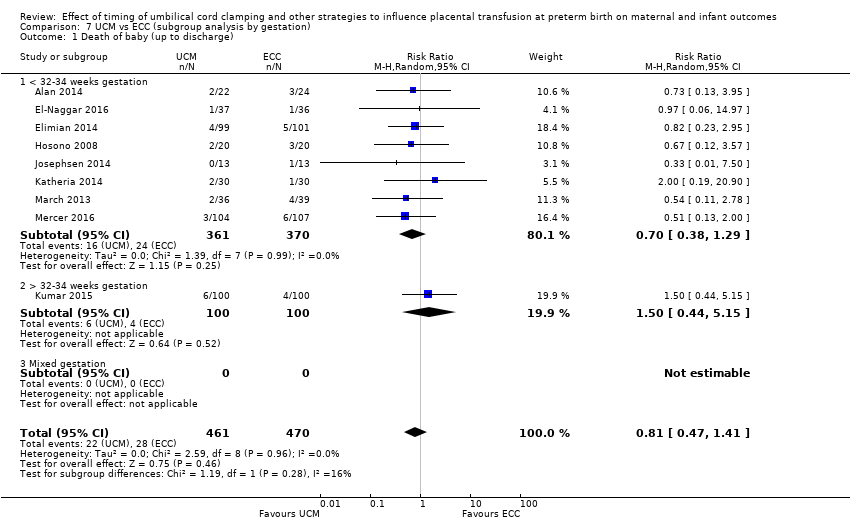
Comparison 7 UCM vs ECC (subgroup analysis by gestation), Outcome 1 Death of baby (up to discharge).
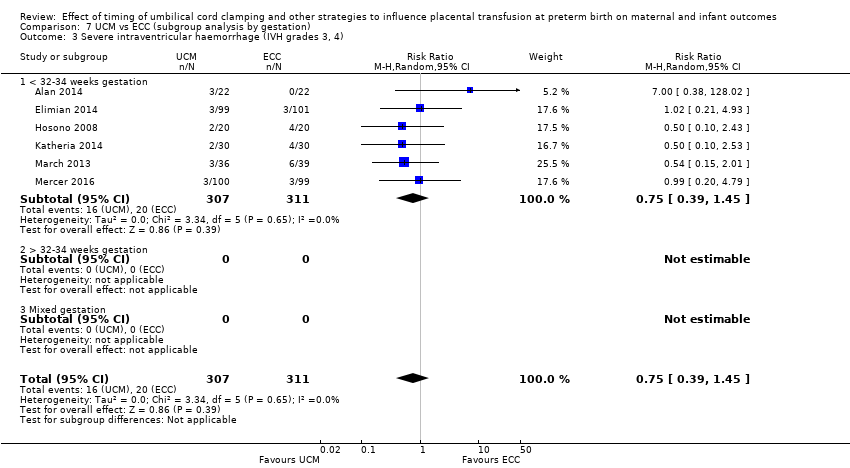
Comparison 7 UCM vs ECC (subgroup analysis by gestation), Outcome 3 Severe intraventricular haemorrhage (IVH grades 3, 4).

Comparison 7 UCM vs ECC (subgroup analysis by gestation), Outcome 4 Intraventricular haemorrhage (IVH, all grades).
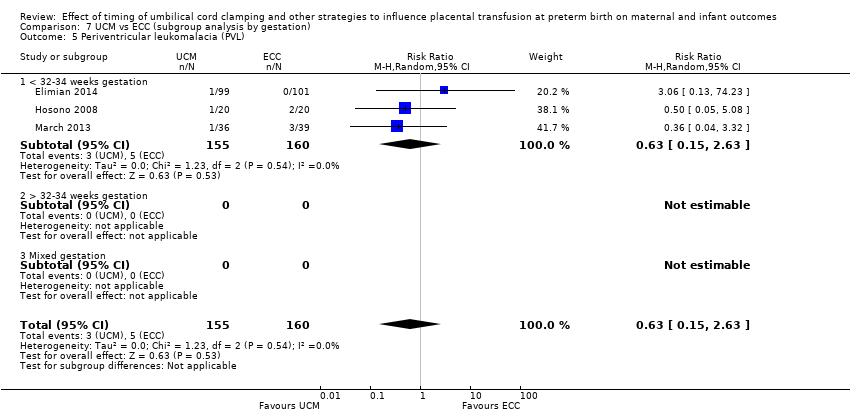
Comparison 7 UCM vs ECC (subgroup analysis by gestation), Outcome 5 Periventricular leukomalacia (PVL).
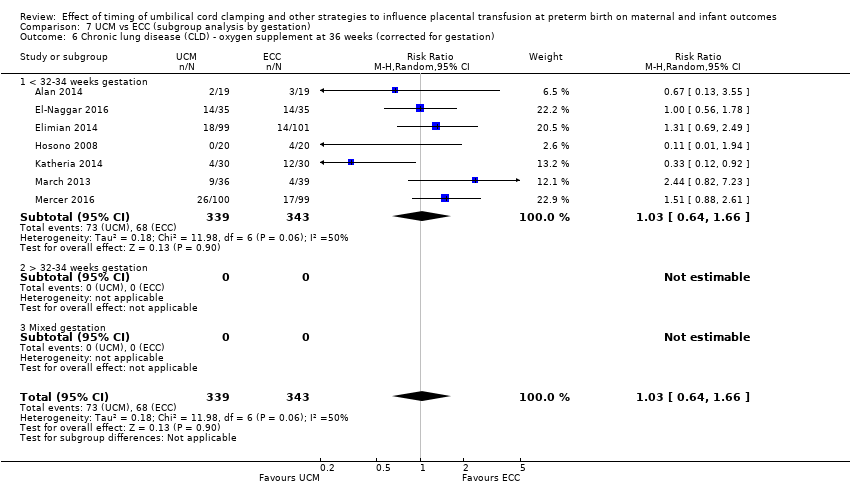
Comparison 7 UCM vs ECC (subgroup analysis by gestation), Outcome 6 Chronic lung disease (CLD) ‐ oxygen supplement at 36 weeks (corrected for gestation).

Comparison 7 UCM vs ECC (subgroup analysis by gestation), Outcome 7 Maternal blood loss of 500 mL or greater.

Comparison 7 UCM vs ECC (subgroup analysis by gestation), Outcome 8 Intraventricular haemorrhage (IVH, grades 1 & 2).

Comparison 7 UCM vs ECC (subgroup analysis by gestation), Outcome 9 Necrotising enterocolitis (NEC) confirmed by X‐ray or laparotomy).

Comparison 7 UCM vs ECC (subgroup analysis by gestation), Outcome 10 Respiratory Distress Syndrome (RDS).
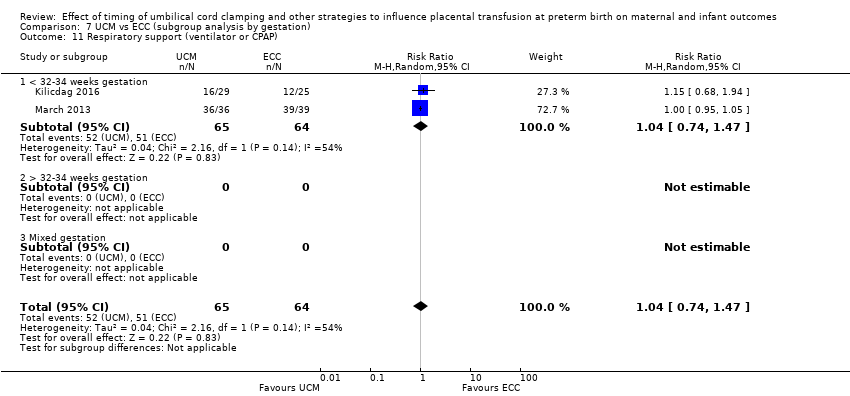
Comparison 7 UCM vs ECC (subgroup analysis by gestation), Outcome 11 Respiratory support (ventilator or CPAP).

Comparison 7 UCM vs ECC (subgroup analysis by gestation), Outcome 12 Duration of respiratory support (days).

Comparison 7 UCM vs ECC (subgroup analysis by gestation), Outcome 13 Surfactant treatment (for severe RDS).
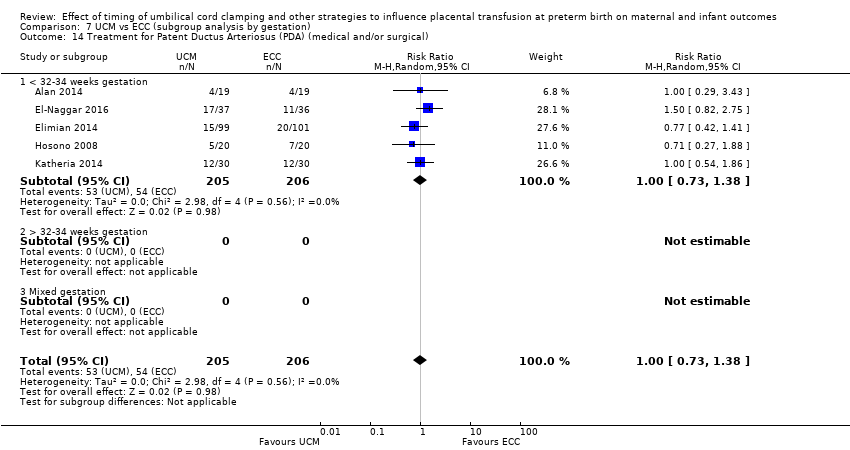
Comparison 7 UCM vs ECC (subgroup analysis by gestation), Outcome 14 Treatment for Patent Ductus Arteriosus (PDA) (medical and/or surgical).

Comparison 7 UCM vs ECC (subgroup analysis by gestation), Outcome 15 Treatment for Retinopathy of Prematurity (RoP).

Comparison 7 UCM vs ECC (subgroup analysis by gestation), Outcome 16 Hyperbilirubinemia (treated by phototherapy).

Comparison 7 UCM vs ECC (subgroup analysis by gestation), Outcome 17 Inotropics for low blood pressure.
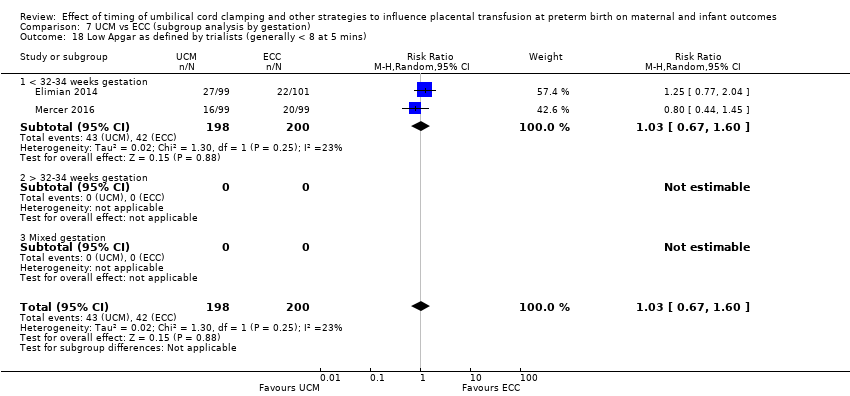
Comparison 7 UCM vs ECC (subgroup analysis by gestation), Outcome 18 Low Apgar as defined by trialists (generally < 8 at 5 mins).

Comparison 7 UCM vs ECC (subgroup analysis by gestation), Outcome 19 Blood transfusion in infant.

Comparison 7 UCM vs ECC (subgroup analysis by gestation), Outcome 20 Volume of blood transfused (mL).
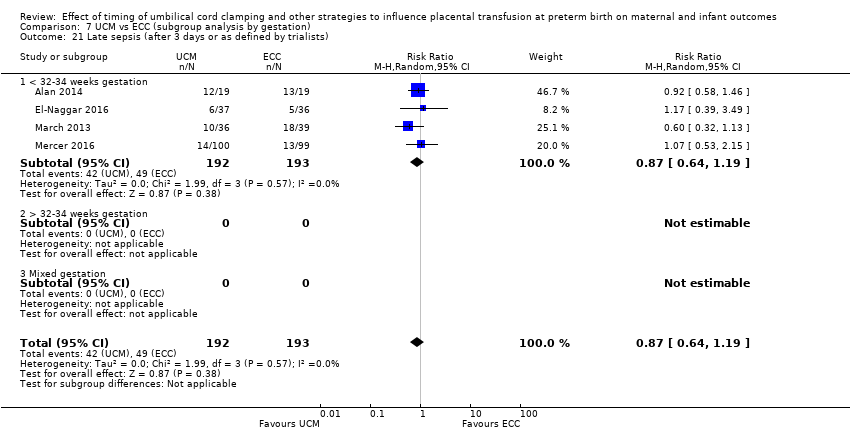
Comparison 7 UCM vs ECC (subgroup analysis by gestation), Outcome 21 Late sepsis (after 3 days or as defined by trialists).
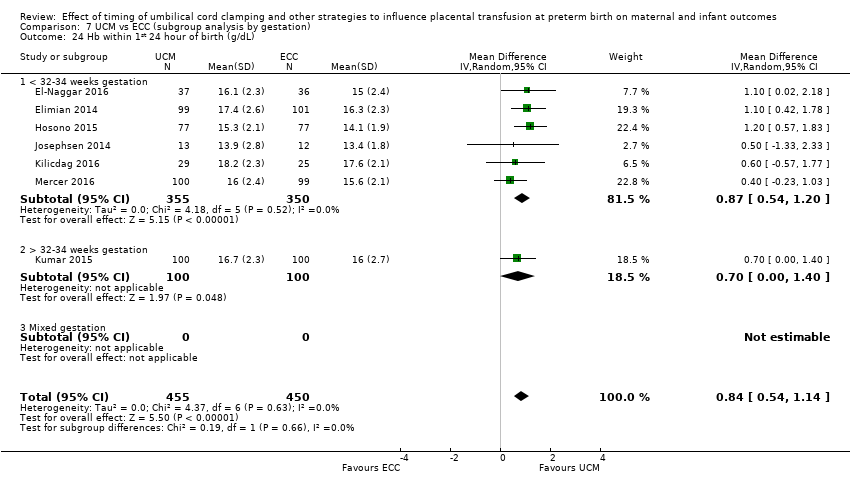
Comparison 7 UCM vs ECC (subgroup analysis by gestation), Outcome 24 Hb within 1st 24 hour of birth (g/dL).

Comparison 7 UCM vs ECC (subgroup analysis by gestation), Outcome 25 Mean arterial blood pressure.

Comparison 7 UCM vs ECC (subgroup analysis by gestation), Outcome 26 Length of infant stay in NICU (in weeks).

Comparison 7 UCM vs ECC (subgroup analysis by gestation), Outcome 27 Home oxygen.

Comparison 7 UCM vs ECC (subgroup analysis by gestation), Outcome 28 Neurodevelopmental impairment at age two to three years.

Comparison 7 UCM vs ECC (subgroup analysis by gestation), Outcome 29 Severe visual impairment.

Comparison 7 UCM vs ECC (subgroup analysis by gestation), Outcome 30 Cerebral palsy (CP).
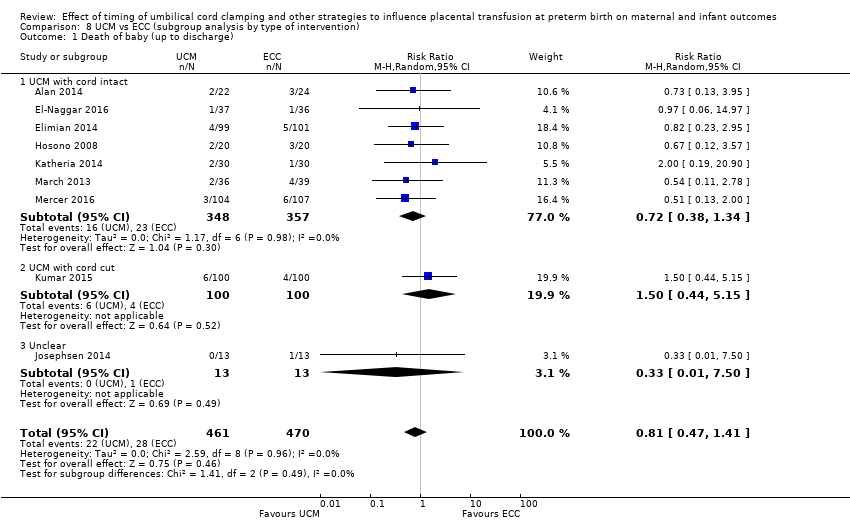
Comparison 8 UCM vs ECC (subgroup analysis by type of intervention), Outcome 1 Death of baby (up to discharge).
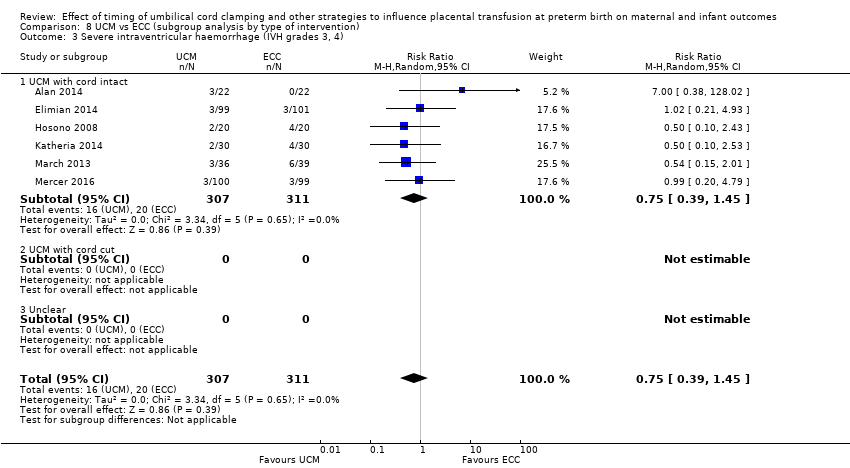
Comparison 8 UCM vs ECC (subgroup analysis by type of intervention), Outcome 3 Severe intraventricular haemorrhage (IVH grades 3, 4).
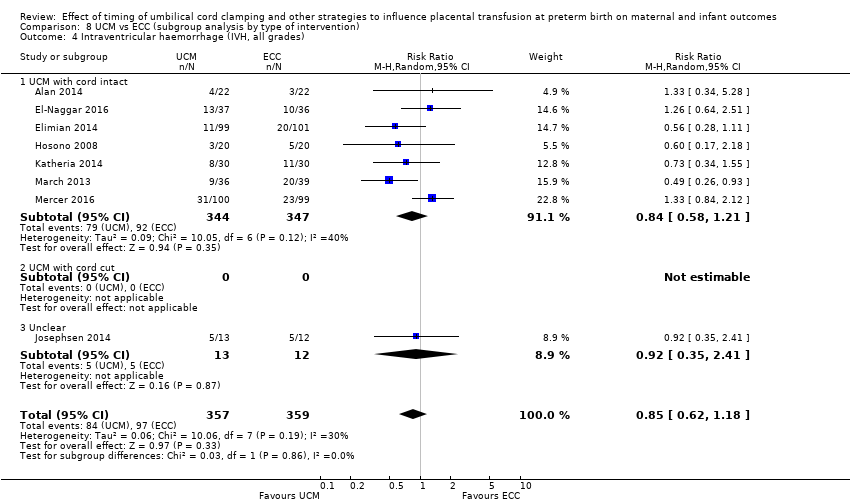
Comparison 8 UCM vs ECC (subgroup analysis by type of intervention), Outcome 4 Intraventricular haemorrhage (IVH, all grades).
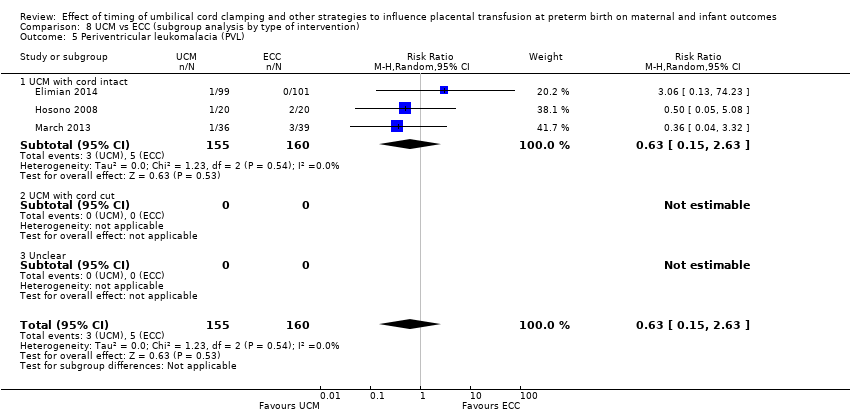
Comparison 8 UCM vs ECC (subgroup analysis by type of intervention), Outcome 5 Periventricular leukomalacia (PVL).
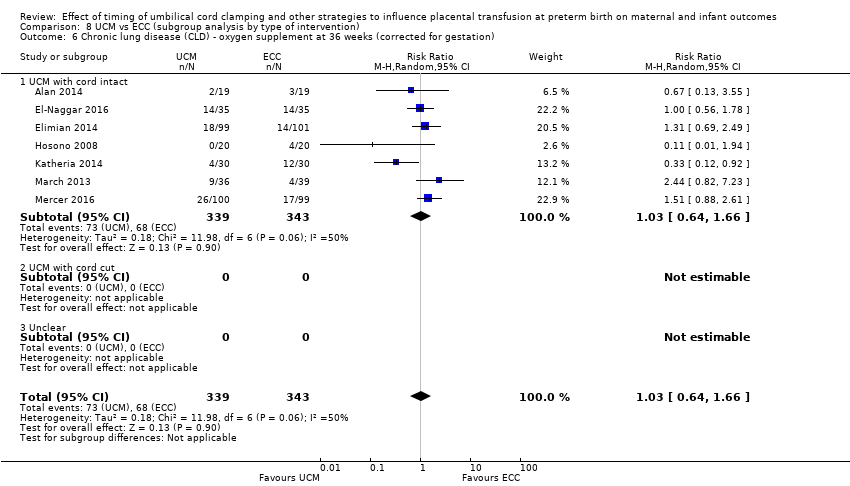
Comparison 8 UCM vs ECC (subgroup analysis by type of intervention), Outcome 6 Chronic lung disease (CLD) ‐ oxygen supplement at 36 weeks (corrected for gestation).
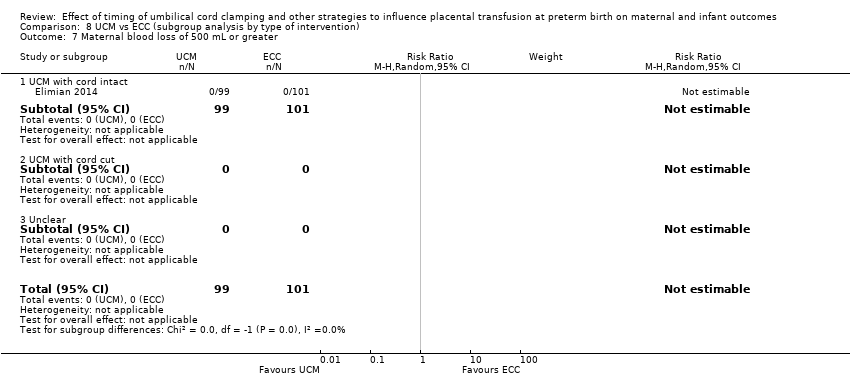
Comparison 8 UCM vs ECC (subgroup analysis by type of intervention), Outcome 7 Maternal blood loss of 500 mL or greater.
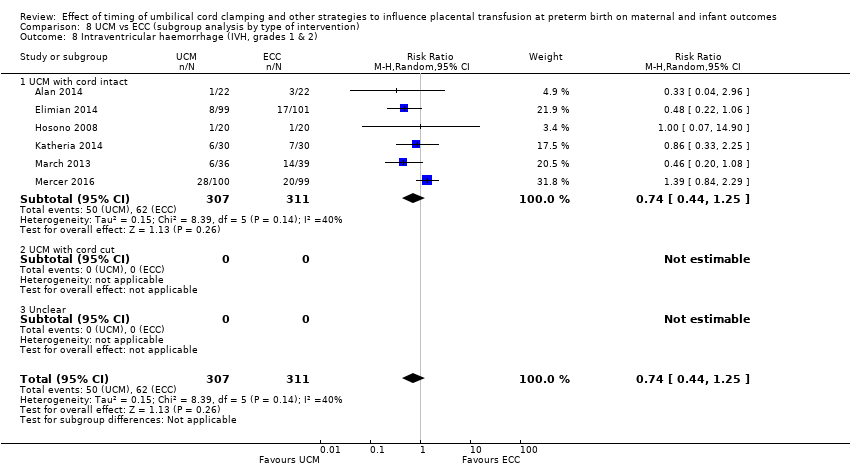
Comparison 8 UCM vs ECC (subgroup analysis by type of intervention), Outcome 8 Intraventricular haemorrhage (IVH, grades 1 & 2).

Comparison 8 UCM vs ECC (subgroup analysis by type of intervention), Outcome 9 Necrotising enterocolitis (NEC) confirmed by X‐ray or laparotomy).

Comparison 8 UCM vs ECC (subgroup analysis by type of intervention), Outcome 10 Respiratory Distress Syndrome (RDS).

Comparison 8 UCM vs ECC (subgroup analysis by type of intervention), Outcome 11 Respiratory support (ventilator or CPAP).

Comparison 8 UCM vs ECC (subgroup analysis by type of intervention), Outcome 12 Duration of respiratory support (days).

Comparison 8 UCM vs ECC (subgroup analysis by type of intervention), Outcome 13 Surfactant treatment (for severe RDS).

Comparison 8 UCM vs ECC (subgroup analysis by type of intervention), Outcome 14 Treatment for Patent Ductus Arteriosus (PDA) (medical and/or surgical).
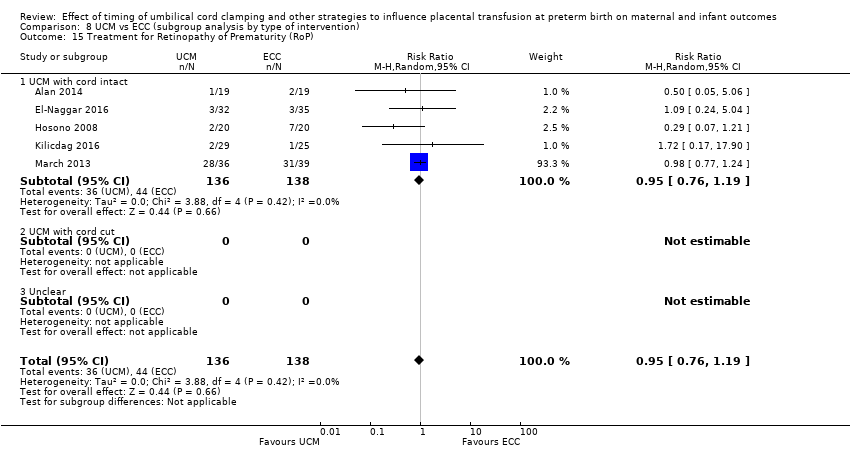
Comparison 8 UCM vs ECC (subgroup analysis by type of intervention), Outcome 15 Treatment for Retinopathy of Prematurity (RoP).

Comparison 8 UCM vs ECC (subgroup analysis by type of intervention), Outcome 16 Hyperbilirubinemia (treated by phototherapy).
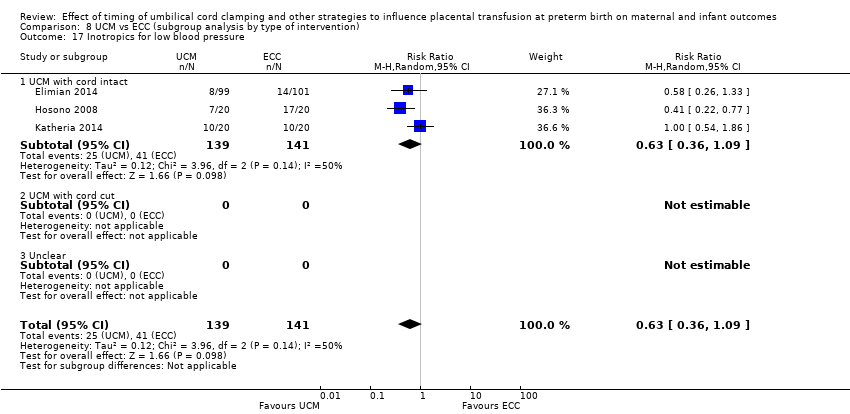
Comparison 8 UCM vs ECC (subgroup analysis by type of intervention), Outcome 17 Inotropics for low blood pressure.

Comparison 8 UCM vs ECC (subgroup analysis by type of intervention), Outcome 18 Low Apgar as defined by trialists (generally < 8 at 5 mins).
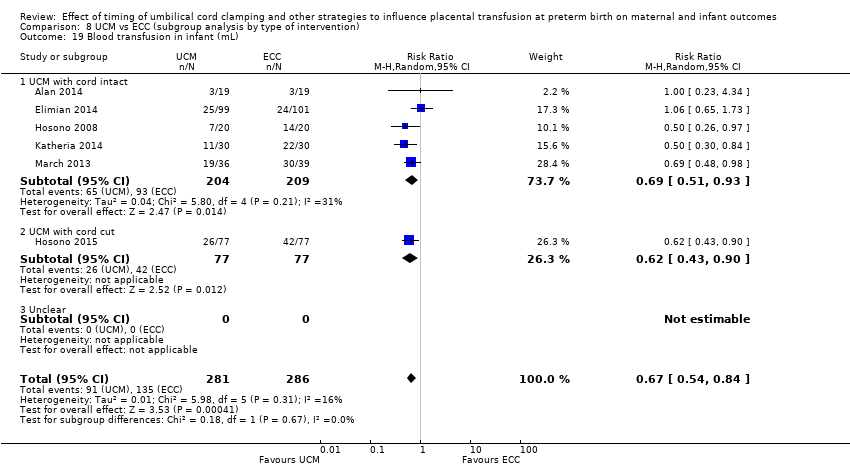
Comparison 8 UCM vs ECC (subgroup analysis by type of intervention), Outcome 19 Blood transfusion in infant (mL).
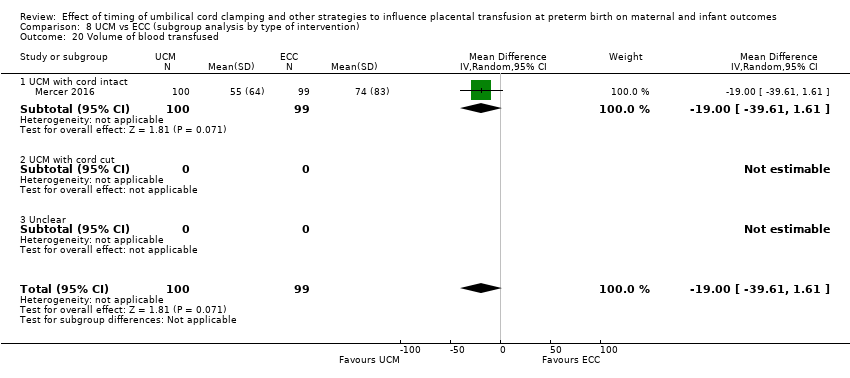
Comparison 8 UCM vs ECC (subgroup analysis by type of intervention), Outcome 20 Volume of blood transfused.

Comparison 8 UCM vs ECC (subgroup analysis by type of intervention), Outcome 21 Late sepsis (after 3 days or as defined by trialists).

Comparison 8 UCM vs ECC (subgroup analysis by type of intervention), Outcome 24 Hb within 1st 24 hour of birth (g/dL).

Comparison 8 UCM vs ECC (subgroup analysis by type of intervention), Outcome 25 Mean arterial blood pressure (subgrouped by time after birth).
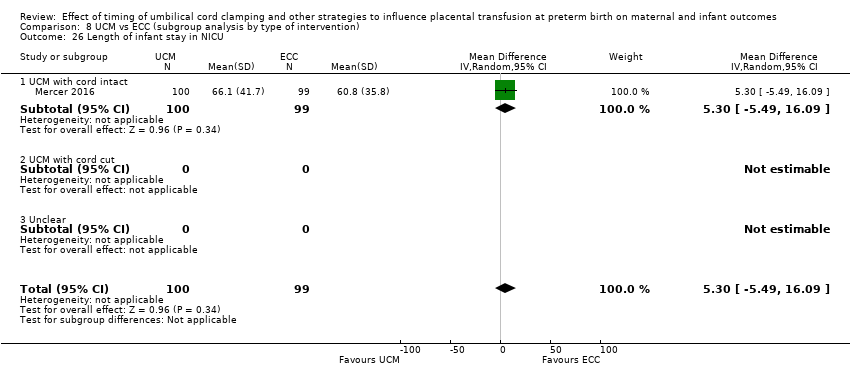
Comparison 8 UCM vs ECC (subgroup analysis by type of intervention), Outcome 26 Length of infant stay in NICU.
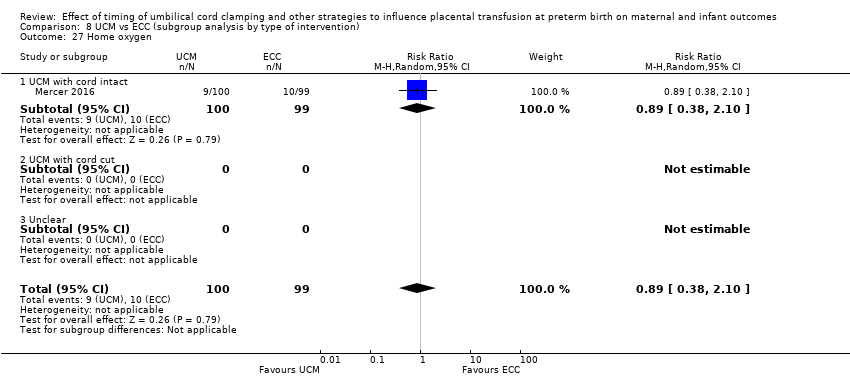
Comparison 8 UCM vs ECC (subgroup analysis by type of intervention), Outcome 27 Home oxygen.

Comparison 8 UCM vs ECC (subgroup analysis by type of intervention), Outcome 28 Neurodevelopmental impairment at age two to three years.

Comparison 8 UCM vs ECC (subgroup analysis by type of intervention), Outcome 29 Severe visual impairment.
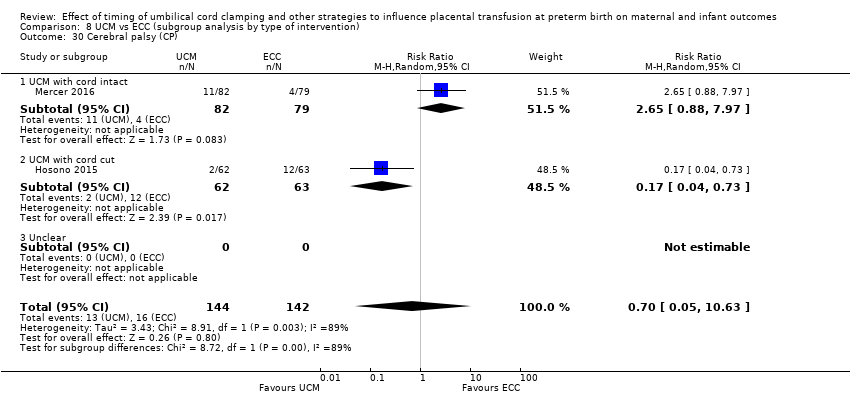
Comparison 8 UCM vs ECC (subgroup analysis by type of intervention), Outcome 30 Cerebral palsy (CP).
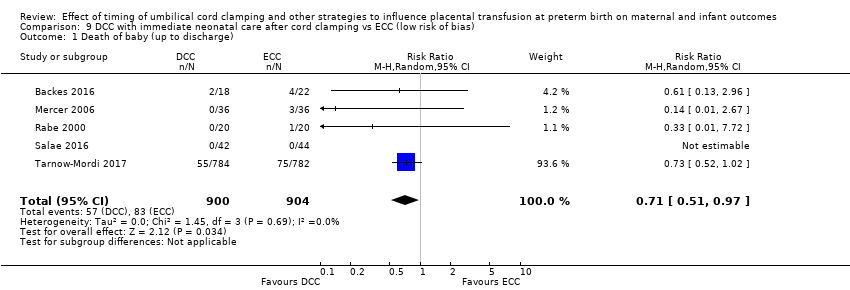
Comparison 9 DCC with immediate neonatal care after cord clamping vs ECC (low risk of bias), Outcome 1 Death of baby (up to discharge).

Comparison 9 DCC with immediate neonatal care after cord clamping vs ECC (low risk of bias), Outcome 3 Severe intraventricular haemorrhage (IVH grades 3, 4).

Comparison 9 DCC with immediate neonatal care after cord clamping vs ECC (low risk of bias), Outcome 4 Intraventricular haemorrhage (IVH, all grades).
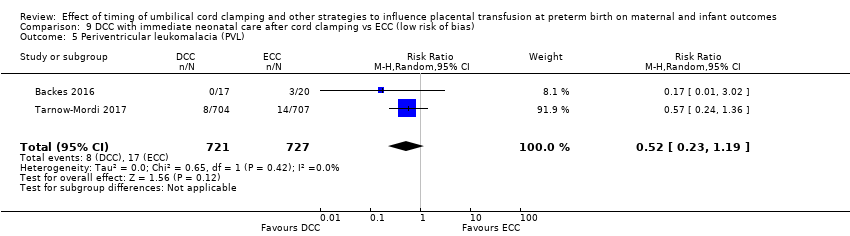
Comparison 9 DCC with immediate neonatal care after cord clamping vs ECC (low risk of bias), Outcome 5 Periventricular leukomalacia (PVL).
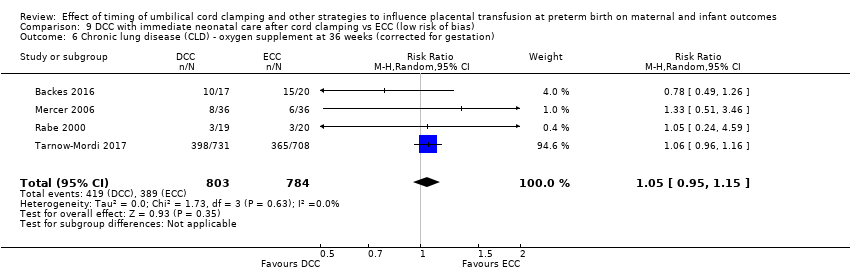
Comparison 9 DCC with immediate neonatal care after cord clamping vs ECC (low risk of bias), Outcome 6 Chronic lung disease (CLD) ‐ oxygen supplement at 36 weeks (corrected for gestation).
Comparison 9 DCC with immediate neonatal care after cord clamping vs ECC (low risk of bias), Outcome 7 Maternal blood loss of 500 mL or greater.

Comparison 10 DCC with immediate neonatal care with cord intact vs ECC (low risk of bias), Outcome 1 Death of baby (up to discharge).

Comparison 10 DCC with immediate neonatal care with cord intact vs ECC (low risk of bias), Outcome 2 Death or neurodevelopmental impairment in early years.

Comparison 10 DCC with immediate neonatal care with cord intact vs ECC (low risk of bias), Outcome 3 Severe intraventricular haemorrhage (IVH grades 3, 4).

Comparison 10 DCC with immediate neonatal care with cord intact vs ECC (low risk of bias), Outcome 4 Intraventricular haemorrhage (IVH, all grades).
Comparison 10 DCC with immediate neonatal care with cord intact vs ECC (low risk of bias), Outcome 5 Periventricular leukomalacia (PVL).

Comparison 10 DCC with immediate neonatal care with cord intact vs ECC (low risk of bias), Outcome 6 Chronic lung disease (CLD) ‐ oxygen supplement at 36 weeks (corrected for gestation).
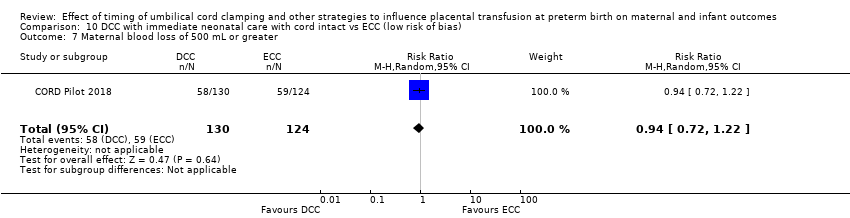
Comparison 10 DCC with immediate neonatal care with cord intact vs ECC (low risk of bias), Outcome 7 Maternal blood loss of 500 mL or greater.
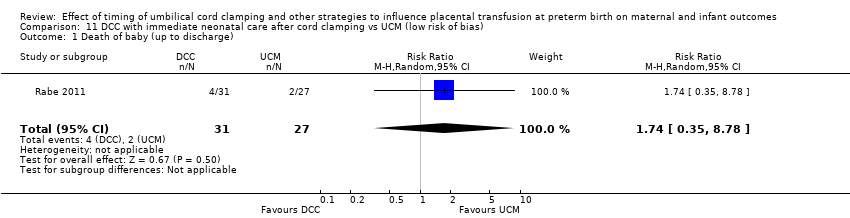
Comparison 11 DCC with immediate neonatal care after cord clamping vs UCM (low risk of bias), Outcome 1 Death of baby (up to discharge).

Comparison 11 DCC with immediate neonatal care after cord clamping vs UCM (low risk of bias), Outcome 2 Death or neurodevelopmental impairment in early years.
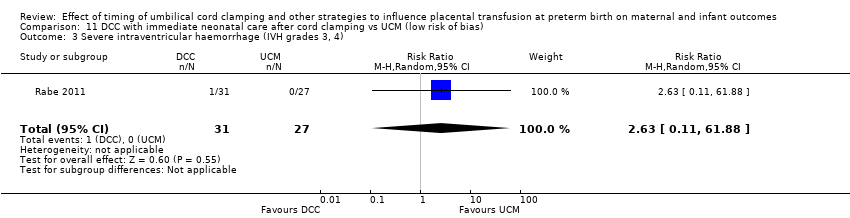
Comparison 11 DCC with immediate neonatal care after cord clamping vs UCM (low risk of bias), Outcome 3 Severe intraventricular haemorrhage (IVH grades 3, 4).

Comparison 11 DCC with immediate neonatal care after cord clamping vs UCM (low risk of bias), Outcome 4 Intraventricular haemorrhage (IVH, all grades).

Comparison 11 DCC with immediate neonatal care after cord clamping vs UCM (low risk of bias), Outcome 5 Periventricular leukomalacia (PVL).
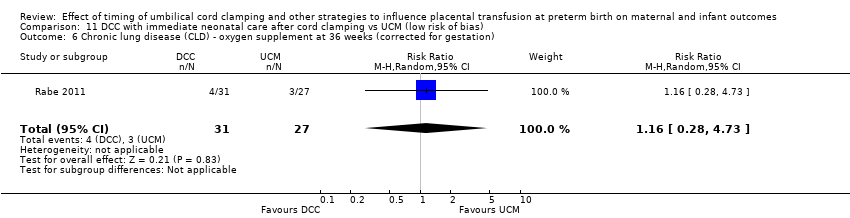
Comparison 11 DCC with immediate neonatal care after cord clamping vs UCM (low risk of bias), Outcome 6 Chronic lung disease (CLD) ‐ oxygen supplement at 36 weeks (corrected for gestation).
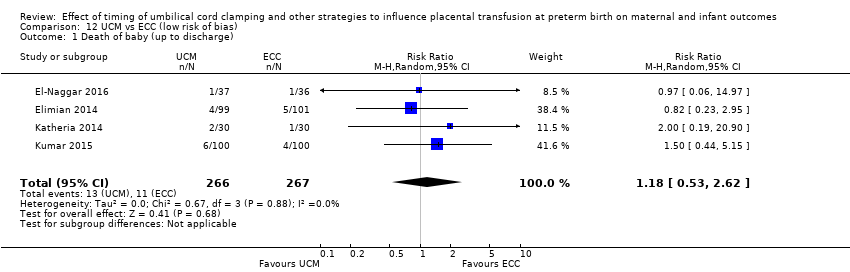
Comparison 12 UCM vs ECC (low risk of bias), Outcome 1 Death of baby (up to discharge).

Comparison 12 UCM vs ECC (low risk of bias), Outcome 3 Severe intraventricular haemorrhage (IVH grades 3, 4).

Comparison 12 UCM vs ECC (low risk of bias), Outcome 4 Intraventricular haemorrhage (IVH, all grades).
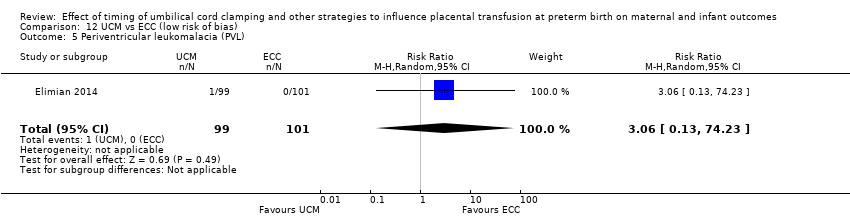
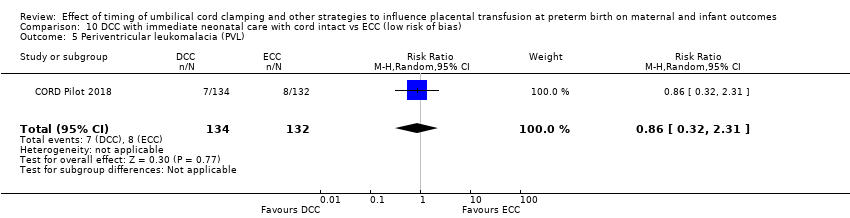
Comparison 12 UCM vs ECC (low risk of bias), Outcome 5 Periventricular leukomalacia (PVL).

Comparison 12 UCM vs ECC (low risk of bias), Outcome 6 Chronic lung disease (CLD) ‐ oxygen supplement at 36 weeks (corrected for gestation).
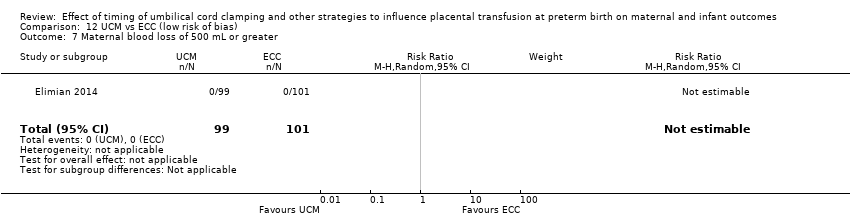
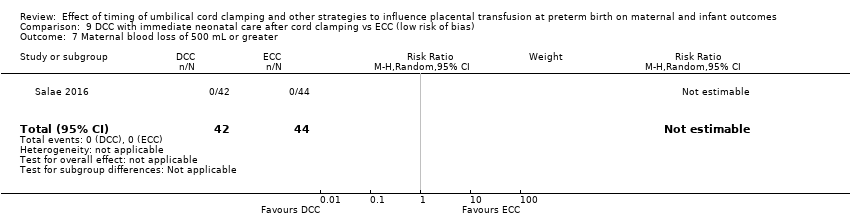
Comparison 12 UCM vs ECC (low risk of bias), Outcome 7 Maternal blood loss of 500 mL or greater.
| DCC with immediate neonatal care after cord clamping compared to ECC (subgroup analysis by gestation) for health problem or population | ||||||
| Patient or population: babies born preterm, and their mothers | ||||||
| Outcomes | Anticipated absolute effects* (95% CI) | Relative effect | № of participants | Certainty of the evidence | Comments | |
| Risk with ECC (subgroup analysis by gestation) | Risk with DCC with immediate neonatal care after cord clamping | |||||
| Death of baby (up to discharge) | Study population | RR 0.73 | 2680 | ⊕⊕⊕⊝ | ||
| 74 per 1000 | 54 per 1000 | |||||
| Death or neurodevelopmental impairment in early years | Study population | ‐ | (0 studies) | ‐ | ||
| see comment | see comment | |||||
| Severe intraventricular haemorrhage (IVH grades 3, 4) | Study population | RR 0.94 | 2058 | ⊕⊕⊝⊝ | ||
| 48 per 1000 | 45 per 1000 | |||||
| Intraventricular haemorrhage (IVH, all grades) | Study population | RR 0.83 | 2333 | ⊕⊕⊕⊕ | ||
| 187 per 1000 | 155 per 1000 | |||||
| Periventricular leukomalacia (PVL) | Study population | RR 0.58 | 1544 | ⊕⊕⊝⊝ | ||
| 22 per 1000 | 13 per 1000 | |||||
| Chronic lung disease (CLD) ‐ oxygen supplement at 36 weeks (corrected for gestation) | Study population | RR 1.04 | 1644 | ⊕⊕⊕⊕ | ||
| 494 per 1000 | 514 per 1000 | |||||
| Maternal blood loss of 500 mL or greater | Study population | RR 1.14 | 180 | ⊕⊝⊝⊝ | ||
| 11 per 1000 | 12 per 1000 | |||||
| *The risk in the intervention group (and its 95% confidence interval) is based on the assumed risk in the comparison group and the relative effect of the intervention (and its 95% CI). | ||||||
| GRADE Working Group grades of evidence | ||||||
| 1 Although many of the included studies have unclear risk of bias, the large trial which provided 80% of the data is low risk of bias. No downgrade. 2 Number of participants = 2680 and OIS > 11,000 (ref Tarnow‐Mordi 2017); number of events 171 less than the 300 calculated for confidence in findings; upper confidence interval close to the line of no difference. Downgrade 1. 3 25% of data comes from studies where the risk of bias is unclear or high, however, the large study which provides 70% of data are low risk of bias. No downgrade. 4 Number of participants 2083; number of events 86 (< 300 generally required); CI crosses line of no difference. Downgrade 2. 5 78% of data coming from studies of low risk of bias including the large study which is of low risk of bias. No downgrade. 6 Number of participants 2333; number of events 409. No downgrade. 7 Number of participants 1544 and number of events 26 (well below generally required 300). Downgrade 2. 8 98% of data comes from trials of low risk of selection bias, including 1 large well‐conducted trial. No downgrade. 9 Although Selection bias is low risk of bias, incomplete outcome data is high risk of bias. Downgrade 1. 10 Only 180 women and 2 events. Downgrade 2. | ||||||
| DCC with immediate neonatal care with cord intact compared to ECC in babies born preterm | ||||||
| Patient or population: babies born preterm, and their mothers | ||||||
| Outcomes | Anticipated absolute effects* (95% CI) | Relative effect | № of participants | Certainty of the evidence | Comments | |
| Risk with ECC (subgroup analysis by gestation) | Risk with DCC with immediate neonatal care with cord intact | |||||
| Death of baby (up to discharge) | Study population | RR 0.47 | 270 | ⊕⊕⊝⊝ | ||
| 111 per 1000 | 52 per 1000 | |||||
| Death or neurodevelopmental impairment at age 2 to 3 years | Study population | RR 0.61 | 218 | ⊕⊕⊝⊝ | ||
| 340 per 1000 | 207 per 1000 | |||||
| Severe intraventricular haemorrhage (IVH grades 3, 4) | Study population | RR 0.84 | 266 | ⊕⊕⊝⊝ | ||
| 53 per 1000 | 45 per 1000 | |||||
| Intraventricular haemorrhage (IVH, all grades) | Study population | RR 0.90 | 266 | ⊕⊕⊝⊝ | ||
| 356 per 1000 | 320 per 1000 | |||||
| Periventricular leukomalacia (PVL) | Study population | RR 0.86 | 266 | ⊕⊕⊝⊝ | ||
| 61 per 1000 | 52 per 1000 | |||||
| Chronic lung disease (CLD) ‐ oxygen supplement at 36 weeks (corrected for gestation) | Study population | RR 0.95 | 249 | ⊕⊕⊝⊝ | ||
| 325 per 1000 | 309 per 1000 | |||||
| Maternal blood loss of 500 mL or greater | Study population | RR 0.94 | 254 | ⊕⊕⊝⊝ | ||
| 476 per 1000 | 447 per 1000 | |||||
| *The risk in the intervention group (and its 95% confidence interval) is based on the assumed risk in the comparison group and the relative effect of the intervention (and its 95% CI). | ||||||
| GRADE Working Group grades of evidence | ||||||
| 1 Only one small study (N = 270); wide CI crossing line of no effect and very few events (n = 22). Downgrade 2. 2 Only one small study (N = 218); wide CI crossing line of no effect and very few events (n = 59). Downgrade 2. 3 Only one small study (N = 266); wide CI crossing line of no effect and very few events (n = 13). Downgrade 2. 4 Only one small study (N = 266); wide CI crossing line of no effect and few events (n = 90). Downgrade 2. 5 Only one small study (N = 266); wide CI crossing line of no effect and very few events (n = 15). Downgrade 2. 6 Only one small study (N = 249); wide CI crossing line of no effect and few events (n = 79). Downgrade 2. 7 High risk of bias through not being able to blind clinicians or women and this outcome. Downgrade 1. 8 Only one small study (N = 254); wide CI crossing line of no effect and few events (n = 117). Downgrade 1. | ||||||
| DCC with immediate neonatal care after cord clamping compared to UCM in babies born preterm | ||||||
| Patient or population: babies born preterm, and their mothers | ||||||
| Outcomes | Anticipated absolute effects* (95% CI) | Relative effect | № of participants | Certainty of the evidence | Comments | |
| Risk with UCM (subgroup analysis by gestation) | Risk with DCC with immediate neonatal care after cord clamping | |||||
| Death of baby (up to discharge) | Study population | RR 2.14 | 322 | ⊕⊕⊝⊝ | ||
| 44 per 1000 | 94 per 1000 | |||||
| Death or neurodevelopmental impairment at age 2 to 3 years | Study population | RR 1.67 | 195 | ⊕⊝⊝⊝ | ||
| 162 per 1000 | 270 per 1000 | |||||
| Severe intraventricular haemorrhage (IVH grades 3, 4) | Study population | RR 2.63 | 58 | ⊕⊕⊝⊝ | ||
| 0 per 1000 | 0 per 1000 | |||||
| Intraventricular haemorrhage (IVH, all grades) | Study population | RR 1.32 | 125 | ⊕⊝⊝⊝ | ||
| 129 per 1000 | 170 per 1000 | |||||
| Periventricular leukomalacia (PVL) | Study population | not estimable | 58 | ⊕⊕⊝⊝ | ||
| 0 per 1000 | 0 per 1000 | |||||
| Chronic lung disease (CLD) ‐ oxygen supplement at 36 weeks (corrected for gestation) | Study population | RR 1.53 | 125 | ⊕⊕⊝⊝ | ||
| 48 per 1000 | 74 per 1000 | |||||
| Maternal blood loss of 500 mL or greater | Study population | ‐ | (0 studies) | ‐ | ||
| see comment | see comment | |||||
| *The risk in the intervention group (and its 95% confidence interval) is based on the assumed risk in the comparison group and the relative effect of the intervention (and its 95% CI). | ||||||
| GRADE Working Group grades of evidence | ||||||
| 1 Risk of bias: two out of three studies were low risk of bias for sequence generation, allocation concealment and incomplete outcome data and provided over 90% of data. No downgrade. 2 Imprecision: small number of participants (N = 322); very few events (n = 24) and wide 95% CI crossing line of no difference. Downgrade 2. 3 One study providing over 70% of data was high risk of attrition bias and selective outcome reporting bias. Downgrade 1. 4 Wide CI crossing line of no difference, small number of participants (N = 195) and few events (n = 41). Downgrade 2. 5 One small study ‐ low risk of bias. No downgrade. 6 Small sample size (N = 58), only 1 event and wide 95% CI crossing line of no difference. Downgrade 2. 7 One study providing over 50% of data was unclear for selection bias. Downgrade 1. 8 Small sample size (N = 125), few events (n = 19) and wide 95% CI crossing line of no difference. Downgrade 2. 9 Risk of bias: low for sequence generation, allocation concealment and incomplete outcome data. No downgrade. 10 Imprecision: small sample size (N = 58) and no events. Downgrade 2. 11 One study provided 82% of the data were assessed as low risk of bias. No downgrade. 12 Small sample size (N = 125), very few events (n = 9) and wide 95% CI crossing line of no difference. Downgrade 2. | ||||||
| UCM compared to ECC in babies born preterm | ||||||
| Patient or population: babies born preterm, and their mothers. | ||||||
| Outcomes | Anticipated absolute effects* (95% CI) | Relative effect | № of participants | Certainty of the evidence | Comments | |
| Risk with ECC (subgroup analysis by gestation) | Risk with UCM | |||||
| Death of baby (up to discharge) | Study population | RR 0.81 | 931 | ⊕⊕⊝⊝ | ||
| 60 per 1000 | 48 per 1000 | |||||
| Death or neurodevelopmental impairment at age 2 to 3 years | Study population | ‐ | (0 studies) | ‐ | ||
| see comment | see comment | |||||
| Severe intraventricular haemorrhage (IVH grades 3, 4) | Study population | RR 0.75 | 618 | ⊕⊕⊝⊝ | ||
| 64 per 1000 | 48 per 1000 | |||||
| Intraventricular haemorrhage (IVH, all grades) | Study population | RR 0.85 | 716 | ⊕⊕⊕⊝ | ||
| 270 per 1000 | 230 per 1000 | |||||
| Periventricular leukomalacia (PVL) | Study population | RR 0.63 | 315 | ⊕⊕⊝⊝ | ||
| 31 per 1000 | 20 per 1000 | |||||
| Chronic lung disease (CLD) ‐ oxygen supplement at 36 weeks (corrected for gestation) | Study population | RR 1.03 | 682 | ⊕⊕⊝⊝ | ||
| 198 per 1000 | 204 per 1000 | |||||
| Maternal blood loss of 500 mL or greater | Study population | not estimable | 200 | ⊕⊕⊝⊝ | ||
| 0 per 1000 | 0 per 1000 | |||||
| *The risk in the intervention group (and its 95% confidence interval) is based on the assumed risk in the comparison group and the relative effect of the intervention (and its 95% CI). | ||||||
| GRADE Working Group grades of evidence | ||||||
| 1 Five out of nine studies were low risk of selection bias and provided over 50% of data. No downgrade. 2 Not many events (n = 50) out of 931 babies, and wide 95% CI crossing line of no difference. Downgraded 2 3 Three out of six studies were low risk of selection bias and provided over 50% of data. No downgrade 4 Not a large sample size (N = 618), few events (n = 36) and wide 95% CI crossing line of no difference. Downgrade 2. 5 Four out of eight studies were low risk of selection bias and contributed over 50% of data. No downgrade 6 Wide CI crossing line of no difference. Not a large sample size (N = 716). 181 events. Downgrade 1. 7 Two out of three studies were low risk of selection bias and provided over 60% of data. No downgrade. 8 Small sample size (N = 315), very few events (n = 8) and wide 95% CI crossing line of no difference. Downgrade 2. 9 Four out of seven studies were low risk of selection bias and provided over 60% of data. No downgrade. 10 Heterogeneity I2 = 50%. Downgrade 1. 11 Wide CI crossing line of no difference. Not a large sample size (N = 682). 141 events. Downgrade 1. 12 Risk of bias: low for sequence generation, allocation concealment and incomplete outcome data. No downgrade. 13 Imprecision: small sample size (N = 200) and no events. Downgrade 2. | ||||||
| Outcome or subgroup title | No. of studies | No. of participants | Statistical method | Effect size |
| 1 Death of baby (up to discharge) Show forest plot | 20 | 2680 | Risk Ratio (M‐H, Random, 95% CI) | 0.73 [0.54, 0.98] |
| 1.1 < 32‐34 weeks gestation | 13 | 2108 | Risk Ratio (M‐H, Random, 95% CI) | 0.71 [0.52, 0.96] |
| 1.2 > 32‐34 weeks gestation | 3 | 237 | Risk Ratio (M‐H, Random, 95% CI) | 5.18 [0.25, 105.47] |
| 1.3 Mixed gestation | 4 | 335 | Risk Ratio (M‐H, Random, 95% CI) | 0.80 [0.09, 7.04] |
| 2 Death or neurodevelopmental impairment in early years | 0 | 0 | Risk Ratio (M‐H, Random, 95% CI) | 0.0 [0.0, 0.0] |
| 2.1 < 32‐34 weeks gestation | 0 | 0 | Risk Ratio (M‐H, Random, 95% CI) | 0.0 [0.0, 0.0] |
| 2.2 > 32‐34 weeks gestation | 0 | 0 | Risk Ratio (M‐H, Random, 95% CI) | 0.0 [0.0, 0.0] |
| 2.3 Mixed gestation | 0 | 0 | Risk Ratio (M‐H, Random, 95% CI) | 0.0 [0.0, 0.0] |
| 3 Severe intraventricular haemorrhage (IVH grades 3, 4) Show forest plot | 10 | 2058 | Risk Ratio (M‐H, Random, 95% CI) | 0.94 [0.63, 1.39] |
| 3.1 < 32‐34 weeks gestation | 9 | 1972 | Risk Ratio (M‐H, Random, 95% CI) | 0.95 [0.64, 1.42] |
| 3.2 > 32‐34 weeks gestation | 0 | 0 | Risk Ratio (M‐H, Random, 95% CI) | 0.0 [0.0, 0.0] |
| 3.3 Mixed gestation | 1 | 86 | Risk Ratio (M‐H, Random, 95% CI) | 0.58 [0.05, 6.11] |
| 4 Intraventricular haemorrhage (IVH, all grades) Show forest plot | 15 | 2333 | Risk Ratio (M‐H, Random, 95% CI) | 0.83 [0.70, 0.99] |
| 4.1 < 32‐34 weeks gestation | 11 | 1988 | Risk Ratio (M‐H, Random, 95% CI) | 0.76 [0.56, 1.02] |
| 4.2 > 32‐34 weeks gestation | 0 | 0 | Risk Ratio (M‐H, Random, 95% CI) | 0.0 [0.0, 0.0] |
| 4.3 Mixed gestation | 4 | 345 | Risk Ratio (M‐H, Random, 95% CI) | 0.66 [0.38, 1.16] |
| 5 Periventricular leukomalacia (PVL) Show forest plot | 4 | 1544 | Risk Ratio (M‐H, Random, 95% CI) | 0.58 [0.26, 1.30] |
| 5.1 < 32‐34 weeks gestation | 4 | 1544 | Risk Ratio (M‐H, Random, 95% CI) | 0.58 [0.26, 1.30] |
| 5.2 > 32‐34 weeks gestation | 0 | 0 | Risk Ratio (M‐H, Random, 95% CI) | 0.0 [0.0, 0.0] |
| 5.3 Mixed gestation | 0 | 0 | Risk Ratio (M‐H, Random, 95% CI) | 0.0 [0.0, 0.0] |
| 6 Chronic lung disease (CLD) ‐ oxygen supplement at 36 weeks (corrected for gestation) Show forest plot | 6 | 1644 | Risk Ratio (M‐H, Random, 95% CI) | 1.04 [0.94, 1.14] |
| 6.1 < 32‐34 weeks gestation | 6 | 1644 | Risk Ratio (M‐H, Random, 95% CI) | 1.04 [0.94, 1.14] |
| 6.2 > 32‐34 weeks gestation | 0 | 0 | Risk Ratio (M‐H, Random, 95% CI) | 0.0 [0.0, 0.0] |
| 6.3 Mixed gestation | 0 | 0 | Risk Ratio (M‐H, Random, 95% CI) | 0.0 [0.0, 0.0] |
| 7 Maternal blood loss of 500 mL or greater Show forest plot | 2 | 180 | Risk Ratio (M‐H, Random, 95% CI) | 1.14 [0.07, 17.63] |
| 7.1 < 32‐34 weeks gestation | 0 | 0 | Risk Ratio (M‐H, Random, 95% CI) | 0.0 [0.0, 0.0] |
| 7.2 > 32‐34 weeks gestation | 1 | 86 | Risk Ratio (M‐H, Random, 95% CI) | 0.0 [0.0, 0.0] |
| 7.3 Mixed gestation | 1 | 94 | Risk Ratio (M‐H, Random, 95% CI) | 1.14 [0.07, 17.63] |
| 8 Intraventricular haemorrhage (IVH, grades 1 & 2) Show forest plot | 9 | 1968 | Risk Ratio (M‐H, Random, 95% CI) | 0.72 [0.51, 1.02] |
| 8.1 < 32‐34 weeks gestation | 8 | 1882 | Risk Ratio (M‐H, Random, 95% CI) | 0.68 [0.45, 1.03] |
| 8.2 > 32‐34 weeks gestation | 0 | 0 | Risk Ratio (M‐H, Random, 95% CI) | 0.0 [0.0, 0.0] |
| 8.3 Mixed gestation | 1 | 86 | Risk Ratio (M‐H, Random, 95% CI) | 0.89 [0.37, 2.18] |
| 9 Necrotising enterocolitis (NEC) confirmed by X‐ray or laparotomy) Show forest plot | 11 | 2010 | Risk Ratio (M‐H, Random, 95% CI) | 0.91 [0.64, 1.28] |
| 9.1 < 32‐34 weeks gestation | 10 | 1916 | Risk Ratio (M‐H, Random, 95% CI) | 0.86 [0.60, 1.22] |
| 9.2 > 32‐34 weeks gestation | 0 | 0 | Risk Ratio (M‐H, Random, 95% CI) | 0.0 [0.0, 0.0] |
| 9.3 Mixed gestation | 1 | 94 | Risk Ratio (M‐H, Random, 95% CI) | 2.84 [0.58, 13.92] |
| 10 Respiratory Distress Syndrome (RDS) Show forest plot | 7 | 457 | Risk Ratio (M‐H, Random, 95% CI) | 1.09 [0.86, 1.38] |
| 10.1 < 32‐34 weeks gestation | 3 | 165 | Risk Ratio (M‐H, Random, 95% CI) | 1.21 [0.64, 2.27] |
| 10.2 > 32‐34 weeks gestation | 1 | 86 | Risk Ratio (M‐H, Random, 95% CI) | 0.79 [0.19, 3.30] |
| 10.3 Mixed gestation | 3 | 206 | Risk Ratio (M‐H, Random, 95% CI) | 1.32 [0.52, 3.36] |
| 11 Respiratory support (ventilator or CPAP) Show forest plot | 6 | 325 | Risk Ratio (M‐H, Random, 95% CI) | 0.95 [0.77, 1.16] |
| 11.1 < 32‐34 weeks gestation | 5 | 220 | Risk Ratio (M‐H, Random, 95% CI) | 0.96 [0.78, 1.18] |
| 11.2 > 32‐34 weeks gestation | 0 | 0 | Risk Ratio (M‐H, Random, 95% CI) | 0.0 [0.0, 0.0] |
| 11.3 Mixed gestation | 1 | 105 | Risk Ratio (M‐H, Random, 95% CI) | 0.57 [0.16, 2.09] |
| 12 Duration of respiratory support (in days) Show forest plot | 1 | 42 | Mean Difference (IV, Random, 95% CI) | ‐0.60 [‐3.04, 1.84] |
| 12.1 < 32‐34 weeks gestation | 1 | 42 | Mean Difference (IV, Random, 95% CI) | ‐0.60 [‐3.04, 1.84] |
| 12.2 > 32‐34 weeks gestation | 0 | 0 | Mean Difference (IV, Random, 95% CI) | 0.0 [0.0, 0.0] |
| 12.3 Mixed gestation | 0 | 0 | Mean Difference (IV, Random, 95% CI) | 0.0 [0.0, 0.0] |
| 13 Surfactant treatment (for severe RDS) Show forest plot | 3 | 145 | Risk Ratio (M‐H, Random, 95% CI) | 0.80 [0.50, 1.28] |
| 13.1 < 32‐34 weeks gestation | 3 | 145 | Risk Ratio (M‐H, Random, 95% CI) | 0.80 [0.50, 1.28] |
| 13.2 > 32‐34 weeks gestation | 0 | 0 | Risk Ratio (M‐H, Random, 95% CI) | 0.0 [0.0, 0.0] |
| 13.3 Mixed gestation | 0 | 0 | Risk Ratio (M‐H, Random, 95% CI) | 0.0 [0.0, 0.0] |
| 14 Treatment for Patent Ductus Arteriosus (PDA) (medical and/or surgical) Show forest plot | 10 | 2046 | Risk Ratio (M‐H, Random, 95% CI) | 1.12 [0.99, 1.26] |
| 14.1 < 32‐34 weeks gestation | 9 | 1952 | Risk Ratio (M‐H, Random, 95% CI) | 1.12 [0.99, 1.26] |
| 14.2 > 32‐34 weeks gestation | 0 | 0 | Risk Ratio (M‐H, Random, 95% CI) | 0.0 [0.0, 0.0] |
| 14.3 Mixed gestation | 1 | 94 | Risk Ratio (M‐H, Random, 95% CI) | 1.14 [0.24, 5.34] |
| 15 Treatment for Retinopathy of Prematurity (RoP) Show forest plot | 8 | 1827 | Risk Ratio (M‐H, Random, 95% CI) | 0.83 [0.62, 1.12] |
| 15.1 < 32‐34 weeks gestation | 8 | 1827 | Risk Ratio (M‐H, Random, 95% CI) | 0.83 [0.62, 1.12] |
| 15.2 > 32‐34 weeks gestation | 0 | 0 | Risk Ratio (M‐H, Random, 95% CI) | 0.0 [0.0, 0.0] |
| 15.3 Mixed gestation | 0 | 0 | Risk Ratio (M‐H, Random, 95% CI) | 0.0 [0.0, 0.0] |
| 16 Hyperbilirubinemia (treated by phototherapy) Show forest plot | 8 | 495 | Risk Ratio (M‐H, Random, 95% CI) | 1.05 [0.95, 1.16] |
| 16.1 < 32‐34 weeks gestation | 3 | 114 | Risk Ratio (M‐H, Random, 95% CI) | 1.01 [0.91, 1.11] |
| 16.2 > 32‐34 weeks gestation | 2 | 123 | Risk Ratio (M‐H, Random, 95% CI) | 0.73 [0.38, 1.41] |
| 16.3 Mixed gestation | 3 | 258 | Risk Ratio (M‐H, Random, 95% CI) | 1.17 [0.93, 1.47] |
| 17 Inotropics for low blood pressure Show forest plot | 5 | 250 | Risk Ratio (M‐H, Random, 95% CI) | 0.37 [0.17, 0.81] |
| 17.1 < 32‐34 weeks gestation | 5 | 250 | Risk Ratio (M‐H, Random, 95% CI) | 0.37 [0.17, 0.81] |
| 17.2 > 32‐34 weeks gestation | 0 | 0 | Risk Ratio (M‐H, Random, 95% CI) | 0.0 [0.0, 0.0] |
| 17.3 Mixed gestation | 0 | 0 | Risk Ratio (M‐H, Random, 95% CI) | 0.0 [0.0, 0.0] |
| 18 Low Apgar as defined by trialists (generally < 8 at 5 mins) Show forest plot | 4 | 1721 | Risk Ratio (M‐H, Random, 95% CI) | 1.07 [0.70, 1.63] |
| 18.1 < 32‐34 weeks gestation | 3 | 1637 | Risk Ratio (M‐H, Random, 95% CI) | 1.01 [0.62, 1.62] |
| 18.2 > 32‐34 weeks gestation | 0 | 0 | Risk Ratio (M‐H, Random, 95% CI) | 0.0 [0.0, 0.0] |
| 18.3 Mixed gestation | 1 | 84 | Risk Ratio (M‐H, Random, 95% CI) | 1.32 [0.53, 3.31] |
| 19 Blood transfusion in infant Show forest plot | 11 | 2280 | Risk Ratio (M‐H, Random, 95% CI) | 0.66 [0.50, 0.86] |
| 19.1 < 32‐34 weeks gestation | 8 | 1995 | Risk Ratio (M‐H, Random, 95% CI) | 0.64 [0.47, 0.87] |
| 19.2 > 32‐34 weeks gestation | 1 | 86 | Risk Ratio (M‐H, Random, 95% CI) | 0.0 [0.0, 0.0] |
| 19.3 Mixed gestation | 2 | 199 | Risk Ratio (M‐H, Random, 95% CI) | 0.67 [0.26, 1.74] |
| 20 Volume of blood transfused (mL) Show forest plot | 1 | 72 | Mean Difference (IV, Random, 95% CI) | ‐6.0 [‐26.11, 14.11] |
| 20.1 < 32‐34 weeks gestation | 1 | 72 | Mean Difference (IV, Random, 95% CI) | ‐6.0 [‐26.11, 14.11] |
| 20.2 > 32‐34 weeks gestation | 0 | 0 | Mean Difference (IV, Random, 95% CI) | 0.0 [0.0, 0.0] |
| 20.3 Mixed gestation | 0 | 0 | Mean Difference (IV, Random, 95% CI) | 0.0 [0.0, 0.0] |
| 21 Late sepsis (after 3 days or as defined by trialists) Show forest plot | 10 | 2017 | Risk Ratio (M‐H, Random, 95% CI) | 0.79 [0.56, 1.10] |
| 21.1 < 32‐34 weeks gestation | 9 | 1923 | Risk Ratio (M‐H, Random, 95% CI) | 0.76 [0.52, 1.11] |
| 21.2 > 32‐34 weeks gestation | 0 | 0 | Risk Ratio (M‐H, Random, 95% CI) | 0.0 [0.0, 0.0] |
| 21.3 Mixed gestation | 1 | 94 | Risk Ratio (M‐H, Random, 95% CI) | 0.87 [0.43, 1.79] |
| 22 Hydrocephalus | 0 | 0 | Risk Ratio (M‐H, Random, 95% CI) | 0.0 [0.0, 0.0] |
| 22.1 < 32‐34 weeks gestation | 0 | 0 | Risk Ratio (M‐H, Random, 95% CI) | 0.0 [0.0, 0.0] |
| 22.2 > 32‐34 weeks gestation | 0 | 0 | Risk Ratio (M‐H, Random, 95% CI) | 0.0 [0.0, 0.0] |
| 22.3 Mixed gestation | 0 | 0 | Risk Ratio (M‐H, Random, 95% CI) | 0.0 [0.0, 0.0] |
| 23 Temperature < 36.0oC within 1 hour of birth Show forest plot | 1 | 86 | Risk Ratio (M‐H, Random, 95% CI) | 0.0 [0.0, 0.0] |
| 23.1 < 32‐34 weeks gestation | 0 | 0 | Risk Ratio (M‐H, Random, 95% CI) | 0.0 [0.0, 0.0] |
| 23.2 > 32‐34 weeks gestation | 1 | 86 | Risk Ratio (M‐H, Random, 95% CI) | 0.0 [0.0, 0.0] |
| 23.3 Mixed gestation | 0 | 0 | Risk Ratio (M‐H, Random, 95% CI) | 0.0 [0.0, 0.0] |
| 24 Hb within 1st 24 hour of birth (g/dL) Show forest plot | 1 | 42 | Mean Difference (IV, Random, 95% CI) | 0.80 [‐0.02, 1.62] |
| 24.1 < 32‐34 weeks gestation | 1 | 42 | Mean Difference (IV, Random, 95% CI) | 0.80 [‐0.02, 1.62] |
| 24.2 > 32‐34 weeks gestation | 0 | 0 | Mean Difference (IV, Random, 95% CI) | 0.0 [0.0, 0.0] |
| 24.3 Mixed gestation | 0 | 0 | Mean Difference (IV, Random, 95% CI) | 0.0 [0.0, 0.0] |
| 25 Mean arterial blood pressure in early hours after birth (mm Hg) Show forest plot | 4 | 208 | Mean Difference (IV, Random, 95% CI) | 2.87 [1.09, 4.64] |
| 25.1 < 32‐34 weeks gestation | 4 | 208 | Mean Difference (IV, Random, 95% CI) | 2.87 [1.09, 4.64] |
| 25.2 > 32‐34 weeks gestation | 0 | 0 | Mean Difference (IV, Random, 95% CI) | 0.0 [0.0, 0.0] |
| 25.3 Mixed gestation | 0 | 0 | Mean Difference (IV, Random, 95% CI) | 0.0 [0.0, 0.0] |
| 26 Length of infant stay in NICU | 0 | 0 | Mean Difference (IV, Random, 95% CI) | 0.0 [0.0, 0.0] |
| 26.1 < 32‐34 weeks gestation | 0 | 0 | Mean Difference (IV, Random, 95% CI) | 0.0 [0.0, 0.0] |
| 26.2 > 32‐34 weeks gestation | 0 | 0 | Mean Difference (IV, Random, 95% CI) | 0.0 [0.0, 0.0] |
| 26.3 Mixed gestation | 0 | 0 | Mean Difference (IV, Random, 95% CI) | 0.0 [0.0, 0.0] |
| 27 Home oxygen Show forest plot | 2 | 101 | Risk Ratio (M‐H, Random, 95% CI) | 0.47 [0.06, 3.72] |
| 27.1 < 32‐34 weeks gestation | 2 | 101 | Risk Ratio (M‐H, Random, 95% CI) | 0.47 [0.06, 3.72] |
| 27.2 > 32‐34 weeks gestation | 0 | 0 | Risk Ratio (M‐H, Random, 95% CI) | 0.0 [0.0, 0.0] |
| 27.3 Mixed gestation | 0 | 0 | Risk Ratio (M‐H, Random, 95% CI) | 0.0 [0.0, 0.0] |
| 28 Neurodevelopmental impairment at age two to three years (Baileys 11 MDI < 70) | 0 | 0 | Risk Ratio (M‐H, Random, 95% CI) | 0.0 [0.0, 0.0] |
| 28.1 < 32‐34 weeks gestation | 0 | 0 | Risk Ratio (M‐H, Random, 95% CI) | 0.0 [0.0, 0.0] |
| 28.2 > 32‐34 weeks gestation | 0 | 0 | Risk Ratio (M‐H, Random, 95% CI) | 0.0 [0.0, 0.0] |
| 28.3 Mixed gestation | 0 | 0 | Risk Ratio (M‐H, Random, 95% CI) | 0.0 [0.0, 0.0] |
| 29 Severe visual impairment | 0 | 0 | Risk Ratio (M‐H, Random, 95% CI) | 0.0 [0.0, 0.0] |
| 29.1 < 32‐34 weeks gestation | 0 | 0 | Risk Ratio (M‐H, Random, 95% CI) | 0.0 [0.0, 0.0] |
| 29.2 > 32‐34 weeks gestation | 0 | 0 | Risk Ratio (M‐H, Random, 95% CI) | 0.0 [0.0, 0.0] |
| 29.3 Mixed gestation | 0 | 0 | Risk Ratio (M‐H, Random, 95% CI) | 0.0 [0.0, 0.0] |
| 30 Cerebral palsy (CP) | 0 | 0 | Risk Ratio (M‐H, Random, 95% CI) | 0.0 [0.0, 0.0] |
| 30.1 < 32‐34 weeks gestation | 0 | 0 | Risk Ratio (M‐H, Random, 95% CI) | 0.0 [0.0, 0.0] |
| 30.2 > 32‐34 weeks gestation | 0 | 0 | Risk Ratio (M‐H, Random, 95% CI) | 0.0 [0.0, 0.0] |
| 30.3 Mixed gestation | 0 | 0 | Risk Ratio (M‐H, Random, 95% CI) | 0.0 [0.0, 0.0] |
| 31 Manual removal of placenta (denominator = vaginal births) | 0 | 0 | Risk Ratio (M‐H, Random, 95% CI) | 0.0 [0.0, 0.0] |
| 31.1 < 32‐34 weeks gestation | 0 | 0 | Risk Ratio (M‐H, Random, 95% CI) | 0.0 [0.0, 0.0] |
| 31.2 > 32‐34 weeks gestation | 0 | 0 | Risk Ratio (M‐H, Random, 95% CI) | 0.0 [0.0, 0.0] |
| 31.3 Mixed gestation | 0 | 0 | Risk Ratio (M‐H, Random, 95% CI) | 0.0 [0.0, 0.0] |
| 32 Prolonged third stage (> 30 minutes) (denominator = vaginal births) | 0 | 0 | Risk Ratio (M‐H, Random, 95% CI) | 0.0 [0.0, 0.0] |
| 32.1 < 32‐34 weeks gestation | 0 | 0 | Risk Ratio (M‐H, Random, 95% CI) | 0.0 [0.0, 0.0] |
| 32.2 > 32‐34 weeks gestation | 0 | 0 | Risk Ratio (M‐H, Random, 95% CI) | 0.0 [0.0, 0.0] |
| 32.3 Mixed gestation | 0 | 0 | Risk Ratio (M‐H, Random, 95% CI) | 0.0 [0.0, 0.0] |
| 33 Blood transfusion for mother Show forest plot | 1 | 1176 | Risk Ratio (M‐H, Random, 95% CI) | 0.67 [0.36, 1.24] |
| 33.1 < 32‐34 weeks gestation | 1 | 1176 | Risk Ratio (M‐H, Random, 95% CI) | 0.67 [0.36, 1.24] |
| 33.2 > 32‐34 weeks gestation | 0 | 0 | Risk Ratio (M‐H, Random, 95% CI) | 0.0 [0.0, 0.0] |
| 33.3 Mixed gestation | 0 | 0 | Risk Ratio (M‐H, Random, 95% CI) | 0.0 [0.0, 0.0] |
| 34 Postpartum infection in mother | 0 | 0 | Risk Ratio (M‐H, Random, 95% CI) | 0.0 [0.0, 0.0] |
| 34.1 < 32‐34 weeks gestation | 0 | 0 | Risk Ratio (M‐H, Random, 95% CI) | 0.0 [0.0, 0.0] |
| 34.2 > 32‐34 weeks gestation | 0 | 0 | Risk Ratio (M‐H, Random, 95% CI) | 0.0 [0.0, 0.0] |
| 34.3 Mixed gestation | 0 | 0 | Risk Ratio (M‐H, Random, 95% CI) | 0.0 [0.0, 0.0] |
| 35 Rhesus isoimmunisation | 0 | 0 | Risk Ratio (M‐H, Random, 95% CI) | 0.0 [0.0, 0.0] |
| 35.1 < 32‐34 weeks gestation | 0 | 0 | Risk Ratio (M‐H, Random, 95% CI) | 0.0 [0.0, 0.0] |
| 35.2 > 32‐34 weeks gestation | 0 | 0 | Risk Ratio (M‐H, Random, 95% CI) | 0.0 [0.0, 0.0] |
| 35.3 Mixed gestation | 0 | 0 | Risk Ratio (M‐H, Random, 95% CI) | 0.0 [0.0, 0.0] |
| 36 Psychological well being in mother | 0 | 0 | Std. Mean Difference (IV, Random, 95% CI) | 0.0 [0.0, 0.0] |
| 36.1 < 32‐34 weeks gestation | 0 | 0 | Std. Mean Difference (IV, Random, 95% CI) | 0.0 [0.0, 0.0] |
| 36.2 > 32‐34 weeks gestation | 0 | 0 | Std. Mean Difference (IV, Random, 95% CI) | 0.0 [0.0, 0.0] |
| 36.3 Mixed gestation | 0 | 0 | Std. Mean Difference (IV, Random, 95% CI) | 0.0 [0.0, 0.0] |
| 37 Bonding | 0 | 0 | Std. Mean Difference (IV, Random, 95% CI) | 0.0 [0.0, 0.0] |
| 37.1 < 32‐34 weeks gestation | 0 | 0 | Std. Mean Difference (IV, Random, 95% CI) | 0.0 [0.0, 0.0] |
| 37.2 > 32‐34 weeks gestation | 0 | 0 | Std. Mean Difference (IV, Random, 95% CI) | 0.0 [0.0, 0.0] |
| 37.3 Mixed gestation | 0 | 0 | Std. Mean Difference (IV, Random, 95% CI) | 0.0 [0.0, 0.0] |
| 38 Breastfeeding initiation | 0 | 0 | Risk Ratio (M‐H, Random, 95% CI) | 0.0 [0.0, 0.0] |
| 38.1 < 32‐34 weeks gestation | 0 | 0 | Risk Ratio (M‐H, Random, 95% CI) | 0.0 [0.0, 0.0] |
| 38.2 > 32‐34 weeks gestation | 0 | 0 | Risk Ratio (M‐H, Random, 95% CI) | 0.0 [0.0, 0.0] |
| 38.3 Mixed gestation | 0 | 0 | Risk Ratio (M‐H, Random, 95% CI) | 0.0 [0.0, 0.0] |
| 39 Fully breastfed or mixed feeding at infant discharge Show forest plot | 1 | 94 | Risk Ratio (M‐H, Random, 95% CI) | 1.11 [1.00, 1.23] |
| 39.1 < 32‐34 weeks gestation | 0 | 0 | Risk Ratio (M‐H, Random, 95% CI) | 0.0 [0.0, 0.0] |
| 39.2 > 32‐34 weeks gestation | 0 | 0 | Risk Ratio (M‐H, Random, 95% CI) | 0.0 [0.0, 0.0] |
| 39.3 Mixed gestation | 1 | 94 | Risk Ratio (M‐H, Random, 95% CI) | 1.11 [1.00, 1.23] |
| 40 Maternal anxiety | 0 | 0 | Risk Ratio (M‐H, Random, 95% CI) | 0.0 [0.0, 0.0] |
| 40.1 < 32‐34 weeks gestation | 0 | 0 | Risk Ratio (M‐H, Random, 95% CI) | 0.0 [0.0, 0.0] |
| 40.2 > 32‐34 weeks gestation | 0 | 0 | Risk Ratio (M‐H, Random, 95% CI) | 0.0 [0.0, 0.0] |
| 40.3 Mixed gestation | 0 | 0 | Risk Ratio (M‐H, Random, 95% CI) | 0.0 [0.0, 0.0] |
| 41 Mothers' views | 0 | 0 | Std. Mean Difference (IV, Random, 95% CI) | 0.0 [0.0, 0.0] |
| 41.1 < 32‐34 weeks gestation | 0 | 0 | Std. Mean Difference (IV, Random, 95% CI) | 0.0 [0.0, 0.0] |
| 41.2 > 32‐34 weeks gestation | 0 | 0 | Std. Mean Difference (IV, Random, 95% CI) | 0.0 [0.0, 0.0] |
| 41.3 Mixed gestation | 0 | 0 | Std. Mean Difference (IV, Random, 95% CI) | 0.0 [0.0, 0.0] |
| Outcome or subgroup title | No. of studies | No. of participants | Statistical method | Effect size |
| 1 Death of baby (up to discharge) Show forest plot | 20 | 2680 | Risk Ratio (M‐H, Random, 95% CI) | 0.73 [0.54, 0.98] |
| 1.1 DCC < 1 min and baby level with uterus | 1 | 46 | Risk Ratio (M‐H, Random, 95% CI) | 0.20 [0.01, 3.95] |
| 1.2 DCC < 1 min and baby held low | 7 | 318 | Risk Ratio (M‐H, Random, 95% CI) | 0.50 [0.19, 1.30] |
| 1.3 DCC 1‐2 mins and baby level with uterus | 2 | 172 | Risk Ratio (M‐H, Random, 95% CI) | 1.15 [0.07, 17.80] |
| 1.4 DCC 1‐2 mins and baby held low | 3 | 1710 | Risk Ratio (M‐H, Random, 95% CI) | 0.72 [0.52, 1.00] |
| 1.5 DCC > 2 mins and baby level with uterus | 3 | 181 | Risk Ratio (M‐H, Random, 95% CI) | 0.67 [0.02, 28.73] |
| 1.6 DCC > 2 mins and baby held low | 0 | 0 | Risk Ratio (M‐H, Random, 95% CI) | 0.0 [0.0, 0.0] |
| 1.7 Mixed interventions or unclear | 4 | 253 | Risk Ratio (M‐H, Random, 95% CI) | 2.28 [0.57, 9.13] |
| 2 Death or neurodevelopmental impairment at age two to three years | 0 | 0 | Risk Ratio (M‐H, Random, 95% CI) | 0.0 [0.0, 0.0] |
| 2.1 DCC < 1 min and baby level with uterus | 0 | 0 | Risk Ratio (M‐H, Random, 95% CI) | 0.0 [0.0, 0.0] |
| 2.2 DCC < 1 min and baby held low | 0 | 0 | Risk Ratio (M‐H, Random, 95% CI) | 0.0 [0.0, 0.0] |
| 2.3 DCC 1‐2 mins and baby level with uterus | 0 | 0 | Risk Ratio (M‐H, Random, 95% CI) | 0.0 [0.0, 0.0] |
| 2.4 DCC 1‐2 mins and baby held low | 0 | 0 | Risk Ratio (M‐H, Random, 95% CI) | 0.0 [0.0, 0.0] |
| 2.5 DCC > 2 mins and baby level with uterus | 0 | 0 | Risk Ratio (M‐H, Random, 95% CI) | 0.0 [0.0, 0.0] |
| 2.6 DCC > 2 mins and baby held low | 0 | 0 | Risk Ratio (M‐H, Random, 95% CI) | 0.0 [0.0, 0.0] |
| 2.7 Mixed interventions or unclear | 0 | 0 | Risk Ratio (M‐H, Random, 95% CI) | 0.0 [0.0, 0.0] |
| 3 Severe intraventricular haemorrhage (IVH grades 3, 4) Show forest plot | 10 | 2058 | Risk Ratio (M‐H, Random, 95% CI) | 0.94 [0.63, 1.39] |
| 3.1 DCC < 1 min and baby level with uterus | 0 | 0 | Risk Ratio (M‐H, Random, 95% CI) | 0.0 [0.0, 0.0] |
| 3.2 DCC < 1 min and baby held low | 6 | 335 | Risk Ratio (M‐H, Random, 95% CI) | 0.94 [0.40, 2.21] |
| 3.3 DCC 1‐2 mins and baby level with uterus | 1 | 86 | Risk Ratio (M‐H, Random, 95% CI) | 0.58 [0.05, 6.11] |
| 3.4 DCC 1‐2 mins and baby held low | 1 | 1541 | Risk Ratio (M‐H, Random, 95% CI) | 0.91 [0.57, 1.44] |
| 3.5 DCC > 2 mins and baby level with uterus | 0 | 0 | Risk Ratio (M‐H, Random, 95% CI) | 0.0 [0.0, 0.0] |
| 3.6 DCC > 2 mins and baby held low | 0 | 0 | Risk Ratio (M‐H, Random, 95% CI) | 0.0 [0.0, 0.0] |
| 3.7 Mixed interventions or unclear | 2 | 96 | Risk Ratio (M‐H, Random, 95% CI) | 2.96 [0.34, 25.69] |
| 4 Intraventricular haemorrhage (IVH, all grades) Show forest plot | 15 | 2333 | Risk Ratio (M‐H, Random, 95% CI) | 0.83 [0.70, 0.99] |
| 4.1 DCC < 1 min and baby level with uterus | 1 | 31 | Risk Ratio (M‐H, Random, 95% CI) | 0.35 [0.02, 8.08] |
| 4.2 DCC < 1 min and baby held low | 6 | 278 | Risk Ratio (M‐H, Random, 95% CI) | 0.66 [0.41, 1.06] |
| 4.3 DCC 1‐2 mins and baby level with uterus | 1 | 86 | Risk Ratio (M‐H, Random, 95% CI) | 0.84 [0.37, 1.87] |
| 4.4 DCC 1‐2 mins and baby held low | 2 | 1646 | Risk Ratio (M‐H, Random, 95% CI) | 0.94 [0.76, 1.16] |
| 4.5 DCC > 2 mins and baby level with uterus | 1 | 94 | Risk Ratio (M‐H, Random, 95% CI) | 0.38 [0.02, 9.04] |
| 4.6 DCC > 2 mins and baby held low | 0 | 0 | Risk Ratio (M‐H, Random, 95% CI) | 0.0 [0.0, 0.0] |
| 4.7 Mixed interventions or unclear | 4 | 198 | Risk Ratio (M‐H, Random, 95% CI) | 0.66 [0.31, 1.42] |
| 5 Periventricular leukomalacia (PVL) Show forest plot | 4 | 1544 | Risk Ratio (M‐H, Random, 95% CI) | 0.58 [0.26, 1.30] |
| 5.1 DCC < 1 min and baby level with uterus | 1 | 31 | Risk Ratio (M‐H, Random, 95% CI) | 3.19 [0.14, 72.69] |
| 5.2 DCC < 1 min and baby held low | 2 | 102 | Risk Ratio (M‐H, Random, 95% CI) | 0.17 [0.01, 3.02] |
| 5.3 DCC 1‐2 mins and baby level with uterus | 0 | 0 | Risk Ratio (M‐H, Random, 95% CI) | 0.0 [0.0, 0.0] |
| 5.4 DCC 1‐2 mins and baby held low | 1 | 1411 | Risk Ratio (M‐H, Random, 95% CI) | 0.57 [0.24, 1.36] |
| 5.5 DCC > 2 mins and baby level with uterus | 0 | 0 | Risk Ratio (M‐H, Random, 95% CI) | 0.0 [0.0, 0.0] |
| 5.6 DCC > 2 mins and baby held low | 0 | 0 | Risk Ratio (M‐H, Random, 95% CI) | 0.0 [0.0, 0.0] |
| 5.7 Mixed interventions or unclear | 0 | 0 | Risk Ratio (M‐H, Random, 95% CI) | 0.0 [0.0, 0.0] |
| 6 Chronic lung disease (CLD) ‐ oxygen supplement at 36 weeks (corrected for gestation) Show forest plot | 6 | 1644 | Risk Ratio (M‐H, Random, 95% CI) | 1.04 [0.94, 1.14] |
| 6.1 DCC < 1 min and baby level with uterus | 0 | 0 | Risk Ratio (M‐H, Random, 95% CI) | 0.0 [0.0, 0.0] |
| 6.2 DCC < 1 min and baby held low | 5 | 205 | Risk Ratio (M‐H, Random, 95% CI) | 0.82 [0.57, 1.17] |
| 6.3 DCC 1‐2 mins and baby level with uterus | 0 | 0 | Risk Ratio (M‐H, Random, 95% CI) | 0.0 [0.0, 0.0] |
| 6.4 DCC 1‐2 mins and baby held low | 1 | 1439 | Risk Ratio (M‐H, Random, 95% CI) | 1.06 [0.96, 1.16] |
| 6.5 DCC > 2 mins and baby level with uterus | 0 | 0 | Risk Ratio (M‐H, Random, 95% CI) | 0.0 [0.0, 0.0] |
| 6.6 DCC > 2 mins and baby held low | 0 | 0 | Risk Ratio (M‐H, Random, 95% CI) | 0.0 [0.0, 0.0] |
| 6.7 Mixed interventions or unclear | 0 | 0 | Risk Ratio (M‐H, Random, 95% CI) | 0.0 [0.0, 0.0] |
| 7 Maternal blood loss of 500 mL or greater Show forest plot | 2 | 180 | Risk Ratio (M‐H, Random, 95% CI) | 1.14 [0.07, 17.63] |
| 7.1 DCC < 1 min and baby level with uterus | 0 | 0 | Risk Ratio (M‐H, Random, 95% CI) | 0.0 [0.0, 0.0] |
| 7.2 DCC < 1 min and baby held low | 0 | 0 | Risk Ratio (M‐H, Random, 95% CI) | 0.0 [0.0, 0.0] |
| 7.3 DCC 1‐2 mins and baby level with uterus | 1 | 86 | Risk Ratio (M‐H, Random, 95% CI) | 0.0 [0.0, 0.0] |
| 7.4 DCC 1‐2 mins and baby held low | 0 | 0 | Risk Ratio (M‐H, Random, 95% CI) | 0.0 [0.0, 0.0] |
| 7.5 DCC > 2 mins and baby held level with uterus | 1 | 94 | Risk Ratio (M‐H, Random, 95% CI) | 1.14 [0.07, 17.63] |
| 7.6 DCC > 2 mins and baby held low | 0 | 0 | Risk Ratio (M‐H, Random, 95% CI) | 0.0 [0.0, 0.0] |
| 7.7 Mixed interventions or unclear | 0 | 0 | Risk Ratio (M‐H, Random, 95% CI) | 0.0 [0.0, 0.0] |
| 8 Intraventricular haemorrhage (IVH, grades 1 & 2) Show forest plot | 9 | 1968 | Risk Ratio (M‐H, Random, 95% CI) | 0.72 [0.51, 1.02] |
| 8.1 DCC < 1 min and baby level with uterus | 0 | 0 | Risk Ratio (M‐H, Random, 95% CI) | 0.0 [0.0, 0.0] |
| 8.2 DCC < 1 min and baby held low | 5 | 245 | Risk Ratio (M‐H, Random, 95% CI) | 0.65 [0.37, 1.15] |
| 8.3 DCC 1‐2 mins and baby level with uterus | 1 | 86 | Risk Ratio (M‐H, Random, 95% CI) | 0.89 [0.37, 2.18] |
| 8.4 DCC 1‐2 mins and baby held low | 1 | 1541 | Risk Ratio (M‐H, Random, 95% CI) | 0.95 [0.74, 1.22] |
| 8.5 DCC > 2 mins and baby held level with uterus | 0 | 0 | Risk Ratio (M‐H, Random, 95% CI) | 0.0 [0.0, 0.0] |
| 8.6 DCC > 2 mins and baby held low | 0 | 0 | Risk Ratio (M‐H, Random, 95% CI) | 0.0 [0.0, 0.0] |
| 8.7 Mixed interventions or unclear | 2 | 96 | Risk Ratio (M‐H, Random, 95% CI) | 0.41 [0.18, 0.95] |
| 9 Necrotising enterocolitis (NEC) confirmed by X‐ray or laparotomy) Show forest plot | 11 | 2010 | Risk Ratio (M‐H, Random, 95% CI) | 0.91 [0.64, 1.28] |
| 9.1 DCC < 1 min and baby level with uterus | 0 | 0 | Risk Ratio (M‐H, Random, 95% CI) | 0.0 [0.0, 0.0] |
| 9.2 DCC < 1 min and baby held low | 7 | 368 | Risk Ratio (M‐H, Random, 95% CI) | 0.59 [0.28, 1.27] |
| 9.3 DCC 1‐2 mins and baby level with uterus | 0 | 0 | Risk Ratio (M‐H, Random, 95% CI) | 0.0 [0.0, 0.0] |
| 9.4 DCC 1‐2 mins and baby held low | 1 | 1446 | Risk Ratio (M‐H, Random, 95% CI) | 0.90 [0.60, 1.37] |
| 9.5 DCC > 2 mins and baby held level with uterus | 1 | 94 | Risk Ratio (M‐H, Random, 95% CI) | 2.84 [0.58, 13.92] |
| 9.6 DCC > 2 mins and baby held low | 0 | 0 | Risk Ratio (M‐H, Random, 95% CI) | 0.0 [0.0, 0.0] |
| 9.7 Mixed interventions or unclear | 2 | 102 | Risk Ratio (M‐H, Random, 95% CI) | 1.75 [0.40, 7.73] |
| 10 Respiratory Distress Syndrome (RDS) Show forest plot | 6 | 367 | Risk Ratio (M‐H, Random, 95% CI) | 1.09 [0.86, 1.38] |
| 10.1 DCC < 1 min and baby level with uterus | 0 | 0 | Risk Ratio (M‐H, Random, 95% CI) | 0.0 [0.0, 0.0] |
| 10.2 DCC < 1 min and baby held low | 2 | 75 | Risk Ratio (M‐H, Random, 95% CI) | 1.21 [0.64, 2.27] |
| 10.3 DCC 1‐2 mins and baby level with uterus | 1 | 86 | Risk Ratio (M‐H, Random, 95% CI) | 0.79 [0.19, 3.30] |
| 10.4 DCC 1‐2 mins and baby held low | 0 | 0 | Risk Ratio (M‐H, Random, 95% CI) | 0.0 [0.0, 0.0] |
| 10.5 DCC > 2 mins and baby held level with uterus | 1 | 94 | Risk Ratio (M‐H, Random, 95% CI) | 0.71 [0.25, 2.01] |
| 10.6 DCC > 2 mins and baby held low | 0 | 0 | Risk Ratio (M‐H, Random, 95% CI) | 0.0 [0.0, 0.0] |
| 10.7 Mixed interventions or unclear | 2 | 112 | Risk Ratio (M‐H, Random, 95% CI) | 2.12 [0.75, 5.99] |
| 11 Respiratory support (ventilator or CPAP) Show forest plot | 6 | 325 | Risk Ratio (M‐H, Random, 95% CI) | 0.95 [0.77, 1.16] |
| 11.1 DCC < 1 min and baby level with uterus | 1 | 46 | Risk Ratio (M‐H, Random, 95% CI) | 1.0 [0.49, 2.06] |
| 11.2 DCC < 1 min and baby held low | 2 | 75 | Risk Ratio (M‐H, Random, 95% CI) | 1.13 [0.80, 1.61] |
| 11.3 DCC 1‐2 mins and baby level with uterus | 0 | 0 | Risk Ratio (M‐H, Random, 95% CI) | 0.0 [0.0, 0.0] |
| 11.4 DCC 1‐2 mins and baby held low | 2 | 144 | Risk Ratio (M‐H, Random, 95% CI) | 0.74 [0.39, 1.40] |
| 11.5 DCC > 2 mins and baby held level with uterus | 0 | 0 | Risk Ratio (M‐H, Random, 95% CI) | 0.0 [0.0, 0.0] |
| 11.6 DCC > 2 mins and baby held low | 0 | 0 | Risk Ratio (M‐H, Random, 95% CI) | 0.0 [0.0, 0.0] |
| 11.7 Mixed interventions or unclear | 1 | 60 | Risk Ratio (M‐H, Random, 95% CI) | 0.88 [0.65, 1.17] |
| 12 Duration of respiratory support Show forest plot | 1 | 42 | Mean Difference (IV, Random, 95% CI) | ‐0.60 [‐3.04, 1.84] |
| 12.1 DCC < 1 min and baby level with uterus | 0 | 0 | Mean Difference (IV, Random, 95% CI) | 0.0 [0.0, 0.0] |
| 12.2 DCC < 1 min and baby held low | 0 | 0 | Mean Difference (IV, Random, 95% CI) | 0.0 [0.0, 0.0] |
| 12.3 DCC 1‐2 mins and baby level with uterus | 0 | 0 | Mean Difference (IV, Random, 95% CI) | 0.0 [0.0, 0.0] |
| 12.4 DCC 1‐2 mins and baby held low | 0 | 0 | Mean Difference (IV, Random, 95% CI) | 0.0 [0.0, 0.0] |
| 12.5 DCC > 2 mins and baby level with uterus | 0 | 0 | Mean Difference (IV, Random, 95% CI) | 0.0 [0.0, 0.0] |
| 12.6 DCC > 2 mins and baby held low | 0 | 0 | Mean Difference (IV, Random, 95% CI) | 0.0 [0.0, 0.0] |
| 12.7 Mixed interventions or unclear | 1 | 42 | Mean Difference (IV, Random, 95% CI) | ‐0.60 [‐3.04, 1.84] |
| 13 Surfactant treatment (for severe RDS) Show forest plot | 3 | 145 | Risk Ratio (M‐H, Random, 95% CI) | 0.80 [0.50, 1.28] |
| 13.1 DCC < 1 min and baby level with uterus | 1 | 46 | Risk Ratio (M‐H, Random, 95% CI) | 1.5 [0.49, 4.62] |
| 13.2 DCC < 1 min and baby held low | 1 | 39 | Risk Ratio (M‐H, Random, 95% CI) | 1.05 [0.31, 3.62] |
| 13.3 DCC 1‐2 mins and baby level with uterus | 0 | 0 | Risk Ratio (M‐H, Random, 95% CI) | 0.0 [0.0, 0.0] |
| 13.4 DCC 1‐2 mins and baby held low | 0 | 0 | Risk Ratio (M‐H, Random, 95% CI) | 0.0 [0.0, 0.0] |
| 13.5 DCC > 2 mins and baby level with uterus | 0 | 0 | Risk Ratio (M‐H, Random, 95% CI) | 0.0 [0.0, 0.0] |
| 13.6 DCC > 2 mins and baby held low | 0 | 0 | Risk Ratio (M‐H, Random, 95% CI) | 0.0 [0.0, 0.0] |
| 13.7 Mixed interventions or unclear | 1 | 60 | Risk Ratio (M‐H, Random, 95% CI) | 0.65 [0.37, 1.14] |
| 14 Treatment for Patent Ductus Arteriosus (PDA) (medical and/or surgical) Show forest plot | 10 | 2046 | Risk Ratio (M‐H, Random, 95% CI) | 1.12 [0.99, 1.26] |
| 14.1 DCC < 1 min and baby level with uterus | 1 | 46 | Risk Ratio (M‐H, Random, 95% CI) | 1.0 [0.22, 4.45] |
| 14.2 DCC < 1 min and baby held low | 4 | 174 | Risk Ratio (M‐H, Random, 95% CI) | 1.29 [0.88, 1.90] |
| 14.3 DCC 1‐2 mins and baby level with uterus | 0 | 0 | Risk Ratio (M‐H, Random, 95% CI) | 0.0 [0.0, 0.0] |
| 14.4 DCC 1‐2 mins and baby held low | 2 | 1630 | Risk Ratio (M‐H, Random, 95% CI) | 1.10 [0.90, 1.36] |
| 14.5 DCC > 2 mins and baby level with uterus | 1 | 94 | Risk Ratio (M‐H, Random, 95% CI) | 1.14 [0.24, 5.34] |
| 14.6 DCC > 2 mins and baby held low | 0 | 0 | Risk Ratio (M‐H, Random, 95% CI) | 0.0 [0.0, 0.0] |
| 14.7 Mixed interventions or unclear | 2 | 102 | Risk Ratio (M‐H, Random, 95% CI) | 0.55 [0.24, 1.26] |
| 15 Treatment for Retinopathy of Prematurity (RoP) Show forest plot | 8 | 1827 | Risk Ratio (M‐H, Random, 95% CI) | 0.83 [0.62, 1.12] |
| 15.1 DCC < 1 min and baby level with uterus | 0 | 0 | Risk Ratio (M‐H, Random, 95% CI) | 0.0 [0.0, 0.0] |
| 15.2 DCC < 1 min and baby held low | 4 | 226 | Risk Ratio (M‐H, Random, 95% CI) | 1.01 [0.69, 1.46] |
| 15.3 DCC 1‐2 mins and baby level with uterus | 0 | 0 | Risk Ratio (M‐H, Random, 95% CI) | 0.0 [0.0, 0.0] |
| 15.4 DCC 1‐2 mins and baby held low | 2 | 1499 | Risk Ratio (M‐H, Random, 95% CI) | 0.52 [0.11, 2.44] |
| 15.5 DCC > 2 mins and baby level with uterus | 0 | 0 | Risk Ratio (M‐H, Random, 95% CI) | 0.0 [0.0, 0.0] |
| 15.6 DCC > 2 mins and baby held low | 0 | 0 | Risk Ratio (M‐H, Random, 95% CI) | 0.0 [0.0, 0.0] |
| 15.7 Mixed interventions or unclear | 2 | 102 | Risk Ratio (M‐H, Random, 95% CI) | 0.39 [0.13, 1.15] |
| 16 Hyperbilirubinemia (treated by phototherapy) Show forest plot | 8 | 495 | Risk Ratio (M‐H, Random, 95% CI) | 1.05 [0.95, 1.16] |
| 16.1 DCC < 1 min and baby level with uterus | 0 | 0 | Risk Ratio (M‐H, Random, 95% CI) | 0.0 [0.0, 0.0] |
| 16.2 DCC < 1 min and baby held low | 2 | 76 | Risk Ratio (M‐H, Random, 95% CI) | 1.00 [0.91, 1.11] |
| 16.3 DCC 1‐2 mins and baby level with uterus | 1 | 86 | Risk Ratio (M‐H, Random, 95% CI) | 0.65 [0.23, 1.84] |
| 16.4 DCC 1‐2 mins and baby held low | 1 | 104 | Risk Ratio (M‐H, Random, 95% CI) | 1.40 [1.03, 1.88] |
| 16.5 DCC > 2 mins and baby level with uterus | 2 | 131 | Risk Ratio (M‐H, Random, 95% CI) | 1.11 [0.91, 1.36] |
| 16.6 DCC > 2 mins and baby held low | 0 | 0 | Risk Ratio (M‐H, Random, 95% CI) | 0.0 [0.0, 0.0] |
| 16.7 Mixed interventions or unclear | 2 | 98 | Risk Ratio (M‐H, Random, 95% CI) | 0.98 [0.70, 1.37] |
| 17 Inotropics for low blood pressure Show forest plot | 5 | 250 | Risk Ratio (M‐H, Random, 95% CI) | 0.37 [0.17, 0.81] |
| 17.1 DCC < 1 min and baby level with uterus | 1 | 46 | Risk Ratio (M‐H, Random, 95% CI) | 0.67 [0.12, 3.62] |
| 17.2 DCC < 1 min and baby held low | 3 | 162 | Risk Ratio (M‐H, Random, 95% CI) | 0.21 [0.06, 0.80] |
| 17.3 DCC 1‐2 mins and baby level with uterus | 0 | 0 | Risk Ratio (M‐H, Random, 95% CI) | 0.0 [0.0, 0.0] |
| 17.4 DCC 1‐2 mins and baby held low | 0 | 0 | Risk Ratio (M‐H, Random, 95% CI) | 0.0 [0.0, 0.0] |
| 17.5 DCC > 2 mins and baby level with uterus | 0 | 0 | Risk Ratio (M‐H, Random, 95% CI) | 0.0 [0.0, 0.0] |
| 17.6 DCC > 2 mins and baby held low | 0 | 0 | Risk Ratio (M‐H, Random, 95% CI) | 0.0 [0.0, 0.0] |
| 17.7 Mixed interventions or unclear | 1 | 42 | Risk Ratio (M‐H, Random, 95% CI) | 0.43 [0.13, 1.44] |
| 18 Low Apgar as defined by trialists (generally < 8 at 5 mins) Show forest plot | 4 | 1721 | Risk Ratio (M‐H, Random, 95% CI) | 1.07 [0.70, 1.63] |
| 18.1 DCC < 1 min and baby level with uterus | 0 | 0 | Risk Ratio (M‐H, Random, 95% CI) | 0.0 [0.0, 0.0] |
| 18.2 DCC < 1 min and baby held low | 1 | 39 | Risk Ratio (M‐H, Random, 95% CI) | 0.75 [0.29, 1.96] |
| 18.3 DCC 1‐2 mins and baby level with uterus | 1 | 84 | Risk Ratio (M‐H, Random, 95% CI) | 1.32 [0.53, 3.31] |
| 18.4 DCC 1‐2 mins and baby held low | 1 | 1560 | Risk Ratio (M‐H, Random, 95% CI) | 1.04 [0.59, 1.83] |
| 18.5 DCC > 2 mins and baby level with uterus | 0 | 0 | Risk Ratio (M‐H, Random, 95% CI) | 0.0 [0.0, 0.0] |
| 18.6 DCC > 2 mins and baby held low | 0 | 0 | Risk Ratio (M‐H, Random, 95% CI) | 0.0 [0.0, 0.0] |
| 18.7 Mixed interventions or unclear | 1 | 38 | Risk Ratio (M‐H, Random, 95% CI) | 5.4 [0.31, 93.42] |
| 19 Blood transfusion in infant Show forest plot | 11 | 2280 | Risk Ratio (M‐H, Random, 95% CI) | 0.66 [0.50, 0.86] |
| 19.1 DCC < 1 min and baby level with uterus | 0 | 0 | Risk Ratio (M‐H, Random, 95% CI) | 0.0 [0.0, 0.0] |
| 19.2 DCC < 1 min and baby held low | 4 | 266 | Risk Ratio (M‐H, Random, 95% CI) | 0.68 [0.50, 0.92] |
| 19.3 DCC 1‐2 mins and baby level with uterus | 1 | 86 | Risk Ratio (M‐H, Random, 95% CI) | 0.0 [0.0, 0.0] |
| 19.4 DCC 1‐2 mins and baby held low | 3 | 1736 | Risk Ratio (M‐H, Random, 95% CI) | 0.44 [0.13, 1.46] |
| 19.5 DCC > 2 mins and baby level with uterus | 1 | 94 | Risk Ratio (M‐H, Random, 95% CI) | 0.76 [0.23, 2.51] |
| 19.6 DCC > 2 mins and baby held low | 0 | 0 | Risk Ratio (M‐H, Random, 95% CI) | 0.0 [0.0, 0.0] |
| 19.7 Mixed interventions or unclear | 2 | 98 | Risk Ratio (M‐H, Random, 95% CI) | 0.57 [0.27, 1.23] |
| 20 Volume of blood transfused (mL) Show forest plot | 1 | 72 | Mean Difference (IV, Random, 95% CI) | ‐6.0 [‐26.11, 14.11] |
| 20.1 DCC < 1 min and baby level with uterus | 0 | 0 | Mean Difference (IV, Random, 95% CI) | 0.0 [0.0, 0.0] |
| 20.2 DCC < 1 min and baby held low | 1 | 72 | Mean Difference (IV, Random, 95% CI) | ‐6.0 [‐26.11, 14.11] |
| 20.3 DCC 1‐2 mins and baby level with uterus | 0 | 0 | Mean Difference (IV, Random, 95% CI) | 0.0 [0.0, 0.0] |
| 20.4 DCC 1‐2 mins and baby held low | 0 | 0 | Mean Difference (IV, Random, 95% CI) | 0.0 [0.0, 0.0] |
| 20.5 DCC > 2 mins and baby level with uterus | 0 | 0 | Mean Difference (IV, Random, 95% CI) | 0.0 [0.0, 0.0] |
| 20.6 DCC > 2 mins and baby held low | 0 | 0 | Mean Difference (IV, Random, 95% CI) | 0.0 [0.0, 0.0] |
| 20.7 Mixed interventions or unclear | 0 | 0 | Mean Difference (IV, Random, 95% CI) | 0.0 [0.0, 0.0] |
| 21 Late sepsis (after 3 days or as defined by trialists) Show forest plot | 10 | 2017 | Risk Ratio (M‐H, Random, 95% CI) | 0.79 [0.56, 1.10] |
| 21.1 DCC < 1 min and baby level with uterus | 0 | 0 | Risk Ratio (M‐H, Random, 95% CI) | 0.0 [0.0, 0.0] |
| 21.2 DCC < 1 min and baby held low | 5 | 297 | Risk Ratio (M‐H, Random, 95% CI) | 0.70 [0.39, 1.25] |
| 21.3 DCC 1‐2 mins and baby level with uterus | 0 | 0 | Risk Ratio (M‐H, Random, 95% CI) | 0.0 [0.0, 0.0] |
| 21.4 DCC 1‐2 mins and baby held low | 2 | 1524 | Risk Ratio (M‐H, Random, 95% CI) | 0.80 [0.35, 1.81] |
| 21.5 DCC > 2 mins and baby level with uterus | 1 | 94 | Risk Ratio (M‐H, Random, 95% CI) | 0.87 [0.43, 1.79] |
| 21.6 DCC > 2 mins and baby held low | 0 | 0 | Risk Ratio (M‐H, Random, 95% CI) | 0.0 [0.0, 0.0] |
| 21.7 Mixed interventions or unclear | 2 | 102 | Risk Ratio (M‐H, Random, 95% CI) | 0.81 [0.23, 2.87] |
| 22 Hydrocephalus | 0 | 0 | Risk Ratio (M‐H, Random, 95% CI) | 0.0 [0.0, 0.0] |
| 22.1 DCC < 1 min and baby level with uterus | 0 | 0 | Risk Ratio (M‐H, Random, 95% CI) | 0.0 [0.0, 0.0] |
| 22.2 DCC < 1 min and baby held low | 0 | 0 | Risk Ratio (M‐H, Random, 95% CI) | 0.0 [0.0, 0.0] |
| 22.3 DCC 1‐2 mins and baby level with uterus | 0 | 0 | Risk Ratio (M‐H, Random, 95% CI) | 0.0 [0.0, 0.0] |
| 22.4 DCC 1‐2 mins and baby held low | 0 | 0 | Risk Ratio (M‐H, Random, 95% CI) | 0.0 [0.0, 0.0] |
| 22.5 DCC > 2 mins and baby level with uterus | 0 | 0 | Risk Ratio (M‐H, Random, 95% CI) | 0.0 [0.0, 0.0] |
| 22.6 DCC > 2 mins and baby held low | 0 | 0 | Risk Ratio (M‐H, Random, 95% CI) | 0.0 [0.0, 0.0] |
| 22.7 Mixed interventions or unclear | 0 | 0 | Risk Ratio (M‐H, Random, 95% CI) | 0.0 [0.0, 0.0] |
| 23 Temperature < 36.0oC within 1 hour of birth Show forest plot | 1 | 86 | Risk Ratio (M‐H, Random, 95% CI) | 0.0 [0.0, 0.0] |
| 23.1 DCC < 1 min and baby level with uterus | 0 | 0 | Risk Ratio (M‐H, Random, 95% CI) | 0.0 [0.0, 0.0] |
| 23.2 DCC < 1 min and baby held low | 0 | 0 | Risk Ratio (M‐H, Random, 95% CI) | 0.0 [0.0, 0.0] |
| 23.3 DCC 1‐2 mins and baby level with uterus | 1 | 86 | Risk Ratio (M‐H, Random, 95% CI) | 0.0 [0.0, 0.0] |
| 23.4 DCC 1‐2 mins and baby held low | 0 | 0 | Risk Ratio (M‐H, Random, 95% CI) | 0.0 [0.0, 0.0] |
| 23.5 DCC > 2 mins and baby level with uterus | 0 | 0 | Risk Ratio (M‐H, Random, 95% CI) | 0.0 [0.0, 0.0] |
| 23.6 DCC > 2 mins and baby held low | 0 | 0 | Risk Ratio (M‐H, Random, 95% CI) | 0.0 [0.0, 0.0] |
| 23.7 Mixed interventions or unclear | 0 | 0 | Risk Ratio (M‐H, Random, 95% CI) | 0.0 [0.0, 0.0] |
| 24 Hb within 1st 24 hour of birth (g/dL) Show forest plot | 1 | 42 | Mean Difference (IV, Random, 95% CI) | 0.80 [‐0.02, 1.62] |
| 24.1 DCC < 1 min and baby level with uterus | 0 | 0 | Mean Difference (IV, Random, 95% CI) | 0.0 [0.0, 0.0] |
| 24.2 DCC < 1 min and baby held low | 0 | 0 | Mean Difference (IV, Random, 95% CI) | 0.0 [0.0, 0.0] |
| 24.3 DCC 1‐2 mins and baby level with uterus | 0 | 0 | Mean Difference (IV, Random, 95% CI) | 0.0 [0.0, 0.0] |
| 24.4 DCC 1‐2 mins and baby held low | 0 | 0 | Mean Difference (IV, Random, 95% CI) | 0.0 [0.0, 0.0] |
| 24.5 DCC > 2 mins and baby level with uterus | 0 | 0 | Mean Difference (IV, Random, 95% CI) | 0.0 [0.0, 0.0] |
| 24.6 DCC > 2 mins and baby held low | 0 | 0 | Mean Difference (IV, Random, 95% CI) | 0.0 [0.0, 0.0] |
| 24.7 Mixed interventions or unclear | 1 | 42 | Mean Difference (IV, Random, 95% CI) | 0.80 [‐0.02, 1.62] |
| 25 Mean arterial blood pressure in early hours after birth (mm Hg) Show forest plot | 4 | 208 | Mean Difference (IV, Random, 95% CI) | 2.87 [1.09, 4.64] |
| 25.1 DCC < 1 min and baby level with uterus | 0 | 0 | Mean Difference (IV, Random, 95% CI) | 0.0 [0.0, 0.0] |
| 25.2 DCC < 1 min and baby held low | 3 | 169 | Mean Difference (IV, Random, 95% CI) | 2.57 [0.69, 4.45] |
| 25.3 DCC 1‐2 mins and baby level with uterus | 0 | 0 | Mean Difference (IV, Random, 95% CI) | 0.0 [0.0, 0.0] |
| 25.4 DCC 1‐2 mins and baby held low | 1 | 39 | Mean Difference (IV, Random, 95% CI) | 5.34 [‐0.06, 10.74] |
| 25.5 DCC > 2 mins and baby level with uterus | 0 | 0 | Mean Difference (IV, Random, 95% CI) | 0.0 [0.0, 0.0] |
| 25.6 DCC > 2 mins and baby held low | 0 | 0 | Mean Difference (IV, Random, 95% CI) | 0.0 [0.0, 0.0] |
| 25.7 Mixed interventions or unclear | 0 | 0 | Mean Difference (IV, Random, 95% CI) | 0.0 [0.0, 0.0] |
| 26 Length of infant stay in NICU | 0 | 0 | Mean Difference (IV, Random, 95% CI) | 0.0 [0.0, 0.0] |
| 26.1 DCC < 1 min and baby level with uterus | 0 | 0 | Mean Difference (IV, Random, 95% CI) | 0.0 [0.0, 0.0] |
| 26.2 DCC < 1 min and baby held low | 0 | 0 | Mean Difference (IV, Random, 95% CI) | 0.0 [0.0, 0.0] |
| 26.3 DCC 1‐2 mins and baby level with uterus | 0 | 0 | Mean Difference (IV, Random, 95% CI) | 0.0 [0.0, 0.0] |
| 26.4 DCC 1‐2 mins and baby held low | 0 | 0 | Mean Difference (IV, Random, 95% CI) | 0.0 [0.0, 0.0] |
| 26.5 DCC > 2 mins and baby level with uterus | 0 | 0 | Mean Difference (IV, Random, 95% CI) | 0.0 [0.0, 0.0] |
| 26.6 DCC > 2 mins and baby held low | 0 | 0 | Mean Difference (IV, Random, 95% CI) | 0.0 [0.0, 0.0] |
| 26.7 Mixed interventions or unclear | 0 | 0 | Mean Difference (IV, Random, 95% CI) | 0.0 [0.0, 0.0] |
| 27 Home oxygen Show forest plot | 2 | 101 | Risk Ratio (M‐H, Random, 95% CI) | 0.47 [0.06, 3.72] |
| 27.1 DCC < 1 min and baby level with uterus | 0 | 0 | Risk Ratio (M‐H, Random, 95% CI) | 0.0 [0.0, 0.0] |
| 27.2 DCC < 1 min and baby held low | 2 | 101 | Risk Ratio (M‐H, Random, 95% CI) | 0.47 [0.06, 3.72] |
| 27.3 DCC 1‐2 mins and baby level with uterus | 0 | 0 | Risk Ratio (M‐H, Random, 95% CI) | 0.0 [0.0, 0.0] |
| 27.4 DCC 1‐2 mins and baby held low | 0 | 0 | Risk Ratio (M‐H, Random, 95% CI) | 0.0 [0.0, 0.0] |
| 27.5 DCC > 2 mins and baby level with uterus | 0 | 0 | Risk Ratio (M‐H, Random, 95% CI) | 0.0 [0.0, 0.0] |
| 27.6 DCC > 2 mins and baby held low | 0 | 0 | Risk Ratio (M‐H, Random, 95% CI) | 0.0 [0.0, 0.0] |
| 27.7 Mixed interventions or unclear | 0 | 0 | Risk Ratio (M‐H, Random, 95% CI) | 0.0 [0.0, 0.0] |
| 28 Neurodevelopmental impairment at age two to three years | 0 | Risk Ratio (M‐H, Random, 95% CI) | Totals not selected | |
| 28.1 DCC < 1 min and baby level with uterus | 0 | Risk Ratio (M‐H, Random, 95% CI) | 0.0 [0.0, 0.0] | |
| 28.2 DCC < 1 min and baby held low | 0 | Risk Ratio (M‐H, Random, 95% CI) | 0.0 [0.0, 0.0] | |
| 28.3 DCC 1‐2 mins and baby level with uterus | 0 | Risk Ratio (M‐H, Random, 95% CI) | 0.0 [0.0, 0.0] | |
| 28.4 DCC 1‐2 mins and baby held low | 0 | Risk Ratio (M‐H, Random, 95% CI) | 0.0 [0.0, 0.0] | |
| 28.5 DCC > 2 mins and baby level with uterus | 0 | Risk Ratio (M‐H, Random, 95% CI) | 0.0 [0.0, 0.0] | |
| 28.6 DCC > 2 mins and baby held low | 0 | Risk Ratio (M‐H, Random, 95% CI) | 0.0 [0.0, 0.0] | |
| 28.7 Mixed interventions or unclear | 0 | Risk Ratio (M‐H, Random, 95% CI) | 0.0 [0.0, 0.0] | |
| 29 Severe visual impairment | 0 | 0 | Risk Ratio (M‐H, Random, 95% CI) | 0.0 [0.0, 0.0] |
| 29.1 DCC < 1 min and baby level with uterus | 0 | 0 | Risk Ratio (M‐H, Random, 95% CI) | 0.0 [0.0, 0.0] |
| 29.2 DCC < 1 min and baby held low | 0 | 0 | Risk Ratio (M‐H, Random, 95% CI) | 0.0 [0.0, 0.0] |
| 29.3 DCC 1‐2 mins and baby level with uterus | 0 | 0 | Risk Ratio (M‐H, Random, 95% CI) | 0.0 [0.0, 0.0] |
| 29.4 DCC 1‐2 mins and baby held low | 0 | 0 | Risk Ratio (M‐H, Random, 95% CI) | 0.0 [0.0, 0.0] |
| 29.5 DCC > 2 mins and baby level with uterus | 0 | 0 | Risk Ratio (M‐H, Random, 95% CI) | 0.0 [0.0, 0.0] |
| 29.6 DCC > 2 mins and baby held low | 0 | 0 | Risk Ratio (M‐H, Random, 95% CI) | 0.0 [0.0, 0.0] |
| 29.7 Mixed interventions or unclear | 0 | 0 | Risk Ratio (M‐H, Random, 95% CI) | 0.0 [0.0, 0.0] |
| 30 Cerebral palsy (CP) | 0 | 0 | Risk Ratio (M‐H, Random, 95% CI) | 0.0 [0.0, 0.0] |
| 30.1 DCC < 1 min and baby level with uterus | 0 | 0 | Risk Ratio (M‐H, Random, 95% CI) | 0.0 [0.0, 0.0] |
| 30.2 DCC < 1 min and baby held low | 0 | 0 | Risk Ratio (M‐H, Random, 95% CI) | 0.0 [0.0, 0.0] |
| 30.3 DCC 1‐2 mins and baby level with uterus | 0 | 0 | Risk Ratio (M‐H, Random, 95% CI) | 0.0 [0.0, 0.0] |
| 30.4 DCC 1‐2 mins and baby held low | 0 | 0 | Risk Ratio (M‐H, Random, 95% CI) | 0.0 [0.0, 0.0] |
| 30.5 DCC > 2 mins and baby level with uterus | 0 | 0 | Risk Ratio (M‐H, Random, 95% CI) | 0.0 [0.0, 0.0] |
| 30.6 DCC > 2 mins and baby held low | 0 | 0 | Risk Ratio (M‐H, Random, 95% CI) | 0.0 [0.0, 0.0] |
| 30.7 Mixed interventions or unclear | 0 | 0 | Risk Ratio (M‐H, Random, 95% CI) | 0.0 [0.0, 0.0] |
| 31 Manual removal of placenta (denominator = vaginal births) | 0 | 0 | Risk Ratio (M‐H, Random, 95% CI) | 0.0 [0.0, 0.0] |
| 31.1 DCC < 1 min and baby level with uterus | 0 | 0 | Risk Ratio (M‐H, Random, 95% CI) | 0.0 [0.0, 0.0] |
| 31.2 DCC < 1 min and baby held low | 0 | 0 | Risk Ratio (M‐H, Random, 95% CI) | 0.0 [0.0, 0.0] |
| 31.3 DCC 1‐2 mins and baby level with uterus | 0 | 0 | Risk Ratio (M‐H, Random, 95% CI) | 0.0 [0.0, 0.0] |
| 31.4 DCC 1‐2 mins and baby held low | 0 | 0 | Risk Ratio (M‐H, Random, 95% CI) | 0.0 [0.0, 0.0] |
| 31.5 DCC > 2 mins and baby level with uterus | 0 | 0 | Risk Ratio (M‐H, Random, 95% CI) | 0.0 [0.0, 0.0] |
| 31.6 DCC > 2 mins and baby held low | 0 | 0 | Risk Ratio (M‐H, Random, 95% CI) | 0.0 [0.0, 0.0] |
| 31.7 Mixed interventions or unclear | 0 | 0 | Risk Ratio (M‐H, Random, 95% CI) | 0.0 [0.0, 0.0] |
| 32 Prolonged third stage (>30 minutes) (denominator = vaginal births) | 0 | 0 | Risk Ratio (M‐H, Random, 95% CI) | 0.0 [0.0, 0.0] |
| 32.1 DCC < 1 min and baby level with uterus | 0 | 0 | Risk Ratio (M‐H, Random, 95% CI) | 0.0 [0.0, 0.0] |
| 32.2 DCC < 1 min and baby held low | 0 | 0 | Risk Ratio (M‐H, Random, 95% CI) | 0.0 [0.0, 0.0] |
| 32.3 DCC 1‐2 mins and baby level with uterus | 0 | 0 | Risk Ratio (M‐H, Random, 95% CI) | 0.0 [0.0, 0.0] |
| 32.4 DCC 1‐2 mins and baby held low | 0 | 0 | Risk Ratio (M‐H, Random, 95% CI) | 0.0 [0.0, 0.0] |
| 32.5 DCC > 2 mins and baby level with uterus | 0 | 0 | Risk Ratio (M‐H, Random, 95% CI) | 0.0 [0.0, 0.0] |
| 32.6 DCC > 2 mins and baby held low | 0 | 0 | Risk Ratio (M‐H, Random, 95% CI) | 0.0 [0.0, 0.0] |
| 32.7 Mixed interventions or unclear | 0 | 0 | Risk Ratio (M‐H, Random, 95% CI) | 0.0 [0.0, 0.0] |
| 33 Blood transfusion for mother Show forest plot | 1 | 1176 | Risk Ratio (M‐H, Random, 95% CI) | 0.67 [0.36, 1.24] |
| 33.1 DCC < 1 min and baby level with uterus | 0 | 0 | Risk Ratio (M‐H, Random, 95% CI) | 0.0 [0.0, 0.0] |
| 33.2 DCC < 1 min and baby held low | 0 | 0 | Risk Ratio (M‐H, Random, 95% CI) | 0.0 [0.0, 0.0] |
| 33.3 DCC 1‐2 mins and baby level with uterus | 0 | 0 | Risk Ratio (M‐H, Random, 95% CI) | 0.0 [0.0, 0.0] |
| 33.4 DCC 1‐2 mins and baby held low | 1 | 1176 | Risk Ratio (M‐H, Random, 95% CI) | 0.67 [0.36, 1.24] |
| 33.5 DCC > 2 mins and baby level with uterus | 0 | 0 | Risk Ratio (M‐H, Random, 95% CI) | 0.0 [0.0, 0.0] |
| 33.6 DCC > 2 mins and baby held low | 0 | 0 | Risk Ratio (M‐H, Random, 95% CI) | 0.0 [0.0, 0.0] |
| 33.7 Mixed interventions or unclear | 0 | 0 | Risk Ratio (M‐H, Random, 95% CI) | 0.0 [0.0, 0.0] |
| 34 Postpartum infection in mother | 0 | 0 | Risk Ratio (M‐H, Random, 95% CI) | 0.0 [0.0, 0.0] |
| 34.1 DCC < 1 min and baby level with uterus | 0 | 0 | Risk Ratio (M‐H, Random, 95% CI) | 0.0 [0.0, 0.0] |
| 34.2 DCC < 1 min and baby held low | 0 | 0 | Risk Ratio (M‐H, Random, 95% CI) | 0.0 [0.0, 0.0] |
| 34.3 DCC 1‐2 mins and baby level with uterus | 0 | 0 | Risk Ratio (M‐H, Random, 95% CI) | 0.0 [0.0, 0.0] |
| 34.4 DCC 1‐2 mins and baby held low | 0 | 0 | Risk Ratio (M‐H, Random, 95% CI) | 0.0 [0.0, 0.0] |
| 34.5 DCC > 2 mins and baby level with uterus | 0 | 0 | Risk Ratio (M‐H, Random, 95% CI) | 0.0 [0.0, 0.0] |
| 34.6 DCC > 2 mins and baby held low | 0 | 0 | Risk Ratio (M‐H, Random, 95% CI) | 0.0 [0.0, 0.0] |
| 34.7 Mixed interventions or unclear | 0 | 0 | Risk Ratio (M‐H, Random, 95% CI) | 0.0 [0.0, 0.0] |
| 35 Rhesus isoimmunisation | 0 | 0 | Risk Ratio (M‐H, Random, 95% CI) | 0.0 [0.0, 0.0] |
| 35.1 DCC < 1 min and baby level with uterus | 0 | 0 | Risk Ratio (M‐H, Random, 95% CI) | 0.0 [0.0, 0.0] |
| 35.2 DCC < 1 min and baby held low | 0 | 0 | Risk Ratio (M‐H, Random, 95% CI) | 0.0 [0.0, 0.0] |
| 35.3 DCC 1‐2 mins and baby level with uterus | 0 | 0 | Risk Ratio (M‐H, Random, 95% CI) | 0.0 [0.0, 0.0] |
| 35.4 DCC 1‐2 mins and baby held low | 0 | 0 | Risk Ratio (M‐H, Random, 95% CI) | 0.0 [0.0, 0.0] |
| 35.5 DCC > 2 mins and baby level with uterus | 0 | 0 | Risk Ratio (M‐H, Random, 95% CI) | 0.0 [0.0, 0.0] |
| 35.6 DCC > 2 mins and baby held low | 0 | 0 | Risk Ratio (M‐H, Random, 95% CI) | 0.0 [0.0, 0.0] |
| 35.7 Mixed interventions or unclear | 0 | 0 | Risk Ratio (M‐H, Random, 95% CI) | 0.0 [0.0, 0.0] |
| 36 Psychological well being in mother | 0 | 0 | Std. Mean Difference (IV, Random, 95% CI) | 0.0 [0.0, 0.0] |
| 36.1 DCC < 1 min and baby level with uterus | 0 | 0 | Std. Mean Difference (IV, Random, 95% CI) | 0.0 [0.0, 0.0] |
| 36.2 DCC < 1 min and baby held low | 0 | 0 | Std. Mean Difference (IV, Random, 95% CI) | 0.0 [0.0, 0.0] |
| 36.3 DCC 1‐2 mins and baby level with uterus | 0 | 0 | Std. Mean Difference (IV, Random, 95% CI) | 0.0 [0.0, 0.0] |
| 36.4 DCC 1‐2 mins and baby held low | 0 | 0 | Std. Mean Difference (IV, Random, 95% CI) | 0.0 [0.0, 0.0] |
| 36.5 DCC > 2 mins and baby level with uterus | 0 | 0 | Std. Mean Difference (IV, Random, 95% CI) | 0.0 [0.0, 0.0] |
| 36.6 DCC > 2 mins and baby held low | 0 | 0 | Std. Mean Difference (IV, Random, 95% CI) | 0.0 [0.0, 0.0] |
| 36.7 Mixed interventions or unclear | 0 | 0 | Std. Mean Difference (IV, Random, 95% CI) | 0.0 [0.0, 0.0] |
| 37 Bonding | 0 | 0 | Std. Mean Difference (IV, Random, 95% CI) | 0.0 [0.0, 0.0] |
| 37.1 DCC < 1 min and baby level with uterus | 0 | 0 | Std. Mean Difference (IV, Random, 95% CI) | 0.0 [0.0, 0.0] |
| 37.2 DCC < 1 min and baby held low | 0 | 0 | Std. Mean Difference (IV, Random, 95% CI) | 0.0 [0.0, 0.0] |
| 37.3 DCC 1‐2 mins and baby level with uterus | 0 | 0 | Std. Mean Difference (IV, Random, 95% CI) | 0.0 [0.0, 0.0] |
| 37.4 DCC 1‐2 mins and baby held low | 0 | 0 | Std. Mean Difference (IV, Random, 95% CI) | 0.0 [0.0, 0.0] |
| 37.5 DCC > 2 mins and baby level with uterus | 0 | 0 | Std. Mean Difference (IV, Random, 95% CI) | 0.0 [0.0, 0.0] |
| 37.6 DCC > 2 mins and baby held low | 0 | 0 | Std. Mean Difference (IV, Random, 95% CI) | 0.0 [0.0, 0.0] |
| 37.7 Mixed interventions or unclear | 0 | 0 | Std. Mean Difference (IV, Random, 95% CI) | 0.0 [0.0, 0.0] |
| 38 Breastfeeding initiation | 0 | 0 | Risk Ratio (M‐H, Random, 95% CI) | 0.0 [0.0, 0.0] |
| 38.1 DCC < 1 min and baby level with uterus | 0 | 0 | Risk Ratio (M‐H, Random, 95% CI) | 0.0 [0.0, 0.0] |
| 38.2 DCC < 1 min and baby held low | 0 | 0 | Risk Ratio (M‐H, Random, 95% CI) | 0.0 [0.0, 0.0] |
| 38.3 DCC 1‐2 mins and baby level with uterus | 0 | 0 | Risk Ratio (M‐H, Random, 95% CI) | 0.0 [0.0, 0.0] |
| 38.4 DCC 1‐2 mins and baby held low | 0 | 0 | Risk Ratio (M‐H, Random, 95% CI) | 0.0 [0.0, 0.0] |
| 38.5 DCC > 2 mins and baby level with uterus | 0 | 0 | Risk Ratio (M‐H, Random, 95% CI) | 0.0 [0.0, 0.0] |
| 38.6 DCC > 2 mins and baby held low | 0 | 0 | Risk Ratio (M‐H, Random, 95% CI) | 0.0 [0.0, 0.0] |
| 38.7 Mixed interventions or unclear | 0 | 0 | Risk Ratio (M‐H, Random, 95% CI) | 0.0 [0.0, 0.0] |
| 39 Fully breastfed or mixed feeding at infant discharge Show forest plot | 1 | 94 | Risk Ratio (M‐H, Random, 95% CI) | 1.11 [1.00, 1.23] |
| 39.1 DCC < 1 min and baby level with uterus | 0 | 0 | Risk Ratio (M‐H, Random, 95% CI) | 0.0 [0.0, 0.0] |
| 39.2 DCC < 1 min and baby held low | 0 | 0 | Risk Ratio (M‐H, Random, 95% CI) | 0.0 [0.0, 0.0] |
| 39.3 DCC 1‐2 mins and baby level with uterus | 0 | 0 | Risk Ratio (M‐H, Random, 95% CI) | 0.0 [0.0, 0.0] |
| 39.4 DCC 1‐2 mins and baby held low | 0 | 0 | Risk Ratio (M‐H, Random, 95% CI) | 0.0 [0.0, 0.0] |
| 39.5 DCC > 2 mins and baby level with uterus | 1 | 94 | Risk Ratio (M‐H, Random, 95% CI) | 1.11 [1.00, 1.23] |
| 39.6 DCC > 2 mins and baby held low | 0 | 0 | Risk Ratio (M‐H, Random, 95% CI) | 0.0 [0.0, 0.0] |
| 39.7 Mixed interventions or unclear | 0 | 0 | Risk Ratio (M‐H, Random, 95% CI) | 0.0 [0.0, 0.0] |
| 40 Maternal anxiety | 0 | 0 | Risk Ratio (M‐H, Random, 95% CI) | 0.0 [0.0, 0.0] |
| 40.1 DCC < 1 min and baby level with uterus | 0 | 0 | Risk Ratio (M‐H, Random, 95% CI) | 0.0 [0.0, 0.0] |
| 40.2 DCC < 1 min and baby held low | 0 | 0 | Risk Ratio (M‐H, Random, 95% CI) | 0.0 [0.0, 0.0] |
| 40.3 DCC 1‐2 mins and baby level with uterus | 0 | 0 | Risk Ratio (M‐H, Random, 95% CI) | 0.0 [0.0, 0.0] |
| 40.4 DCC 1‐2 mins and baby held low | 0 | 0 | Risk Ratio (M‐H, Random, 95% CI) | 0.0 [0.0, 0.0] |
| 40.5 DCC > 2 mins and baby level with uterus | 0 | 0 | Risk Ratio (M‐H, Random, 95% CI) | 0.0 [0.0, 0.0] |
| 40.6 DCC > 2 mins and baby held low | 0 | 0 | Risk Ratio (M‐H, Random, 95% CI) | 0.0 [0.0, 0.0] |
| 40.7 Mixed interventions or unclear | 0 | 0 | Risk Ratio (M‐H, Random, 95% CI) | 0.0 [0.0, 0.0] |
| 41 Mothers' views | 0 | 0 | Std. Mean Difference (IV, Random, 95% CI) | 0.0 [0.0, 0.0] |
| 41.1 DCC < 1 min and baby level with uterus | 0 | 0 | Std. Mean Difference (IV, Random, 95% CI) | 0.0 [0.0, 0.0] |
| 41.2 DCC < 1 min and baby held low | 0 | 0 | Std. Mean Difference (IV, Random, 95% CI) | 0.0 [0.0, 0.0] |
| 41.3 DCC 1‐2 mins and baby level with uterus | 0 | 0 | Std. Mean Difference (IV, Random, 95% CI) | 0.0 [0.0, 0.0] |
| 41.4 DCC 1‐2 mins and baby held low | 0 | 0 | Std. Mean Difference (IV, Random, 95% CI) | 0.0 [0.0, 0.0] |
| 41.5 DCC > 2 mins and baby level with uterus | 0 | 0 | Std. Mean Difference (IV, Random, 95% CI) | 0.0 [0.0, 0.0] |
| 41.6 DCC > 2 mins and baby held low | 0 | 0 | Std. Mean Difference (IV, Random, 95% CI) | 0.0 [0.0, 0.0] |
| 41.7 Mixed interventions or unclear | 0 | 0 | Std. Mean Difference (IV, Random, 95% CI) | 0.0 [0.0, 0.0] |
| 42 Neurosensory disability at 7 months (Bailey's MDI < 70) ‐ not prespecified Show forest plot | 2 | 73 | Risk Ratio (M‐H, Random, 95% CI) | 1.64 [0.66, 4.09] |
| 42.1 DCC < 1 min and baby level with uterus | 0 | 0 | Risk Ratio (M‐H, Random, 95% CI) | 0.0 [0.0, 0.0] |
| 42.2 DCC < 1 min and baby held low | 2 | 73 | Risk Ratio (M‐H, Random, 95% CI) | 1.64 [0.66, 4.09] |
| 42.3 DCC 1‐2 mins and baby level with uterus | 0 | 0 | Risk Ratio (M‐H, Random, 95% CI) | 0.0 [0.0, 0.0] |
| 42.4 DCC 1‐2 mins and baby held low | 0 | 0 | Risk Ratio (M‐H, Random, 95% CI) | 0.0 [0.0, 0.0] |
| 42.5 DCC > 2 mins and baby level with uterus | 0 | 0 | Risk Ratio (M‐H, Random, 95% CI) | 0.0 [0.0, 0.0] |
| 42.6 DCC > 2 mins and baby held low | 0 | 0 | Risk Ratio (M‐H, Random, 95% CI) | 0.0 [0.0, 0.0] |
| 42.7 Mixed interventions or unclear | 0 | 0 | Risk Ratio (M‐H, Random, 95% CI) | 0.0 [0.0, 0.0] |
| Outcome or subgroup title | No. of studies | No. of participants | Statistical method | Effect size |
| 1 Death of baby (up to discharge) Show forest plot | 1 | 270 | Risk Ratio (M‐H, Random, 95% CI) | 0.47 [0.20, 1.11] |
| 1.1 < 32‐34 weeks gestation | 1 | 270 | Risk Ratio (M‐H, Random, 95% CI) | 0.47 [0.20, 1.11] |
| 1.2 > 32‐34 weeks gestation | 0 | 0 | Risk Ratio (M‐H, Random, 95% CI) | 0.0 [0.0, 0.0] |
| 1.3 Mixed gestation | 0 | 0 | Risk Ratio (M‐H, Random, 95% CI) | 0.0 [0.0, 0.0] |
| 2 Death or neurodevelopmental impairment at age two to three years Show forest plot | 1 | 218 | Risk Ratio (M‐H, Random, 95% CI) | 0.61 [0.39, 0.96] |
| 2.1 < 32‐34 weeks gestation | 1 | 218 | Risk Ratio (M‐H, Random, 95% CI) | 0.61 [0.39, 0.96] |
| 2.2 > 32‐34 weeks gestation | 0 | 0 | Risk Ratio (M‐H, Random, 95% CI) | 0.0 [0.0, 0.0] |
| 2.3 Mixed gestation | 0 | 0 | Risk Ratio (M‐H, Random, 95% CI) | 0.0 [0.0, 0.0] |
| 3 Severe intraventricular haemorrhage (IVH grades 3, 4) Show forest plot | 1 | 266 | Risk Ratio (M‐H, Random, 95% CI) | 0.84 [0.29, 2.45] |
| 3.1 < 32‐34 weeks gestation | 1 | 266 | Risk Ratio (M‐H, Random, 95% CI) | 0.84 [0.29, 2.45] |
| 3.2 > 32‐34 weeks gestation | 0 | 0 | Risk Ratio (M‐H, Random, 95% CI) | 0.0 [0.0, 0.0] |
| 3.3 Mixed gestation | 0 | 0 | Risk Ratio (M‐H, Random, 95% CI) | 0.0 [0.0, 0.0] |
| 4 Intraventricular haemorrhage (IVH, all grades) Show forest plot | 1 | 266 | Risk Ratio (M‐H, Random, 95% CI) | 0.90 [0.64, 1.26] |
| 4.1 < 32‐34 weeks gestation | 1 | 266 | Risk Ratio (M‐H, Random, 95% CI) | 0.90 [0.64, 1.26] |
| 4.2 > 32‐34 weeks gestation | 0 | 0 | Risk Ratio (M‐H, Random, 95% CI) | 0.0 [0.0, 0.0] |
| 4.3 Mixed gestation | 0 | 0 | Risk Ratio (M‐H, Random, 95% CI) | 0.0 [0.0, 0.0] |
| 5 Periventricular leukomalacia (PVL) Show forest plot | 1 | 266 | Risk Ratio (M‐H, Random, 95% CI) | 0.86 [0.32, 2.31] |
| 5.1 < 32‐34 weeks gestation | 1 | 266 | Risk Ratio (M‐H, Random, 95% CI) | 0.86 [0.32, 2.31] |
| 5.2 > 32‐34 weeks gestation | 0 | 0 | Risk Ratio (M‐H, Random, 95% CI) | 0.0 [0.0, 0.0] |
| 5.3 Mixed gestation | 0 | 0 | Risk Ratio (M‐H, Random, 95% CI) | 0.0 [0.0, 0.0] |
| 6 Chronic lung disease (CLD) ‐ oxygen supplement at 36 weeks (corrected for gestation) Show forest plot | 1 | 249 | Risk Ratio (M‐H, Random, 95% CI) | 0.95 [0.66, 1.37] |
| 6.1 < 32‐34 weeks gestation | 1 | 249 | Risk Ratio (M‐H, Random, 95% CI) | 0.95 [0.66, 1.37] |
| 6.2 > 32‐34 weeks gestation | 0 | 0 | Risk Ratio (M‐H, Random, 95% CI) | 0.0 [0.0, 0.0] |
| 6.3 Mixed gestation | 0 | 0 | Risk Ratio (M‐H, Random, 95% CI) | 0.0 [0.0, 0.0] |
| 7 Maternal blood loss of 500 mL or greater Show forest plot | 1 | 254 | Risk Ratio (M‐H, Random, 95% CI) | 0.94 [0.72, 1.22] |
| 7.1 < 32‐34 weeks gestation | 1 | 254 | Risk Ratio (M‐H, Random, 95% CI) | 0.94 [0.72, 1.22] |
| 7.2 > 32‐34 weeks gestation | 0 | 0 | Risk Ratio (M‐H, Random, 95% CI) | 0.0 [0.0, 0.0] |
| 7.3 Mixed gestation | 0 | 0 | Risk Ratio (M‐H, Random, 95% CI) | 0.0 [0.0, 0.0] |
| 8 Intraventricular haemorrhage (IVH, grades 1 & 2) Show forest plot | 1 | 266 | Risk Ratio (M‐H, Random, 95% CI) | 0.91 [0.63, 1.33] |
| 8.1 < 32‐34 weeks gestation | 1 | 266 | Risk Ratio (M‐H, Random, 95% CI) | 0.91 [0.63, 1.33] |
| 8.2 > 32‐34 weeks gestation | 0 | 0 | Risk Ratio (M‐H, Random, 95% CI) | 0.0 [0.0, 0.0] |
| 8.3 Mixed gestation | 0 | 0 | Risk Ratio (M‐H, Random, 95% CI) | 0.0 [0.0, 0.0] |
| 9 Necrotising enterocolitis (NEC) confirmed by X‐ray or laparotomy) Show forest plot | 1 | 266 | Risk Ratio (M‐H, Random, 95% CI) | 1.58 [0.53, 4.69] |
| 9.1 < 32‐34 weeks gestation | 1 | 266 | Risk Ratio (M‐H, Random, 95% CI) | 1.58 [0.53, 4.69] |
| 9.2 > 32‐34 weeks gestation | 0 | 0 | Risk Ratio (M‐H, Random, 95% CI) | 0.0 [0.0, 0.0] |
| 9.3 Mixed gestation | 0 | 0 | Risk Ratio (M‐H, Random, 95% CI) | 0.0 [0.0, 0.0] |
| 10 Respiratory Distress Syndrome (RDS) | 0 | 0 | Risk Ratio (M‐H, Random, 95% CI) | 0.0 [0.0, 0.0] |
| 10.1 < 32‐34 weeks gestation | 0 | 0 | Risk Ratio (M‐H, Random, 95% CI) | 0.0 [0.0, 0.0] |
| 10.2 > 32‐34 weeks gestation | 0 | 0 | Risk Ratio (M‐H, Random, 95% CI) | 0.0 [0.0, 0.0] |
| 10.3 Mixed gestation | 0 | 0 | Risk Ratio (M‐H, Random, 95% CI) | 0.0 [0.0, 0.0] |
| 11 Respiratory support (ventilator or CPAP) Show forest plot | 1 | 266 | Risk Ratio (M‐H, Random, 95% CI) | 0.96 [0.84, 1.09] |
| 11.1 < 32‐34 weeks gestation | 1 | 266 | Risk Ratio (M‐H, Random, 95% CI) | 0.96 [0.84, 1.09] |
| 11.2 > 32‐34 weeks gestation | 0 | 0 | Risk Ratio (M‐H, Random, 95% CI) | 0.0 [0.0, 0.0] |
| 11.3 Mixed gestation | 0 | 0 | Risk Ratio (M‐H, Random, 95% CI) | 0.0 [0.0, 0.0] |
| 12 Duration of respiratory support | 0 | 0 | Mean Difference (IV, Random, 95% CI) | 0.0 [0.0, 0.0] |
| 12.1 < 32‐34 weeks gestation | 0 | 0 | Mean Difference (IV, Random, 95% CI) | 0.0 [0.0, 0.0] |
| 12.2 > 32‐34 weeks gestation | 0 | 0 | Mean Difference (IV, Random, 95% CI) | 0.0 [0.0, 0.0] |
| 12.3 Mixed gestation | 0 | 0 | Mean Difference (IV, Random, 95% CI) | 0.0 [0.0, 0.0] |
| 13 Surfactant treatment (for severe RDS) | 0 | 0 | Risk Ratio (M‐H, Random, 95% CI) | 0.0 [0.0, 0.0] |
| 13.1 < 32‐34 weeks gestation | 0 | 0 | Risk Ratio (M‐H, Random, 95% CI) | 0.0 [0.0, 0.0] |
| 13.2 > 32‐34 weeks gestation | 0 | 0 | Risk Ratio (M‐H, Random, 95% CI) | 0.0 [0.0, 0.0] |
| 13.3 Mixed gestation | 0 | 0 | Risk Ratio (M‐H, Random, 95% CI) | 0.0 [0.0, 0.0] |
| 14 Treatment for Patent Ductus Arteriosus (PDA) (medical and/or surgical) Show forest plot | 1 | 266 | Risk Ratio (M‐H, Random, 95% CI) | 0.99 [0.56, 1.74] |
| 14.1 < 32‐34 weeks gestation | 1 | 266 | Risk Ratio (M‐H, Random, 95% CI) | 0.99 [0.56, 1.74] |
| 14.2 > 32‐34 weeks gestation | 0 | 0 | Risk Ratio (M‐H, Random, 95% CI) | 0.0 [0.0, 0.0] |
| 14.3 Mixed gestation | 0 | 0 | Risk Ratio (M‐H, Random, 95% CI) | 0.0 [0.0, 0.0] |
| 15 Treatment for Retinopathy of Prematurity (RoP) Show forest plot | 1 | 249 | Risk Ratio (M‐H, Random, 95% CI) | 0.93 [0.28, 3.13] |
| 15.1 < 32‐34 weeks gestation | 1 | 249 | Risk Ratio (M‐H, Random, 95% CI) | 0.93 [0.28, 3.13] |
| 15.2 > 32‐34 weeks gestation | 0 | 0 | Risk Ratio (M‐H, Random, 95% CI) | 0.0 [0.0, 0.0] |
| 15.3 Mixed gestation | 0 | 0 | Risk Ratio (M‐H, Random, 95% CI) | 0.0 [0.0, 0.0] |
| 16 Hyperbilirubinemia (treated by phototherapy) Show forest plot | 1 | 266 | Risk Ratio (M‐H, Random, 95% CI) | 1.01 [0.94, 1.09] |
| 16.1 < 32‐34 weeks gestation | 1 | 266 | Risk Ratio (M‐H, Random, 95% CI) | 1.01 [0.94, 1.09] |
| 16.2 > 32‐34 weeks gestation | 0 | 0 | Risk Ratio (M‐H, Random, 95% CI) | 0.0 [0.0, 0.0] |
| 16.3 Mixed gestation | 0 | 0 | Risk Ratio (M‐H, Random, 95% CI) | 0.0 [0.0, 0.0] |
| 17 Inotropics for low blood pressure | 0 | 0 | Risk Ratio (M‐H, Random, 95% CI) | 0.0 [0.0, 0.0] |
| 17.1 < 32‐34 weeks gestation | 0 | 0 | Risk Ratio (M‐H, Random, 95% CI) | 0.0 [0.0, 0.0] |
| 17.2 > 32‐34 weeks gestation | 0 | 0 | Risk Ratio (M‐H, Random, 95% CI) | 0.0 [0.0, 0.0] |
| 17.3 Mixed gestation | 0 | 0 | Risk Ratio (M‐H, Random, 95% CI) | 0.0 [0.0, 0.0] |
| 18 Low Apgar as defined by trialists (generally < 8 at 5 mins) | 0 | 0 | Risk Ratio (M‐H, Random, 95% CI) | 0.0 [0.0, 0.0] |
| 18.1 < 32‐34 weeks gestation | 0 | 0 | Risk Ratio (M‐H, Random, 95% CI) | 0.0 [0.0, 0.0] |
| 18.2 > 32‐34 weeks gestation | 0 | 0 | Risk Ratio (M‐H, Random, 95% CI) | 0.0 [0.0, 0.0] |
| 18.3 Mixed gestation | 0 | 0 | Risk Ratio (M‐H, Random, 95% CI) | 0.0 [0.0, 0.0] |
| 19 Blood transfusion in infant Show forest plot | 1 | 266 | Risk Ratio (M‐H, Random, 95% CI) | 0.91 [0.71, 1.17] |
| 19.1 < 32‐34 weeks gestation | 1 | 266 | Risk Ratio (M‐H, Random, 95% CI) | 0.91 [0.71, 1.17] |
| 19.2 > 32‐34 weeks gestation | 0 | 0 | Risk Ratio (M‐H, Random, 95% CI) | 0.0 [0.0, 0.0] |
| 19.3 Mixed gestation | 0 | 0 | Risk Ratio (M‐H, Random, 95% CI) | 0.0 [0.0, 0.0] |
| 20 Volume of blood transfused (mL) | 0 | 0 | Mean Difference (IV, Random, 95% CI) | 0.0 [0.0, 0.0] |
| 20.1 < 32‐34 weeks gestation | 0 | 0 | Mean Difference (IV, Random, 95% CI) | 0.0 [0.0, 0.0] |
| 20.2 > 32‐34 weeks gestation | 0 | 0 | Mean Difference (IV, Random, 95% CI) | 0.0 [0.0, 0.0] |
| 20.3 Mixed gestation | 0 | 0 | Mean Difference (IV, Random, 95% CI) | 0.0 [0.0, 0.0] |
| 21 Late sepsis (after 3 days or as defined by trialists) Show forest plot | 1 | 266 | Risk Ratio (M‐H, Random, 95% CI) | 0.89 [0.72, 1.09] |
| 21.1 < 32‐34 weeks gestation | 1 | 266 | Risk Ratio (M‐H, Random, 95% CI) | 0.89 [0.72, 1.09] |
| 21.2 > 32‐34 weeks gestation | 0 | 0 | Risk Ratio (M‐H, Random, 95% CI) | 0.0 [0.0, 0.0] |
| 21.3 Mixed gestation | 0 | 0 | Risk Ratio (M‐H, Random, 95% CI) | 0.0 [0.0, 0.0] |
| 22 Hydrocephalus Show forest plot | 1 | 266 | Risk Ratio (M‐H, Random, 95% CI) | 0.99 [0.14, 6.89] |
| 22.1 < 32‐34 weeks gestation | 1 | 266 | Risk Ratio (M‐H, Random, 95% CI) | 0.99 [0.14, 6.89] |
| 22.2 > 32‐34 weeks gestation | 0 | 0 | Risk Ratio (M‐H, Random, 95% CI) | 0.0 [0.0, 0.0] |
| 22.3 Mixed gestation | 0 | 0 | Risk Ratio (M‐H, Random, 95% CI) | 0.0 [0.0, 0.0] |
| 23 Temperature < 36.0oC within 1 hour of birth Show forest plot | 1 | 266 | Risk Ratio (M‐H, Random, 95% CI) | 1.20 [0.61, 2.33] |
| 23.1 < 32‐34 weeks gestation | 1 | 266 | Risk Ratio (M‐H, Random, 95% CI) | 1.20 [0.61, 2.33] |
| 23.2 > 32‐34 weeks gestation | 0 | 0 | Risk Ratio (M‐H, Random, 95% CI) | 0.0 [0.0, 0.0] |
| 23.3 Mixed gestation | 0 | 0 | Risk Ratio (M‐H, Random, 95% CI) | 0.0 [0.0, 0.0] |
| 24 Hb within 1st 24 hour of birth (g/dL) | 0 | 0 | Mean Difference (IV, Random, 95% CI) | 0.0 [0.0, 0.0] |
| 24.1 < 32‐34 weeks gestation | 0 | 0 | Mean Difference (IV, Random, 95% CI) | 0.0 [0.0, 0.0] |
| 24.2 > 32‐34 weeks gestation | 0 | 0 | Mean Difference (IV, Random, 95% CI) | 0.0 [0.0, 0.0] |
| 24.3 Mixed gestation | 0 | 0 | Mean Difference (IV, Random, 95% CI) | 0.0 [0.0, 0.0] |
| 25 Mean arterial blood pressure (subgrouped by time after birth) | 0 | 0 | Mean Difference (IV, Random, 95% CI) | 0.0 [0.0, 0.0] |
| 25.1 < 32‐34 weeks gestation | 0 | 0 | Mean Difference (IV, Random, 95% CI) | 0.0 [0.0, 0.0] |
| 25.2 Mixed gestation | 0 | 0 | Mean Difference (IV, Random, 95% CI) | 0.0 [0.0, 0.0] |
| 25.3 > 32‐34 weeks gestation | 0 | 0 | Mean Difference (IV, Random, 95% CI) | 0.0 [0.0, 0.0] |
| 26 Length of infant stay in NICU | 0 | 0 | Mean Difference (IV, Random, 95% CI) | 0.0 [0.0, 0.0] |
| 26.1 < 32‐34 weeks gestation | 0 | 0 | Mean Difference (IV, Random, 95% CI) | 0.0 [0.0, 0.0] |
| 26.2 > 32‐34 weeks gestation | 0 | 0 | Mean Difference (IV, Random, 95% CI) | 0.0 [0.0, 0.0] |
| 26.3 Mixed gestation | 0 | 0 | Mean Difference (IV, Random, 95% CI) | 0.0 [0.0, 0.0] |
| 27 Home oxygen | 0 | 0 | Risk Ratio (M‐H, Random, 95% CI) | 0.0 [0.0, 0.0] |
| 27.1 < 32‐34 weeks gestation | 0 | 0 | Risk Ratio (M‐H, Random, 95% CI) | 0.0 [0.0, 0.0] |
| 27.2 > 32‐34 weeks gestation | 0 | 0 | Risk Ratio (M‐H, Random, 95% CI) | 0.0 [0.0, 0.0] |
| 27.3 Mixed gestation | 0 | 0 | Risk Ratio (M‐H, Random, 95% CI) | 0.0 [0.0, 0.0] |
| 28 Neurodevelopmental impairment at age two to three years Show forest plot | 1 | 218 | Risk Ratio (M‐H, Random, 95% CI) | 0.75 [0.41, 1.39] |
| 28.1 < 32‐34 weeks gestation | 1 | 218 | Risk Ratio (M‐H, Random, 95% CI) | 0.75 [0.41, 1.39] |
| 28.2 > 32‐34 weeks gestation | 0 | 0 | Risk Ratio (M‐H, Random, 95% CI) | 0.0 [0.0, 0.0] |
| 28.3 Mixed gestation | 0 | 0 | Risk Ratio (M‐H, Random, 95% CI) | 0.0 [0.0, 0.0] |
| 29 Severe visual impairment | 0 | 0 | Risk Ratio (M‐H, Random, 95% CI) | 0.0 [0.0, 0.0] |
| 29.1 < 32‐34 weeks gestation | 0 | 0 | Risk Ratio (M‐H, Random, 95% CI) | 0.0 [0.0, 0.0] |
| 29.2 > 32‐34 weeks gestation | 0 | 0 | Risk Ratio (M‐H, Random, 95% CI) | 0.0 [0.0, 0.0] |
| 29.3 Mixed gestation | 0 | 0 | Risk Ratio (M‐H, Random, 95% CI) | 0.0 [0.0, 0.0] |
| 30 Cerebral palsy (CP) | 0 | 0 | Risk Ratio (M‐H, Random, 95% CI) | 0.0 [0.0, 0.0] |
| 30.1 < 32‐34 weeks gestation | 0 | 0 | Risk Ratio (M‐H, Random, 95% CI) | 0.0 [0.0, 0.0] |
| 30.2 > 32‐34 weeks gestation | 0 | 0 | Risk Ratio (M‐H, Random, 95% CI) | 0.0 [0.0, 0.0] |
| 30.3 Mixed gestation | 0 | 0 | Risk Ratio (M‐H, Random, 95% CI) | 0.0 [0.0, 0.0] |
| 31 Manual removal of placenta (denominator = vaginal births) Show forest plot | 1 | 105 | Risk Ratio (M‐H, Random, 95% CI) | 0.99 [0.32, 3.04] |
| 31.1 < 32‐34 weeks gestation | 1 | 105 | Risk Ratio (M‐H, Random, 95% CI) | 0.99 [0.32, 3.04] |
| 31.2 > 32‐34 weeks gestation | 0 | 0 | Risk Ratio (M‐H, Random, 95% CI) | 0.0 [0.0, 0.0] |
| 31.3 Mixed gestation | 0 | 0 | Risk Ratio (M‐H, Random, 95% CI) | 0.0 [0.0, 0.0] |
| 32 Prolonged third stage (>30 minutes) (denominator = vaginal births) Show forest plot | 1 | 105 | Risk Ratio (M‐H, Random, 95% CI) | 0.79 [0.24, 2.64] |
| 32.1 < 32‐34 weeks gestation | 1 | 105 | Risk Ratio (M‐H, Random, 95% CI) | 0.79 [0.24, 2.64] |
| 32.2 > 32‐34 weeks gestation | 0 | 0 | Risk Ratio (M‐H, Random, 95% CI) | 0.0 [0.0, 0.0] |
| 32.3 Mixed gestation | 0 | 0 | Risk Ratio (M‐H, Random, 95% CI) | 0.0 [0.0, 0.0] |
| 33 Blood transfusion for mother Show forest plot | 1 | 254 | Risk Ratio (M‐H, Random, 95% CI) | 1.59 [0.39, 6.51] |
| 33.1 < 32‐34 weeks gestation | 1 | 254 | Risk Ratio (M‐H, Random, 95% CI) | 1.59 [0.39, 6.51] |
| 33.2 > 32‐34 weeks gestation | 0 | 0 | Risk Ratio (M‐H, Random, 95% CI) | 0.0 [0.0, 0.0] |
| 33.3 Mixed gestation | 0 | 0 | Risk Ratio (M‐H, Random, 95% CI) | 0.0 [0.0, 0.0] |
| 34 Postpartum infection in mother Show forest plot | 1 | 254 | Risk Ratio (M‐H, Random, 95% CI) | 1.12 [0.73, 1.72] |
| 34.1 < 32‐34 weeks gestation | 1 | 254 | Risk Ratio (M‐H, Random, 95% CI) | 1.12 [0.73, 1.72] |
| 34.2 > 32‐34 weeks gestation | 0 | 0 | Risk Ratio (M‐H, Random, 95% CI) | 0.0 [0.0, 0.0] |
| 34.3 Mixed gestation | 0 | 0 | Risk Ratio (M‐H, Random, 95% CI) | 0.0 [0.0, 0.0] |
| 35 Rhesus isoimmunisation | 0 | 0 | Risk Ratio (M‐H, Random, 95% CI) | 0.0 [0.0, 0.0] |
| 35.1 < 32‐34 weeks gestation | 0 | 0 | Risk Ratio (M‐H, Random, 95% CI) | 0.0 [0.0, 0.0] |
| 35.2 > 32‐34 weeks gestation | 0 | 0 | Risk Ratio (M‐H, Random, 95% CI) | 0.0 [0.0, 0.0] |
| 35.3 Mixed gestation | 0 | 0 | Risk Ratio (M‐H, Random, 95% CI) | 0.0 [0.0, 0.0] |
| 36 Psychological well being in mother | 0 | 0 | Std. Mean Difference (IV, Random, 95% CI) | 0.0 [0.0, 0.0] |
| 36.1 < 32‐34 weeks gestation | 0 | 0 | Std. Mean Difference (IV, Random, 95% CI) | 0.0 [0.0, 0.0] |
| 36.2 > 32‐34 weeks gestation | 0 | 0 | Std. Mean Difference (IV, Random, 95% CI) | 0.0 [0.0, 0.0] |
| 36.3 Mixed gestation | 0 | 0 | Std. Mean Difference (IV, Random, 95% CI) | 0.0 [0.0, 0.0] |
| 37 Bonding | 0 | 0 | Std. Mean Difference (IV, Random, 95% CI) | 0.0 [0.0, 0.0] |
| 37.1 < 32‐34 weeks gestation | 0 | 0 | Std. Mean Difference (IV, Random, 95% CI) | 0.0 [0.0, 0.0] |
| 37.2 > 32‐34 weeks gestation | 0 | 0 | Std. Mean Difference (IV, Random, 95% CI) | 0.0 [0.0, 0.0] |
| 37.3 Mixed gestation | 0 | 0 | Std. Mean Difference (IV, Random, 95% CI) | 0.0 [0.0, 0.0] |
| 38 Breastfeeding initiation | 0 | 0 | Risk Ratio (M‐H, Random, 95% CI) | 0.0 [0.0, 0.0] |
| 38.1 < 32‐34 weeks gestation | 0 | 0 | Risk Ratio (M‐H, Random, 95% CI) | 0.0 [0.0, 0.0] |
| 38.2 > 32‐34 weeks gestation | 0 | 0 | Risk Ratio (M‐H, Random, 95% CI) | 0.0 [0.0, 0.0] |
| 38.3 Mixed gestation | 0 | 0 | Risk Ratio (M‐H, Random, 95% CI) | 0.0 [0.0, 0.0] |
| 39 Fully breastfed or mixed feeding at infant discharge Show forest plot | 1 | 248 | Risk Ratio (M‐H, Random, 95% CI) | 0.98 [0.79, 1.22] |
| 39.1 < 32‐34 weeks gestation | 1 | 248 | Risk Ratio (M‐H, Random, 95% CI) | 0.98 [0.79, 1.22] |
| 39.2 > 32‐34 weeks gestation | 0 | 0 | Risk Ratio (M‐H, Random, 95% CI) | 0.0 [0.0, 0.0] |
| 39.3 Mixed gestation | 0 | 0 | Risk Ratio (M‐H, Random, 95% CI) | 0.0 [0.0, 0.0] |
| 40 Maternal anxiety | 0 | 0 | Risk Ratio (M‐H, Random, 95% CI) | 0.0 [0.0, 0.0] |
| 40.1 < 32‐34 weeks gestation | 0 | 0 | Risk Ratio (M‐H, Random, 95% CI) | 0.0 [0.0, 0.0] |
| 40.2 > 32‐34 weeks gestation | 0 | 0 | Risk Ratio (M‐H, Random, 95% CI) | 0.0 [0.0, 0.0] |
| 40.3 Mixed gestation | 0 | 0 | Risk Ratio (M‐H, Random, 95% CI) | 0.0 [0.0, 0.0] |
| 41 Mothers' views | 0 | 0 | Std. Mean Difference (IV, Random, 95% CI) | 0.0 [0.0, 0.0] |
| 41.1 < 32‐34 weeks gestation | 0 | 0 | Std. Mean Difference (IV, Random, 95% CI) | 0.0 [0.0, 0.0] |
| 41.2 > 32‐34 weeks gestation | 0 | 0 | Std. Mean Difference (IV, Random, 95% CI) | 0.0 [0.0, 0.0] |
| 41.3 Mixed gestation | 0 | 0 | Std. Mean Difference (IV, Random, 95% CI) | 0.0 [0.0, 0.0] |
| Outcome or subgroup title | No. of studies | No. of participants | Statistical method | Effect size |
| 1 Death of baby (up to discharge) Show forest plot | 1 | 270 | Risk Ratio (M‐H, Random, 95% CI) | 0.47 [0.20, 1.11] |
| 1.1 DCC < 1 min and baby level with uterus | 0 | 0 | Risk Ratio (M‐H, Random, 95% CI) | 0.0 [0.0, 0.0] |
| 1.2 DCC < 1 min and baby held low | 0 | 0 | Risk Ratio (M‐H, Random, 95% CI) | 0.0 [0.0, 0.0] |
| 1.3 DCC at 1‐2 mins with baby level with uterus | 0 | 0 | Risk Ratio (M‐H, Random, 95% CI) | 0.0 [0.0, 0.0] |
| 1.4 DCC at 1‐2 mins with baby low | 0 | 0 | Risk Ratio (M‐H, Random, 95% CI) | 0.0 [0.0, 0.0] |
| 1.5 DCC at > 2 mins with baby level with uterus | 1 | 270 | Risk Ratio (M‐H, Random, 95% CI) | 0.47 [0.20, 1.11] |
| 1.6 DCC at > 2 mins with baby low | 0 | 0 | Risk Ratio (M‐H, Random, 95% CI) | 0.0 [0.0, 0.0] |
| 1.7 Mixed interventions or unclear | 0 | 0 | Risk Ratio (M‐H, Random, 95% CI) | 0.0 [0.0, 0.0] |
| 2 Death or neurodevelopmental impairment at age two to three years Show forest plot | 1 | 218 | Risk Ratio (M‐H, Random, 95% CI) | 0.61 [0.39, 0.96] |
| 2.1 DCC < 1 min and baby level with uterus | 0 | 0 | Risk Ratio (M‐H, Random, 95% CI) | 0.0 [0.0, 0.0] |
| 2.2 DCC < 1 min and baby held low | 0 | 0 | Risk Ratio (M‐H, Random, 95% CI) | 0.0 [0.0, 0.0] |
| 2.3 DCC at 1‐2 mins with baby level with uterus | 0 | 0 | Risk Ratio (M‐H, Random, 95% CI) | 0.0 [0.0, 0.0] |
| 2.4 DCC at 1‐2 mins with baby low | 0 | 0 | Risk Ratio (M‐H, Random, 95% CI) | 0.0 [0.0, 0.0] |
| 2.5 DCC at > 2 mins with baby level with uterus | 1 | 218 | Risk Ratio (M‐H, Random, 95% CI) | 0.61 [0.39, 0.96] |
| 2.6 DCC at > 2 mins with baby low | 0 | 0 | Risk Ratio (M‐H, Random, 95% CI) | 0.0 [0.0, 0.0] |
| 2.7 Mixed interventions or unclear | 0 | 0 | Risk Ratio (M‐H, Random, 95% CI) | 0.0 [0.0, 0.0] |
| 3 Severe intraventricular haemorrhage (IVH grades 3, 4) Show forest plot | 1 | 266 | Risk Ratio (M‐H, Random, 95% CI) | 0.84 [0.29, 2.45] |
| 3.1 DCC < 1 min and baby level with uterus | 0 | 0 | Risk Ratio (M‐H, Random, 95% CI) | 0.0 [0.0, 0.0] |
| 3.2 DCC < 1 min and baby held low | 0 | 0 | Risk Ratio (M‐H, Random, 95% CI) | 0.0 [0.0, 0.0] |
| 3.3 DCC at 1‐2 mins with baby level with uterus | 0 | 0 | Risk Ratio (M‐H, Random, 95% CI) | 0.0 [0.0, 0.0] |
| 3.4 DCC at 1‐2 mins with baby low | 0 | 0 | Risk Ratio (M‐H, Random, 95% CI) | 0.0 [0.0, 0.0] |
| 3.5 DCC at > 2 mins with baby level with uterus | 1 | 266 | Risk Ratio (M‐H, Random, 95% CI) | 0.84 [0.29, 2.45] |
| 3.6 DCC at > 2 mins with baby low | 0 | 0 | Risk Ratio (M‐H, Random, 95% CI) | 0.0 [0.0, 0.0] |
| 3.7 Mixed interventions or unclear | 0 | 0 | Risk Ratio (M‐H, Random, 95% CI) | 0.0 [0.0, 0.0] |
| 4 Intraventricular haemorrhage (IVH, all grades) Show forest plot | 1 | 266 | Risk Ratio (M‐H, Random, 95% CI) | 0.90 [0.64, 1.26] |
| 4.1 DCC < 1 min and baby level with uterus | 0 | 0 | Risk Ratio (M‐H, Random, 95% CI) | 0.0 [0.0, 0.0] |
| 4.2 DCC < 1 min and baby held low | 0 | 0 | Risk Ratio (M‐H, Random, 95% CI) | 0.0 [0.0, 0.0] |
| 4.3 DCC at 1‐2 mins with baby level with uterus | 0 | 0 | Risk Ratio (M‐H, Random, 95% CI) | 0.0 [0.0, 0.0] |
| 4.4 DCC at 1‐2 mins with baby low | 0 | 0 | Risk Ratio (M‐H, Random, 95% CI) | 0.0 [0.0, 0.0] |
| 4.5 DCC at > 2 mins with baby level with uterus | 1 | 266 | Risk Ratio (M‐H, Random, 95% CI) | 0.90 [0.64, 1.26] |
| 4.6 DCC at > 2 mins with baby low | 0 | 0 | Risk Ratio (M‐H, Random, 95% CI) | 0.0 [0.0, 0.0] |
| 4.7 Mixed interventions or unclear | 0 | 0 | Risk Ratio (M‐H, Random, 95% CI) | 0.0 [0.0, 0.0] |
| 5 Periventricular leukomalacia (PVL) Show forest plot | 1 | 266 | Risk Ratio (M‐H, Random, 95% CI) | 0.86 [0.32, 2.31] |
| 5.1 DCC < 1 min and baby level with uterus | 0 | 0 | Risk Ratio (M‐H, Random, 95% CI) | 0.0 [0.0, 0.0] |
| 5.2 DCC < 1 min and baby held low | 0 | 0 | Risk Ratio (M‐H, Random, 95% CI) | 0.0 [0.0, 0.0] |
| 5.3 DCC at 1‐2 mins with baby level with uterus | 0 | 0 | Risk Ratio (M‐H, Random, 95% CI) | 0.0 [0.0, 0.0] |
| 5.4 DCC at 1‐2 mins with baby low | 0 | 0 | Risk Ratio (M‐H, Random, 95% CI) | 0.0 [0.0, 0.0] |
| 5.5 DCC at > 2 mins with baby level with uterus | 1 | 266 | Risk Ratio (M‐H, Random, 95% CI) | 0.86 [0.32, 2.31] |
| 5.6 DCC at > 2 mins with baby low | 0 | 0 | Risk Ratio (M‐H, Random, 95% CI) | 0.0 [0.0, 0.0] |
| 5.7 Mixed interventions or unclear | 0 | 0 | Risk Ratio (M‐H, Random, 95% CI) | 0.0 [0.0, 0.0] |
| 6 Chronic lung disease (CLD) ‐ oxygen supplement at 36 weeks (corrected for gestation) Show forest plot | 1 | 249 | Risk Ratio (M‐H, Random, 95% CI) | 0.95 [0.66, 1.37] |
| 6.1 DCC < 1 min and baby level with uterus | 0 | 0 | Risk Ratio (M‐H, Random, 95% CI) | 0.0 [0.0, 0.0] |
| 6.2 DCC < 1 min and baby held low | 0 | 0 | Risk Ratio (M‐H, Random, 95% CI) | 0.0 [0.0, 0.0] |
| 6.3 DCC at 1‐2 mins with baby level with uterus | 0 | 0 | Risk Ratio (M‐H, Random, 95% CI) | 0.0 [0.0, 0.0] |
| 6.4 DCC at 1‐2 mins with baby low | 0 | 0 | Risk Ratio (M‐H, Random, 95% CI) | 0.0 [0.0, 0.0] |
| 6.5 DCC at > 2 mins with baby level with uterus | 1 | 249 | Risk Ratio (M‐H, Random, 95% CI) | 0.95 [0.66, 1.37] |
| 6.6 DCC at > 2 mins with baby low | 0 | 0 | Risk Ratio (M‐H, Random, 95% CI) | 0.0 [0.0, 0.0] |
| 6.7 Mixed interventions or unclear | 0 | 0 | Risk Ratio (M‐H, Random, 95% CI) | 0.0 [0.0, 0.0] |
| 7 Maternal blood loss of 500 mL or greater Show forest plot | 1 | 254 | Risk Ratio (M‐H, Random, 95% CI) | 0.94 [0.72, 1.22] |
| 7.1 DCC < 1 min and baby level with uterus | 0 | 0 | Risk Ratio (M‐H, Random, 95% CI) | 0.0 [0.0, 0.0] |
| 7.2 DCC < 1 min and baby held low | 0 | 0 | Risk Ratio (M‐H, Random, 95% CI) | 0.0 [0.0, 0.0] |
| 7.3 DCC at 1‐2 mins with baby level with uterus | 0 | 0 | Risk Ratio (M‐H, Random, 95% CI) | 0.0 [0.0, 0.0] |
| 7.4 DCC at 1‐2 mins with baby low | 0 | 0 | Risk Ratio (M‐H, Random, 95% CI) | 0.0 [0.0, 0.0] |
| 7.5 DCC at > 2 mins with baby level with uterus | 1 | 254 | Risk Ratio (M‐H, Random, 95% CI) | 0.94 [0.72, 1.22] |
| 7.6 DCC at > 2 mins with baby low | 0 | 0 | Risk Ratio (M‐H, Random, 95% CI) | 0.0 [0.0, 0.0] |
| 7.7 Mixed interventions or unclear | 0 | 0 | Risk Ratio (M‐H, Random, 95% CI) | 0.0 [0.0, 0.0] |
| 8 Intraventricular haemorrhage (IVH, grades 1 & 2) Show forest plot | 1 | 266 | Risk Ratio (M‐H, Random, 95% CI) | 0.91 [0.63, 1.33] |
| 8.1 DCC < 1 min and baby level with uterus | 0 | 0 | Risk Ratio (M‐H, Random, 95% CI) | 0.0 [0.0, 0.0] |
| 8.2 DCC < 1 min and baby held low | 0 | 0 | Risk Ratio (M‐H, Random, 95% CI) | 0.0 [0.0, 0.0] |
| 8.3 DCC at 1‐2 mins with baby level with uterus | 0 | 0 | Risk Ratio (M‐H, Random, 95% CI) | 0.0 [0.0, 0.0] |
| 8.4 DCC at 1‐2 mins with baby low | 0 | 0 | Risk Ratio (M‐H, Random, 95% CI) | 0.0 [0.0, 0.0] |
| 8.5 DCC at > 2 mins with baby level with uterus | 1 | 266 | Risk Ratio (M‐H, Random, 95% CI) | 0.91 [0.63, 1.33] |
| 8.6 DCC at > 2 mins with baby low | 0 | 0 | Risk Ratio (M‐H, Random, 95% CI) | 0.0 [0.0, 0.0] |
| 8.7 Mixed interventions or unclear | 0 | 0 | Risk Ratio (M‐H, Random, 95% CI) | 0.0 [0.0, 0.0] |
| 9 Necrotising enterocolitis (NEC) confirmed by X‐ray or laparotomy) Show forest plot | 1 | 266 | Risk Ratio (M‐H, Random, 95% CI) | 1.58 [0.53, 4.69] |
| 9.1 DCC < 1 min and baby level with uterus | 0 | 0 | Risk Ratio (M‐H, Random, 95% CI) | 0.0 [0.0, 0.0] |
| 9.2 DCC < 1 min and baby held low | 0 | 0 | Risk Ratio (M‐H, Random, 95% CI) | 0.0 [0.0, 0.0] |
| 9.3 DCC at 1‐2 mins with baby level with uterus | 0 | 0 | Risk Ratio (M‐H, Random, 95% CI) | 0.0 [0.0, 0.0] |
| 9.4 DCC at 1‐2 mins with baby low | 0 | 0 | Risk Ratio (M‐H, Random, 95% CI) | 0.0 [0.0, 0.0] |
| 9.5 DCC at > 2 mins with baby level with uterus | 1 | 266 | Risk Ratio (M‐H, Random, 95% CI) | 1.58 [0.53, 4.69] |
| 9.6 DCC at > 2 mins with baby low | 0 | 0 | Risk Ratio (M‐H, Random, 95% CI) | 0.0 [0.0, 0.0] |
| 9.7 Mixed interventions or unclear | 0 | 0 | Risk Ratio (M‐H, Random, 95% CI) | 0.0 [0.0, 0.0] |
| 10 Respiratory Distress Syndrome (RDS) | 0 | 0 | Risk Ratio (M‐H, Random, 95% CI) | 0.0 [0.0, 0.0] |
| 10.1 DCC < 1 min and baby level with uterus | 0 | 0 | Risk Ratio (M‐H, Random, 95% CI) | 0.0 [0.0, 0.0] |
| 10.2 DCC < 1 min and baby held low | 0 | 0 | Risk Ratio (M‐H, Random, 95% CI) | 0.0 [0.0, 0.0] |
| 10.3 DCC at 1‐2 mins with baby level with uterus | 0 | 0 | Risk Ratio (M‐H, Random, 95% CI) | 0.0 [0.0, 0.0] |
| 10.4 DCC at 1‐2 mins with baby low | 0 | 0 | Risk Ratio (M‐H, Random, 95% CI) | 0.0 [0.0, 0.0] |
| 10.5 DCC at > 2 mins with baby level with uterus | 0 | 0 | Risk Ratio (M‐H, Random, 95% CI) | 0.0 [0.0, 0.0] |
| 10.6 DCC at > 2 mins with baby low | 0 | 0 | Risk Ratio (M‐H, Random, 95% CI) | 0.0 [0.0, 0.0] |
| 10.7 Mixed interventions or unclear | 0 | 0 | Risk Ratio (M‐H, Random, 95% CI) | 0.0 [0.0, 0.0] |
| 10.8 Mixed interventions or unclear | 0 | 0 | Risk Ratio (M‐H, Random, 95% CI) | 0.0 [0.0, 0.0] |
| 11 Respiratory support (ventilator or CPAP) Show forest plot | 1 | 266 | Risk Ratio (M‐H, Random, 95% CI) | 0.96 [0.84, 1.09] |
| 11.1 DCC < 1 min and baby level with uterus | 0 | 0 | Risk Ratio (M‐H, Random, 95% CI) | 0.0 [0.0, 0.0] |
| 11.2 DCC < 1 min and baby held low | 0 | 0 | Risk Ratio (M‐H, Random, 95% CI) | 0.0 [0.0, 0.0] |
| 11.3 DCC at 1‐2 mins with baby level with uterus | 0 | 0 | Risk Ratio (M‐H, Random, 95% CI) | 0.0 [0.0, 0.0] |
| 11.4 DCC at 1‐2 mins with baby low | 0 | 0 | Risk Ratio (M‐H, Random, 95% CI) | 0.0 [0.0, 0.0] |
| 11.5 DCC at > 2 mins with baby level with uterus | 1 | 266 | Risk Ratio (M‐H, Random, 95% CI) | 0.96 [0.84, 1.09] |
| 11.6 DCC at > 2 mins with baby low | 0 | 0 | Risk Ratio (M‐H, Random, 95% CI) | 0.0 [0.0, 0.0] |
| 11.7 Mixed interventions or unclear | 0 | 0 | Risk Ratio (M‐H, Random, 95% CI) | 0.0 [0.0, 0.0] |
| 12 Duration of respiratory support | 0 | 0 | Mean Difference (IV, Random, 95% CI) | 0.0 [0.0, 0.0] |
| 12.1 DCC < 1 min and baby level with uterus | 0 | 0 | Mean Difference (IV, Random, 95% CI) | 0.0 [0.0, 0.0] |
| 12.2 DCC < 1 min and baby held low | 0 | 0 | Mean Difference (IV, Random, 95% CI) | 0.0 [0.0, 0.0] |
| 12.3 DCC 1‐2 mins and baby level with uterus | 0 | 0 | Mean Difference (IV, Random, 95% CI) | 0.0 [0.0, 0.0] |
| 12.4 DCC 1‐2 mins and baby held low | 0 | 0 | Mean Difference (IV, Random, 95% CI) | 0.0 [0.0, 0.0] |
| 12.5 DCC > 2 mins and baby level with uterus | 0 | 0 | Mean Difference (IV, Random, 95% CI) | 0.0 [0.0, 0.0] |
| 12.6 DCC > 2 mins and baby held low | 0 | 0 | Mean Difference (IV, Random, 95% CI) | 0.0 [0.0, 0.0] |
| 12.7 Mixed interventions or unclear | 0 | 0 | Mean Difference (IV, Random, 95% CI) | 0.0 [0.0, 0.0] |
| 13 Surfactant treatment (for severe RDS) | 0 | 0 | Risk Ratio (M‐H, Random, 95% CI) | 0.0 [0.0, 0.0] |
| 13.1 DCC < 1 min and baby level with uterus | 0 | 0 | Risk Ratio (M‐H, Random, 95% CI) | 0.0 [0.0, 0.0] |
| 13.2 DCC < 1 min and baby held low | 0 | 0 | Risk Ratio (M‐H, Random, 95% CI) | 0.0 [0.0, 0.0] |
| 13.3 DCC at 1‐2 mins with baby level with uterus | 0 | 0 | Risk Ratio (M‐H, Random, 95% CI) | 0.0 [0.0, 0.0] |
| 13.4 DCC at 1‐2 mins with baby low | 0 | 0 | Risk Ratio (M‐H, Random, 95% CI) | 0.0 [0.0, 0.0] |
| 13.5 DCC at > 2 mins with baby level with uterus | 0 | 0 | Risk Ratio (M‐H, Random, 95% CI) | 0.0 [0.0, 0.0] |
| 13.6 DCC at > 2 mins with baby low | 0 | 0 | Risk Ratio (M‐H, Random, 95% CI) | 0.0 [0.0, 0.0] |
| 13.7 Mixed interventions or unclear | 0 | 0 | Risk Ratio (M‐H, Random, 95% CI) | 0.0 [0.0, 0.0] |
| 14 Treatment for Patent Ductus Arteriosus (PDA) (medical and/or surgical) Show forest plot | 1 | 266 | Risk Ratio (M‐H, Random, 95% CI) | 0.99 [0.56, 1.74] |
| 14.1 DCC < 1 min and baby level with uterus | 0 | 0 | Risk Ratio (M‐H, Random, 95% CI) | 0.0 [0.0, 0.0] |
| 14.2 DCC < 1 min and baby held low | 0 | 0 | Risk Ratio (M‐H, Random, 95% CI) | 0.0 [0.0, 0.0] |
| 14.3 DCC at 1‐2 mins with baby level with uterus | 0 | 0 | Risk Ratio (M‐H, Random, 95% CI) | 0.0 [0.0, 0.0] |
| 14.4 DCC at 1‐2 mins with baby low | 0 | 0 | Risk Ratio (M‐H, Random, 95% CI) | 0.0 [0.0, 0.0] |
| 14.5 DCC at > 2 mins with baby level with uterus | 1 | 266 | Risk Ratio (M‐H, Random, 95% CI) | 0.99 [0.56, 1.74] |
| 14.6 DCC at > 2 mins with baby low | 0 | 0 | Risk Ratio (M‐H, Random, 95% CI) | 0.0 [0.0, 0.0] |
| 14.7 Mixed interventions or unclear | 0 | 0 | Risk Ratio (M‐H, Random, 95% CI) | 0.0 [0.0, 0.0] |
| 15 Treatment for Retinopathy of Prematurity (RoP) Show forest plot | 1 | 249 | Risk Ratio (M‐H, Random, 95% CI) | 0.93 [0.28, 3.13] |
| 15.1 DCC < 1 min and baby level with uterus | 0 | 0 | Risk Ratio (M‐H, Random, 95% CI) | 0.0 [0.0, 0.0] |
| 15.2 DCC < 1 min and baby held low | 0 | 0 | Risk Ratio (M‐H, Random, 95% CI) | 0.0 [0.0, 0.0] |
| 15.3 DCC at 1‐2 mins with baby level with uterus | 0 | 0 | Risk Ratio (M‐H, Random, 95% CI) | 0.0 [0.0, 0.0] |
| 15.4 DCC at 1‐2 mins with baby low | 0 | 0 | Risk Ratio (M‐H, Random, 95% CI) | 0.0 [0.0, 0.0] |
| 15.5 DCC at > 2 mins with baby level with uterus | 1 | 249 | Risk Ratio (M‐H, Random, 95% CI) | 0.93 [0.28, 3.13] |
| 15.6 DCC at > 2 mins with baby low | 0 | 0 | Risk Ratio (M‐H, Random, 95% CI) | 0.0 [0.0, 0.0] |
| 15.7 Mixed interventions or unclear | 0 | 0 | Risk Ratio (M‐H, Random, 95% CI) | 0.0 [0.0, 0.0] |
| 16 Hyperbilirubinemia (treated by phototherapy) Show forest plot | 1 | 266 | Risk Ratio (M‐H, Random, 95% CI) | 1.01 [0.94, 1.09] |
| 16.1 DCC < 1 min and baby level with uterus | 0 | 0 | Risk Ratio (M‐H, Random, 95% CI) | 0.0 [0.0, 0.0] |
| 16.2 DCC < 1 min and baby held low | 0 | 0 | Risk Ratio (M‐H, Random, 95% CI) | 0.0 [0.0, 0.0] |
| 16.3 DCC at 1‐2 mins with baby level with uterus | 0 | 0 | Risk Ratio (M‐H, Random, 95% CI) | 0.0 [0.0, 0.0] |
| 16.4 DCC at 1‐2 mins with baby low | 0 | 0 | Risk Ratio (M‐H, Random, 95% CI) | 0.0 [0.0, 0.0] |
| 16.5 DCC at > 2 mins with baby level with uterus | 1 | 266 | Risk Ratio (M‐H, Random, 95% CI) | 1.01 [0.94, 1.09] |
| 16.6 DCC at > 2 mins with baby low | 0 | 0 | Risk Ratio (M‐H, Random, 95% CI) | 0.0 [0.0, 0.0] |
| 16.7 Mixed interventions or unclear | 0 | 0 | Risk Ratio (M‐H, Random, 95% CI) | 0.0 [0.0, 0.0] |
| 17 Inotropics for low blood pressure | 0 | 0 | Risk Ratio (M‐H, Random, 95% CI) | 0.0 [0.0, 0.0] |
| 17.1 DCC < 1 min and baby level with uterus | 0 | 0 | Risk Ratio (M‐H, Random, 95% CI) | 0.0 [0.0, 0.0] |
| 17.2 DCC < 1 min and baby held low | 0 | 0 | Risk Ratio (M‐H, Random, 95% CI) | 0.0 [0.0, 0.0] |
| 17.3 DCC at 1‐2 mins with baby level with uterus | 0 | 0 | Risk Ratio (M‐H, Random, 95% CI) | 0.0 [0.0, 0.0] |
| 17.4 DCC at 1‐2 mins with baby low | 0 | 0 | Risk Ratio (M‐H, Random, 95% CI) | 0.0 [0.0, 0.0] |
| 17.5 DCC at > 2 mins with baby level with uterus | 0 | 0 | Risk Ratio (M‐H, Random, 95% CI) | 0.0 [0.0, 0.0] |
| 17.6 DCC at > 2 mins with baby low | 0 | 0 | Risk Ratio (M‐H, Random, 95% CI) | 0.0 [0.0, 0.0] |
| 17.7 Mixed interventions or unclear | 0 | 0 | Risk Ratio (M‐H, Random, 95% CI) | 0.0 [0.0, 0.0] |
| 18 Low Apgar as defined by trialists (generally < 8 at 5 mins) | 0 | 0 | Risk Ratio (M‐H, Random, 95% CI) | 0.0 [0.0, 0.0] |
| 18.1 DCC < 1 min and baby level with uterus | 0 | 0 | Risk Ratio (M‐H, Random, 95% CI) | 0.0 [0.0, 0.0] |
| 18.2 DCC < 1 min and baby held low | 0 | 0 | Risk Ratio (M‐H, Random, 95% CI) | 0.0 [0.0, 0.0] |
| 18.3 DCC at 1‐2 mins with baby level with uterus | 0 | 0 | Risk Ratio (M‐H, Random, 95% CI) | 0.0 [0.0, 0.0] |
| 18.4 DCC at 1‐2 mins with baby low | 0 | 0 | Risk Ratio (M‐H, Random, 95% CI) | 0.0 [0.0, 0.0] |
| 18.5 DCC at > 2 mins with baby level with uterus | 0 | 0 | Risk Ratio (M‐H, Random, 95% CI) | 0.0 [0.0, 0.0] |
| 18.6 DCC at > 2 mins with baby low | 0 | 0 | Risk Ratio (M‐H, Random, 95% CI) | 0.0 [0.0, 0.0] |
| 18.7 Mixed interventions or unclear | 0 | 0 | Risk Ratio (M‐H, Random, 95% CI) | 0.0 [0.0, 0.0] |
| 19 Blood transfusion in infant Show forest plot | 1 | 266 | Risk Ratio (M‐H, Random, 95% CI) | 0.91 [0.71, 1.17] |
| 19.1 DCC < 1 min and baby level with uterus | 0 | 0 | Risk Ratio (M‐H, Random, 95% CI) | 0.0 [0.0, 0.0] |
| 19.2 DCC < 1 min and baby held low | 0 | 0 | Risk Ratio (M‐H, Random, 95% CI) | 0.0 [0.0, 0.0] |
| 19.3 DCC at 1‐2 mins with baby level with uterus | 0 | 0 | Risk Ratio (M‐H, Random, 95% CI) | 0.0 [0.0, 0.0] |
| 19.4 DCC at 1‐2 mins with baby low | 0 | 0 | Risk Ratio (M‐H, Random, 95% CI) | 0.0 [0.0, 0.0] |
| 19.5 DCC at > 2 mins with baby level with uterus | 1 | 266 | Risk Ratio (M‐H, Random, 95% CI) | 0.91 [0.71, 1.17] |
| 19.6 DCC at > 2 mins with baby low | 0 | 0 | Risk Ratio (M‐H, Random, 95% CI) | 0.0 [0.0, 0.0] |
| 19.7 Mixed interventions or unclear | 0 | 0 | Risk Ratio (M‐H, Random, 95% CI) | 0.0 [0.0, 0.0] |
| 20 Volume of blood transfused | 0 | 0 | Mean Difference (IV, Random, 95% CI) | 0.0 [0.0, 0.0] |
| 20.1 DCC < 1 min and baby level with uterus | 0 | 0 | Mean Difference (IV, Random, 95% CI) | 0.0 [0.0, 0.0] |
| 20.2 DCC < 1 min and baby held low | 0 | 0 | Mean Difference (IV, Random, 95% CI) | 0.0 [0.0, 0.0] |
| 20.3 DCC 1‐2 mins and baby level with uterus | 0 | 0 | Mean Difference (IV, Random, 95% CI) | 0.0 [0.0, 0.0] |
| 20.4 DCC 1‐2 mins and baby held low | 0 | 0 | Mean Difference (IV, Random, 95% CI) | 0.0 [0.0, 0.0] |
| 20.5 DCC > 2 mins and baby level with uterus | 0 | 0 | Mean Difference (IV, Random, 95% CI) | 0.0 [0.0, 0.0] |
| 20.6 DCC > 2 mins and baby held low | 0 | 0 | Mean Difference (IV, Random, 95% CI) | 0.0 [0.0, 0.0] |
| 20.7 Mixed interventions or unclear | 0 | 0 | Mean Difference (IV, Random, 95% CI) | 0.0 [0.0, 0.0] |
| 21 Late sepsis (after 3 days or as defined by trialists) Show forest plot | 1 | 266 | Risk Ratio (M‐H, Random, 95% CI) | 0.89 [0.72, 1.09] |
| 21.1 DCC < 1 min and baby level with uterus | 0 | 0 | Risk Ratio (M‐H, Random, 95% CI) | 0.0 [0.0, 0.0] |
| 21.2 DCC < 1 min and baby held low | 0 | 0 | Risk Ratio (M‐H, Random, 95% CI) | 0.0 [0.0, 0.0] |
| 21.3 DCC at 1‐2 mins with baby level with uterus | 0 | 0 | Risk Ratio (M‐H, Random, 95% CI) | 0.0 [0.0, 0.0] |
| 21.4 DCC at 1‐2 mins with baby low | 0 | 0 | Risk Ratio (M‐H, Random, 95% CI) | 0.0 [0.0, 0.0] |
| 21.5 DCC at > 2 mins with baby level with uterus | 1 | 266 | Risk Ratio (M‐H, Random, 95% CI) | 0.89 [0.72, 1.09] |
| 21.6 DCC at > 2 mins with baby low | 0 | 0 | Risk Ratio (M‐H, Random, 95% CI) | 0.0 [0.0, 0.0] |
| 21.7 Mixed interventions or unclear | 0 | 0 | Risk Ratio (M‐H, Random, 95% CI) | 0.0 [0.0, 0.0] |
| 22 Hydrocephalus Show forest plot | 1 | 266 | Risk Ratio (M‐H, Random, 95% CI) | 0.99 [0.14, 6.89] |
| 22.1 DCC < 1 min and baby level with uterus | 0 | 0 | Risk Ratio (M‐H, Random, 95% CI) | 0.0 [0.0, 0.0] |
| 22.2 DCC < 1 min and baby held low | 0 | 0 | Risk Ratio (M‐H, Random, 95% CI) | 0.0 [0.0, 0.0] |
| 22.3 DCC at 1‐2 mins with baby level with uterus | 0 | 0 | Risk Ratio (M‐H, Random, 95% CI) | 0.0 [0.0, 0.0] |
| 22.4 DCC at 1‐2 mins with baby low | 0 | 0 | Risk Ratio (M‐H, Random, 95% CI) | 0.0 [0.0, 0.0] |
| 22.5 DCC at > 2 mins with baby level with uterus | 1 | 266 | Risk Ratio (M‐H, Random, 95% CI) | 0.99 [0.14, 6.89] |
| 22.6 DCC at > 2 mins with baby low | 0 | 0 | Risk Ratio (M‐H, Random, 95% CI) | 0.0 [0.0, 0.0] |
| 22.7 Mixed interventions or unclear | 0 | 0 | Risk Ratio (M‐H, Random, 95% CI) | 0.0 [0.0, 0.0] |
| 23 Temperature < 36.0oC within 1 hour of birth Show forest plot | 1 | 266 | Risk Ratio (M‐H, Random, 95% CI) | 1.20 [0.61, 2.33] |
| 23.1 DCC < 1 min and baby level with uterus | 0 | 0 | Risk Ratio (M‐H, Random, 95% CI) | 0.0 [0.0, 0.0] |
| 23.2 DCC < 1 min and baby held low | 0 | 0 | Risk Ratio (M‐H, Random, 95% CI) | 0.0 [0.0, 0.0] |
| 23.3 DCC at 1‐2 mins with baby level with uterus | 0 | 0 | Risk Ratio (M‐H, Random, 95% CI) | 0.0 [0.0, 0.0] |
| 23.4 DCC at 1‐2 mins with baby low | 0 | 0 | Risk Ratio (M‐H, Random, 95% CI) | 0.0 [0.0, 0.0] |
| 23.5 DCC at > 2 mins with baby level with uterus | 1 | 266 | Risk Ratio (M‐H, Random, 95% CI) | 1.20 [0.61, 2.33] |
| 23.6 DCC at > 2 mins with baby low | 0 | 0 | Risk Ratio (M‐H, Random, 95% CI) | 0.0 [0.0, 0.0] |
| 23.7 Mixed interventions or unclear | 0 | 0 | Risk Ratio (M‐H, Random, 95% CI) | 0.0 [0.0, 0.0] |
| 24 Hb within 1st 24 hour of birth (g/dL) | 0 | 0 | Mean Difference (IV, Random, 95% CI) | 0.0 [0.0, 0.0] |
| 24.1 DCC < 1 min and baby level with uterus | 0 | 0 | Mean Difference (IV, Random, 95% CI) | 0.0 [0.0, 0.0] |
| 24.2 DCC < 1 min and baby held low | 0 | 0 | Mean Difference (IV, Random, 95% CI) | 0.0 [0.0, 0.0] |
| 24.3 DCC 1‐2 mins and baby level with uterus | 0 | 0 | Mean Difference (IV, Random, 95% CI) | 0.0 [0.0, 0.0] |
| 24.4 DCC 1‐2 mins and baby held low | 0 | 0 | Mean Difference (IV, Random, 95% CI) | 0.0 [0.0, 0.0] |
| 24.5 DCC > 2 mins and baby level with uterus | 0 | 0 | Mean Difference (IV, Random, 95% CI) | 0.0 [0.0, 0.0] |
| 24.6 DCC > 2 mins and baby held low | 0 | 0 | Mean Difference (IV, Random, 95% CI) | 0.0 [0.0, 0.0] |
| 24.7 Mixed interventions or unclear | 0 | 0 | Mean Difference (IV, Random, 95% CI) | 0.0 [0.0, 0.0] |
| 25 Mean arterial blood pressure (subgrouped by time after birth) | 0 | 0 | Mean Difference (IV, Random, 95% CI) | 0.0 [0.0, 0.0] |
| 25.1 DCC < 1 min and baby level with uterus | 0 | 0 | Mean Difference (IV, Random, 95% CI) | 0.0 [0.0, 0.0] |
| 25.2 DCC < 1 min and baby held low | 0 | 0 | Mean Difference (IV, Random, 95% CI) | 0.0 [0.0, 0.0] |
| 25.3 DCC 1‐2 mins and baby level with uterus | 0 | 0 | Mean Difference (IV, Random, 95% CI) | 0.0 [0.0, 0.0] |
| 25.4 DCC 1‐2 mins and baby held low | 0 | 0 | Mean Difference (IV, Random, 95% CI) | 0.0 [0.0, 0.0] |
| 25.5 DCC > 2 mins and baby level with uterus | 0 | 0 | Mean Difference (IV, Random, 95% CI) | 0.0 [0.0, 0.0] |
| 25.6 DCC > 2 mins and baby held low | 0 | 0 | Mean Difference (IV, Random, 95% CI) | 0.0 [0.0, 0.0] |
| 25.7 Mixed interventions or unclear | 0 | 0 | Mean Difference (IV, Random, 95% CI) | 0.0 [0.0, 0.0] |
| 26 Length of infant stay in NICU | 0 | 0 | Mean Difference (IV, Random, 95% CI) | 0.0 [0.0, 0.0] |
| 26.1 DCC < 1 min and baby level with uterus | 0 | 0 | Mean Difference (IV, Random, 95% CI) | 0.0 [0.0, 0.0] |
| 26.2 DCC < 1 min and baby held low | 0 | 0 | Mean Difference (IV, Random, 95% CI) | 0.0 [0.0, 0.0] |
| 26.3 DCC 1‐2 mins and baby level with uterus | 0 | 0 | Mean Difference (IV, Random, 95% CI) | 0.0 [0.0, 0.0] |
| 26.4 DCC 1‐2 mins and baby held low | 0 | 0 | Mean Difference (IV, Random, 95% CI) | 0.0 [0.0, 0.0] |
| 26.5 DCC > 2 mins and baby level with uterus | 0 | 0 | Mean Difference (IV, Random, 95% CI) | 0.0 [0.0, 0.0] |
| 26.6 DCC > 2 mins and baby held low | 0 | 0 | Mean Difference (IV, Random, 95% CI) | 0.0 [0.0, 0.0] |
| 26.7 Mixed interventions or unclear | 0 | 0 | Mean Difference (IV, Random, 95% CI) | 0.0 [0.0, 0.0] |
| 27 Home oxygen | 0 | 0 | Risk Ratio (M‐H, Random, 95% CI) | 0.0 [0.0, 0.0] |
| 27.1 DCC < 1 min and baby level with uterus | 0 | 0 | Risk Ratio (M‐H, Random, 95% CI) | 0.0 [0.0, 0.0] |
| 27.2 DCC < 1 min and baby held low | 0 | 0 | Risk Ratio (M‐H, Random, 95% CI) | 0.0 [0.0, 0.0] |
| 27.3 DCC at 1‐2 mins with baby level with uterus | 0 | 0 | Risk Ratio (M‐H, Random, 95% CI) | 0.0 [0.0, 0.0] |
| 27.4 DCC at 1‐2 mins with baby low | 0 | 0 | Risk Ratio (M‐H, Random, 95% CI) | 0.0 [0.0, 0.0] |
| 27.5 DCC at > 2 mins with baby level with uterus | 0 | 0 | Risk Ratio (M‐H, Random, 95% CI) | 0.0 [0.0, 0.0] |
| 27.6 DCC at > 2 mins with baby low | 0 | 0 | Risk Ratio (M‐H, Random, 95% CI) | 0.0 [0.0, 0.0] |
| 27.7 Mixed interventions or unclear | 0 | 0 | Risk Ratio (M‐H, Random, 95% CI) | 0.0 [0.0, 0.0] |
| 28 Neurodevelopmental impairment at age two to three years Show forest plot | 1 | 194 | Risk Ratio (M‐H, Random, 95% CI) | 0.33 [0.06, 1.64] |
| 28.1 DCC < 1 min and baby level with uterus | 0 | 0 | Risk Ratio (M‐H, Random, 95% CI) | 0.0 [0.0, 0.0] |
| 28.2 DCC < 1 min and baby held low | 0 | 0 | Risk Ratio (M‐H, Random, 95% CI) | 0.0 [0.0, 0.0] |
| 28.3 DCC at 1‐2 mins with baby level with uterus | 0 | 0 | Risk Ratio (M‐H, Random, 95% CI) | 0.0 [0.0, 0.0] |
| 28.4 DCC at 1‐2 mins with baby low | 0 | 0 | Risk Ratio (M‐H, Random, 95% CI) | 0.0 [0.0, 0.0] |
| 28.5 DCC at > 2 mins with baby level with uterus | 1 | 194 | Risk Ratio (M‐H, Random, 95% CI) | 0.33 [0.06, 1.64] |
| 28.6 DCC at > 2 mins with baby low | 0 | 0 | Risk Ratio (M‐H, Random, 95% CI) | 0.0 [0.0, 0.0] |
| 28.7 Mixed interventions or unclear | 0 | 0 | Risk Ratio (M‐H, Random, 95% CI) | 0.0 [0.0, 0.0] |
| 29 Severe visual impairment | 0 | 0 | Risk Ratio (M‐H, Random, 95% CI) | 0.0 [0.0, 0.0] |
| 29.1 DCC < 1 min and baby level with uterus | 0 | 0 | Risk Ratio (M‐H, Random, 95% CI) | 0.0 [0.0, 0.0] |
| 29.2 DCC < 1 min and baby held low | 0 | 0 | Risk Ratio (M‐H, Random, 95% CI) | 0.0 [0.0, 0.0] |
| 29.3 DCC at 1‐2 mins with baby level with uterus | 0 | 0 | Risk Ratio (M‐H, Random, 95% CI) | 0.0 [0.0, 0.0] |
| 29.4 DCC at 1‐2 mins with baby low | 0 | 0 | Risk Ratio (M‐H, Random, 95% CI) | 0.0 [0.0, 0.0] |
| 29.5 DCC at > 2 mins with baby level with uterus | 0 | 0 | Risk Ratio (M‐H, Random, 95% CI) | 0.0 [0.0, 0.0] |
| 29.6 DCC at > 2 mins with baby low | 0 | 0 | Risk Ratio (M‐H, Random, 95% CI) | 0.0 [0.0, 0.0] |
| 29.7 Mixed interventions or unclear | 0 | 0 | Risk Ratio (M‐H, Random, 95% CI) | 0.0 [0.0, 0.0] |
| 30 Cerebral palsy (CP) | 0 | 0 | Risk Ratio (M‐H, Random, 95% CI) | 0.0 [0.0, 0.0] |
| 30.1 DCC < 1 min and baby level with uterus | 0 | 0 | Risk Ratio (M‐H, Random, 95% CI) | 0.0 [0.0, 0.0] |
| 30.2 DCC < 1 min and baby held low | 0 | 0 | Risk Ratio (M‐H, Random, 95% CI) | 0.0 [0.0, 0.0] |
| 30.3 DCC at 1‐2 mins with baby level with uterus | 0 | 0 | Risk Ratio (M‐H, Random, 95% CI) | 0.0 [0.0, 0.0] |
| 30.4 DCC at 1‐2 mins with baby low | 0 | 0 | Risk Ratio (M‐H, Random, 95% CI) | 0.0 [0.0, 0.0] |
| 30.5 DCC at > 2 mins with baby level with uterus | 0 | 0 | Risk Ratio (M‐H, Random, 95% CI) | 0.0 [0.0, 0.0] |
| 30.6 DCC at > 2 mins with baby low | 0 | 0 | Risk Ratio (M‐H, Random, 95% CI) | 0.0 [0.0, 0.0] |
| 30.7 Mixed interventions or unclear | 0 | 0 | Risk Ratio (M‐H, Random, 95% CI) | 0.0 [0.0, 0.0] |
| 31 Manual removal of placenta (denominator = vaginal births) Show forest plot | 1 | 105 | Risk Ratio (M‐H, Random, 95% CI) | 0.99 [0.32, 3.04] |
| 31.1 DCC < 1 min and baby level with uterus | 0 | 0 | Risk Ratio (M‐H, Random, 95% CI) | 0.0 [0.0, 0.0] |
| 31.2 DCC < 1 min and baby held low | 0 | 0 | Risk Ratio (M‐H, Random, 95% CI) | 0.0 [0.0, 0.0] |
| 31.3 DCC at 1‐2 mins with baby level with uterus | 0 | 0 | Risk Ratio (M‐H, Random, 95% CI) | 0.0 [0.0, 0.0] |
| 31.4 DCC at 1‐2 mins with baby low | 0 | 0 | Risk Ratio (M‐H, Random, 95% CI) | 0.0 [0.0, 0.0] |
| 31.5 DCC at > 2 mins with baby level with uterus | 1 | 105 | Risk Ratio (M‐H, Random, 95% CI) | 0.99 [0.32, 3.04] |
| 31.6 DCC at > 2 mins with baby low | 0 | 0 | Risk Ratio (M‐H, Random, 95% CI) | 0.0 [0.0, 0.0] |
| 31.7 Mixed interventions or unclear | 0 | 0 | Risk Ratio (M‐H, Random, 95% CI) | 0.0 [0.0, 0.0] |
| 32 Prolonged third stage (>30 minutes) (denominator = vaginal births) Show forest plot | 1 | 105 | Risk Ratio (M‐H, Random, 95% CI) | 0.79 [0.24, 2.64] |
| 32.1 DCC < 1 min and baby level with uterus | 0 | 0 | Risk Ratio (M‐H, Random, 95% CI) | 0.0 [0.0, 0.0] |
| 32.2 DCC < 1 min and baby held low | 0 | 0 | Risk Ratio (M‐H, Random, 95% CI) | 0.0 [0.0, 0.0] |
| 32.3 DCC at 1‐2 mins with baby level with uterus | 0 | 0 | Risk Ratio (M‐H, Random, 95% CI) | 0.0 [0.0, 0.0] |
| 32.4 DCC at 1‐2 mins with baby low | 0 | 0 | Risk Ratio (M‐H, Random, 95% CI) | 0.0 [0.0, 0.0] |
| 32.5 DCC at > 2 mins with baby level with uterus | 1 | 105 | Risk Ratio (M‐H, Random, 95% CI) | 0.79 [0.24, 2.64] |
| 32.6 DCC at > 2 mins with baby low | 0 | 0 | Risk Ratio (M‐H, Random, 95% CI) | 0.0 [0.0, 0.0] |
| 32.7 Mixed interventions or unclear | 0 | 0 | Risk Ratio (M‐H, Random, 95% CI) | 0.0 [0.0, 0.0] |
| 33 Blood transfusion for mother Show forest plot | 1 | 254 | Risk Ratio (M‐H, Random, 95% CI) | 1.59 [0.39, 6.51] |
| 33.1 DCC < 1 min and baby level with uterus | 0 | 0 | Risk Ratio (M‐H, Random, 95% CI) | 0.0 [0.0, 0.0] |
| 33.2 DCC < 1 min and baby held low | 0 | 0 | Risk Ratio (M‐H, Random, 95% CI) | 0.0 [0.0, 0.0] |
| 33.3 DCC at 1‐2 mins with baby level with uterus | 0 | 0 | Risk Ratio (M‐H, Random, 95% CI) | 0.0 [0.0, 0.0] |
| 33.4 DCC at 1‐2 mins with baby low | 0 | 0 | Risk Ratio (M‐H, Random, 95% CI) | 0.0 [0.0, 0.0] |
| 33.5 DCC at > 2 mins with baby level with uterus | 1 | 254 | Risk Ratio (M‐H, Random, 95% CI) | 1.59 [0.39, 6.51] |
| 33.6 DCC at > 2 mins with baby low | 0 | 0 | Risk Ratio (M‐H, Random, 95% CI) | 0.0 [0.0, 0.0] |
| 33.7 Mixed interventions or unclear | 0 | 0 | Risk Ratio (M‐H, Random, 95% CI) | 0.0 [0.0, 0.0] |
| 34 Postpartum infection in mother Show forest plot | 1 | 254 | Risk Ratio (M‐H, Random, 95% CI) | 1.12 [0.73, 1.72] |
| 34.1 DCC < 1 min and baby level with uterus | 0 | 0 | Risk Ratio (M‐H, Random, 95% CI) | 0.0 [0.0, 0.0] |
| 34.2 DCC < 1 min and baby held low | 0 | 0 | Risk Ratio (M‐H, Random, 95% CI) | 0.0 [0.0, 0.0] |
| 34.3 DCC at 1‐2 mins with baby level with uterus | 0 | 0 | Risk Ratio (M‐H, Random, 95% CI) | 0.0 [0.0, 0.0] |
| 34.4 DCC at 1‐2 mins with baby low | 0 | 0 | Risk Ratio (M‐H, Random, 95% CI) | 0.0 [0.0, 0.0] |
| 34.5 DCC at > 2 mins with baby level with uterus | 1 | 254 | Risk Ratio (M‐H, Random, 95% CI) | 1.12 [0.73, 1.72] |
| 34.6 DCC at > 2 mins with baby low | 0 | 0 | Risk Ratio (M‐H, Random, 95% CI) | 0.0 [0.0, 0.0] |
| 34.7 Mixed interventions or unclear | 0 | 0 | Risk Ratio (M‐H, Random, 95% CI) | 0.0 [0.0, 0.0] |
| 35 Rhesus isoimmunisation | 0 | 0 | Risk Ratio (M‐H, Random, 95% CI) | 0.0 [0.0, 0.0] |
| 35.1 DCC < 1 min and baby level with uterus | 0 | 0 | Risk Ratio (M‐H, Random, 95% CI) | 0.0 [0.0, 0.0] |
| 35.2 DCC < 1 min and baby held low | 0 | 0 | Risk Ratio (M‐H, Random, 95% CI) | 0.0 [0.0, 0.0] |
| 35.3 DCC at 1‐2 mins with baby level with uterus | 0 | 0 | Risk Ratio (M‐H, Random, 95% CI) | 0.0 [0.0, 0.0] |
| 35.4 DCC at 1‐2 mins with baby low | 0 | 0 | Risk Ratio (M‐H, Random, 95% CI) | 0.0 [0.0, 0.0] |
| 35.5 DCC at > 2 mins with baby level with uterus | 0 | 0 | Risk Ratio (M‐H, Random, 95% CI) | 0.0 [0.0, 0.0] |
| 35.6 DCC at > 2 mins with baby low | 0 | 0 | Risk Ratio (M‐H, Random, 95% CI) | 0.0 [0.0, 0.0] |
| 35.7 Mixed interventions or unclear | 0 | 0 | Risk Ratio (M‐H, Random, 95% CI) | 0.0 [0.0, 0.0] |
| 36 Psychological well being in mother | 0 | 0 | Mean Difference (IV, Random, 95% CI) | 0.0 [0.0, 0.0] |
| 36.1 DCC < 1 min and baby level with uterus | 0 | 0 | Mean Difference (IV, Random, 95% CI) | 0.0 [0.0, 0.0] |
| 36.2 DCC < 1 min and baby held low | 0 | 0 | Mean Difference (IV, Random, 95% CI) | 0.0 [0.0, 0.0] |
| 36.3 DCC 1‐2 mins and baby level with uterus | 0 | 0 | Mean Difference (IV, Random, 95% CI) | 0.0 [0.0, 0.0] |
| 36.4 DCC 1‐2 mins and baby held low | 0 | 0 | Mean Difference (IV, Random, 95% CI) | 0.0 [0.0, 0.0] |
| 36.5 DCC > 2 mins and baby level with uterus | 0 | 0 | Mean Difference (IV, Random, 95% CI) | 0.0 [0.0, 0.0] |
| 36.6 DCC > 2 mins and baby held low | 0 | 0 | Mean Difference (IV, Random, 95% CI) | 0.0 [0.0, 0.0] |
| 36.7 Mixed interventions or unclear | 0 | 0 | Mean Difference (IV, Random, 95% CI) | 0.0 [0.0, 0.0] |
| 37 Bonding | 0 | 0 | Mean Difference (IV, Random, 95% CI) | 0.0 [0.0, 0.0] |
| 37.1 DCC < 1 min and baby level with uterus | 0 | 0 | Mean Difference (IV, Random, 95% CI) | 0.0 [0.0, 0.0] |
| 37.2 DCC < 1 min and baby held low | 0 | 0 | Mean Difference (IV, Random, 95% CI) | 0.0 [0.0, 0.0] |
| 37.3 DCC 1‐2 mins and baby level with uterus | 0 | 0 | Mean Difference (IV, Random, 95% CI) | 0.0 [0.0, 0.0] |
| 37.4 DCC 1‐2 mins and baby held low | 0 | 0 | Mean Difference (IV, Random, 95% CI) | 0.0 [0.0, 0.0] |
| 37.5 DCC > 2 mins and baby level with uterus | 0 | 0 | Mean Difference (IV, Random, 95% CI) | 0.0 [0.0, 0.0] |
| 37.6 DCC > 2 mins and baby held low | 0 | 0 | Mean Difference (IV, Random, 95% CI) | 0.0 [0.0, 0.0] |
| 37.7 Mixed interventions or unclear | 0 | 0 | Mean Difference (IV, Random, 95% CI) | 0.0 [0.0, 0.0] |
| 38 Breastfeeding initiation | 0 | 0 | Risk Ratio (M‐H, Random, 95% CI) | 0.0 [0.0, 0.0] |
| 38.1 DCC < 1 min and baby level with uterus | 0 | 0 | Risk Ratio (M‐H, Random, 95% CI) | 0.0 [0.0, 0.0] |
| 38.2 DCC < 1 min and baby held low | 0 | 0 | Risk Ratio (M‐H, Random, 95% CI) | 0.0 [0.0, 0.0] |
| 38.3 DCC at 1‐2 mins with baby level with uterus | 0 | 0 | Risk Ratio (M‐H, Random, 95% CI) | 0.0 [0.0, 0.0] |
| 38.4 DCC at 1‐2 mins with baby low | 0 | 0 | Risk Ratio (M‐H, Random, 95% CI) | 0.0 [0.0, 0.0] |
| 38.5 DCC at > 2 mins with baby level with uterus | 0 | 0 | Risk Ratio (M‐H, Random, 95% CI) | 0.0 [0.0, 0.0] |
| 38.6 DCC at > 2 mins with baby low | 0 | 0 | Risk Ratio (M‐H, Random, 95% CI) | 0.0 [0.0, 0.0] |
| 38.7 Mixed interventions or unclear | 0 | 0 | Risk Ratio (M‐H, Random, 95% CI) | 0.0 [0.0, 0.0] |
| 39 Fully breastfed or mixed feeding at infant discharge Show forest plot | 1 | 248 | Risk Ratio (M‐H, Random, 95% CI) | 0.98 [0.79, 1.22] |
| 39.1 DCC < 1 min and baby level with uterus | 0 | 0 | Risk Ratio (M‐H, Random, 95% CI) | 0.0 [0.0, 0.0] |
| 39.2 DCC < 1 min and baby held low | 0 | 0 | Risk Ratio (M‐H, Random, 95% CI) | 0.0 [0.0, 0.0] |
| 39.3 DCC at 1‐2 mins with baby level with uterus | 0 | 0 | Risk Ratio (M‐H, Random, 95% CI) | 0.0 [0.0, 0.0] |
| 39.4 DCC at 1‐2 mins with baby low | 0 | 0 | Risk Ratio (M‐H, Random, 95% CI) | 0.0 [0.0, 0.0] |
| 39.5 DCC at > 2 mins with baby level with uterus | 1 | 248 | Risk Ratio (M‐H, Random, 95% CI) | 0.98 [0.79, 1.22] |
| 39.6 DCC at > 2 mins with baby low | 0 | 0 | Risk Ratio (M‐H, Random, 95% CI) | 0.0 [0.0, 0.0] |
| 39.7 Mixed interventions or unclear | 0 | 0 | Risk Ratio (M‐H, Random, 95% CI) | 0.0 [0.0, 0.0] |
| 40 Maternal anxiety | 0 | 0 | Risk Ratio (M‐H, Random, 95% CI) | 0.0 [0.0, 0.0] |
| 40.1 DCC < 1 min and baby level with uterus | 0 | 0 | Risk Ratio (M‐H, Random, 95% CI) | 0.0 [0.0, 0.0] |
| 40.2 DCC < 1 min and baby held low | 0 | 0 | Risk Ratio (M‐H, Random, 95% CI) | 0.0 [0.0, 0.0] |
| 40.3 DCC at 1‐2 mins with baby level with uterus | 0 | 0 | Risk Ratio (M‐H, Random, 95% CI) | 0.0 [0.0, 0.0] |
| 40.4 DCC at 1‐2 mins with baby low | 0 | 0 | Risk Ratio (M‐H, Random, 95% CI) | 0.0 [0.0, 0.0] |
| 40.5 DCC at > 2 mins with baby level with uterus | 0 | 0 | Risk Ratio (M‐H, Random, 95% CI) | 0.0 [0.0, 0.0] |
| 40.6 DCC at > 2 mins with baby low | 0 | 0 | Risk Ratio (M‐H, Random, 95% CI) | 0.0 [0.0, 0.0] |
| 40.7 Mixed interventions or unclear | 0 | 0 | Risk Ratio (M‐H, Random, 95% CI) | 0.0 [0.0, 0.0] |
| 41 Mothers' views | 0 | 0 | Mean Difference (IV, Random, 95% CI) | 0.0 [0.0, 0.0] |
| 41.1 DCC < 1 min and baby level with uterus | 0 | 0 | Mean Difference (IV, Random, 95% CI) | 0.0 [0.0, 0.0] |
| 41.2 DCC < 1 min and baby held low | 0 | 0 | Mean Difference (IV, Random, 95% CI) | 0.0 [0.0, 0.0] |
| 41.3 DCC 1‐2 mins and baby level with uterus | 0 | 0 | Mean Difference (IV, Random, 95% CI) | 0.0 [0.0, 0.0] |
| 41.4 DCC 1‐2 mins and baby held low | 0 | 0 | Mean Difference (IV, Random, 95% CI) | 0.0 [0.0, 0.0] |
| 41.5 DCC > 2 mins and baby level with uterus | 0 | 0 | Mean Difference (IV, Random, 95% CI) | 0.0 [0.0, 0.0] |
| 41.6 DCC > 2 mins and baby held low | 0 | 0 | Mean Difference (IV, Random, 95% CI) | 0.0 [0.0, 0.0] |
| 41.7 Mixed interventions or unclear | 0 | 0 | Mean Difference (IV, Random, 95% CI) | 0.0 [0.0, 0.0] |
| Outcome or subgroup title | No. of studies | No. of participants | Statistical method | Effect size |
| 1 Death of baby (up to discharge) Show forest plot | 3 | 322 | Risk Ratio (M‐H, Random, 95% CI) | 2.14 [0.93, 4.93] |
| 1.1 < 32‐34 weeks gestation | 3 | 322 | Risk Ratio (M‐H, Random, 95% CI) | 2.14 [0.93, 4.93] |
| 1.2 > 32‐34 weeks gestation | 0 | 0 | Risk Ratio (M‐H, Random, 95% CI) | 0.0 [0.0, 0.0] |
| 1.3 Mixed gestation | 0 | 0 | Risk Ratio (M‐H, Random, 95% CI) | 0.0 [0.0, 0.0] |
| 2 Death or neurodevelopmental impairment at age two to three years Show forest plot | 2 | 195 | Risk Ratio (M‐H, Random, 95% CI) | 1.67 [0.78, 3.57] |
| 2.1 < 32‐34 weeks gestation | 2 | 195 | Risk Ratio (M‐H, Random, 95% CI) | 1.67 [0.78, 3.57] |
| 2.2 > 32‐34 weeks gestation | 0 | 0 | Risk Ratio (M‐H, Random, 95% CI) | 0.0 [0.0, 0.0] |
| 2.3 Mixed gestation | 0 | 0 | Risk Ratio (M‐H, Random, 95% CI) | 0.0 [0.0, 0.0] |
| 3 Severe intraventricular haemorrhage (IVH grades 3, 4) Show forest plot | 1 | 58 | Risk Ratio (M‐H, Random, 95% CI) | 2.63 [0.11, 61.88] |
| 3.1 < 32‐34 weeks gestation | 1 | 58 | Risk Ratio (M‐H, Random, 95% CI) | 2.63 [0.11, 61.88] |
| 3.2 > 32‐34 weeks gestation | 0 | 0 | Risk Ratio (M‐H, Random, 95% CI) | 0.0 [0.0, 0.0] |
| 3.3 Mixed gestation | 0 | 0 | Risk Ratio (M‐H, Random, 95% CI) | 0.0 [0.0, 0.0] |
| 4 Intraventricular haemorrhage (IVH, all grades) Show forest plot | 2 | 125 | Risk Ratio (M‐H, Random, 95% CI) | 1.32 [0.55, 3.17] |
| 4.1 < 32‐34 weeks gestation | 2 | 125 | Risk Ratio (M‐H, Random, 95% CI) | 1.32 [0.55, 3.17] |
| 4.2 > 32‐34 weeks gestation | 0 | 0 | Risk Ratio (M‐H, Random, 95% CI) | 0.0 [0.0, 0.0] |
| 4.3 Mixed gestation | 0 | 0 | Risk Ratio (M‐H, Random, 95% CI) | 0.0 [0.0, 0.0] |
| 5 Periventricular leukomalacia (PVL) Show forest plot | 1 | 58 | Risk Ratio (M‐H, Random, 95% CI) | 0.0 [0.0, 0.0] |
| 5.1 < 32‐34 weeks gestation | 1 | 58 | Risk Ratio (M‐H, Random, 95% CI) | 0.0 [0.0, 0.0] |
| 5.2 > 32‐34 weeks gestation | 0 | 0 | Risk Ratio (M‐H, Random, 95% CI) | 0.0 [0.0, 0.0] |
| 5.3 Mixed gestation | 0 | 0 | Risk Ratio (M‐H, Random, 95% CI) | 0.0 [0.0, 0.0] |
| 6 Chronic lung disease (CLD) ‐ oxygen supplement at 36 weeks (corrected for gestation) Show forest plot | 2 | 125 | Risk Ratio (M‐H, Random, 95% CI) | 1.53 [0.43, 5.48] |
| 6.1 < 32‐34 weeks gestation | 2 | 125 | Risk Ratio (M‐H, Random, 95% CI) | 1.53 [0.43, 5.48] |
| 6.2 > 32‐34 weeks gestation | 0 | 0 | Risk Ratio (M‐H, Random, 95% CI) | 0.0 [0.0, 0.0] |
| 6.3 Mixed gestation | 0 | 0 | Risk Ratio (M‐H, Random, 95% CI) | 0.0 [0.0, 0.0] |
| 7 Maternal blood loss of 500 mL or greater | 0 | 0 | Risk Ratio (M‐H, Random, 95% CI) | 0.0 [0.0, 0.0] |
| 7.1 < 32‐34 weeks gestation | 0 | 0 | Risk Ratio (M‐H, Random, 95% CI) | 0.0 [0.0, 0.0] |
| 7.2 > 32‐34 weeks gestation | 0 | 0 | Risk Ratio (M‐H, Random, 95% CI) | 0.0 [0.0, 0.0] |
| 7.3 Mixed gestation | 0 | 0 | Risk Ratio (M‐H, Random, 95% CI) | 0.0 [0.0, 0.0] |
| 8 Intraventricular haemorrhage (IVH, grades 1 & 2) Show forest plot | 1 | 58 | Risk Ratio (M‐H, Random, 95% CI) | 1.74 [0.48, 6.30] |
| 8.1 < 32‐34 weeks gestation | 1 | 58 | Risk Ratio (M‐H, Random, 95% CI) | 1.74 [0.48, 6.30] |
| 8.2 > 32‐34 weeks gestation | 0 | 0 | Risk Ratio (M‐H, Random, 95% CI) | 0.0 [0.0, 0.0] |
| 8.3 Mixed gestation | 0 | 0 | Risk Ratio (M‐H, Random, 95% CI) | 0.0 [0.0, 0.0] |
| 9 Necrotising enterocolitis (NEC) confirmed by X‐ray or laparotomy) Show forest plot | 1 | 58 | Risk Ratio (M‐H, Random, 95% CI) | 3.48 [0.41, 29.31] |
| 9.1 < 32‐34 weeks gestation | 1 | 58 | Risk Ratio (M‐H, Random, 95% CI) | 3.48 [0.41, 29.31] |
| 9.2 > 32‐34 weeks gestation | 0 | 0 | Risk Ratio (M‐H, Random, 95% CI) | 0.0 [0.0, 0.0] |
| 9.3 Mixed gestation | 0 | 0 | Risk Ratio (M‐H, Random, 95% CI) | 0.0 [0.0, 0.0] |
| 10 Respiratory Distress Syndrome (RDS) | 0 | 0 | Risk Ratio (M‐H, Random, 95% CI) | 0.0 [0.0, 0.0] |
| 10.1 < 32‐34 weeks gestation | 0 | 0 | Risk Ratio (M‐H, Random, 95% CI) | 0.0 [0.0, 0.0] |
| 10.2 > 32‐34 weeks gestation | 0 | 0 | Risk Ratio (M‐H, Random, 95% CI) | 0.0 [0.0, 0.0] |
| 10.3 Mixed gestation | 0 | 0 | Risk Ratio (M‐H, Random, 95% CI) | 0.0 [0.0, 0.0] |
| 11 Respiratory support (ventilator or CPAP) | 0 | 0 | Risk Ratio (M‐H, Random, 95% CI) | 0.0 [0.0, 0.0] |
| 11.1 < 32‐34 weeks gestation | 0 | 0 | Risk Ratio (M‐H, Random, 95% CI) | 0.0 [0.0, 0.0] |
| 11.2 > 32‐34 weeks gestation | 0 | 0 | Risk Ratio (M‐H, Random, 95% CI) | 0.0 [0.0, 0.0] |
| 11.3 Mixed gestation | 0 | 0 | Risk Ratio (M‐H, Random, 95% CI) | 0.0 [0.0, 0.0] |
| 12 Duration of respiratory support (days) Show forest plot | 1 | 67 | Mean Difference (IV, Random, 95% CI) | 1.80 [‐2.01, 5.61] |
| 12.1 < 32‐34 weeks gestation | 1 | 67 | Mean Difference (IV, Random, 95% CI) | 1.80 [‐2.01, 5.61] |
| 12.2 > 32‐34 weeks gestation | 0 | 0 | Mean Difference (IV, Random, 95% CI) | 0.0 [0.0, 0.0] |
| 12.3 Mixed gestation | 0 | 0 | Mean Difference (IV, Random, 95% CI) | 0.0 [0.0, 0.0] |
| 13 Surfactant treatment (for severe RDS) Show forest plot | 1 | 58 | Risk Ratio (M‐H, Random, 95% CI) | 1.19 [0.66, 2.13] |
| 13.1 < 32‐34 weeks gestation | 1 | 58 | Risk Ratio (M‐H, Random, 95% CI) | 1.19 [0.66, 2.13] |
| 13.2 > 32‐34 weeks gestation | 0 | 0 | Risk Ratio (M‐H, Random, 95% CI) | 0.0 [0.0, 0.0] |
| 13.3 Mixed gestation | 0 | 0 | Risk Ratio (M‐H, Random, 95% CI) | 0.0 [0.0, 0.0] |
| 14 Treatment for Patent Ductus Arteriosus (PDA) (medical and/or surgical) | 0 | 0 | Risk Ratio (M‐H, Random, 95% CI) | 0.0 [0.0, 0.0] |
| 14.1 < 32‐34 weeks gestation | 0 | 0 | Risk Ratio (M‐H, Random, 95% CI) | 0.0 [0.0, 0.0] |
| 14.2 > 32‐34 weeks gestation | 0 | 0 | Risk Ratio (M‐H, Random, 95% CI) | 0.0 [0.0, 0.0] |
| 14.3 Mixed gestation | 0 | 0 | Risk Ratio (M‐H, Random, 95% CI) | 0.0 [0.0, 0.0] |
| 15 Treatment for Retinopathy of Prematurity (RoP) Show forest plot | 1 | 67 | Risk Ratio (M‐H, Random, 95% CI) | 0.73 [0.23, 2.35] |
| 15.1 < 32‐34 weeks gestation | 1 | 67 | Risk Ratio (M‐H, Random, 95% CI) | 0.73 [0.23, 2.35] |
| 15.2 > 32‐34 weeks gestation | 0 | 0 | Risk Ratio (M‐H, Random, 95% CI) | 0.0 [0.0, 0.0] |
| 15.3 Mixed gestation | 0 | 0 | Risk Ratio (M‐H, Random, 95% CI) | 0.0 [0.0, 0.0] |
| 16 Hyperbilirubinemia (treated by phototherapy) | 0 | 0 | Risk Ratio (M‐H, Random, 95% CI) | 0.0 [0.0, 0.0] |
| 16.1 < 32‐34 weeks gestation | 0 | 0 | Risk Ratio (M‐H, Random, 95% CI) | 0.0 [0.0, 0.0] |
| 16.2 > 32‐34 weeks gestation | 0 | 0 | Risk Ratio (M‐H, Random, 95% CI) | 0.0 [0.0, 0.0] |
| 16.3 Mixed gestation | 0 | 0 | Risk Ratio (M‐H, Random, 95% CI) | 0.0 [0.0, 0.0] |
| 17 Inotropics for low blood pressure | 0 | 0 | Risk Ratio (M‐H, Random, 95% CI) | 0.0 [0.0, 0.0] |
| 17.1 < 32‐34 weeks gestation | 0 | 0 | Risk Ratio (M‐H, Random, 95% CI) | 0.0 [0.0, 0.0] |
| 17.2 > 32‐34 weeks gestation | 0 | 0 | Risk Ratio (M‐H, Random, 95% CI) | 0.0 [0.0, 0.0] |
| 17.3 Mixed gestation | 0 | 0 | Risk Ratio (M‐H, Random, 95% CI) | 0.0 [0.0, 0.0] |
| 18 Low Apgar as defined by trialists (generally < 8 at 5 mins) | 0 | 0 | Risk Ratio (M‐H, Random, 95% CI) | 0.0 [0.0, 0.0] |
| 18.1 < 32‐34 weeks gestation | 0 | 0 | Risk Ratio (M‐H, Random, 95% CI) | 0.0 [0.0, 0.0] |
| 18.2 > 32‐34 weeks gestation | 0 | 0 | Risk Ratio (M‐H, Random, 95% CI) | 0.0 [0.0, 0.0] |
| 18.3 Mixed gestation | 0 | 0 | Risk Ratio (M‐H, Random, 95% CI) | 0.0 [0.0, 0.0] |
| 19 Blood transfusion in infant Show forest plot | 1 | 58 | Risk Ratio (M‐H, Random, 95% CI) | 0.77 [0.48, 1.22] |
| 19.1 < 32‐34 weeks gestation | 1 | 58 | Risk Ratio (M‐H, Random, 95% CI) | 0.77 [0.48, 1.22] |
| 19.2 > 32‐34 weeks gestation | 0 | 0 | Risk Ratio (M‐H, Random, 95% CI) | 0.0 [0.0, 0.0] |
| 19.3 Mixed gestation | 0 | 0 | Risk Ratio (M‐H, Random, 95% CI) | 0.0 [0.0, 0.0] |
| 20 Volume of blood transfused | 0 | 0 | Mean Difference (IV, Random, 95% CI) | 0.0 [0.0, 0.0] |
| 20.1 < 32‐34 weeks gestation | 0 | 0 | Mean Difference (IV, Random, 95% CI) | 0.0 [0.0, 0.0] |
| 20.2 > 32‐34 weeks gestation | 0 | 0 | Mean Difference (IV, Random, 95% CI) | 0.0 [0.0, 0.0] |
| 20.3 Mixed gestation | 0 | 0 | Mean Difference (IV, Random, 95% CI) | 0.0 [0.0, 0.0] |
| 21 Late sepsis (after 3 days or as defined by trialists) Show forest plot | 1 | 58 | Risk Ratio (M‐H, Random, 95% CI) | 0.87 [0.06, 13.27] |
| 21.1 < 32‐34 weeks gestation | 1 | 58 | Risk Ratio (M‐H, Random, 95% CI) | 0.87 [0.06, 13.27] |
| 21.2 > 32‐34 weeks gestation | 0 | 0 | Risk Ratio (M‐H, Random, 95% CI) | 0.0 [0.0, 0.0] |
| 21.3 Mixed gestation | 0 | 0 | Risk Ratio (M‐H, Random, 95% CI) | 0.0 [0.0, 0.0] |
| 22 Hydrocephalus Show forest plot | 1 | 58 | Risk Ratio (M‐H, Random, 95% CI) | 0.0 [0.0, 0.0] |
| 22.1 < 32‐34 weeks gestation | 1 | 58 | Risk Ratio (M‐H, Random, 95% CI) | 0.0 [0.0, 0.0] |
| 22.2 > 32‐34 weeks gestation | 0 | 0 | Risk Ratio (M‐H, Random, 95% CI) | 0.0 [0.0, 0.0] |
| 22.3 Mixed gestation | 0 | 0 | Risk Ratio (M‐H, Random, 95% CI) | 0.0 [0.0, 0.0] |
| 23 Temperature < 36.0oC within 1 hour of birth | 0 | 0 | Risk Ratio (M‐H, Random, 95% CI) | 0.0 [0.0, 0.0] |
| 23.1 < 32‐34 weeks gestation | 0 | 0 | Risk Ratio (M‐H, Random, 95% CI) | 0.0 [0.0, 0.0] |
| 23.2 > 32‐34 weeks gestation | 0 | 0 | Risk Ratio (M‐H, Random, 95% CI) | 0.0 [0.0, 0.0] |
| 23.3 Mixed gestation | 0 | 0 | Risk Ratio (M‐H, Random, 95% CI) | 0.0 [0.0, 0.0] |
| 24 Hb within 1st 24 hour of birth (g/dL) Show forest plot | 1 | 58 | Mean Difference (IV, Random, 95% CI) | ‐0.20 [‐1.57, 1.17] |
| 24.1 < 32‐34 weeks gestation | 1 | 58 | Mean Difference (IV, Random, 95% CI) | ‐0.20 [‐1.57, 1.17] |
| 24.2 > 32‐34 weeks gestation | 0 | 0 | Mean Difference (IV, Random, 95% CI) | 0.0 [0.0, 0.0] |
| 24.3 Mixed gestation | 0 | 0 | Mean Difference (IV, Random, 95% CI) | 0.0 [0.0, 0.0] |
| 25 Mean arterial blood pressure (subgrouped by time after birth) | 0 | 0 | Mean Difference (IV, Random, 95% CI) | 0.0 [0.0, 0.0] |
| 25.1 < 32‐34 weeks gestation | 0 | 0 | Mean Difference (IV, Random, 95% CI) | 0.0 [0.0, 0.0] |
| 25.2 > 32‐34 weeks gestation | 0 | 0 | Mean Difference (IV, Random, 95% CI) | 0.0 [0.0, 0.0] |
| 25.3 Mixed gestation | 0 | 0 | Mean Difference (IV, Random, 95% CI) | 0.0 [0.0, 0.0] |
| 26 Length of infant stay in NICU | 0 | 0 | Mean Difference (IV, Random, 95% CI) | 0.0 [0.0, 0.0] |
| 26.1 < 32‐34 weeks gestation | 0 | 0 | Mean Difference (IV, Random, 95% CI) | 0.0 [0.0, 0.0] |
| 26.2 > 32‐34 weeks gestation | 0 | 0 | Mean Difference (IV, Random, 95% CI) | 0.0 [0.0, 0.0] |
| 26.3 Mixed gestation | 0 | 0 | Mean Difference (IV, Random, 95% CI) | 0.0 [0.0, 0.0] |
| 27 Home oxygen Show forest plot | 1 | 58 | Risk Ratio (M‐H, Random, 95% CI) | 0.29 [0.01, 6.88] |
| 27.1 < 32‐34 weeks gestation | 1 | 58 | Risk Ratio (M‐H, Random, 95% CI) | 0.29 [0.01, 6.88] |
| 27.2 > 32‐34 weeks gestation | 0 | 0 | Risk Ratio (M‐H, Random, 95% CI) | 0.0 [0.0, 0.0] |
| 27.3 Mixed gestation | 0 | 0 | Risk Ratio (M‐H, Random, 95% CI) | 0.0 [0.0, 0.0] |
| 28 Neurodevelopmental impairment at age two to three years Show forest plot | 2 | 174 | Risk Ratio (M‐H, Random, 95% CI) | 1.18 [0.04, 32.88] |
| 28.1 < 32‐34 weeks gestation | 2 | 174 | Risk Ratio (M‐H, Random, 95% CI) | 1.18 [0.04, 32.88] |
| 28.2 > 32‐34 weeks gestation | 0 | 0 | Risk Ratio (M‐H, Random, 95% CI) | 0.0 [0.0, 0.0] |
| 28.3 Mixed gestation | 0 | 0 | Risk Ratio (M‐H, Random, 95% CI) | 0.0 [0.0, 0.0] |
| 29 Severe visual impairment Show forest plot | 1 | 39 | Risk Ratio (M‐H, Random, 95% CI) | 0.0 [0.0, 0.0] |
| 29.1 < 32‐34 weeks gestation | 1 | 39 | Risk Ratio (M‐H, Random, 95% CI) | 0.0 [0.0, 0.0] |
| 29.2 > 32‐34 weeks gestation | 0 | 0 | Risk Ratio (M‐H, Random, 95% CI) | 0.0 [0.0, 0.0] |
| 29.3 Mixed gestation | 0 | 0 | Risk Ratio (M‐H, Random, 95% CI) | 0.0 [0.0, 0.0] |
| 30 Cerebral palsy (CP) Show forest plot | 1 | 39 | Risk Ratio (M‐H, Random, 95% CI) | 0.0 [0.0, 0.0] |
| 30.1 < 32‐34 weeks gestation | 1 | 39 | Risk Ratio (M‐H, Random, 95% CI) | 0.0 [0.0, 0.0] |
| 30.2 > 32‐34 weeks gestation | 0 | 0 | Risk Ratio (M‐H, Random, 95% CI) | 0.0 [0.0, 0.0] |
| 30.3 Mixed gestation | 0 | 0 | Risk Ratio (M‐H, Random, 95% CI) | 0.0 [0.0, 0.0] |
| 31 Manual removal of placenta (denominator = vaginal births) | 0 | 0 | Risk Ratio (M‐H, Random, 95% CI) | 0.0 [0.0, 0.0] |
| 31.1 < 32‐34 weeks gestation | 0 | 0 | Risk Ratio (M‐H, Random, 95% CI) | 0.0 [0.0, 0.0] |
| 31.2 > 32‐34 weeks gestation | 0 | 0 | Risk Ratio (M‐H, Random, 95% CI) | 0.0 [0.0, 0.0] |
| 31.3 Mixed gestation | 0 | 0 | Risk Ratio (M‐H, Random, 95% CI) | 0.0 [0.0, 0.0] |
| 32 Prolonged third stage (> 30 minutes) (denominator = vaginal births) | 0 | 0 | Risk Ratio (M‐H, Random, 95% CI) | 0.0 [0.0, 0.0] |
| 32.1 < 32‐34 weeks gestation | 0 | 0 | Risk Ratio (M‐H, Random, 95% CI) | 0.0 [0.0, 0.0] |
| 32.2 > 32‐34 weeks gestation | 0 | 0 | Risk Ratio (M‐H, Random, 95% CI) | 0.0 [0.0, 0.0] |
| 32.3 Mixed gestation | 0 | 0 | Risk Ratio (M‐H, Random, 95% CI) | 0.0 [0.0, 0.0] |
| 33 Blood transfusion for mother | 0 | 0 | Risk Ratio (M‐H, Random, 95% CI) | 0.0 [0.0, 0.0] |
| 33.1 < 32‐34 weeks gestation | 0 | 0 | Risk Ratio (M‐H, Random, 95% CI) | 0.0 [0.0, 0.0] |
| 33.2 > 32‐34 weeks gestation | 0 | 0 | Risk Ratio (M‐H, Random, 95% CI) | 0.0 [0.0, 0.0] |
| 33.3 Mixed gestation | 0 | 0 | Risk Ratio (M‐H, Random, 95% CI) | 0.0 [0.0, 0.0] |
| 34 Postpartum infection in mother | 0 | 0 | Risk Ratio (M‐H, Random, 95% CI) | 0.0 [0.0, 0.0] |
| 34.1 < 32‐34 weeks gestation | 0 | 0 | Risk Ratio (M‐H, Random, 95% CI) | 0.0 [0.0, 0.0] |
| 34.2 > 32‐34 weeks gestation | 0 | 0 | Risk Ratio (M‐H, Random, 95% CI) | 0.0 [0.0, 0.0] |
| 34.3 Mixed gestation | 0 | 0 | Risk Ratio (M‐H, Random, 95% CI) | 0.0 [0.0, 0.0] |
| 35 Rhesus isoimmunisation | 0 | 0 | Risk Ratio (M‐H, Random, 95% CI) | 0.0 [0.0, 0.0] |
| 35.1 < 32‐34 weeks gestation | 0 | 0 | Risk Ratio (M‐H, Random, 95% CI) | 0.0 [0.0, 0.0] |
| 35.2 > 32‐34 weeks gestation | 0 | 0 | Risk Ratio (M‐H, Random, 95% CI) | 0.0 [0.0, 0.0] |
| 35.3 Mixed gestation | 0 | 0 | Risk Ratio (M‐H, Random, 95% CI) | 0.0 [0.0, 0.0] |
| 36 Psychological well being in mother | 0 | 0 | Std. Mean Difference (IV, Random, 95% CI) | 0.0 [0.0, 0.0] |
| 36.1 < 32‐34 weeks gestation | 0 | 0 | Std. Mean Difference (IV, Random, 95% CI) | 0.0 [0.0, 0.0] |
| 36.2 > 32‐34 weeks gestation | 0 | 0 | Std. Mean Difference (IV, Random, 95% CI) | 0.0 [0.0, 0.0] |
| 36.3 Mixed gestation | 0 | 0 | Std. Mean Difference (IV, Random, 95% CI) | 0.0 [0.0, 0.0] |
| 37 Bonding | 0 | 0 | Std. Mean Difference (IV, Random, 95% CI) | 0.0 [0.0, 0.0] |
| 37.1 < 32‐34 weeks gestation | 0 | 0 | Std. Mean Difference (IV, Random, 95% CI) | 0.0 [0.0, 0.0] |
| 37.2 > 32‐34 weeks gestation | 0 | 0 | Std. Mean Difference (IV, Random, 95% CI) | 0.0 [0.0, 0.0] |
| 37.3 Mixed gestation | 0 | 0 | Std. Mean Difference (IV, Random, 95% CI) | 0.0 [0.0, 0.0] |
| 38 Breastfeeding initiation | 0 | 0 | Risk Ratio (M‐H, Random, 95% CI) | 0.0 [0.0, 0.0] |
| 38.1 < 32‐34 weeks gestation | 0 | 0 | Risk Ratio (M‐H, Random, 95% CI) | 0.0 [0.0, 0.0] |
| 38.2 > 32‐34 weeks gestation | 0 | 0 | Risk Ratio (M‐H, Random, 95% CI) | 0.0 [0.0, 0.0] |
| 38.3 Mixed gestation | 0 | 0 | Risk Ratio (M‐H, Random, 95% CI) | 0.0 [0.0, 0.0] |
| 39 Fully breastfed or mixed feeding at infant discharge | 0 | 0 | Risk Ratio (M‐H, Random, 95% CI) | 0.0 [0.0, 0.0] |
| 39.1 < 32‐34 weeks gestation | 0 | 0 | Risk Ratio (M‐H, Random, 95% CI) | 0.0 [0.0, 0.0] |
| 39.2 > 32‐34 weeks gestation | 0 | 0 | Risk Ratio (M‐H, Random, 95% CI) | 0.0 [0.0, 0.0] |
| 39.3 Mixed gestation | 0 | 0 | Risk Ratio (M‐H, Random, 95% CI) | 0.0 [0.0, 0.0] |
| 40 Maternal anxiety | 0 | 0 | Risk Ratio (M‐H, Random, 95% CI) | 0.0 [0.0, 0.0] |
| 40.1 < 32‐34 weeks gestation | 0 | 0 | Risk Ratio (M‐H, Random, 95% CI) | 0.0 [0.0, 0.0] |
| 40.2 > 32‐34 weeks gestation | 0 | 0 | Risk Ratio (M‐H, Random, 95% CI) | 0.0 [0.0, 0.0] |
| 40.3 Mixed gestation | 0 | 0 | Risk Ratio (M‐H, Random, 95% CI) | 0.0 [0.0, 0.0] |
| 41 Mothers' views | 0 | 0 | Std. Mean Difference (IV, Random, 95% CI) | 0.0 [0.0, 0.0] |
| 41.1 < 32‐34 weeks gestation | 0 | 0 | Std. Mean Difference (IV, Random, 95% CI) | 0.0 [0.0, 0.0] |
| 41.2 > 32‐34 weeks gestation | 0 | 0 | Std. Mean Difference (IV, Random, 95% CI) | 0.0 [0.0, 0.0] |
| 41.3 Mixed gestation | 0 | 0 | Std. Mean Difference (IV, Random, 95% CI) | 0.0 [0.0, 0.0] |
| Outcome or subgroup title | No. of studies | No. of participants | Statistical method | Effect size |
| 1 Death of baby (up to discharge) Show forest plot | 3 | 322 | Risk Ratio (M‐H, Random, 95% CI) | 2.14 [0.93, 4.93] |
| 1.1 DCC < 1 min and baby level with uterus | 0 | 0 | Risk Ratio (M‐H, Random, 95% CI) | 0.0 [0.0, 0.0] |
| 1.2 DCC < 1 min and baby held low | 3 | 322 | Risk Ratio (M‐H, Random, 95% CI) | 2.14 [0.93, 4.93] |
| 1.3 DCC 1‐2 mins and baby level with uterus | 0 | 0 | Risk Ratio (M‐H, Random, 95% CI) | 0.0 [0.0, 0.0] |
| 1.4 DCC 1‐2 mins and baby held low | 0 | 0 | Risk Ratio (M‐H, Random, 95% CI) | 0.0 [0.0, 0.0] |
| 1.5 DCC > 2 mins and baby level with uterus | 0 | 0 | Risk Ratio (M‐H, Random, 95% CI) | 0.0 [0.0, 0.0] |
| 1.6 DCC > 2 mins and baby held low | 0 | 0 | Risk Ratio (M‐H, Random, 95% CI) | 0.0 [0.0, 0.0] |
| 1.7 Mixed interventions or unclear | 0 | 0 | Risk Ratio (M‐H, Random, 95% CI) | 0.0 [0.0, 0.0] |
| 2 Death or neurodevelopmental impairment at age two to three years Show forest plot | 2 | 195 | Risk Ratio (M‐H, Random, 95% CI) | 1.67 [0.78, 3.57] |
| 2.1 DCC < 1 min and baby level with uterus | 0 | 0 | Risk Ratio (M‐H, Random, 95% CI) | 0.0 [0.0, 0.0] |
| 2.2 DCC < 1 min and baby held low | 2 | 195 | Risk Ratio (M‐H, Random, 95% CI) | 1.67 [0.78, 3.57] |
| 2.3 DCC 1‐2 mins and baby level with uterus | 0 | 0 | Risk Ratio (M‐H, Random, 95% CI) | 0.0 [0.0, 0.0] |
| 2.4 DCC 1‐2 mins and baby held low | 0 | 0 | Risk Ratio (M‐H, Random, 95% CI) | 0.0 [0.0, 0.0] |
| 2.5 DCC > 2 mins and baby level with uterus | 0 | 0 | Risk Ratio (M‐H, Random, 95% CI) | 0.0 [0.0, 0.0] |
| 2.6 DCC > 2 mins and baby held low | 0 | 0 | Risk Ratio (M‐H, Random, 95% CI) | 0.0 [0.0, 0.0] |
| 2.7 Mixed interventions or unclear | 0 | 0 | Risk Ratio (M‐H, Random, 95% CI) | 0.0 [0.0, 0.0] |
| 3 Severe intraventricular haemorrhage (IVH grades 3, 4) Show forest plot | 1 | 58 | Risk Ratio (M‐H, Random, 95% CI) | 2.63 [0.11, 61.88] |
| 3.1 DCC < 1 min and baby level with uterus | 0 | 0 | Risk Ratio (M‐H, Random, 95% CI) | 0.0 [0.0, 0.0] |
| 3.2 DCC < 1 min and baby held low | 1 | 58 | Risk Ratio (M‐H, Random, 95% CI) | 2.63 [0.11, 61.88] |
| 3.3 DCC 1‐2 mins and baby level with uterus | 0 | 0 | Risk Ratio (M‐H, Random, 95% CI) | 0.0 [0.0, 0.0] |
| 3.4 DCC 1‐2 mins and baby held low | 0 | 0 | Risk Ratio (M‐H, Random, 95% CI) | 0.0 [0.0, 0.0] |
| 3.5 DCC > 2 mins and baby level with uterus | 0 | 0 | Risk Ratio (M‐H, Random, 95% CI) | 0.0 [0.0, 0.0] |
| 3.6 DCC > 2 mins and baby held low | 0 | 0 | Risk Ratio (M‐H, Random, 95% CI) | 0.0 [0.0, 0.0] |
| 3.7 Mixed interventions or unclear | 0 | 0 | Risk Ratio (M‐H, Random, 95% CI) | 0.0 [0.0, 0.0] |
| 4 Intraventricular haemorrhage (IVH, all grades) Show forest plot | 2 | 125 | Risk Ratio (M‐H, Random, 95% CI) | 1.32 [0.55, 3.17] |
| 4.1 DCC < 1 min and baby level with uterus | 0 | 0 | Risk Ratio (M‐H, Random, 95% CI) | 0.0 [0.0, 0.0] |
| 4.2 DCC < 1 min and baby held low | 2 | 125 | Risk Ratio (M‐H, Random, 95% CI) | 1.32 [0.55, 3.17] |
| 4.3 DCC 1‐2 mins and baby level with uterus | 0 | 0 | Risk Ratio (M‐H, Random, 95% CI) | 0.0 [0.0, 0.0] |
| 4.4 DCC 1‐2 mins and baby held low | 0 | 0 | Risk Ratio (M‐H, Random, 95% CI) | 0.0 [0.0, 0.0] |
| 4.5 DCC > 2 mins and baby level with uterus | 0 | 0 | Risk Ratio (M‐H, Random, 95% CI) | 0.0 [0.0, 0.0] |
| 4.6 DCC > 2 mins and baby held low | 0 | 0 | Risk Ratio (M‐H, Random, 95% CI) | 0.0 [0.0, 0.0] |
| 4.7 Mixed interventions or unclear | 0 | 0 | Risk Ratio (M‐H, Random, 95% CI) | 0.0 [0.0, 0.0] |
| 5 Periventricular leukomalacia (PVL) Show forest plot | 1 | 58 | Risk Ratio (M‐H, Random, 95% CI) | 0.0 [0.0, 0.0] |
| 5.1 DCC < 1 min and baby level with uterus | 0 | 0 | Risk Ratio (M‐H, Random, 95% CI) | 0.0 [0.0, 0.0] |
| 5.2 DCC < 1 min and baby held low | 1 | 58 | Risk Ratio (M‐H, Random, 95% CI) | 0.0 [0.0, 0.0] |
| 5.3 DCC 1‐2 mins and baby level with uterus | 0 | 0 | Risk Ratio (M‐H, Random, 95% CI) | 0.0 [0.0, 0.0] |
| 5.4 DCC 1‐2 mins and baby held low | 0 | 0 | Risk Ratio (M‐H, Random, 95% CI) | 0.0 [0.0, 0.0] |
| 5.5 DCC > 2 mins and baby level with uterus | 0 | 0 | Risk Ratio (M‐H, Random, 95% CI) | 0.0 [0.0, 0.0] |
| 5.6 DCC > 2 mins and baby held low | 0 | 0 | Risk Ratio (M‐H, Random, 95% CI) | 0.0 [0.0, 0.0] |
| 5.7 Mixed interventions or unclear | 0 | 0 | Risk Ratio (M‐H, Random, 95% CI) | 0.0 [0.0, 0.0] |
| 6 Chronic lung disease (CLD) ‐ oxygen supplement at 36 weeks (corrected for gestation) Show forest plot | 2 | 125 | Risk Ratio (M‐H, Random, 95% CI) | 1.53 [0.43, 5.48] |
| 6.1 DCC < 1 min and baby level with uterus | 0 | 0 | Risk Ratio (M‐H, Random, 95% CI) | 0.0 [0.0, 0.0] |
| 6.2 DCC < 1 min and baby held low | 2 | 125 | Risk Ratio (M‐H, Random, 95% CI) | 1.53 [0.43, 5.48] |
| 6.3 DCC 1‐2 mins and baby level with uterus | 0 | 0 | Risk Ratio (M‐H, Random, 95% CI) | 0.0 [0.0, 0.0] |
| 6.4 DCC 1‐2 mins and baby held low | 0 | 0 | Risk Ratio (M‐H, Random, 95% CI) | 0.0 [0.0, 0.0] |
| 6.5 DCC > 2 mins and baby level with uterus | 0 | 0 | Risk Ratio (M‐H, Random, 95% CI) | 0.0 [0.0, 0.0] |
| 6.6 DCC > 2 mins and baby held low | 0 | 0 | Risk Ratio (M‐H, Random, 95% CI) | 0.0 [0.0, 0.0] |
| 6.7 Mixed interventions or unclear | 0 | 0 | Risk Ratio (M‐H, Random, 95% CI) | 0.0 [0.0, 0.0] |
| 7 Maternal blood loss of 500 mL or greater | 0 | 0 | Risk Ratio (M‐H, Random, 95% CI) | 0.0 [0.0, 0.0] |
| 7.1 DCC < 1 min and baby level with uterus | 0 | 0 | Risk Ratio (M‐H, Random, 95% CI) | 0.0 [0.0, 0.0] |
| 7.2 DCC < 1 min and baby held low | 0 | 0 | Risk Ratio (M‐H, Random, 95% CI) | 0.0 [0.0, 0.0] |
| 7.3 DCC 1‐2 mins and baby level with uterus | 0 | 0 | Risk Ratio (M‐H, Random, 95% CI) | 0.0 [0.0, 0.0] |
| 7.4 DCC 1‐2 mins and baby held low | 0 | 0 | Risk Ratio (M‐H, Random, 95% CI) | 0.0 [0.0, 0.0] |
| 7.5 DCC > 2 mins and baby level with uterus | 0 | 0 | Risk Ratio (M‐H, Random, 95% CI) | 0.0 [0.0, 0.0] |
| 7.6 DCC > 2 mins and baby held low | 0 | 0 | Risk Ratio (M‐H, Random, 95% CI) | 0.0 [0.0, 0.0] |
| 7.7 Mixed interventions or unclear | 0 | 0 | Risk Ratio (M‐H, Random, 95% CI) | 0.0 [0.0, 0.0] |
| 8 Intraventricular haemorrhage (IVH, grades 1 & 2) Show forest plot | 1 | 58 | Risk Ratio (M‐H, Random, 95% CI) | 1.74 [0.48, 6.30] |
| 8.1 DCC < 1 min and baby level with uterus | 0 | 0 | Risk Ratio (M‐H, Random, 95% CI) | 0.0 [0.0, 0.0] |
| 8.2 DCC < 1 min and baby held low | 1 | 58 | Risk Ratio (M‐H, Random, 95% CI) | 1.74 [0.48, 6.30] |
| 8.3 DCC 1‐2 mins and baby level with uterus | 0 | 0 | Risk Ratio (M‐H, Random, 95% CI) | 0.0 [0.0, 0.0] |
| 8.4 DCC 1‐2 mins and baby held low | 0 | 0 | Risk Ratio (M‐H, Random, 95% CI) | 0.0 [0.0, 0.0] |
| 8.5 DCC > 2 mins and baby level with uterus | 0 | 0 | Risk Ratio (M‐H, Random, 95% CI) | 0.0 [0.0, 0.0] |
| 8.6 DCC > 2 mins and baby held low | 0 | 0 | Risk Ratio (M‐H, Random, 95% CI) | 0.0 [0.0, 0.0] |
| 8.7 Mixed interventions or unclear | 0 | 0 | Risk Ratio (M‐H, Random, 95% CI) | 0.0 [0.0, 0.0] |
| 9 Necrotising enterocolitis (NEC) confirmed by X ray or laparotomy) | 0 | 0 | Risk Ratio (M‐H, Random, 95% CI) | 0.0 [0.0, 0.0] |
| 9.1 DCC < 1 min and baby level with uterus | 0 | 0 | Risk Ratio (M‐H, Random, 95% CI) | 0.0 [0.0, 0.0] |
| 9.2 DCC < 1 min and baby held low | 0 | 0 | Risk Ratio (M‐H, Random, 95% CI) | 0.0 [0.0, 0.0] |
| 9.3 DCC 1‐2 mins and baby level with uterus | 0 | 0 | Risk Ratio (M‐H, Random, 95% CI) | 0.0 [0.0, 0.0] |
| 9.4 DCC 1‐2 mins and baby held low | 0 | 0 | Risk Ratio (M‐H, Random, 95% CI) | 0.0 [0.0, 0.0] |
| 9.5 DCC > 2 mins and baby level with uterus | 0 | 0 | Risk Ratio (M‐H, Random, 95% CI) | 0.0 [0.0, 0.0] |
| 9.6 DCC > 2 mins and baby held low | 0 | 0 | Risk Ratio (M‐H, Random, 95% CI) | 0.0 [0.0, 0.0] |
| 9.7 Mixed interventions or unclear | 0 | 0 | Risk Ratio (M‐H, Random, 95% CI) | 0.0 [0.0, 0.0] |
| 10 Respiratory Distress Syndrome (RDS) | 0 | 0 | Risk Ratio (M‐H, Random, 95% CI) | 0.0 [0.0, 0.0] |
| 10.1 DCC < 1 min and baby level with uterus | 0 | 0 | Risk Ratio (M‐H, Random, 95% CI) | 0.0 [0.0, 0.0] |
| 10.2 DCC < 1 min and baby held low | 0 | 0 | Risk Ratio (M‐H, Random, 95% CI) | 0.0 [0.0, 0.0] |
| 10.3 DCC 1‐2 mins and baby level with uterus | 0 | 0 | Risk Ratio (M‐H, Random, 95% CI) | 0.0 [0.0, 0.0] |
| 10.4 DCC 1‐2 mins and baby held low | 0 | 0 | Risk Ratio (M‐H, Random, 95% CI) | 0.0 [0.0, 0.0] |
| 10.5 DCC > 2 mins and baby level with uterus | 0 | 0 | Risk Ratio (M‐H, Random, 95% CI) | 0.0 [0.0, 0.0] |
| 10.6 DCC > 2 mins and baby held low | 0 | 0 | Risk Ratio (M‐H, Random, 95% CI) | 0.0 [0.0, 0.0] |
| 10.7 Mixed interventions or unclear | 0 | 0 | Risk Ratio (M‐H, Random, 95% CI) | 0.0 [0.0, 0.0] |
| 11 Respiratory support (ventilator or CPAP) | 0 | 0 | Risk Ratio (M‐H, Random, 95% CI) | 0.0 [0.0, 0.0] |
| 11.1 DCC < 1 min and baby level with uterus | 0 | 0 | Risk Ratio (M‐H, Random, 95% CI) | 0.0 [0.0, 0.0] |
| 11.2 DCC < 1 min and baby held low | 0 | 0 | Risk Ratio (M‐H, Random, 95% CI) | 0.0 [0.0, 0.0] |
| 11.3 DCC 1‐2 mins and baby level with uterus | 0 | 0 | Risk Ratio (M‐H, Random, 95% CI) | 0.0 [0.0, 0.0] |
| 11.4 DCC 1‐2 mins and baby held low | 0 | 0 | Risk Ratio (M‐H, Random, 95% CI) | 0.0 [0.0, 0.0] |
| 11.5 DCC > 2 mins and baby level with uterus | 0 | 0 | Risk Ratio (M‐H, Random, 95% CI) | 0.0 [0.0, 0.0] |
| 11.6 DCC > 2 mins and baby held low | 0 | 0 | Risk Ratio (M‐H, Random, 95% CI) | 0.0 [0.0, 0.0] |
| 11.7 Mixed interventions or unclear | 0 | 0 | Risk Ratio (M‐H, Random, 95% CI) | 0.0 [0.0, 0.0] |
| 12 Duration of respiratory support (days) Show forest plot | 1 | 67 | Mean Difference (IV, Random, 95% CI) | 1.80 [‐2.01, 5.61] |
| 12.1 DCC < 1 min and baby level with uterus | 0 | 0 | Mean Difference (IV, Random, 95% CI) | 0.0 [0.0, 0.0] |
| 12.2 DCC < 1 min and baby held low | 1 | 67 | Mean Difference (IV, Random, 95% CI) | 1.80 [‐2.01, 5.61] |
| 12.3 DCC 1‐2 mins and baby level with uterus | 0 | 0 | Mean Difference (IV, Random, 95% CI) | 0.0 [0.0, 0.0] |
| 12.4 DCC 1‐2 mins and baby held low | 0 | 0 | Mean Difference (IV, Random, 95% CI) | 0.0 [0.0, 0.0] |
| 12.5 DCC > 2 mins and baby level with uterus | 0 | 0 | Mean Difference (IV, Random, 95% CI) | 0.0 [0.0, 0.0] |
| 12.6 DCC > 2 mins and baby held low | 0 | 0 | Mean Difference (IV, Random, 95% CI) | 0.0 [0.0, 0.0] |
| 12.7 Mixed interventions or unclear | 0 | 0 | Mean Difference (IV, Random, 95% CI) | 0.0 [0.0, 0.0] |
| 13 Surfactant treatment (for severe RDS) Show forest plot | 1 | 58 | Risk Ratio (M‐H, Random, 95% CI) | 1.19 [0.66, 2.13] |
| 13.1 DCC < 1 min and baby level with uterus | 0 | 0 | Risk Ratio (M‐H, Random, 95% CI) | 0.0 [0.0, 0.0] |
| 13.2 DCC < 1 min and baby held low | 1 | 58 | Risk Ratio (M‐H, Random, 95% CI) | 1.19 [0.66, 2.13] |
| 13.3 DCC 1‐2 mins and baby level with uterus | 0 | 0 | Risk Ratio (M‐H, Random, 95% CI) | 0.0 [0.0, 0.0] |
| 13.4 DCC 1‐2 mins and baby held low | 0 | 0 | Risk Ratio (M‐H, Random, 95% CI) | 0.0 [0.0, 0.0] |
| 13.5 DCC > 2 mins and baby level with uterus | 0 | 0 | Risk Ratio (M‐H, Random, 95% CI) | 0.0 [0.0, 0.0] |
| 13.6 DCC > 2 mins and baby held low | 0 | 0 | Risk Ratio (M‐H, Random, 95% CI) | 0.0 [0.0, 0.0] |
| 13.7 Mixed interventions or unclear | 0 | 0 | Risk Ratio (M‐H, Random, 95% CI) | 0.0 [0.0, 0.0] |
| 14 Treatment for Patent Ductus Arteriosus (PDA) (medical and/or surgical) | 0 | 0 | Risk Ratio (M‐H, Random, 95% CI) | 0.0 [0.0, 0.0] |
| 14.1 DCC < 1 min and baby level with uterus | 0 | 0 | Risk Ratio (M‐H, Random, 95% CI) | 0.0 [0.0, 0.0] |
| 14.2 DCC < 1 min and baby held low | 0 | 0 | Risk Ratio (M‐H, Random, 95% CI) | 0.0 [0.0, 0.0] |
| 14.3 DCC 1‐2 mins and baby level with uterus | 0 | 0 | Risk Ratio (M‐H, Random, 95% CI) | 0.0 [0.0, 0.0] |
| 14.4 DCC 1‐2 mins and baby held low | 0 | 0 | Risk Ratio (M‐H, Random, 95% CI) | 0.0 [0.0, 0.0] |
| 14.5 DCC > 2 mins and baby level with uterus | 0 | 0 | Risk Ratio (M‐H, Random, 95% CI) | 0.0 [0.0, 0.0] |
| 14.6 DCC > 2 mins and baby held low | 0 | 0 | Risk Ratio (M‐H, Random, 95% CI) | 0.0 [0.0, 0.0] |
| 14.7 Mixed interventions or unclear | 0 | 0 | Risk Ratio (M‐H, Random, 95% CI) | 0.0 [0.0, 0.0] |
| 15 Treatment for Retinopathy of Prematurity (RoP) Show forest plot | 1 | 67 | Risk Ratio (M‐H, Random, 95% CI) | 0.73 [0.23, 2.35] |
| 15.1 DCC < 1 min and baby level with uterus | 0 | 0 | Risk Ratio (M‐H, Random, 95% CI) | 0.0 [0.0, 0.0] |
| 15.2 DCC < 1 min and baby held low | 1 | 67 | Risk Ratio (M‐H, Random, 95% CI) | 0.73 [0.23, 2.35] |
| 15.3 DCC 1‐2 mins and baby level with uterus | 0 | 0 | Risk Ratio (M‐H, Random, 95% CI) | 0.0 [0.0, 0.0] |
| 15.4 DCC 1‐2 mins and baby held low | 0 | 0 | Risk Ratio (M‐H, Random, 95% CI) | 0.0 [0.0, 0.0] |
| 15.5 DCC > 2 mins and baby level with uterus | 0 | 0 | Risk Ratio (M‐H, Random, 95% CI) | 0.0 [0.0, 0.0] |
| 15.6 DCC > 2 mins and baby held low | 0 | 0 | Risk Ratio (M‐H, Random, 95% CI) | 0.0 [0.0, 0.0] |
| 15.7 Mixed interventions or unclear | 0 | 0 | Risk Ratio (M‐H, Random, 95% CI) | 0.0 [0.0, 0.0] |
| 16 Hyperbilirubinemia (treated by phototherapy) | 0 | 0 | Risk Ratio (M‐H, Random, 95% CI) | 0.0 [0.0, 0.0] |
| 16.1 DCC < 1 min and baby level with uterus | 0 | 0 | Risk Ratio (M‐H, Random, 95% CI) | 0.0 [0.0, 0.0] |
| 16.2 DCC < 1 min and baby held low | 0 | 0 | Risk Ratio (M‐H, Random, 95% CI) | 0.0 [0.0, 0.0] |
| 16.3 DCC 1‐2 mins and baby level with uterus | 0 | 0 | Risk Ratio (M‐H, Random, 95% CI) | 0.0 [0.0, 0.0] |
| 16.4 DCC 1‐2 mins and baby held low | 0 | 0 | Risk Ratio (M‐H, Random, 95% CI) | 0.0 [0.0, 0.0] |
| 16.5 DCC > 2 mins and baby level with uterus | 0 | 0 | Risk Ratio (M‐H, Random, 95% CI) | 0.0 [0.0, 0.0] |
| 16.6 DCC > 2 mins and baby held low | 0 | 0 | Risk Ratio (M‐H, Random, 95% CI) | 0.0 [0.0, 0.0] |
| 16.7 Mixed interventions or unclear | 0 | 0 | Risk Ratio (M‐H, Random, 95% CI) | 0.0 [0.0, 0.0] |
| 17 Inotropics for low blood pressure | 0 | 0 | Risk Ratio (M‐H, Random, 95% CI) | 0.0 [0.0, 0.0] |
| 17.1 DCC < 1 min and baby level with uterus | 0 | 0 | Risk Ratio (M‐H, Random, 95% CI) | 0.0 [0.0, 0.0] |
| 17.2 DCC < 1 min and baby held low | 0 | 0 | Risk Ratio (M‐H, Random, 95% CI) | 0.0 [0.0, 0.0] |
| 17.3 DCC 1‐2 mins and baby level with uterus | 0 | 0 | Risk Ratio (M‐H, Random, 95% CI) | 0.0 [0.0, 0.0] |
| 17.4 DCC 1‐2 mins and baby held low | 0 | 0 | Risk Ratio (M‐H, Random, 95% CI) | 0.0 [0.0, 0.0] |
| 17.5 DCC > 2 mins and baby level with uterus | 0 | 0 | Risk Ratio (M‐H, Random, 95% CI) | 0.0 [0.0, 0.0] |
| 17.6 DCC > 2 mins and baby held low | 0 | 0 | Risk Ratio (M‐H, Random, 95% CI) | 0.0 [0.0, 0.0] |
| 17.7 Mixed interventions or unclear | 0 | 0 | Risk Ratio (M‐H, Random, 95% CI) | 0.0 [0.0, 0.0] |
| 18 Low Apgar as defined by trialists (generally < 8 at 5 mins) | 0 | 0 | Risk Ratio (M‐H, Random, 95% CI) | 0.0 [0.0, 0.0] |
| 18.1 DCC < 1 min and baby level with uterus | 0 | 0 | Risk Ratio (M‐H, Random, 95% CI) | 0.0 [0.0, 0.0] |
| 18.2 DCC < 1 min and baby held low | 0 | 0 | Risk Ratio (M‐H, Random, 95% CI) | 0.0 [0.0, 0.0] |
| 18.3 DCC 1‐2 mins and baby level with uterus | 0 | 0 | Risk Ratio (M‐H, Random, 95% CI) | 0.0 [0.0, 0.0] |
| 18.4 DCC 1‐2 mins and baby held low | 0 | 0 | Risk Ratio (M‐H, Random, 95% CI) | 0.0 [0.0, 0.0] |
| 18.5 DCC > 2 mins and baby level with uterus | 0 | 0 | Risk Ratio (M‐H, Random, 95% CI) | 0.0 [0.0, 0.0] |
| 18.6 DCC > 2 mins and baby held low | 0 | 0 | Risk Ratio (M‐H, Random, 95% CI) | 0.0 [0.0, 0.0] |
| 18.7 Mixed interventions or unclear | 0 | 0 | Risk Ratio (M‐H, Random, 95% CI) | 0.0 [0.0, 0.0] |
| 19 Blood transfusion in infant Show forest plot | 1 | 58 | Risk Ratio (M‐H, Random, 95% CI) | 0.77 [0.48, 1.22] |
| 19.1 DCC < 1 min and baby level with uterus | 0 | 0 | Risk Ratio (M‐H, Random, 95% CI) | 0.0 [0.0, 0.0] |
| 19.2 DCC < 1 min and baby held low | 1 | 58 | Risk Ratio (M‐H, Random, 95% CI) | 0.77 [0.48, 1.22] |
| 19.3 DCC 1‐2 mins and baby level with uterus | 0 | 0 | Risk Ratio (M‐H, Random, 95% CI) | 0.0 [0.0, 0.0] |
| 19.4 DCC 1‐2 mins and baby held low | 0 | 0 | Risk Ratio (M‐H, Random, 95% CI) | 0.0 [0.0, 0.0] |
| 19.5 DCC > 2 mins and baby level with uterus | 0 | 0 | Risk Ratio (M‐H, Random, 95% CI) | 0.0 [0.0, 0.0] |
| 19.6 DCC > 2 mins and baby held low | 0 | 0 | Risk Ratio (M‐H, Random, 95% CI) | 0.0 [0.0, 0.0] |
| 19.7 Mixed interventions or unclear | 0 | 0 | Risk Ratio (M‐H, Random, 95% CI) | 0.0 [0.0, 0.0] |
| 20 Volume of blood transfused | 0 | 0 | Mean Difference (IV, Random, 95% CI) | 0.0 [0.0, 0.0] |
| 20.1 DCC < 1 min and baby level with uterus | 0 | 0 | Mean Difference (IV, Random, 95% CI) | 0.0 [0.0, 0.0] |
| 20.2 DCC < 1 min and baby held low | 0 | 0 | Mean Difference (IV, Random, 95% CI) | 0.0 [0.0, 0.0] |
| 20.3 DCC 1‐2 mins and baby level with uterus | 0 | 0 | Mean Difference (IV, Random, 95% CI) | 0.0 [0.0, 0.0] |
| 20.4 DCC 1‐2 mins and baby held low | 0 | 0 | Mean Difference (IV, Random, 95% CI) | 0.0 [0.0, 0.0] |
| 20.5 DCC > 2 mins and baby level with uterus | 0 | 0 | Mean Difference (IV, Random, 95% CI) | 0.0 [0.0, 0.0] |
| 20.6 DCC > 2 mins and baby held low | 0 | 0 | Mean Difference (IV, Random, 95% CI) | 0.0 [0.0, 0.0] |
| 20.7 Mixed interventions or unclear | 0 | 0 | Mean Difference (IV, Random, 95% CI) | 0.0 [0.0, 0.0] |
| 21 Late sepsis (after 3 days or as defined by trialists) Show forest plot | 1 | 58 | Risk Ratio (M‐H, Random, 95% CI) | 0.87 [0.06, 13.27] |
| 21.1 DCC < 1 min and baby level with uterus | 0 | 0 | Risk Ratio (M‐H, Random, 95% CI) | 0.0 [0.0, 0.0] |
| 21.2 DCC < 1 min and baby held low | 1 | 58 | Risk Ratio (M‐H, Random, 95% CI) | 0.87 [0.06, 13.27] |
| 21.3 DCC 1‐2 mins and baby level with uterus | 0 | 0 | Risk Ratio (M‐H, Random, 95% CI) | 0.0 [0.0, 0.0] |
| 21.4 DCC 1‐2 mins and baby held low | 0 | 0 | Risk Ratio (M‐H, Random, 95% CI) | 0.0 [0.0, 0.0] |
| 21.5 DCC > 2 mins and baby level with uterus | 0 | 0 | Risk Ratio (M‐H, Random, 95% CI) | 0.0 [0.0, 0.0] |
| 21.6 DCC > 2 mins and baby held low | 0 | 0 | Risk Ratio (M‐H, Random, 95% CI) | 0.0 [0.0, 0.0] |
| 21.7 Mixed interventions or unclear | 0 | 0 | Risk Ratio (M‐H, Random, 95% CI) | 0.0 [0.0, 0.0] |
| 22 Hydrocephalus Show forest plot | 2 | 116 | Risk Ratio (M‐H, Random, 95% CI) | 0.0 [0.0, 0.0] |
| 22.1 DCC < 1 min and baby level with uterus | 0 | 0 | Risk Ratio (M‐H, Random, 95% CI) | 0.0 [0.0, 0.0] |
| 22.2 DCC < 1 min and baby held low | 2 | 116 | Risk Ratio (M‐H, Random, 95% CI) | 0.0 [0.0, 0.0] |
| 22.3 DCC 1‐2 mins and baby level with uterus | 0 | 0 | Risk Ratio (M‐H, Random, 95% CI) | 0.0 [0.0, 0.0] |
| 22.4 DCC 1‐2 mins and baby held low | 0 | 0 | Risk Ratio (M‐H, Random, 95% CI) | 0.0 [0.0, 0.0] |
| 22.5 DCC > 2 mins and baby level with uterus | 0 | 0 | Risk Ratio (M‐H, Random, 95% CI) | 0.0 [0.0, 0.0] |
| 22.6 DCC > 2 mins and baby held low | 0 | 0 | Risk Ratio (M‐H, Random, 95% CI) | 0.0 [0.0, 0.0] |
| 22.7 Mixed interventions or unclear | 0 | 0 | Risk Ratio (M‐H, Random, 95% CI) | 0.0 [0.0, 0.0] |
| 23 Temperature < 36.0oC within 1 hour of birth | 0 | 0 | Risk Ratio (M‐H, Random, 95% CI) | 0.0 [0.0, 0.0] |
| 23.1 DCC < 1 min and baby level with uterus | 0 | 0 | Risk Ratio (M‐H, Random, 95% CI) | 0.0 [0.0, 0.0] |
| 23.2 DCC < 1 min and baby held low | 0 | 0 | Risk Ratio (M‐H, Random, 95% CI) | 0.0 [0.0, 0.0] |
| 23.3 DCC 1‐2 mins and baby level with uterus | 0 | 0 | Risk Ratio (M‐H, Random, 95% CI) | 0.0 [0.0, 0.0] |
| 23.4 DCC 1‐2 mins and baby held low | 0 | 0 | Risk Ratio (M‐H, Random, 95% CI) | 0.0 [0.0, 0.0] |
| 23.5 DCC > 2 mins and baby level with uterus | 0 | 0 | Risk Ratio (M‐H, Random, 95% CI) | 0.0 [0.0, 0.0] |
| 23.6 DCC > 2 mins and baby held low | 0 | 0 | Risk Ratio (M‐H, Random, 95% CI) | 0.0 [0.0, 0.0] |
| 23.7 Mixed interventions or unclear | 0 | 0 | Risk Ratio (M‐H, Random, 95% CI) | 0.0 [0.0, 0.0] |
| 24 Hb within 1st 24 hour of birth (g/dL) Show forest plot | 1 | 58 | Mean Difference (IV, Random, 95% CI) | ‐0.20 [‐1.57, 1.17] |
| 24.1 DCC < 1 min and baby level with uterus | 0 | 0 | Mean Difference (IV, Random, 95% CI) | 0.0 [0.0, 0.0] |
| 24.2 DCC < 1 min and baby held low | 1 | 58 | Mean Difference (IV, Random, 95% CI) | ‐0.20 [‐1.57, 1.17] |
| 24.3 DCC 1‐2 mins and baby level with uterus | 0 | 0 | Mean Difference (IV, Random, 95% CI) | 0.0 [0.0, 0.0] |
| 24.4 DCC 1‐2 mins and baby held low | 0 | 0 | Mean Difference (IV, Random, 95% CI) | 0.0 [0.0, 0.0] |
| 24.5 DCC > 2 mins and baby level with uterus | 0 | 0 | Mean Difference (IV, Random, 95% CI) | 0.0 [0.0, 0.0] |
| 24.6 DCC > 2 mins and baby held low | 0 | 0 | Mean Difference (IV, Random, 95% CI) | 0.0 [0.0, 0.0] |
| 24.7 Mixed interventions or unclear | 0 | 0 | Mean Difference (IV, Random, 95% CI) | 0.0 [0.0, 0.0] |
| 25 Mean arterial blood pressure (subgrouped by time after birth) | 0 | 0 | Mean Difference (IV, Random, 95% CI) | 0.0 [0.0, 0.0] |
| 25.1 DCC < 1 min and baby level with uterus | 0 | 0 | Mean Difference (IV, Random, 95% CI) | 0.0 [0.0, 0.0] |
| 25.2 DCC < 1 min and baby held low | 0 | 0 | Mean Difference (IV, Random, 95% CI) | 0.0 [0.0, 0.0] |
| 25.3 DCC 1‐2 mins and baby level with uterus | 0 | 0 | Mean Difference (IV, Random, 95% CI) | 0.0 [0.0, 0.0] |
| 25.4 DCC 1‐2 mins and baby held low | 0 | 0 | Mean Difference (IV, Random, 95% CI) | 0.0 [0.0, 0.0] |
| 25.5 DCC > 2 mins and baby level with uterus | 0 | 0 | Mean Difference (IV, Random, 95% CI) | 0.0 [0.0, 0.0] |
| 25.6 DCC > 2 mins and baby held low | 0 | 0 | Mean Difference (IV, Random, 95% CI) | 0.0 [0.0, 0.0] |
| 25.7 Mixed interventions or unclear | 0 | 0 | Mean Difference (IV, Random, 95% CI) | 0.0 [0.0, 0.0] |
| 26 Length of infant stay in NICU | 0 | 0 | Mean Difference (IV, Random, 95% CI) | 0.0 [0.0, 0.0] |
| 26.1 DCC < 1 min and baby level with uterus | 0 | 0 | Mean Difference (IV, Random, 95% CI) | 0.0 [0.0, 0.0] |
| 26.2 DCC < 1 min and baby held low | 0 | 0 | Mean Difference (IV, Random, 95% CI) | 0.0 [0.0, 0.0] |
| 26.3 DCC 1‐2 mins and baby level with uterus | 0 | 0 | Mean Difference (IV, Random, 95% CI) | 0.0 [0.0, 0.0] |
| 26.4 DCC 1‐2 mins and baby held low | 0 | 0 | Mean Difference (IV, Random, 95% CI) | 0.0 [0.0, 0.0] |
| 26.5 DCC > 2 mins and baby level with uterus | 0 | 0 | Mean Difference (IV, Random, 95% CI) | 0.0 [0.0, 0.0] |
| 26.6 DCC > 2 mins and baby held low | 0 | 0 | Mean Difference (IV, Random, 95% CI) | 0.0 [0.0, 0.0] |
| 26.7 Mixed interventions or unclear | 0 | 0 | Mean Difference (IV, Random, 95% CI) | 0.0 [0.0, 0.0] |
| 27 Home oxygen Show forest plot | 1 | 58 | Risk Ratio (M‐H, Random, 95% CI) | 0.29 [0.01, 6.88] |
| 27.1 DCC < 1 min and baby level with uterus | 0 | 0 | Risk Ratio (M‐H, Random, 95% CI) | 0.0 [0.0, 0.0] |
| 27.2 DCC < 1 min and baby held low | 1 | 58 | Risk Ratio (M‐H, Random, 95% CI) | 0.29 [0.01, 6.88] |
| 27.3 DCC 1‐2 mins and baby level with uterus | 0 | 0 | Risk Ratio (M‐H, Random, 95% CI) | 0.0 [0.0, 0.0] |
| 27.4 DCC 1‐2 mins and baby held low | 0 | 0 | Risk Ratio (M‐H, Random, 95% CI) | 0.0 [0.0, 0.0] |
| 27.5 DCC > 2 mins and baby level with uterus | 0 | 0 | Risk Ratio (M‐H, Random, 95% CI) | 0.0 [0.0, 0.0] |
| 27.6 DCC > 2 mins and baby held low | 0 | 0 | Risk Ratio (M‐H, Random, 95% CI) | 0.0 [0.0, 0.0] |
| 27.7 Mixed interventions or unclear | 0 | 0 | Risk Ratio (M‐H, Random, 95% CI) | 0.0 [0.0, 0.0] |
| 28 Neurodevelopmental impairment at age two to three years Show forest plot | 2 | 174 | Risk Ratio (M‐H, Random, 95% CI) | 1.18 [0.04, 32.88] |
| 28.1 DCC < 1 min and baby level with uterus | 0 | 0 | Risk Ratio (M‐H, Random, 95% CI) | 0.0 [0.0, 0.0] |
| 28.2 DCC < 1 min and baby held low | 2 | 174 | Risk Ratio (M‐H, Random, 95% CI) | 1.18 [0.04, 32.88] |
| 28.3 DCC 1‐2 mins and baby level with uterus | 0 | 0 | Risk Ratio (M‐H, Random, 95% CI) | 0.0 [0.0, 0.0] |
| 28.4 DCC 1‐2 mins and baby held low | 0 | 0 | Risk Ratio (M‐H, Random, 95% CI) | 0.0 [0.0, 0.0] |
| 28.5 DCC > 2 mins and baby level with uterus | 0 | 0 | Risk Ratio (M‐H, Random, 95% CI) | 0.0 [0.0, 0.0] |
| 28.6 DCC > 2 mins and baby held low | 0 | 0 | Risk Ratio (M‐H, Random, 95% CI) | 0.0 [0.0, 0.0] |
| 28.7 Mixed interventions or unclear | 0 | 0 | Risk Ratio (M‐H, Random, 95% CI) | 0.0 [0.0, 0.0] |
| 29 Severe visual impairment Show forest plot | 1 | 39 | Risk Ratio (M‐H, Random, 95% CI) | 0.0 [0.0, 0.0] |
| 29.1 DCC < 1 min and baby level with uterus | 0 | 0 | Risk Ratio (M‐H, Random, 95% CI) | 0.0 [0.0, 0.0] |
| 29.2 DCC < 1 min and baby held low | 1 | 39 | Risk Ratio (M‐H, Random, 95% CI) | 0.0 [0.0, 0.0] |
| 29.3 DCC 1‐2 mins and baby level with uterus | 0 | 0 | Risk Ratio (M‐H, Random, 95% CI) | 0.0 [0.0, 0.0] |
| 29.4 DCC 1‐2 mins and baby held low | 0 | 0 | Risk Ratio (M‐H, Random, 95% CI) | 0.0 [0.0, 0.0] |
| 29.5 DCC > 2 mins and baby level with uterus | 0 | 0 | Risk Ratio (M‐H, Random, 95% CI) | 0.0 [0.0, 0.0] |
| 29.6 DCC > 2 mins and baby held low | 0 | 0 | Risk Ratio (M‐H, Random, 95% CI) | 0.0 [0.0, 0.0] |
| 29.7 Mixed interventions or unclear | 0 | 0 | Risk Ratio (M‐H, Random, 95% CI) | 0.0 [0.0, 0.0] |
| 30 Cerebral palsy (CP) Show forest plot | 1 | 39 | Risk Ratio (M‐H, Random, 95% CI) | 0.0 [0.0, 0.0] |
| 30.1 DCC < 1 min and baby level with uterus | 0 | 0 | Risk Ratio (M‐H, Random, 95% CI) | 0.0 [0.0, 0.0] |
| 30.2 DCC < 1 min and baby held low | 1 | 39 | Risk Ratio (M‐H, Random, 95% CI) | 0.0 [0.0, 0.0] |
| 30.3 DCC 1‐2 mins and baby level with uterus | 0 | 0 | Risk Ratio (M‐H, Random, 95% CI) | 0.0 [0.0, 0.0] |
| 30.4 DCC 1‐2 mins and baby held low | 0 | 0 | Risk Ratio (M‐H, Random, 95% CI) | 0.0 [0.0, 0.0] |
| 30.5 DCC > 2 mins and baby level with uterus | 0 | 0 | Risk Ratio (M‐H, Random, 95% CI) | 0.0 [0.0, 0.0] |
| 30.6 DCC > 2 mins and baby held low | 0 | 0 | Risk Ratio (M‐H, Random, 95% CI) | 0.0 [0.0, 0.0] |
| 30.7 Mixed interventions or unclear | 0 | 0 | Risk Ratio (M‐H, Random, 95% CI) | 0.0 [0.0, 0.0] |
| 31 Manual removal of placenta (denominator = vaginal births) | 0 | 0 | Risk Ratio (M‐H, Random, 95% CI) | 0.0 [0.0, 0.0] |
| 31.1 DCC < 1 min and baby level with uterus | 0 | 0 | Risk Ratio (M‐H, Random, 95% CI) | 0.0 [0.0, 0.0] |
| 31.2 DCC < 1 min and baby held low | 0 | 0 | Risk Ratio (M‐H, Random, 95% CI) | 0.0 [0.0, 0.0] |
| 31.3 DCC 1‐2 mins and baby level with uterus | 0 | 0 | Risk Ratio (M‐H, Random, 95% CI) | 0.0 [0.0, 0.0] |
| 31.4 DCC 1‐2 mins and baby held low | 0 | 0 | Risk Ratio (M‐H, Random, 95% CI) | 0.0 [0.0, 0.0] |
| 31.5 DCC > 2 mins and baby level with uterus | 0 | 0 | Risk Ratio (M‐H, Random, 95% CI) | 0.0 [0.0, 0.0] |
| 31.6 DCC > 2 mins and baby held low | 0 | 0 | Risk Ratio (M‐H, Random, 95% CI) | 0.0 [0.0, 0.0] |
| 31.7 Mixed interventions or unclear | 0 | 0 | Risk Ratio (M‐H, Random, 95% CI) | 0.0 [0.0, 0.0] |
| 32 Prolonged third stage (>30 minutes) (denominator = vaginal births) | 0 | 0 | Risk Ratio (M‐H, Random, 95% CI) | 0.0 [0.0, 0.0] |
| 32.1 DCC < 1 min and baby level with uterus | 0 | 0 | Risk Ratio (M‐H, Random, 95% CI) | 0.0 [0.0, 0.0] |
| 32.2 DCC < 1 min and baby held low | 0 | 0 | Risk Ratio (M‐H, Random, 95% CI) | 0.0 [0.0, 0.0] |
| 32.3 DCC 1‐2 mins and baby level with uterus | 0 | 0 | Risk Ratio (M‐H, Random, 95% CI) | 0.0 [0.0, 0.0] |
| 32.4 DCC 1‐2 mins and baby held low | 0 | 0 | Risk Ratio (M‐H, Random, 95% CI) | 0.0 [0.0, 0.0] |
| 32.5 DCC > 2 mins and baby level with uterus | 0 | 0 | Risk Ratio (M‐H, Random, 95% CI) | 0.0 [0.0, 0.0] |
| 32.6 DCC > 2 mins and baby held low | 0 | 0 | Risk Ratio (M‐H, Random, 95% CI) | 0.0 [0.0, 0.0] |
| 32.7 Mixed interventions or unclear | 0 | 0 | Risk Ratio (M‐H, Random, 95% CI) | 0.0 [0.0, 0.0] |
| 33 Blood transfusion for mother | 0 | 0 | Risk Ratio (M‐H, Random, 95% CI) | 0.0 [0.0, 0.0] |
| 33.1 DCC < 1 min and baby level with uterus | 0 | 0 | Risk Ratio (M‐H, Random, 95% CI) | 0.0 [0.0, 0.0] |
| 33.2 DCC < 1 min and baby held low | 0 | 0 | Risk Ratio (M‐H, Random, 95% CI) | 0.0 [0.0, 0.0] |
| 33.3 DCC 1‐2 mins and baby level with uterus | 0 | 0 | Risk Ratio (M‐H, Random, 95% CI) | 0.0 [0.0, 0.0] |
| 33.4 DCC 1‐2 mins and baby held low | 0 | 0 | Risk Ratio (M‐H, Random, 95% CI) | 0.0 [0.0, 0.0] |
| 33.5 DCC > 2 mins and baby level with uterus | 0 | 0 | Risk Ratio (M‐H, Random, 95% CI) | 0.0 [0.0, 0.0] |
| 33.6 DCC > 2 mins and baby held low | 0 | 0 | Risk Ratio (M‐H, Random, 95% CI) | 0.0 [0.0, 0.0] |
| 33.7 Mixed interventions or unclear | 0 | 0 | Risk Ratio (M‐H, Random, 95% CI) | 0.0 [0.0, 0.0] |
| 34 Postpartum infection in mother | 0 | 0 | Risk Ratio (M‐H, Random, 95% CI) | 0.0 [0.0, 0.0] |
| 34.1 DCC < 1 min and baby level with uterus | 0 | 0 | Risk Ratio (M‐H, Random, 95% CI) | 0.0 [0.0, 0.0] |
| 34.2 DCC < 1 min and baby held low | 0 | 0 | Risk Ratio (M‐H, Random, 95% CI) | 0.0 [0.0, 0.0] |
| 34.3 DCC 1‐2 mins and baby level with uterus | 0 | 0 | Risk Ratio (M‐H, Random, 95% CI) | 0.0 [0.0, 0.0] |
| 34.4 DCC 1‐2 mins and baby held low | 0 | 0 | Risk Ratio (M‐H, Random, 95% CI) | 0.0 [0.0, 0.0] |
| 34.5 DCC > 2 mins and baby level with uterus | 0 | 0 | Risk Ratio (M‐H, Random, 95% CI) | 0.0 [0.0, 0.0] |
| 34.6 DCC > 2 mins and baby held low | 0 | 0 | Risk Ratio (M‐H, Random, 95% CI) | 0.0 [0.0, 0.0] |
| 34.7 Mixed interventions or unclear | 0 | 0 | Risk Ratio (M‐H, Random, 95% CI) | 0.0 [0.0, 0.0] |
| 35 Rhesus isoimmunisation | 0 | 0 | Risk Ratio (M‐H, Random, 95% CI) | 0.0 [0.0, 0.0] |
| 35.1 DCC < 1 min and baby level with uterus | 0 | 0 | Risk Ratio (M‐H, Random, 95% CI) | 0.0 [0.0, 0.0] |
| 35.2 DCC < 1 min and baby held low | 0 | 0 | Risk Ratio (M‐H, Random, 95% CI) | 0.0 [0.0, 0.0] |
| 35.3 DCC 1‐2 mins and baby level with uterus | 0 | 0 | Risk Ratio (M‐H, Random, 95% CI) | 0.0 [0.0, 0.0] |
| 35.4 DCC 1‐2 mins and baby held low | 0 | 0 | Risk Ratio (M‐H, Random, 95% CI) | 0.0 [0.0, 0.0] |
| 35.5 DCC > 2 mins and baby level with uterus | 0 | 0 | Risk Ratio (M‐H, Random, 95% CI) | 0.0 [0.0, 0.0] |
| 35.6 DCC > 2 mins and baby held low | 0 | 0 | Risk Ratio (M‐H, Random, 95% CI) | 0.0 [0.0, 0.0] |
| 35.7 Mixed interventions or unclear | 0 | 0 | Risk Ratio (M‐H, Random, 95% CI) | 0.0 [0.0, 0.0] |
| 36 Psychological well being in mother | 0 | 0 | Mean Difference (IV, Random, 95% CI) | 0.0 [0.0, 0.0] |
| 36.1 DCC < 1 min and baby level with uterus | 0 | 0 | Mean Difference (IV, Random, 95% CI) | 0.0 [0.0, 0.0] |
| 36.2 DCC < 1 min and baby held low | 0 | 0 | Mean Difference (IV, Random, 95% CI) | 0.0 [0.0, 0.0] |
| 36.3 DCC 1‐2 mins and baby level with uterus | 0 | 0 | Mean Difference (IV, Random, 95% CI) | 0.0 [0.0, 0.0] |
| 36.4 DCC 1‐2 mins and baby held low | 0 | 0 | Mean Difference (IV, Random, 95% CI) | 0.0 [0.0, 0.0] |
| 36.5 DCC > 2 mins and baby level with uterus | 0 | 0 | Mean Difference (IV, Random, 95% CI) | 0.0 [0.0, 0.0] |
| 36.6 DCC > 2 mins and baby held low | 0 | 0 | Mean Difference (IV, Random, 95% CI) | 0.0 [0.0, 0.0] |
| 36.7 Mixed interventions or unclear | 0 | 0 | Mean Difference (IV, Random, 95% CI) | 0.0 [0.0, 0.0] |
| 37 Bonding | 0 | 0 | Mean Difference (IV, Random, 95% CI) | 0.0 [0.0, 0.0] |
| 37.1 DCC < 1 min and baby level with uterus | 0 | 0 | Mean Difference (IV, Random, 95% CI) | 0.0 [0.0, 0.0] |
| 37.2 DCC < 1 min and baby held low | 0 | 0 | Mean Difference (IV, Random, 95% CI) | 0.0 [0.0, 0.0] |
| 37.3 DCC 1‐2 mins and baby level with uterus | 0 | 0 | Mean Difference (IV, Random, 95% CI) | 0.0 [0.0, 0.0] |
| 37.4 DCC 1‐2 mins and baby held low | 0 | 0 | Mean Difference (IV, Random, 95% CI) | 0.0 [0.0, 0.0] |
| 37.5 DCC > 2 mins and baby level with uterus | 0 | 0 | Mean Difference (IV, Random, 95% CI) | 0.0 [0.0, 0.0] |
| 37.6 DCC > 2 mins and baby held low | 0 | 0 | Mean Difference (IV, Random, 95% CI) | 0.0 [0.0, 0.0] |
| 37.7 Mixed interventions or unclear | 0 | 0 | Mean Difference (IV, Random, 95% CI) | 0.0 [0.0, 0.0] |
| 38 Breastfeeding initiation | 0 | 0 | Risk Ratio (M‐H, Random, 95% CI) | 0.0 [0.0, 0.0] |
| 38.1 DCC < 1 min and baby level with uterus | 0 | 0 | Risk Ratio (M‐H, Random, 95% CI) | 0.0 [0.0, 0.0] |
| 38.2 DCC < 1 min and baby held low | 0 | 0 | Risk Ratio (M‐H, Random, 95% CI) | 0.0 [0.0, 0.0] |
| 38.3 DCC 1‐2 mins and baby level with uterus | 0 | 0 | Risk Ratio (M‐H, Random, 95% CI) | 0.0 [0.0, 0.0] |
| 38.4 DCC 1‐2 mins and baby held low | 0 | 0 | Risk Ratio (M‐H, Random, 95% CI) | 0.0 [0.0, 0.0] |
| 38.5 DCC > 2 mins and baby level with uterus | 0 | 0 | Risk Ratio (M‐H, Random, 95% CI) | 0.0 [0.0, 0.0] |
| 38.6 DCC > 2 mins and baby held low | 0 | 0 | Risk Ratio (M‐H, Random, 95% CI) | 0.0 [0.0, 0.0] |
| 38.7 Mixed interventions or unclear | 0 | 0 | Risk Ratio (M‐H, Random, 95% CI) | 0.0 [0.0, 0.0] |
| 39 Fully breastfed or mixed feeding at infant discharge | 0 | 0 | Risk Ratio (M‐H, Random, 95% CI) | 0.0 [0.0, 0.0] |
| 39.1 DCC < 1 min and baby level with uterus | 0 | 0 | Risk Ratio (M‐H, Random, 95% CI) | 0.0 [0.0, 0.0] |
| 39.2 DCC < 1 min and baby held low | 0 | 0 | Risk Ratio (M‐H, Random, 95% CI) | 0.0 [0.0, 0.0] |
| 39.3 DCC 1‐2 mins and baby level with uterus | 0 | 0 | Risk Ratio (M‐H, Random, 95% CI) | 0.0 [0.0, 0.0] |
| 39.4 DCC 1‐2 mins and baby held low | 0 | 0 | Risk Ratio (M‐H, Random, 95% CI) | 0.0 [0.0, 0.0] |
| 39.5 DCC > 2 mins and baby level with uterus | 0 | 0 | Risk Ratio (M‐H, Random, 95% CI) | 0.0 [0.0, 0.0] |
| 39.6 DCC > 2 mins and baby held low | 0 | 0 | Risk Ratio (M‐H, Random, 95% CI) | 0.0 [0.0, 0.0] |
| 39.7 Mixed interventions or unclear | 0 | 0 | Risk Ratio (M‐H, Random, 95% CI) | 0.0 [0.0, 0.0] |
| 40 Maternal anxiety | 0 | 0 | Risk Ratio (M‐H, Random, 95% CI) | 0.0 [0.0, 0.0] |
| 40.1 DCC < 1 min and baby level with uterus | 0 | 0 | Risk Ratio (M‐H, Random, 95% CI) | 0.0 [0.0, 0.0] |
| 40.2 DCC < 1 min and baby held low | 0 | 0 | Risk Ratio (M‐H, Random, 95% CI) | 0.0 [0.0, 0.0] |
| 40.3 DCC 1‐2 mins and baby level with uterus | 0 | 0 | Risk Ratio (M‐H, Random, 95% CI) | 0.0 [0.0, 0.0] |
| 40.4 DCC 1‐2 mins and baby held low | 0 | 0 | Risk Ratio (M‐H, Random, 95% CI) | 0.0 [0.0, 0.0] |
| 40.5 DCC > 2 mins and baby level with uterus | 0 | 0 | Risk Ratio (M‐H, Random, 95% CI) | 0.0 [0.0, 0.0] |
| 40.6 DCC > 2 mins and baby held low | 0 | 0 | Risk Ratio (M‐H, Random, 95% CI) | 0.0 [0.0, 0.0] |
| 40.7 Mixed interventions or unclear | 0 | 0 | Risk Ratio (M‐H, Random, 95% CI) | 0.0 [0.0, 0.0] |
| 41 Mothers' views | 0 | 0 | Mean Difference (IV, Random, 95% CI) | 0.0 [0.0, 0.0] |
| 41.1 DCC < 1 min and baby level with uterus | 0 | 0 | Mean Difference (IV, Random, 95% CI) | 0.0 [0.0, 0.0] |
| 41.2 DCC < 1 min and baby held low | 0 | 0 | Mean Difference (IV, Random, 95% CI) | 0.0 [0.0, 0.0] |
| 41.3 DCC 1‐2 mins and baby level with uterus | 0 | 0 | Mean Difference (IV, Random, 95% CI) | 0.0 [0.0, 0.0] |
| 41.4 DCC 1‐2 mins and baby held low | 0 | 0 | Mean Difference (IV, Random, 95% CI) | 0.0 [0.0, 0.0] |
| 41.5 DCC > 2 mins and baby level with uterus | 0 | 0 | Mean Difference (IV, Random, 95% CI) | 0.0 [0.0, 0.0] |
| 41.6 DCC > 2 mins and baby held low | 0 | 0 | Mean Difference (IV, Random, 95% CI) | 0.0 [0.0, 0.0] |
| 41.7 Mixed interventions or unclear | 0 | 0 | Mean Difference (IV, Random, 95% CI) | 0.0 [0.0, 0.0] |
| Outcome or subgroup title | No. of studies | No. of participants | Statistical method | Effect size |
| 1 Death of baby (up to discharge) Show forest plot | 9 | 931 | Risk Ratio (M‐H, Random, 95% CI) | 0.81 [0.47, 1.41] |
| 1.1 < 32‐34 weeks gestation | 8 | 731 | Risk Ratio (M‐H, Random, 95% CI) | 0.70 [0.38, 1.29] |
| 1.2 > 32‐34 weeks gestation | 1 | 200 | Risk Ratio (M‐H, Random, 95% CI) | 1.5 [0.44, 5.15] |
| 1.3 Mixed gestation | 0 | 0 | Risk Ratio (M‐H, Random, 95% CI) | 0.0 [0.0, 0.0] |
| 2 Death or neurodevelopmental impairment at age two to three years | 0 | 0 | Risk Ratio (M‐H, Random, 95% CI) | 0.0 [0.0, 0.0] |
| 2.1 < 32‐34 weeks gestation | 0 | 0 | Risk Ratio (M‐H, Random, 95% CI) | 0.0 [0.0, 0.0] |
| 2.2 > 32‐34 weeks gestation | 0 | 0 | Risk Ratio (M‐H, Random, 95% CI) | 0.0 [0.0, 0.0] |
| 2.3 Mixed gestation | 0 | 0 | Risk Ratio (M‐H, Random, 95% CI) | 0.0 [0.0, 0.0] |
| 3 Severe intraventricular haemorrhage (IVH grades 3, 4) Show forest plot | 6 | 618 | Risk Ratio (M‐H, Random, 95% CI) | 0.75 [0.39, 1.45] |
| 3.1 < 32‐34 weeks gestation | 6 | 618 | Risk Ratio (M‐H, Random, 95% CI) | 0.75 [0.39, 1.45] |
| 3.2 > 32‐34 weeks gestation | 0 | 0 | Risk Ratio (M‐H, Random, 95% CI) | 0.0 [0.0, 0.0] |
| 3.3 Mixed gestation | 0 | 0 | Risk Ratio (M‐H, Random, 95% CI) | 0.0 [0.0, 0.0] |
| 4 Intraventricular haemorrhage (IVH, all grades) Show forest plot | 8 | 716 | Risk Ratio (M‐H, Random, 95% CI) | 0.85 [0.62, 1.18] |
| 4.1 < 32‐34 weeks gestation | 8 | 716 | Risk Ratio (M‐H, Random, 95% CI) | 0.85 [0.62, 1.18] |
| 4.2 > 32‐34 weeks gestation | 0 | 0 | Risk Ratio (M‐H, Random, 95% CI) | 0.0 [0.0, 0.0] |
| 4.3 Mixed gestation | 0 | 0 | Risk Ratio (M‐H, Random, 95% CI) | 0.0 [0.0, 0.0] |
| 5 Periventricular leukomalacia (PVL) Show forest plot | 3 | 315 | Risk Ratio (M‐H, Random, 95% CI) | 0.63 [0.15, 2.63] |
| 5.1 < 32‐34 weeks gestation | 3 | 315 | Risk Ratio (M‐H, Random, 95% CI) | 0.63 [0.15, 2.63] |
| 5.2 > 32‐34 weeks gestation | 0 | 0 | Risk Ratio (M‐H, Random, 95% CI) | 0.0 [0.0, 0.0] |
| 5.3 Mixed gestation | 0 | 0 | Risk Ratio (M‐H, Random, 95% CI) | 0.0 [0.0, 0.0] |
| 6 Chronic lung disease (CLD) ‐ oxygen supplement at 36 weeks (corrected for gestation) Show forest plot | 7 | 682 | Risk Ratio (M‐H, Random, 95% CI) | 1.03 [0.64, 1.66] |
| 6.1 < 32‐34 weeks gestation | 7 | 682 | Risk Ratio (M‐H, Random, 95% CI) | 1.03 [0.64, 1.66] |
| 6.2 > 32‐34 weeks gestation | 0 | 0 | Risk Ratio (M‐H, Random, 95% CI) | 0.0 [0.0, 0.0] |
| 6.3 Mixed gestation | 0 | 0 | Risk Ratio (M‐H, Random, 95% CI) | 0.0 [0.0, 0.0] |
| 7 Maternal blood loss of 500 mL or greater Show forest plot | 1 | 200 | Risk Ratio (M‐H, Random, 95% CI) | 0.0 [0.0, 0.0] |
| 7.1 < 32‐34 weeks gestation | 1 | 200 | Risk Ratio (M‐H, Random, 95% CI) | 0.0 [0.0, 0.0] |
| 7.2 > 32‐34 weeks gestation | 0 | 0 | Risk Ratio (M‐H, Random, 95% CI) | 0.0 [0.0, 0.0] |
| 7.3 Mixed gestation | 0 | 0 | Risk Ratio (M‐H, Random, 95% CI) | 0.0 [0.0, 0.0] |
| 8 Intraventricular haemorrhage (IVH, grades 1 & 2) Show forest plot | 6 | 618 | Risk Ratio (M‐H, Random, 95% CI) | 0.74 [0.44, 1.25] |
| 8.1 < 32‐34 weeks gestation | 6 | 618 | Risk Ratio (M‐H, Random, 95% CI) | 0.74 [0.44, 1.25] |
| 8.2 > 32‐34 weeks gestation | 0 | 0 | Risk Ratio (M‐H, Random, 95% CI) | 0.0 [0.0, 0.0] |
| 8.3 Mixed gestation | 0 | 0 | Risk Ratio (M‐H, Random, 95% CI) | 0.0 [0.0, 0.0] |
| 9 Necrotising enterocolitis (NEC) confirmed by X‐ray or laparotomy) Show forest plot | 6 | 616 | Risk Ratio (M‐H, Random, 95% CI) | 0.75 [0.41, 1.38] |
| 9.1 < 32‐34 weeks gestation | 6 | 616 | Risk Ratio (M‐H, Random, 95% CI) | 0.75 [0.41, 1.38] |
| 9.2 > 32‐34 weeks gestation | 0 | 0 | Risk Ratio (M‐H, Random, 95% CI) | 0.0 [0.0, 0.0] |
| 9.3 Mixed gestation | 0 | 0 | Risk Ratio (M‐H, Random, 95% CI) | 0.0 [0.0, 0.0] |
| 10 Respiratory Distress Syndrome (RDS) Show forest plot | 4 | 515 | Risk Ratio (M‐H, Random, 95% CI) | 1.05 [0.83, 1.32] |
| 10.1 < 32‐34 weeks gestation | 3 | 315 | Risk Ratio (M‐H, Random, 95% CI) | 1.00 [0.95, 1.05] |
| 10.2 > 32‐34 weeks gestation | 1 | 200 | Risk Ratio (M‐H, Random, 95% CI) | 2.0 [0.71, 5.64] |
| 10.3 Mixed gestation | 0 | 0 | Risk Ratio (M‐H, Random, 95% CI) | 0.0 [0.0, 0.0] |
| 11 Respiratory support (ventilator or CPAP) Show forest plot | 2 | 129 | Risk Ratio (M‐H, Random, 95% CI) | 1.04 [0.74, 1.47] |
| 11.1 < 32‐34 weeks gestation | 2 | 129 | Risk Ratio (M‐H, Random, 95% CI) | 1.04 [0.74, 1.47] |
| 11.2 > 32‐34 weeks gestation | 0 | 0 | Risk Ratio (M‐H, Random, 95% CI) | 0.0 [0.0, 0.0] |
| 11.3 Mixed gestation | 0 | 0 | Risk Ratio (M‐H, Random, 95% CI) | 0.0 [0.0, 0.0] |
| 12 Duration of respiratory support (days) Show forest plot | 1 | 199 | Mean Difference (IV, Random, 95% CI) | 2.80 [‐9.78, 15.38] |
| 12.1 < 32‐34 weeks gestation | 1 | 199 | Mean Difference (IV, Random, 95% CI) | 2.80 [‐9.78, 15.38] |
| 12.2 > 32‐34 weeks gestation | 0 | 0 | Mean Difference (IV, Random, 95% CI) | 0.0 [0.0, 0.0] |
| 12.3 Mixed gestation | 0 | 0 | Mean Difference (IV, Random, 95% CI) | 0.0 [0.0, 0.0] |
| 13 Surfactant treatment (for severe RDS) Show forest plot | 5 | 433 | Risk Ratio (M‐H, Random, 95% CI) | 1.13 [0.81, 1.58] |
| 13.1 < 32‐34 weeks gestation | 5 | 433 | Risk Ratio (M‐H, Random, 95% CI) | 1.13 [0.81, 1.58] |
| 13.2 > 32‐34 weeks gestation | 0 | 0 | Risk Ratio (M‐H, Random, 95% CI) | 0.0 [0.0, 0.0] |
| 13.3 Mixed gestation | 0 | 0 | Risk Ratio (M‐H, Random, 95% CI) | 0.0 [0.0, 0.0] |
| 14 Treatment for Patent Ductus Arteriosus (PDA) (medical and/or surgical) Show forest plot | 5 | 411 | Risk Ratio (M‐H, Random, 95% CI) | 1.00 [0.73, 1.38] |
| 14.1 < 32‐34 weeks gestation | 5 | 411 | Risk Ratio (M‐H, Random, 95% CI) | 1.00 [0.73, 1.38] |
| 14.2 > 32‐34 weeks gestation | 0 | 0 | Risk Ratio (M‐H, Random, 95% CI) | 0.0 [0.0, 0.0] |
| 14.3 Mixed gestation | 0 | 0 | Risk Ratio (M‐H, Random, 95% CI) | 0.0 [0.0, 0.0] |
| 15 Treatment for Retinopathy of Prematurity (RoP) Show forest plot | 5 | 274 | Risk Ratio (M‐H, Random, 95% CI) | 0.95 [0.76, 1.19] |
| 15.1 < 32‐34 weeks gestation | 5 | 274 | Risk Ratio (M‐H, Random, 95% CI) | 0.95 [0.76, 1.19] |
| 15.2 > 32‐34 weeks gestation | 0 | 0 | Risk Ratio (M‐H, Random, 95% CI) | 0.0 [0.0, 0.0] |
| 15.3 Mixed gestation | 0 | 0 | Risk Ratio (M‐H, Random, 95% CI) | 0.0 [0.0, 0.0] |
| 16 Hyperbilirubinemia (treated by phototherapy) Show forest plot | 3 | 475 | Risk Ratio (M‐H, Random, 95% CI) | 1.39 [0.73, 2.63] |
| 16.1 < 32‐34 weeks gestation | 2 | 275 | Risk Ratio (M‐H, Random, 95% CI) | 0.95 [0.86, 1.06] |
| 16.2 > 32‐34 weeks gestation | 1 | 200 | Risk Ratio (M‐H, Random, 95% CI) | 3.67 [1.85, 7.26] |
| 16.3 Mixed gestation | 0 | 0 | Risk Ratio (M‐H, Random, 95% CI) | 0.0 [0.0, 0.0] |
| 17 Inotropics for low blood pressure Show forest plot | 3 | 300 | Risk Ratio (M‐H, Random, 95% CI) | 0.61 [0.36, 1.04] |
| 17.1 < 32‐34 weeks gestation | 3 | 300 | Risk Ratio (M‐H, Random, 95% CI) | 0.61 [0.36, 1.04] |
| 17.2 > 32‐34 weeks gestation | 0 | 0 | Risk Ratio (M‐H, Random, 95% CI) | 0.0 [0.0, 0.0] |
| 17.3 Mixed gestation | 0 | 0 | Risk Ratio (M‐H, Random, 95% CI) | 0.0 [0.0, 0.0] |
| 18 Low Apgar as defined by trialists (generally < 8 at 5 mins) Show forest plot | 2 | 398 | Risk Ratio (M‐H, Random, 95% CI) | 1.03 [0.67, 1.60] |
| 18.1 < 32‐34 weeks gestation | 2 | 398 | Risk Ratio (M‐H, Random, 95% CI) | 1.03 [0.67, 1.60] |
| 18.2 > 32‐34 weeks gestation | 0 | 0 | Risk Ratio (M‐H, Random, 95% CI) | 0.0 [0.0, 0.0] |
| 18.3 Mixed gestation | 0 | 0 | Risk Ratio (M‐H, Random, 95% CI) | 0.0 [0.0, 0.0] |
| 19 Blood transfusion in infant Show forest plot | 6 | 567 | Risk Ratio (M‐H, Random, 95% CI) | 0.71 [0.57, 0.89] |
| 19.1 < 32‐34 weeks gestation | 6 | 567 | Risk Ratio (M‐H, Random, 95% CI) | 0.71 [0.57, 0.89] |
| 19.2 > 32‐34 weeks gestation | 0 | 0 | Risk Ratio (M‐H, Random, 95% CI) | 0.0 [0.0, 0.0] |
| 19.3 Mixed gestation | 0 | 0 | Risk Ratio (M‐H, Random, 95% CI) | 0.0 [0.0, 0.0] |
| 20 Volume of blood transfused (mL) Show forest plot | 1 | 199 | Mean Difference (IV, Random, 95% CI) | ‐19.0 [‐39.61, 1.61] |
| 20.1 < 32‐34 weeks gestation | 1 | 199 | Mean Difference (IV, Random, 95% CI) | ‐19.0 [‐39.61, 1.61] |
| 20.2 > 32‐34 weeks gestation | 0 | 0 | Mean Difference (IV, Random, 95% CI) | 0.0 [0.0, 0.0] |
| 20.3 Mixed gestation | 0 | 0 | Mean Difference (IV, Random, 95% CI) | 0.0 [0.0, 0.0] |
| 21 Late sepsis (after 3 days or as defined by trialists) Show forest plot | 4 | 385 | Risk Ratio (M‐H, Random, 95% CI) | 0.87 [0.64, 1.19] |
| 21.1 < 32‐34 weeks gestation | 4 | 385 | Risk Ratio (M‐H, Random, 95% CI) | 0.87 [0.64, 1.19] |
| 21.2 > 32‐34 weeks gestation | 0 | 0 | Risk Ratio (M‐H, Random, 95% CI) | 0.0 [0.0, 0.0] |
| 21.3 Mixed gestation | 0 | 0 | Risk Ratio (M‐H, Random, 95% CI) | 0.0 [0.0, 0.0] |
| 22 Hydrocephalus | 0 | 0 | Risk Ratio (M‐H, Random, 95% CI) | 0.0 [0.0, 0.0] |
| 22.1 < 32‐34 weeks gestation | 0 | 0 | Risk Ratio (M‐H, Random, 95% CI) | 0.0 [0.0, 0.0] |
| 22.2 > 32‐34 weeks gestation | 0 | 0 | Risk Ratio (M‐H, Random, 95% CI) | 0.0 [0.0, 0.0] |
| 22.3 Mixed gestation | 0 | 0 | Risk Ratio (M‐H, Random, 95% CI) | 0.0 [0.0, 0.0] |
| 23 Temperature < 36.0oC within 1 hour of birth | 0 | 0 | Risk Ratio (M‐H, Random, 95% CI) | 0.0 [0.0, 0.0] |
| 23.1 < 32‐34 weeks gestation | 0 | 0 | Risk Ratio (M‐H, Random, 95% CI) | 0.0 [0.0, 0.0] |
| 23.2 > 32‐34 weeks gestation | 0 | 0 | Risk Ratio (M‐H, Random, 95% CI) | 0.0 [0.0, 0.0] |
| 23.3 Mixed gestation | 0 | 0 | Risk Ratio (M‐H, Random, 95% CI) | 0.0 [0.0, 0.0] |
| 24 Hb within 1st 24 hour of birth (g/dL) Show forest plot | 7 | 905 | Mean Difference (IV, Random, 95% CI) | 0.84 [0.54, 1.14] |
| 24.1 < 32‐34 weeks gestation | 6 | 705 | Mean Difference (IV, Random, 95% CI) | 0.87 [0.54, 1.20] |
| 24.2 > 32‐34 weeks gestation | 1 | 200 | Mean Difference (IV, Random, 95% CI) | 0.70 [0.00, 1.40] |
| 24.3 Mixed gestation | 0 | 0 | Mean Difference (IV, Random, 95% CI) | 0.0 [0.0, 0.0] |
| 25 Mean arterial blood pressure Show forest plot | 2 | 408 | Mean Difference (IV, Random, 95% CI) | 0.38 [‐1.33, 2.09] |
| 25.1 < 32‐34 weeks gestation | 1 | 208 | Mean Difference (IV, Random, 95% CI) | 0.0 [‐2.17, 2.17] |
| 25.2 > 32‐34 weeks gestation | 1 | 200 | Mean Difference (IV, Random, 95% CI) | 1.0 [‐1.76, 3.76] |
| 25.3 Mixed gestation | 0 | 0 | Mean Difference (IV, Random, 95% CI) | 0.0 [0.0, 0.0] |
| 26 Length of infant stay in NICU (in weeks) Show forest plot | 1 | 199 | Mean Difference (IV, Random, 95% CI) | 5.30 [‐5.49, 16.09] |
| 26.1 < 32‐34 weeks gestation | 1 | 199 | Mean Difference (IV, Random, 95% CI) | 5.30 [‐5.49, 16.09] |
| 26.2 > 32‐34 weeks gestation | 0 | 0 | Mean Difference (IV, Random, 95% CI) | 0.0 [0.0, 0.0] |
| 26.3 Mixed gestation | 0 | 0 | Mean Difference (IV, Random, 95% CI) | 0.0 [0.0, 0.0] |
| 27 Home oxygen Show forest plot | 1 | 199 | Risk Ratio (M‐H, Random, 95% CI) | 0.89 [0.38, 2.10] |
| 27.1 < 32‐34 weeks gestation | 1 | 199 | Risk Ratio (M‐H, Random, 95% CI) | 0.89 [0.38, 2.10] |
| 27.2 > 32‐34 weeks gestation | 0 | 0 | Risk Ratio (M‐H, Random, 95% CI) | 0.0 [0.0, 0.0] |
| 27.3 Mixed gestation | 0 | 0 | Risk Ratio (M‐H, Random, 95% CI) | 0.0 [0.0, 0.0] |
| 28 Neurodevelopmental impairment at age two to three years Show forest plot | 2 | 187 | Risk Ratio (M‐H, Random, 95% CI) | 1.25 [0.49, 3.17] |
| 28.1 < 32‐34 weeks gestation | 2 | 187 | Risk Ratio (M‐H, Random, 95% CI) | 1.25 [0.49, 3.17] |
| 28.2 > 32‐34 weeks gestation | 0 | 0 | Risk Ratio (M‐H, Random, 95% CI) | 0.0 [0.0, 0.0] |
| 28.3 Mixed gestation | 0 | 0 | Risk Ratio (M‐H, Random, 95% CI) | 0.0 [0.0, 0.0] |
| 29 Severe visual impairment Show forest plot | 1 | 125 | Risk Ratio (M‐H, Random, 95% CI) | 0.0 [0.0, 0.0] |
| 29.1 < 32‐34 weeks gestation | 1 | 125 | Risk Ratio (M‐H, Random, 95% CI) | 0.0 [0.0, 0.0] |
| 29.2 > 32‐34 weeks gestation | 0 | 0 | Risk Ratio (M‐H, Random, 95% CI) | 0.0 [0.0, 0.0] |
| 29.3 Mixed gestation | 0 | 0 | Risk Ratio (M‐H, Random, 95% CI) | 0.0 [0.0, 0.0] |
| 30 Cerebral palsy (CP) Show forest plot | 2 | 286 | Risk Ratio (M‐H, Random, 95% CI) | 0.70 [0.05, 10.63] |
| 30.1 < 32‐34 weeks gestation | 2 | 286 | Risk Ratio (M‐H, Random, 95% CI) | 0.70 [0.05, 10.63] |
| 30.2 > 32‐34 weeks gestation | 0 | 0 | Risk Ratio (M‐H, Random, 95% CI) | 0.0 [0.0, 0.0] |
| 30.3 Mixed gestation | 0 | 0 | Risk Ratio (M‐H, Random, 95% CI) | 0.0 [0.0, 0.0] |
| 31 Manual removal of placenta (denominator = vaginal births) | 0 | 0 | Risk Ratio (M‐H, Random, 95% CI) | 0.0 [0.0, 0.0] |
| 31.1 < 32‐34 weeks gestation | 0 | 0 | Risk Ratio (M‐H, Random, 95% CI) | 0.0 [0.0, 0.0] |
| 31.2 > 32‐34 weeks gestation | 0 | 0 | Risk Ratio (M‐H, Random, 95% CI) | 0.0 [0.0, 0.0] |
| 31.3 Mixed gestation | 0 | 0 | Risk Ratio (M‐H, Random, 95% CI) | 0.0 [0.0, 0.0] |
| 32 Prolonged third stage (> 30 minutes) (denominator = vaginal births) | 0 | 0 | Risk Ratio (M‐H, Random, 95% CI) | 0.0 [0.0, 0.0] |
| 32.1 < 32‐34 weeks gestation | 0 | 0 | Risk Ratio (M‐H, Random, 95% CI) | 0.0 [0.0, 0.0] |
| 32.2 > 32‐34 weeks gestation | 0 | 0 | Risk Ratio (M‐H, Random, 95% CI) | 0.0 [0.0, 0.0] |
| 32.3 Mixed gestation | 0 | 0 | Risk Ratio (M‐H, Random, 95% CI) | 0.0 [0.0, 0.0] |
| 33 Blood transfusion for mother | 0 | 0 | Risk Ratio (M‐H, Random, 95% CI) | 0.0 [0.0, 0.0] |
| 33.1 < 32‐34 weeks gestation | 0 | 0 | Risk Ratio (M‐H, Random, 95% CI) | 0.0 [0.0, 0.0] |
| 33.2 > 32‐34 weeks gestation | 0 | 0 | Risk Ratio (M‐H, Random, 95% CI) | 0.0 [0.0, 0.0] |
| 33.3 Mixed gestation | 0 | 0 | Risk Ratio (M‐H, Random, 95% CI) | 0.0 [0.0, 0.0] |
| 34 Postpartum infection in mother | 0 | 0 | Risk Ratio (M‐H, Random, 95% CI) | 0.0 [0.0, 0.0] |
| 34.1 < 32‐34 weeks gestation | 0 | 0 | Risk Ratio (M‐H, Random, 95% CI) | 0.0 [0.0, 0.0] |
| 34.2 > 32‐34 weeks gestation | 0 | 0 | Risk Ratio (M‐H, Random, 95% CI) | 0.0 [0.0, 0.0] |
| 34.3 Mixed gestation | 0 | 0 | Risk Ratio (M‐H, Random, 95% CI) | 0.0 [0.0, 0.0] |
| 35 Rhesus isoimmunisation | 0 | 0 | Risk Ratio (M‐H, Random, 95% CI) | 0.0 [0.0, 0.0] |
| 35.1 < 32‐34 weeks gestation | 0 | 0 | Risk Ratio (M‐H, Random, 95% CI) | 0.0 [0.0, 0.0] |
| 35.2 > 32‐34 weeks gestation | 0 | 0 | Risk Ratio (M‐H, Random, 95% CI) | 0.0 [0.0, 0.0] |
| 35.3 Mixed gestation | 0 | 0 | Risk Ratio (M‐H, Random, 95% CI) | 0.0 [0.0, 0.0] |
| 36 Psychological well being in mother | 0 | 0 | Std. Mean Difference (IV, Random, 95% CI) | 0.0 [0.0, 0.0] |
| 36.1 < 32‐34 weeks gestation | 0 | 0 | Std. Mean Difference (IV, Random, 95% CI) | 0.0 [0.0, 0.0] |
| 36.2 > 32‐34 weeks gestation | 0 | 0 | Std. Mean Difference (IV, Random, 95% CI) | 0.0 [0.0, 0.0] |
| 36.3 Mixed gestation | 0 | 0 | Std. Mean Difference (IV, Random, 95% CI) | 0.0 [0.0, 0.0] |
| 37 Bonding | 0 | 0 | Std. Mean Difference (IV, Random, 95% CI) | 0.0 [0.0, 0.0] |
| 37.1 < 32‐34 weeks gestation | 0 | 0 | Std. Mean Difference (IV, Random, 95% CI) | 0.0 [0.0, 0.0] |
| 37.2 > 32‐34 weeks gestation | 0 | 0 | Std. Mean Difference (IV, Random, 95% CI) | 0.0 [0.0, 0.0] |
| 37.3 Mixed gestation | 0 | 0 | Std. Mean Difference (IV, Random, 95% CI) | 0.0 [0.0, 0.0] |
| 38 Breastfeeding initiation | 0 | 0 | Risk Ratio (M‐H, Random, 95% CI) | 0.0 [0.0, 0.0] |
| 38.1 < 32‐34 weeks gestation | 0 | 0 | Risk Ratio (M‐H, Random, 95% CI) | 0.0 [0.0, 0.0] |
| 38.2 > 32‐34 weeks gestation | 0 | 0 | Risk Ratio (M‐H, Random, 95% CI) | 0.0 [0.0, 0.0] |
| 38.3 Mixed gestation | 0 | 0 | Risk Ratio (M‐H, Random, 95% CI) | 0.0 [0.0, 0.0] |
| 39 Fully breastfed or mixed feeding at infant discharge | 0 | 0 | Risk Ratio (M‐H, Random, 95% CI) | 0.0 [0.0, 0.0] |
| 39.1 < 32‐34 weeks gestation | 0 | 0 | Risk Ratio (M‐H, Random, 95% CI) | 0.0 [0.0, 0.0] |
| 39.2 > 32‐34 weeks gestation | 0 | 0 | Risk Ratio (M‐H, Random, 95% CI) | 0.0 [0.0, 0.0] |
| 39.3 Mixed gestation | 0 | 0 | Risk Ratio (M‐H, Random, 95% CI) | 0.0 [0.0, 0.0] |
| 40 Maternal anxiety | 0 | 0 | Risk Ratio (M‐H, Random, 95% CI) | 0.0 [0.0, 0.0] |
| 40.1 < 32‐34 weeks gestation | 0 | 0 | Risk Ratio (M‐H, Random, 95% CI) | 0.0 [0.0, 0.0] |
| 40.2 > 32‐34 weeks gestation | 0 | 0 | Risk Ratio (M‐H, Random, 95% CI) | 0.0 [0.0, 0.0] |
| 40.3 Mixed gestation | 0 | 0 | Risk Ratio (M‐H, Random, 95% CI) | 0.0 [0.0, 0.0] |
| 41 Mothers' views | 0 | 0 | Std. Mean Difference (IV, Random, 95% CI) | 0.0 [0.0, 0.0] |
| 41.1 < 32‐34 weeks gestation | 0 | 0 | Std. Mean Difference (IV, Random, 95% CI) | 0.0 [0.0, 0.0] |
| 41.2 > 32‐34 weeks gestation | 0 | 0 | Std. Mean Difference (IV, Random, 95% CI) | 0.0 [0.0, 0.0] |
| 41.3 Mixed gestation | 0 | 0 | Std. Mean Difference (IV, Random, 95% CI) | 0.0 [0.0, 0.0] |
| Outcome or subgroup title | No. of studies | No. of participants | Statistical method | Effect size |
| 1 Death of baby (up to discharge) Show forest plot | 9 | 931 | Risk Ratio (M‐H, Random, 95% CI) | 0.81 [0.47, 1.41] |
| 1.1 UCM with cord intact | 7 | 705 | Risk Ratio (M‐H, Random, 95% CI) | 0.72 [0.38, 1.34] |
| 1.2 UCM with cord cut | 1 | 200 | Risk Ratio (M‐H, Random, 95% CI) | 1.5 [0.44, 5.15] |
| 1.3 Unclear | 1 | 26 | Risk Ratio (M‐H, Random, 95% CI) | 0.33 [0.01, 7.50] |
| 2 Death or neurodevelopmental impairment at age two to three years | 0 | 0 | Risk Ratio (M‐H, Random, 95% CI) | 0.0 [0.0, 0.0] |
| 2.1 UCM with cord intact | 0 | 0 | Risk Ratio (M‐H, Random, 95% CI) | 0.0 [0.0, 0.0] |
| 2.2 UCM with cord cut | 0 | 0 | Risk Ratio (M‐H, Random, 95% CI) | 0.0 [0.0, 0.0] |
| 2.3 Unclear | 0 | 0 | Risk Ratio (M‐H, Random, 95% CI) | 0.0 [0.0, 0.0] |
| 3 Severe intraventricular haemorrhage (IVH grades 3, 4) Show forest plot | 6 | 618 | Risk Ratio (M‐H, Random, 95% CI) | 0.75 [0.39, 1.45] |
| 3.1 UCM with cord intact | 6 | 618 | Risk Ratio (M‐H, Random, 95% CI) | 0.75 [0.39, 1.45] |
| 3.2 UCM with cord cut | 0 | 0 | Risk Ratio (M‐H, Random, 95% CI) | 0.0 [0.0, 0.0] |
| 3.3 Unclear | 0 | 0 | Risk Ratio (M‐H, Random, 95% CI) | 0.0 [0.0, 0.0] |
| 4 Intraventricular haemorrhage (IVH, all grades) Show forest plot | 8 | 716 | Risk Ratio (M‐H, Random, 95% CI) | 0.85 [0.62, 1.18] |
| 4.1 UCM with cord intact | 7 | 691 | Risk Ratio (M‐H, Random, 95% CI) | 0.84 [0.58, 1.21] |
| 4.2 UCM with cord cut | 0 | 0 | Risk Ratio (M‐H, Random, 95% CI) | 0.0 [0.0, 0.0] |
| 4.3 Unclear | 1 | 25 | Risk Ratio (M‐H, Random, 95% CI) | 0.92 [0.35, 2.41] |
| 5 Periventricular leukomalacia (PVL) Show forest plot | 3 | 315 | Risk Ratio (M‐H, Random, 95% CI) | 0.63 [0.15, 2.63] |
| 5.1 UCM with cord intact | 3 | 315 | Risk Ratio (M‐H, Random, 95% CI) | 0.63 [0.15, 2.63] |
| 5.2 UCM with cord cut | 0 | 0 | Risk Ratio (M‐H, Random, 95% CI) | 0.0 [0.0, 0.0] |
| 5.3 Unclear | 0 | 0 | Risk Ratio (M‐H, Random, 95% CI) | 0.0 [0.0, 0.0] |
| 6 Chronic lung disease (CLD) ‐ oxygen supplement at 36 weeks (corrected for gestation) Show forest plot | 7 | 682 | Risk Ratio (M‐H, Random, 95% CI) | 1.03 [0.64, 1.66] |
| 6.1 UCM with cord intact | 7 | 682 | Risk Ratio (M‐H, Random, 95% CI) | 1.03 [0.64, 1.66] |
| 6.2 UCM with cord cut | 0 | 0 | Risk Ratio (M‐H, Random, 95% CI) | 0.0 [0.0, 0.0] |
| 6.3 Unclear | 0 | 0 | Risk Ratio (M‐H, Random, 95% CI) | 0.0 [0.0, 0.0] |
| 7 Maternal blood loss of 500 mL or greater Show forest plot | 1 | 200 | Risk Ratio (M‐H, Random, 95% CI) | 0.0 [0.0, 0.0] |
| 7.1 UCM with cord intact | 1 | 200 | Risk Ratio (M‐H, Random, 95% CI) | 0.0 [0.0, 0.0] |
| 7.2 UCM with cord cut | 0 | 0 | Risk Ratio (M‐H, Random, 95% CI) | 0.0 [0.0, 0.0] |
| 7.3 Unclear | 0 | 0 | Risk Ratio (M‐H, Random, 95% CI) | 0.0 [0.0, 0.0] |
| 8 Intraventricular haemorrhage (IVH, grades 1 & 2) Show forest plot | 6 | 618 | Risk Ratio (M‐H, Random, 95% CI) | 0.74 [0.44, 1.25] |
| 8.1 UCM with cord intact | 6 | 618 | Risk Ratio (M‐H, Random, 95% CI) | 0.74 [0.44, 1.25] |
| 8.2 UCM with cord cut | 0 | 0 | Risk Ratio (M‐H, Random, 95% CI) | 0.0 [0.0, 0.0] |
| 8.3 Unclear | 0 | 0 | Risk Ratio (M‐H, Random, 95% CI) | 0.0 [0.0, 0.0] |
| 9 Necrotising enterocolitis (NEC) confirmed by X‐ray or laparotomy) Show forest plot | 6 | 616 | Risk Ratio (M‐H, Random, 95% CI) | 0.75 [0.41, 1.38] |
| 9.1 UCM with cord intact | 5 | 591 | Risk Ratio (M‐H, Random, 95% CI) | 0.75 [0.41, 1.38] |
| 9.2 UCM with cord cut | 0 | 0 | Risk Ratio (M‐H, Random, 95% CI) | 0.0 [0.0, 0.0] |
| 9.3 Unclear | 1 | 25 | Risk Ratio (M‐H, Random, 95% CI) | 0.0 [0.0, 0.0] |
| 10 Respiratory Distress Syndrome (RDS) Show forest plot | 4 | 515 | Risk Ratio (M‐H, Random, 95% CI) | 1.05 [0.83, 1.32] |
| 10.1 UCM with cord intact | 3 | 315 | Risk Ratio (M‐H, Random, 95% CI) | 1.00 [0.95, 1.05] |
| 10.2 UCM with cord cut | 1 | 200 | Risk Ratio (M‐H, Random, 95% CI) | 2.0 [0.71, 5.64] |
| 10.3 Unclear | 0 | 0 | Risk Ratio (M‐H, Random, 95% CI) | 0.0 [0.0, 0.0] |
| 11 Respiratory support (ventilator or CPAP) Show forest plot | 2 | 129 | Risk Ratio (M‐H, Random, 95% CI) | 1.04 [0.74, 1.47] |
| 11.1 UCM with cord intact | 2 | 129 | Risk Ratio (M‐H, Random, 95% CI) | 1.04 [0.74, 1.47] |
| 11.2 UCM with cord cut | 0 | 0 | Risk Ratio (M‐H, Random, 95% CI) | 0.0 [0.0, 0.0] |
| 11.3 Unclear | 0 | 0 | Risk Ratio (M‐H, Random, 95% CI) | 0.0 [0.0, 0.0] |
| 12 Duration of respiratory support (days) Show forest plot | 1 | 199 | Mean Difference (IV, Random, 95% CI) | 2.80 [‐9.78, 15.38] |
| 12.1 UCM with cord intact | 1 | 199 | Mean Difference (IV, Random, 95% CI) | 2.80 [‐9.78, 15.38] |
| 12.2 UCM with cord cut | 0 | 0 | Mean Difference (IV, Random, 95% CI) | 0.0 [0.0, 0.0] |
| 12.3 Unclear | 0 | 0 | Mean Difference (IV, Random, 95% CI) | 0.0 [0.0, 0.0] |
| 13 Surfactant treatment (for severe RDS) Show forest plot | 5 | 433 | Risk Ratio (M‐H, Random, 95% CI) | 1.13 [0.81, 1.58] |
| 13.1 UCM with cord intact | 5 | 433 | Risk Ratio (M‐H, Random, 95% CI) | 1.13 [0.81, 1.58] |
| 13.2 UCM with cord cut | 0 | 0 | Risk Ratio (M‐H, Random, 95% CI) | 0.0 [0.0, 0.0] |
| 13.3 Unclear | 0 | 0 | Risk Ratio (M‐H, Random, 95% CI) | 0.0 [0.0, 0.0] |
| 14 Treatment for Patent Ductus Arteriosus (PDA) (medical and/or surgical) Show forest plot | 5 | 411 | Risk Ratio (M‐H, Random, 95% CI) | 1.00 [0.73, 1.38] |
| 14.1 UCM with cord intact | 5 | 411 | Risk Ratio (M‐H, Random, 95% CI) | 1.00 [0.73, 1.38] |
| 14.2 UCM with cord cut | 0 | 0 | Risk Ratio (M‐H, Random, 95% CI) | 0.0 [0.0, 0.0] |
| 14.3 Unclear | 0 | 0 | Risk Ratio (M‐H, Random, 95% CI) | 0.0 [0.0, 0.0] |
| 15 Treatment for Retinopathy of Prematurity (RoP) Show forest plot | 5 | 274 | Risk Ratio (M‐H, Random, 95% CI) | 0.95 [0.76, 1.19] |
| 15.1 UCM with cord intact | 5 | 274 | Risk Ratio (M‐H, Random, 95% CI) | 0.95 [0.76, 1.19] |
| 15.2 UCM with cord cut | 0 | 0 | Risk Ratio (M‐H, Random, 95% CI) | 0.0 [0.0, 0.0] |
| 15.3 Unclear | 0 | 0 | Risk Ratio (M‐H, Random, 95% CI) | 0.0 [0.0, 0.0] |
| 16 Hyperbilirubinemia (treated by phototherapy) Show forest plot | 3 | 475 | Risk Ratio (M‐H, Random, 95% CI) | 1.39 [0.73, 2.63] |
| 16.1 UCM with cord intact | 2 | 275 | Risk Ratio (M‐H, Random, 95% CI) | 0.95 [0.86, 1.06] |
| 16.2 UCM with cord cut | 1 | 200 | Risk Ratio (M‐H, Random, 95% CI) | 3.67 [1.85, 7.26] |
| 16.3 Unclear | 0 | 0 | Risk Ratio (M‐H, Random, 95% CI) | 0.0 [0.0, 0.0] |
| 17 Inotropics for low blood pressure Show forest plot | 3 | 280 | Risk Ratio (M‐H, Random, 95% CI) | 0.63 [0.36, 1.09] |
| 17.1 UCM with cord intact | 3 | 280 | Risk Ratio (M‐H, Random, 95% CI) | 0.63 [0.36, 1.09] |
| 17.2 UCM with cord cut | 0 | 0 | Risk Ratio (M‐H, Random, 95% CI) | 0.0 [0.0, 0.0] |
| 17.3 Unclear | 0 | 0 | Risk Ratio (M‐H, Random, 95% CI) | 0.0 [0.0, 0.0] |
| 18 Low Apgar as defined by trialists (generally < 8 at 5 mins) Show forest plot | 2 | 398 | Risk Ratio (M‐H, Random, 95% CI) | 1.03 [0.67, 1.60] |
| 18.1 UCM with cord intact | 2 | 398 | Risk Ratio (M‐H, Random, 95% CI) | 1.03 [0.67, 1.60] |
| 18.2 UCM with cord cut | 0 | 0 | Risk Ratio (M‐H, Random, 95% CI) | 0.0 [0.0, 0.0] |
| 18.3 Unclear | 0 | 0 | Risk Ratio (M‐H, Random, 95% CI) | 0.0 [0.0, 0.0] |
| 19 Blood transfusion in infant (mL) Show forest plot | 6 | 567 | Risk Ratio (M‐H, Random, 95% CI) | 0.67 [0.54, 0.84] |
| 19.1 UCM with cord intact | 5 | 413 | Risk Ratio (M‐H, Random, 95% CI) | 0.69 [0.51, 0.93] |
| 19.2 UCM with cord cut | 1 | 154 | Risk Ratio (M‐H, Random, 95% CI) | 0.62 [0.43, 0.90] |
| 19.3 Unclear | 0 | 0 | Risk Ratio (M‐H, Random, 95% CI) | 0.0 [0.0, 0.0] |
| 20 Volume of blood transfused Show forest plot | 1 | 199 | Mean Difference (IV, Random, 95% CI) | ‐19.0 [‐39.61, 1.61] |
| 20.1 UCM with cord intact | 1 | 199 | Mean Difference (IV, Random, 95% CI) | ‐19.0 [‐39.61, 1.61] |
| 20.2 UCM with cord cut | 0 | 0 | Mean Difference (IV, Random, 95% CI) | 0.0 [0.0, 0.0] |
| 20.3 Unclear | 0 | 0 | Mean Difference (IV, Random, 95% CI) | 0.0 [0.0, 0.0] |
| 21 Late sepsis (after 3 days or as defined by trialists) Show forest plot | 4 | 385 | Risk Ratio (M‐H, Random, 95% CI) | 0.87 [0.64, 1.19] |
| 21.1 UCM with cord intact | 4 | 385 | Risk Ratio (M‐H, Random, 95% CI) | 0.87 [0.64, 1.19] |
| 21.2 UCM with cord cut | 0 | 0 | Risk Ratio (M‐H, Random, 95% CI) | 0.0 [0.0, 0.0] |
| 21.3 Unclear | 0 | 0 | Risk Ratio (M‐H, Random, 95% CI) | 0.0 [0.0, 0.0] |
| 22 Hydrocephalus | 0 | 0 | Risk Ratio (M‐H, Random, 95% CI) | 0.0 [0.0, 0.0] |
| 22.1 UCM with cord intact | 0 | 0 | Risk Ratio (M‐H, Random, 95% CI) | 0.0 [0.0, 0.0] |
| 22.2 UCM with cord cut | 0 | 0 | Risk Ratio (M‐H, Random, 95% CI) | 0.0 [0.0, 0.0] |
| 22.3 Unclear | 0 | 0 | Risk Ratio (M‐H, Random, 95% CI) | 0.0 [0.0, 0.0] |
| 23 Temperature < 36.0oC within 1 hour of birth | 0 | 0 | Risk Ratio (M‐H, Random, 95% CI) | 0.0 [0.0, 0.0] |
| 23.1 UCM with cord intact | 0 | 0 | Risk Ratio (M‐H, Random, 95% CI) | 0.0 [0.0, 0.0] |
| 23.2 UCM with cord cut | 0 | 0 | Risk Ratio (M‐H, Random, 95% CI) | 0.0 [0.0, 0.0] |
| 23.3 Unclear | 0 | 0 | Risk Ratio (M‐H, Random, 95% CI) | 0.0 [0.0, 0.0] |
| 24 Hb within 1st 24 hour of birth (g/dL) Show forest plot | 7 | 905 | Mean Difference (IV, Random, 95% CI) | 0.84 [0.54, 1.14] |
| 24.1 UCM with cord intact | 4 | 526 | Mean Difference (IV, Random, 95% CI) | 0.76 [0.36, 1.16] |
| 24.2 UCM with cord cut | 2 | 354 | Mean Difference (IV, Random, 95% CI) | 0.97 [0.48, 1.46] |
| 24.3 Unclear | 1 | 25 | Mean Difference (IV, Random, 95% CI) | 0.5 [‐1.33, 2.33] |
| 25 Mean arterial blood pressure (subgrouped by time after birth) Show forest plot | 2 | 408 | Mean Difference (IV, Random, 95% CI) | 0.38 [‐1.33, 2.09] |
| 25.1 UCM with cord intact | 1 | 208 | Mean Difference (IV, Random, 95% CI) | 0.0 [‐2.17, 2.17] |
| 25.2 UCM with cord cut | 1 | 200 | Mean Difference (IV, Random, 95% CI) | 1.0 [‐1.76, 3.76] |
| 25.3 Unclear | 0 | 0 | Mean Difference (IV, Random, 95% CI) | 0.0 [0.0, 0.0] |
| 26 Length of infant stay in NICU Show forest plot | 1 | 199 | Mean Difference (IV, Random, 95% CI) | 5.30 [‐5.49, 16.09] |
| 26.1 UCM with cord intact | 1 | 199 | Mean Difference (IV, Random, 95% CI) | 5.30 [‐5.49, 16.09] |
| 26.2 UCM with cord cut | 0 | 0 | Mean Difference (IV, Random, 95% CI) | 0.0 [0.0, 0.0] |
| 26.3 Unclear | 0 | 0 | Mean Difference (IV, Random, 95% CI) | 0.0 [0.0, 0.0] |
| 27 Home oxygen Show forest plot | 1 | 199 | Risk Ratio (M‐H, Random, 95% CI) | 0.89 [0.38, 2.10] |
| 27.1 UCM with cord intact | 1 | 199 | Risk Ratio (M‐H, Random, 95% CI) | 0.89 [0.38, 2.10] |
| 27.2 UCM with cord cut | 0 | 0 | Risk Ratio (M‐H, Random, 95% CI) | 0.0 [0.0, 0.0] |
| 27.3 Unclear | 0 | 0 | Risk Ratio (M‐H, Random, 95% CI) | 0.0 [0.0, 0.0] |
| 28 Neurodevelopmental impairment at age two to three years Show forest plot | 2 | 187 | Risk Ratio (M‐H, Random, 95% CI) | 1.25 [0.49, 3.17] |
| 28.1 UCM with cord intact | 2 | 187 | Risk Ratio (M‐H, Random, 95% CI) | 1.25 [0.49, 3.17] |
| 28.2 UCM with cord cut | 0 | 0 | Risk Ratio (M‐H, Random, 95% CI) | 0.0 [0.0, 0.0] |
| 28.3 Unclear | 0 | 0 | Risk Ratio (M‐H, Random, 95% CI) | 0.0 [0.0, 0.0] |
| 29 Severe visual impairment Show forest plot | 1 | 125 | Risk Ratio (M‐H, Random, 95% CI) | 0.0 [0.0, 0.0] |
| 29.1 UCM with cord intact | 0 | 0 | Risk Ratio (M‐H, Random, 95% CI) | 0.0 [0.0, 0.0] |
| 29.2 UCM with cord cut | 1 | 125 | Risk Ratio (M‐H, Random, 95% CI) | 0.0 [0.0, 0.0] |
| 29.3 Unclear | 0 | 0 | Risk Ratio (M‐H, Random, 95% CI) | 0.0 [0.0, 0.0] |
| 30 Cerebral palsy (CP) Show forest plot | 2 | 286 | Risk Ratio (M‐H, Random, 95% CI) | 0.70 [0.05, 10.63] |
| 30.1 UCM with cord intact | 1 | 161 | Risk Ratio (M‐H, Random, 95% CI) | 2.65 [0.88, 7.97] |
| 30.2 UCM with cord cut | 1 | 125 | Risk Ratio (M‐H, Random, 95% CI) | 0.17 [0.04, 0.73] |
| 30.3 Unclear | 0 | 0 | Risk Ratio (M‐H, Random, 95% CI) | 0.0 [0.0, 0.0] |
| 31 Manual removal of placenta (denominator = vaginal births) | 0 | 0 | Risk Ratio (M‐H, Random, 95% CI) | 0.0 [0.0, 0.0] |
| 31.1 UCM with cord intact | 0 | 0 | Risk Ratio (M‐H, Random, 95% CI) | 0.0 [0.0, 0.0] |
| 31.2 UCM with cord cut | 0 | 0 | Risk Ratio (M‐H, Random, 95% CI) | 0.0 [0.0, 0.0] |
| 31.3 Unclear | 0 | 0 | Risk Ratio (M‐H, Random, 95% CI) | 0.0 [0.0, 0.0] |
| 32 Prolonged third stage (>30 minutes) (denominator = vaginal births) | 0 | 0 | Risk Ratio (M‐H, Random, 95% CI) | 0.0 [0.0, 0.0] |
| 32.1 UCM with cord intact | 0 | 0 | Risk Ratio (M‐H, Random, 95% CI) | 0.0 [0.0, 0.0] |
| 32.2 UCM with cord cut | 0 | 0 | Risk Ratio (M‐H, Random, 95% CI) | 0.0 [0.0, 0.0] |
| 32.3 Unclear | 0 | 0 | Risk Ratio (M‐H, Random, 95% CI) | 0.0 [0.0, 0.0] |
| 33 Blood transfusion for mother | 0 | 0 | Risk Ratio (M‐H, Random, 95% CI) | 0.0 [0.0, 0.0] |
| 33.1 UCM with cord intact | 0 | 0 | Risk Ratio (M‐H, Random, 95% CI) | 0.0 [0.0, 0.0] |
| 33.2 UCM with cord cut | 0 | 0 | Risk Ratio (M‐H, Random, 95% CI) | 0.0 [0.0, 0.0] |
| 33.3 Unclear | 0 | 0 | Risk Ratio (M‐H, Random, 95% CI) | 0.0 [0.0, 0.0] |
| 34 Postpartum infection in mother | 0 | 0 | Risk Ratio (M‐H, Random, 95% CI) | 0.0 [0.0, 0.0] |
| 34.1 UCM with cord intact | 0 | 0 | Risk Ratio (M‐H, Random, 95% CI) | 0.0 [0.0, 0.0] |
| 34.2 UCM with cord cut | 0 | 0 | Risk Ratio (M‐H, Random, 95% CI) | 0.0 [0.0, 0.0] |
| 34.3 Unclear | 0 | 0 | Risk Ratio (M‐H, Random, 95% CI) | 0.0 [0.0, 0.0] |
| 35 Rhesus isoimmunisation | 0 | 0 | Risk Ratio (M‐H, Random, 95% CI) | 0.0 [0.0, 0.0] |
| 35.1 UCM with cord intact | 0 | 0 | Risk Ratio (M‐H, Random, 95% CI) | 0.0 [0.0, 0.0] |
| 35.2 UCM with cord cut | 0 | 0 | Risk Ratio (M‐H, Random, 95% CI) | 0.0 [0.0, 0.0] |
| 35.3 Unclear | 0 | 0 | Risk Ratio (M‐H, Random, 95% CI) | 0.0 [0.0, 0.0] |
| 36 Psychological well being in mother | 0 | 0 | Std. Mean Difference (IV, Random, 95% CI) | 0.0 [0.0, 0.0] |
| 36.1 UCM with cord intact | 0 | 0 | Std. Mean Difference (IV, Random, 95% CI) | 0.0 [0.0, 0.0] |
| 36.2 UCM with cord cut | 0 | 0 | Std. Mean Difference (IV, Random, 95% CI) | 0.0 [0.0, 0.0] |
| 36.3 Unclear | 0 | 0 | Std. Mean Difference (IV, Random, 95% CI) | 0.0 [0.0, 0.0] |
| 37 Bonding | 0 | 0 | Std. Mean Difference (IV, Random, 95% CI) | 0.0 [0.0, 0.0] |
| 37.1 UCM with cord intact | 0 | 0 | Std. Mean Difference (IV, Random, 95% CI) | 0.0 [0.0, 0.0] |
| 37.2 UCM with cord cut | 0 | 0 | Std. Mean Difference (IV, Random, 95% CI) | 0.0 [0.0, 0.0] |
| 37.3 Unclear | 0 | 0 | Std. Mean Difference (IV, Random, 95% CI) | 0.0 [0.0, 0.0] |
| 38 Breastfeeding initiation | 0 | 0 | Risk Ratio (M‐H, Random, 95% CI) | 0.0 [0.0, 0.0] |
| 38.1 UCM with cord intact | 0 | 0 | Risk Ratio (M‐H, Random, 95% CI) | 0.0 [0.0, 0.0] |
| 38.2 UCM with cord cut | 0 | 0 | Risk Ratio (M‐H, Random, 95% CI) | 0.0 [0.0, 0.0] |
| 38.3 Unclear | 0 | 0 | Risk Ratio (M‐H, Random, 95% CI) | 0.0 [0.0, 0.0] |
| 39 Fully or mixed feeding at infant discharge | 0 | 0 | Risk Ratio (M‐H, Random, 95% CI) | 0.0 [0.0, 0.0] |
| 39.1 UCM with cord intact | 0 | 0 | Risk Ratio (M‐H, Random, 95% CI) | 0.0 [0.0, 0.0] |
| 39.2 UCM with cord cut | 0 | 0 | Risk Ratio (M‐H, Random, 95% CI) | 0.0 [0.0, 0.0] |
| 39.3 Unclear | 0 | 0 | Risk Ratio (M‐H, Random, 95% CI) | 0.0 [0.0, 0.0] |
| 40 Maternal anxiety | 0 | 0 | Risk Ratio (M‐H, Random, 95% CI) | 0.0 [0.0, 0.0] |
| 40.1 UCM with cord intact | 0 | 0 | Risk Ratio (M‐H, Random, 95% CI) | 0.0 [0.0, 0.0] |
| 40.2 UCM with cord cut | 0 | 0 | Risk Ratio (M‐H, Random, 95% CI) | 0.0 [0.0, 0.0] |
| 40.3 Unclear | 0 | 0 | Risk Ratio (M‐H, Random, 95% CI) | 0.0 [0.0, 0.0] |
| 41 Mothers' views | 0 | 0 | Std. Mean Difference (IV, Random, 95% CI) | 0.0 [0.0, 0.0] |
| 41.1 UCM with cord intact | 0 | 0 | Std. Mean Difference (IV, Random, 95% CI) | 0.0 [0.0, 0.0] |
| 41.2 UCM with cord cut | 0 | 0 | Std. Mean Difference (IV, Random, 95% CI) | 0.0 [0.0, 0.0] |
| 41.3 Unclear | 0 | 0 | Std. Mean Difference (IV, Random, 95% CI) | 0.0 [0.0, 0.0] |
| Outcome or subgroup title | No. of studies | No. of participants | Statistical method | Effect size |
| 1 Death of baby (up to discharge) Show forest plot | 5 | 1804 | Risk Ratio (M‐H, Random, 95% CI) | 0.71 [0.51, 0.97] |
| 2 Death or neurodevelopmental impairment in early years | 0 | 0 | Risk Ratio (M‐H, Random, 95% CI) | 0.0 [0.0, 0.0] |
| 3 Severe intraventricular haemorrhage (IVH grades 3, 4) Show forest plot | 4 | 1689 | Risk Ratio (M‐H, Random, 95% CI) | 0.84 [0.54, 1.32] |
| 4 Intraventricular haemorrhage (IVH, all grades) Show forest plot | 4 | 1689 | Risk Ratio (M‐H, Random, 95% CI) | 0.78 [0.52, 1.18] |
| 5 Periventricular leukomalacia (PVL) Show forest plot | 2 | 1448 | Risk Ratio (M‐H, Random, 95% CI) | 0.52 [0.23, 1.19] |
| 6 Chronic lung disease (CLD) ‐ oxygen supplement at 36 weeks (corrected for gestation) Show forest plot | 4 | 1587 | Risk Ratio (M‐H, Random, 95% CI) | 1.05 [0.95, 1.15] |
| 7 Maternal blood loss of 500 mL or greater Show forest plot | 1 | 86 | Risk Ratio (M‐H, Random, 95% CI) | 0.0 [0.0, 0.0] |
| Outcome or subgroup title | No. of studies | No. of participants | Statistical method | Effect size |
| 1 Death of baby (up to discharge) Show forest plot | 1 | 270 | Risk Ratio (M‐H, Random, 95% CI) | 0.47 [0.20, 1.11] |
| 2 Death or neurodevelopmental impairment in early years Show forest plot | 1 | 218 | Risk Ratio (M‐H, Random, 95% CI) | 0.61 [0.39, 0.96] |
| 3 Severe intraventricular haemorrhage (IVH grades 3, 4) Show forest plot | 1 | 266 | Risk Ratio (M‐H, Random, 95% CI) | 0.84 [0.29, 2.45] |
| 4 Intraventricular haemorrhage (IVH, all grades) Show forest plot | 1 | 266 | Risk Ratio (M‐H, Random, 95% CI) | 0.90 [0.64, 1.26] |
| 5 Periventricular leukomalacia (PVL) Show forest plot | 1 | 266 | Risk Ratio (M‐H, Random, 95% CI) | 0.86 [0.32, 2.31] |
| 6 Chronic lung disease (CLD) ‐ oxygen supplement at 36 weeks (corrected for gestation) Show forest plot | 1 | 249 | Risk Ratio (M‐H, Random, 95% CI) | 0.95 [0.66, 1.37] |
| 7 Maternal blood loss of 500 mL or greater Show forest plot | 1 | 254 | Risk Ratio (M‐H, Random, 95% CI) | 0.94 [0.72, 1.22] |
| Outcome or subgroup title | No. of studies | No. of participants | Statistical method | Effect size |
| 1 Death of baby (up to discharge) Show forest plot | 1 | 58 | Risk Ratio (M‐H, Random, 95% CI) | 1.74 [0.35, 8.78] |
| 2 Death or neurodevelopmental impairment in early years Show forest plot | 1 | 45 | Risk Ratio (M‐H, Random, 95% CI) | 3.43 [0.77, 15.20] |
| 3 Severe intraventricular haemorrhage (IVH grades 3, 4) Show forest plot | 1 | 58 | Risk Ratio (M‐H, Random, 95% CI) | 2.63 [0.11, 61.88] |
| 4 Intraventricular haemorrhage (IVH, all grades) Show forest plot | 1 | 58 | Risk Ratio (M‐H, Random, 95% CI) | 2.03 [0.58, 7.09] |
| 5 Periventricular leukomalacia (PVL) Show forest plot | 1 | 58 | Risk Ratio (M‐H, Random, 95% CI) | 0.0 [0.0, 0.0] |
| 6 Chronic lung disease (CLD) ‐ oxygen supplement at 36 weeks (corrected for gestation) Show forest plot | 1 | 58 | Risk Ratio (M‐H, Random, 95% CI) | 1.16 [0.28, 4.73] |
| 7 Maternal blood loss of 500 mL or greater | 0 | 0 | Risk Ratio (M‐H, Random, 95% CI) | 0.0 [0.0, 0.0] |
| Outcome or subgroup title | No. of studies | No. of participants | Statistical method | Effect size |
| 1 Death of baby (up to discharge) Show forest plot | 4 | 533 | Risk Ratio (M‐H, Random, 95% CI) | 1.18 [0.53, 2.62] |
| 2 Death or neurodevelopmental impairment in early years | 0 | 0 | Risk Ratio (M‐H, Random, 95% CI) | 0.0 [0.0, 0.0] |
| 3 Severe intraventricular haemorrhage (IVH grades 3, 4) Show forest plot | 2 | 260 | Risk Ratio (M‐H, Random, 95% CI) | 0.72 [0.23, 2.23] |
| 4 Intraventricular haemorrhage (IVH, all grades) Show forest plot | 3 | 333 | Risk Ratio (M‐H, Random, 95% CI) | 0.81 [0.50, 1.31] |
| 5 Periventricular leukomalacia (PVL) Show forest plot | 1 | 200 | Risk Ratio (M‐H, Random, 95% CI) | 3.06 [0.13, 74.23] |
| 6 Chronic lung disease (CLD) ‐ oxygen supplement at 36 weeks (corrected for gestation) Show forest plot | 3 | 330 | Risk Ratio (M‐H, Random, 95% CI) | 0.85 [0.44, 1.64] |
| 7 Maternal blood loss of 500 mL or greater Show forest plot | 1 | 200 | Risk Ratio (M‐H, Random, 95% CI) | 0.0 [0.0, 0.0] |