Tratamiento de la pulpa para el deterioro extenso de los dientes primarios
Información
- DOI:
- https://doi.org/10.1002/14651858.CD003220.pub3Copiar DOI

- Base de datos:
-
- Cochrane Database of Systematic Reviews
- Versión publicada:
-
- 31 mayo 2018see what's new
- Tipo:
-
- Intervention
- Etapa:
-
- Review
- Grupo Editorial Cochrane:
-
Grupo Cochrane de Salud oral
- Copyright:
-
- Copyright © 2018 The Cochrane Collaboration. Published by John Wiley & Sons, Ltd.
Cifras del artículo
Altmetric:
Citado por:
Autores
Contributions of authors
Conceiving the review ‐ Violaine Smaïl‐Faugeron (VSF), Hélène Fron Chabouis (HFC), Michele Muller‐Bolla (MMB), Anne‐Marie Glenny (AMG)
Designing the review ‐ VSF, HFC, Pierre Durieux (PD), Frédéric Courson (FC), AMG
Co‐ordinating the review ‐ VSF, HFC
Developing the search strategy ‐ VSF, HFC, AMG, Anne Littlewood (AL)
Undertaking searches ‐ VSF, HFC, AL
Screening search results ‐ VSF, HFC
Organising the retrieval of papers ‐ VSF
Screening the retrieved papers against inclusion criteria ‐ VSF, HFC
Appraising the quality of papers ‐ VSF, HFC
Extracting data from papers ‐ VSF, HFC
Writing to authors of papers for additional information ‐ VSF, HFC
Data management for the review ‐ VSF
Entering data into RevMan ‐ VSF
Analysis of data ‐ VSF
Interpretation of data ‐ VSF, HFC, FC
Writing the review ‐ VSF, HFC, PD, FC
Sources of support
Internal sources
-
School of Dentistry, The University of Manchester, Manchester Academic Health Sciences Centre (MAHSC), the NIHR Manchester Biomedical Research Centre, UK.
-
School of Dentistry, The University of Manchester, UK.
External sources
-
Cochrane Oral Health Group Global Alliance, Other.
The production of Cochrane Oral Health reviews has been supported financially by our Global Alliance since 2011 (oralhealth.cochrane.org/partnerships‐alliances). Contributors over the past year have been the American Association of Public Health Dentistry, USA; AS‐Akademie, Germany; the British Association for the Study of Community Dentistry, UK; the British Society of Paediatric Dentistry, UK; the Canadian Dental Hygienists Association, Canada; the Centre for Dental Education and Research at All India Institute of Medical Sciences, India; the National Center for Dental Hygiene Research & Practice, USA; New York University College of Dentistry, USA; NHS Education for Scotland, UK; and the Swiss Society for Endodontology, Switzerland.
-
National Institute for Health Research (NIHR), UK.
This project was supported by the NIHR, via Cochrane Infrastructure funding to Cochrane Oral Health. The views and opinions expressed herein are those of the review authors and do not necessarily reflect those of the Systematic Reviews Programme, the NIHR, the NHS or the Department of Health.
Declarations of interest
Violaine Smaïl‐Faugeron: none known
Anne‐Marie Glenny: none known. I am Deputy Co‐ordinating Editor with Cochrane Oral Health.
Frédéric Courson: none known
Pierre Durieux: has received in the past three years research grants from the French Ministry of Health (PREQHOS, PHRC). He has been member of scientific committees of ANR (Agence Nationale de la Recherche), PREQHOS (Projets de Recherche en qualité hospitalière) and PREPS (Projets de Recherche en Performance de Soins) of the French Ministry of Health. He has received consultancies from Amgen and ONYX, and the Haute Autorité de Santé (HAS). The author has no financial relationships with any organisations that might have an interest in the review in the previous three years (except the fact that the author is employee of an acute care hospital).
Michele Muller‐Bolla: none known
Hélène Fron Chabouis: our lab (URB2i, Universite Paris Descartes) has developed industrial partnerships but these did not have any link with this review and did not influence my work.
Acknowledgements
For this update, we thank Helen Worthington, Laura MacDonald, Anne Littlewood and Philip Riley of Cochrane Oral Health. We also thank the referees Suzanne Dunkley and Jaap Veerkamp, and copy editor Ann Jones.
For previous versions of the review, we thank Anne Littlewood (Cochrane Oral Health) for design and conduct of search strategies; Luisa Fernandez Mauleffinch and Philip Riley (Cochrane Oral Health) for their assistance; Laura Smales (BioMedEditing, Toronto, Canada) for editing the manuscript; and Gill Nadin for contribution as an author.
Version history
| Published | Title | Stage | Authors | Version |
| 2018 May 31 | Pulp treatment for extensive decay in primary teeth | Review | Violaine Smaïl‐Faugeron, Anne‐Marie Glenny, Frédéric Courson, Pierre Durieux, Michele Muller‐Bolla, Helene Fron Chabouis | |
| 2014 Aug 06 | Pulp treatment for extensive decay in primary teeth | Review | Violaine Smaïl‐Faugeron, Frédéric Courson, Pierre Durieux, Michele Muller‐Bolla, Anne‐Marie Glenny, Helene Fron Chabouis | |
| 2003 Jan 20 | Pulp treatment for extensive decay in primary teeth | Review | Gill Nadin, Beena Rani Goel, Albert Yeung, Anne‐Marie Glenny | |
Differences between protocol and review
None.
Keywords
MeSH
Medical Subject Headings (MeSH) Keywords
- *Molar;
- *Tooth, Deciduous;
- Aluminum Compounds [therapeutic use];
- Calcium Compounds [therapeutic use];
- Calcium Hydroxide [therapeutic use];
- Controlled Clinical Trials as Topic;
- Dental Caries [*therapy];
- Dental Cements [therapeutic use];
- Dental Materials [therapeutic use];
- Drug Combinations;
- Electric Stimulation Therapy;
- Ferric Compounds [therapeutic use];
- Formocresols [therapeutic use];
- Oxides [therapeutic use];
- Pulpectomy [*methods];
- Pulpotomy [*methods];
- Randomized Controlled Trials as Topic;
- Silicates [therapeutic use];
- Treatment Failure;
- Zinc Oxide‐Eugenol Cement [therapeutic use];
Medical Subject Headings Check Words
Child; Child, Preschool; Humans;
PICO

Study flow diagram

Risk of bias summary: review authors' judgements about each risk of bias item for each included study

Comparison 1 Mineral trioxide aggregate (MTA) pulpotomy versus full strength or 1:5 diluted formocresol pulpotomy, Outcome 1 Clinical failure.

Comparison 1 Mineral trioxide aggregate (MTA) pulpotomy versus full strength or 1:5 diluted formocresol pulpotomy, Outcome 2 Radiological failure.
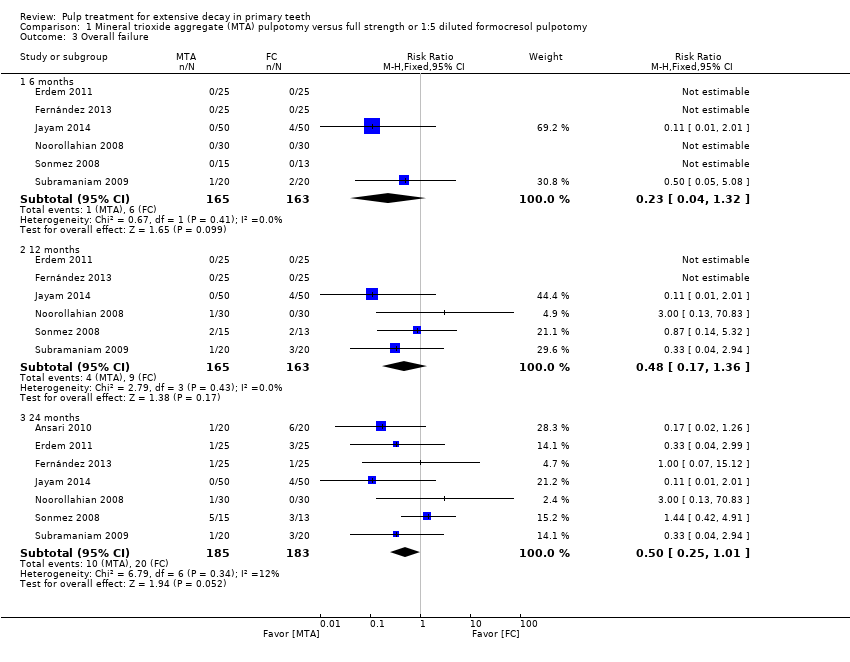
Comparison 1 Mineral trioxide aggregate (MTA) pulpotomy versus full strength or 1:5 diluted formocresol pulpotomy, Outcome 3 Overall failure.

Comparison 1 Mineral trioxide aggregate (MTA) pulpotomy versus full strength or 1:5 diluted formocresol pulpotomy, Outcome 4 Pain.
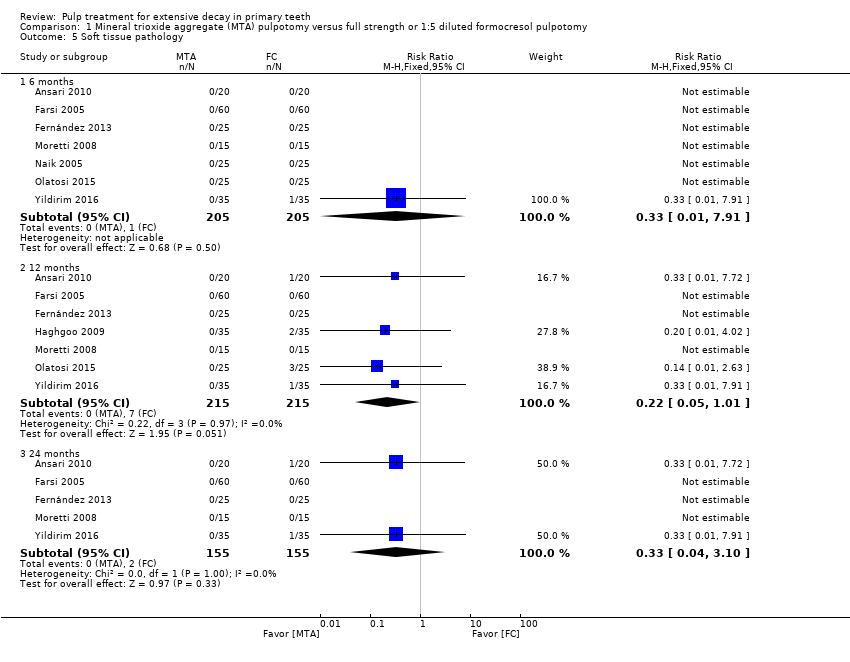
Comparison 1 Mineral trioxide aggregate (MTA) pulpotomy versus full strength or 1:5 diluted formocresol pulpotomy, Outcome 5 Soft tissue pathology.

Comparison 1 Mineral trioxide aggregate (MTA) pulpotomy versus full strength or 1:5 diluted formocresol pulpotomy, Outcome 6 Pathological mobility.

Comparison 1 Mineral trioxide aggregate (MTA) pulpotomy versus full strength or 1:5 diluted formocresol pulpotomy, Outcome 7 Pathological radiolucency.
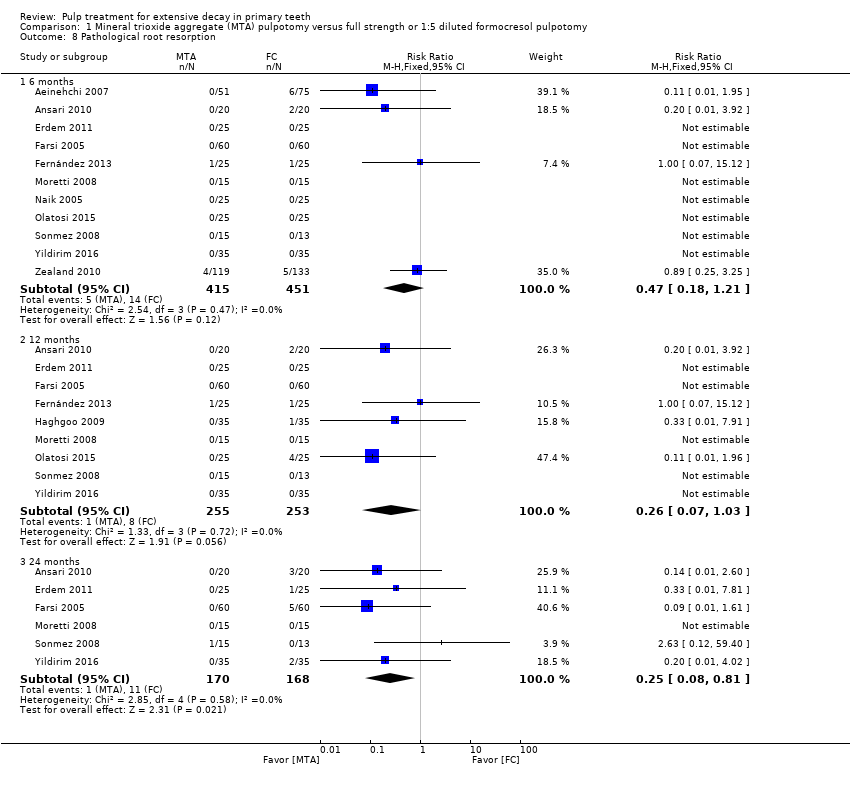
Comparison 1 Mineral trioxide aggregate (MTA) pulpotomy versus full strength or 1:5 diluted formocresol pulpotomy, Outcome 8 Pathological root resorption.

Comparison 1 Mineral trioxide aggregate (MTA) pulpotomy versus full strength or 1:5 diluted formocresol pulpotomy, Outcome 9 Pulp canal obliteration.

Comparison 1 Mineral trioxide aggregate (MTA) pulpotomy versus full strength or 1:5 diluted formocresol pulpotomy, Outcome 10 Dentin bridge formation.

Comparison 1 Mineral trioxide aggregate (MTA) pulpotomy versus full strength or 1:5 diluted formocresol pulpotomy, Outcome 11 Physiological root resorption.

Comparison 2 Mineral trioxide aggregate (MTA) pulpotomy versus full strength formocresol pulpotomy, Outcome 1 Clinical failure.

Comparison 2 Mineral trioxide aggregate (MTA) pulpotomy versus full strength formocresol pulpotomy, Outcome 2 Radiological failure.
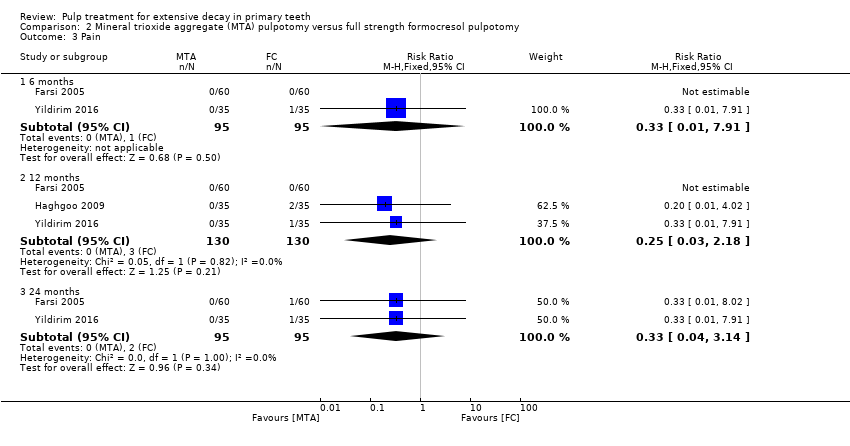
Comparison 2 Mineral trioxide aggregate (MTA) pulpotomy versus full strength formocresol pulpotomy, Outcome 3 Pain.

Comparison 2 Mineral trioxide aggregate (MTA) pulpotomy versus full strength formocresol pulpotomy, Outcome 4 Soft tissue pathology.
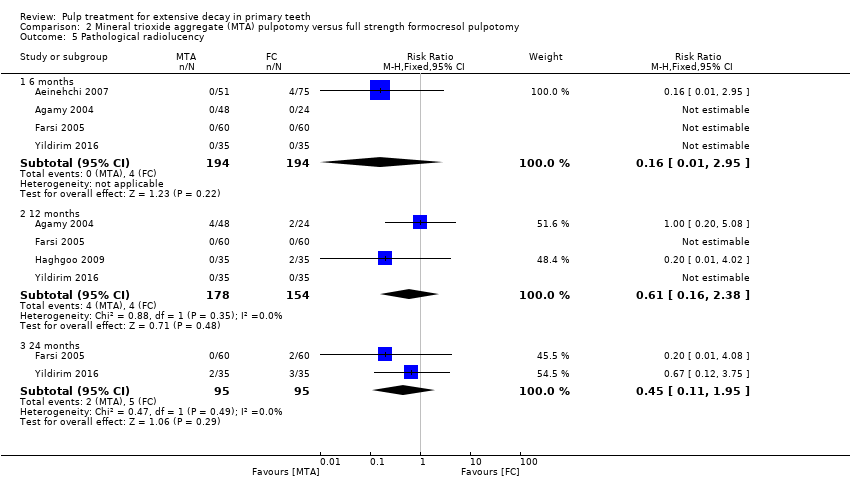
Comparison 2 Mineral trioxide aggregate (MTA) pulpotomy versus full strength formocresol pulpotomy, Outcome 5 Pathological radiolucency.

Comparison 2 Mineral trioxide aggregate (MTA) pulpotomy versus full strength formocresol pulpotomy, Outcome 6 Pathological root resorption.

Comparison 2 Mineral trioxide aggregate (MTA) pulpotomy versus full strength formocresol pulpotomy, Outcome 7 Pulp canal obliteration.

Comparison 3 Mineral trioxide aggregate (MTA) pulpotomy versus 1:5 diluted formocresol pulpotomy, Outcome 1 Clinical failure.

Comparison 3 Mineral trioxide aggregate (MTA) pulpotomy versus 1:5 diluted formocresol pulpotomy, Outcome 2 Radiological failure.

Comparison 3 Mineral trioxide aggregate (MTA) pulpotomy versus 1:5 diluted formocresol pulpotomy, Outcome 3 Pain.
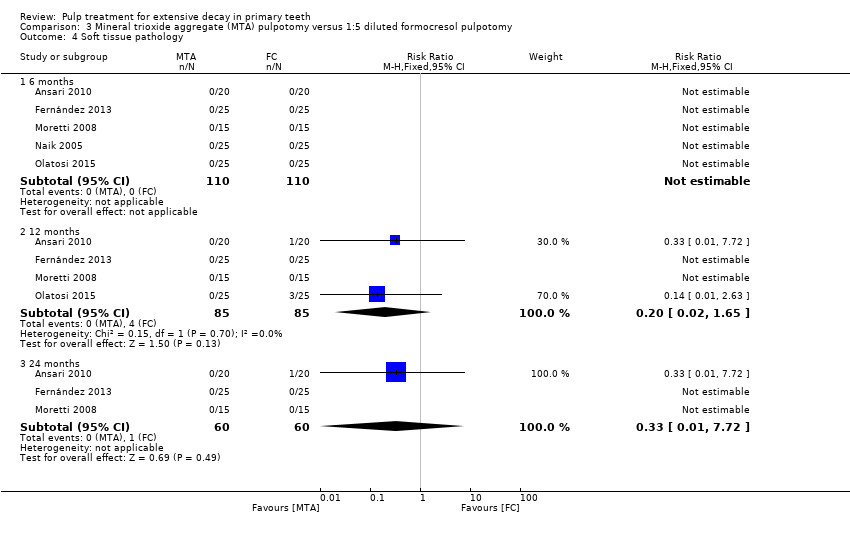
Comparison 3 Mineral trioxide aggregate (MTA) pulpotomy versus 1:5 diluted formocresol pulpotomy, Outcome 4 Soft tissue pathology.

Comparison 3 Mineral trioxide aggregate (MTA) pulpotomy versus 1:5 diluted formocresol pulpotomy, Outcome 5 Pathological mobility.

Comparison 3 Mineral trioxide aggregate (MTA) pulpotomy versus 1:5 diluted formocresol pulpotomy, Outcome 6 Pathological radiolucency.
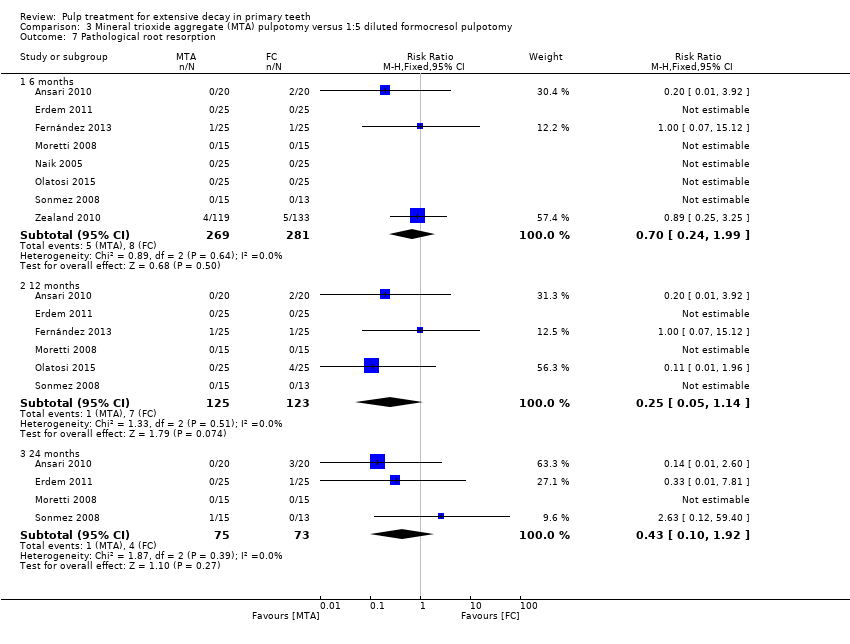
Comparison 3 Mineral trioxide aggregate (MTA) pulpotomy versus 1:5 diluted formocresol pulpotomy, Outcome 7 Pathological root resorption.
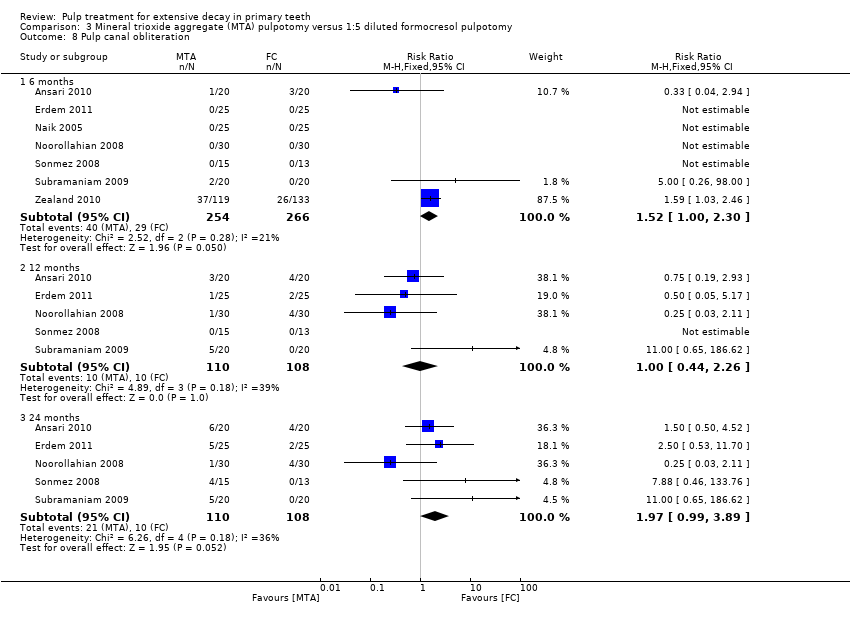
Comparison 3 Mineral trioxide aggregate (MTA) pulpotomy versus 1:5 diluted formocresol pulpotomy, Outcome 8 Pulp canal obliteration.

Comparison 4 Mineral trioxide aggregate (MTA) pulpotomy versus ferric sulphate (FS) pulpotomy, Outcome 1 Clinical failure.

Comparison 4 Mineral trioxide aggregate (MTA) pulpotomy versus ferric sulphate (FS) pulpotomy, Outcome 2 Radiological failure.

Comparison 4 Mineral trioxide aggregate (MTA) pulpotomy versus ferric sulphate (FS) pulpotomy, Outcome 3 Overall failure.
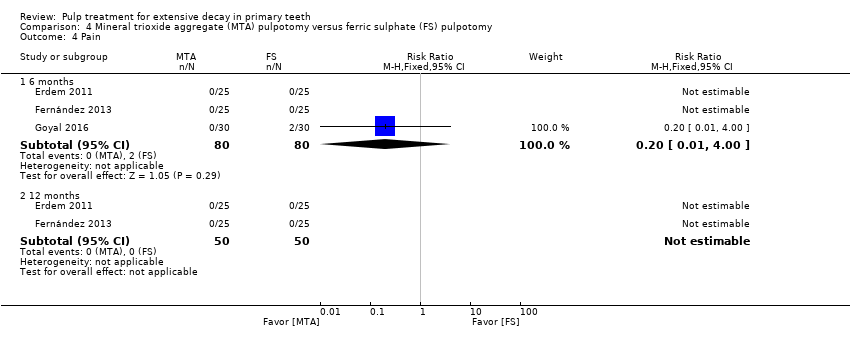
Comparison 4 Mineral trioxide aggregate (MTA) pulpotomy versus ferric sulphate (FS) pulpotomy, Outcome 4 Pain.
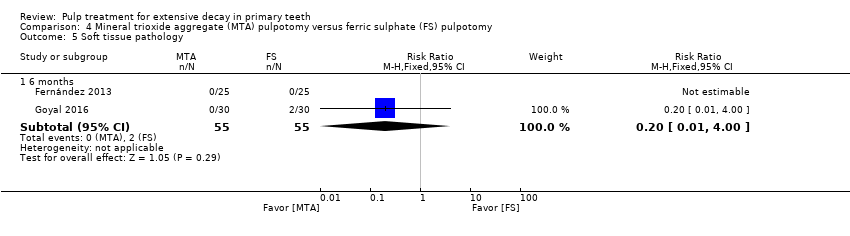
Comparison 4 Mineral trioxide aggregate (MTA) pulpotomy versus ferric sulphate (FS) pulpotomy, Outcome 5 Soft tissue pathology.
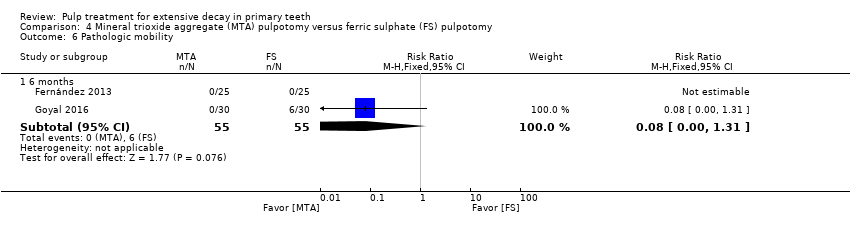
Comparison 4 Mineral trioxide aggregate (MTA) pulpotomy versus ferric sulphate (FS) pulpotomy, Outcome 6 Pathologic mobility.

Comparison 4 Mineral trioxide aggregate (MTA) pulpotomy versus ferric sulphate (FS) pulpotomy, Outcome 7 Pathologic radiolucency.
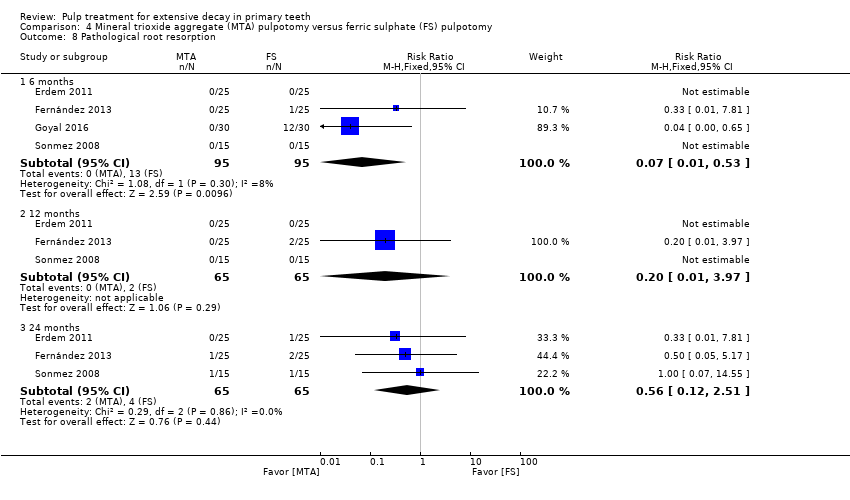
Comparison 4 Mineral trioxide aggregate (MTA) pulpotomy versus ferric sulphate (FS) pulpotomy, Outcome 8 Pathological root resorption.
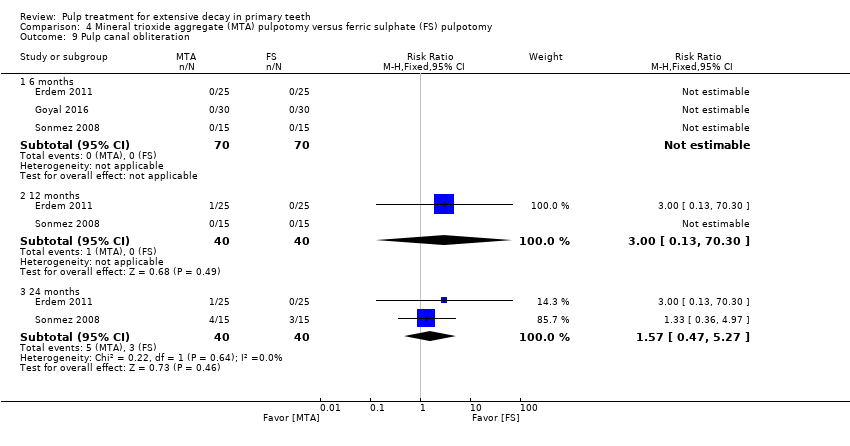
Comparison 4 Mineral trioxide aggregate (MTA) pulpotomy versus ferric sulphate (FS) pulpotomy, Outcome 9 Pulp canal obliteration.
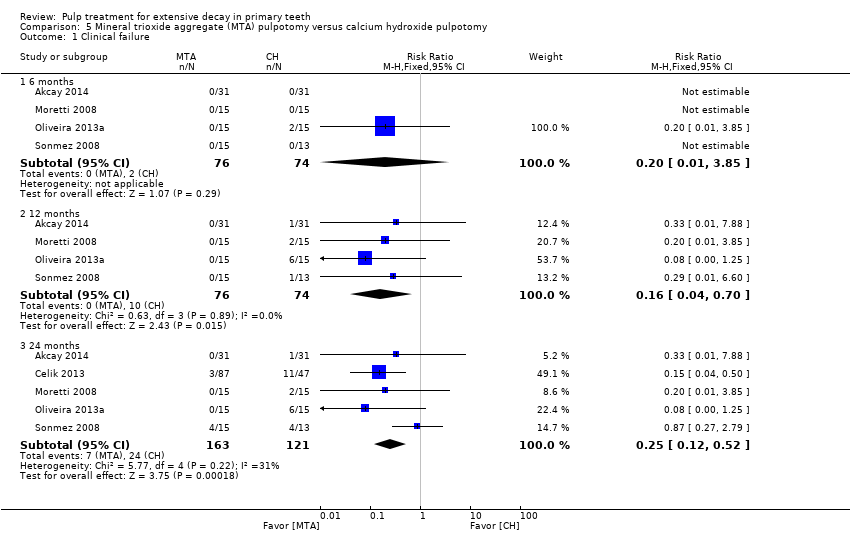
Comparison 5 Mineral trioxide aggregate (MTA) pulpotomy versus calcium hydroxide pulpotomy, Outcome 1 Clinical failure.
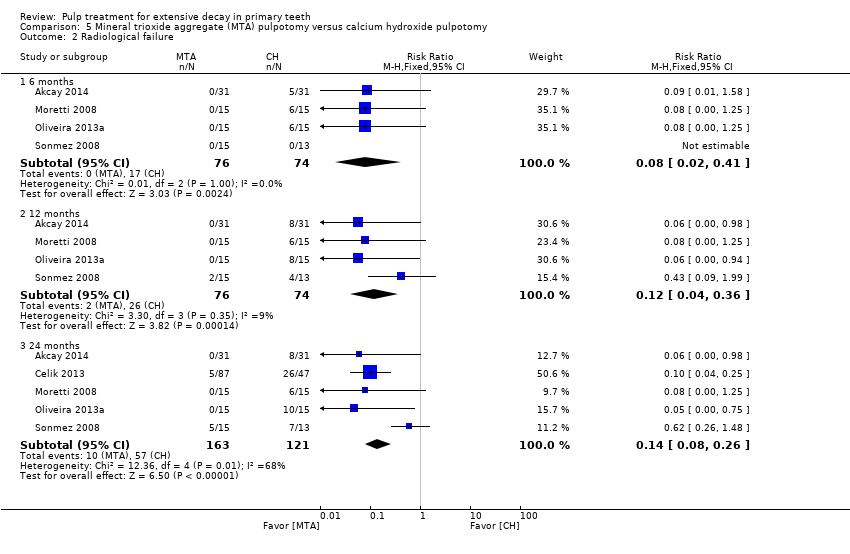
Comparison 5 Mineral trioxide aggregate (MTA) pulpotomy versus calcium hydroxide pulpotomy, Outcome 2 Radiological failure.

Comparison 5 Mineral trioxide aggregate (MTA) pulpotomy versus calcium hydroxide pulpotomy, Outcome 3 Overall failure.

Comparison 5 Mineral trioxide aggregate (MTA) pulpotomy versus calcium hydroxide pulpotomy, Outcome 4 Pain.
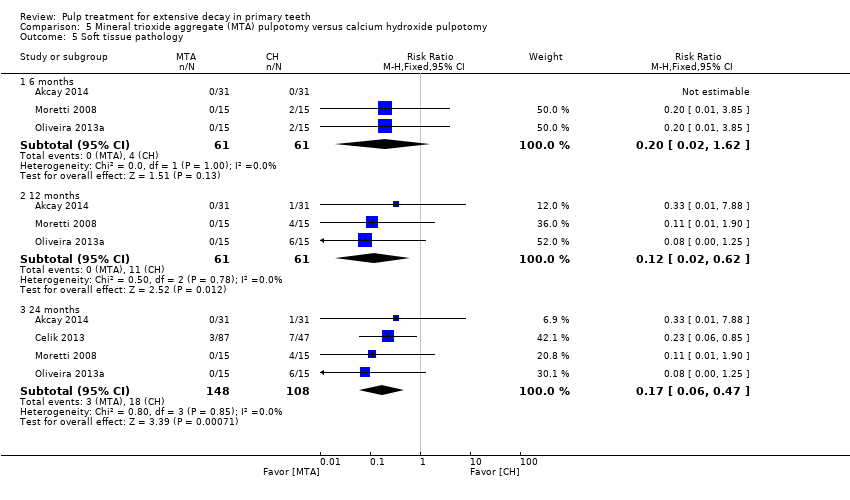
Comparison 5 Mineral trioxide aggregate (MTA) pulpotomy versus calcium hydroxide pulpotomy, Outcome 5 Soft tissue pathology.
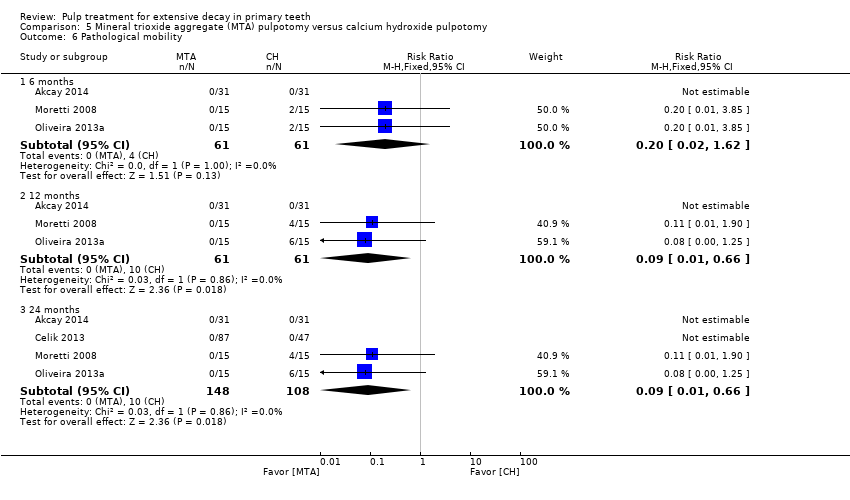
Comparison 5 Mineral trioxide aggregate (MTA) pulpotomy versus calcium hydroxide pulpotomy, Outcome 6 Pathological mobility.

Comparison 5 Mineral trioxide aggregate (MTA) pulpotomy versus calcium hydroxide pulpotomy, Outcome 7 Pathological radiolucency.

Comparison 5 Mineral trioxide aggregate (MTA) pulpotomy versus calcium hydroxide pulpotomy, Outcome 8 Pathological root resorption.
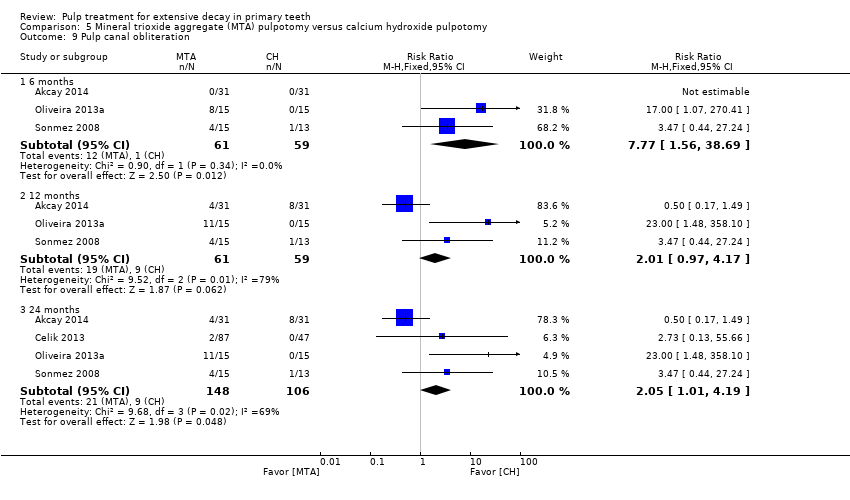
Comparison 5 Mineral trioxide aggregate (MTA) pulpotomy versus calcium hydroxide pulpotomy, Outcome 9 Pulp canal obliteration.

Comparison 5 Mineral trioxide aggregate (MTA) pulpotomy versus calcium hydroxide pulpotomy, Outcome 10 Dentin bridge formation.

Comparison 6 Mineral trioxide aggregate (MTA) pulpotomy versus Portland cement pulpotomy, Outcome 1 Clinical failure.

Comparison 6 Mineral trioxide aggregate (MTA) pulpotomy versus Portland cement pulpotomy, Outcome 2 Radiological failure.

Comparison 6 Mineral trioxide aggregate (MTA) pulpotomy versus Portland cement pulpotomy, Outcome 3 Pain.

Comparison 6 Mineral trioxide aggregate (MTA) pulpotomy versus Portland cement pulpotomy, Outcome 4 Soft tissue pathology.
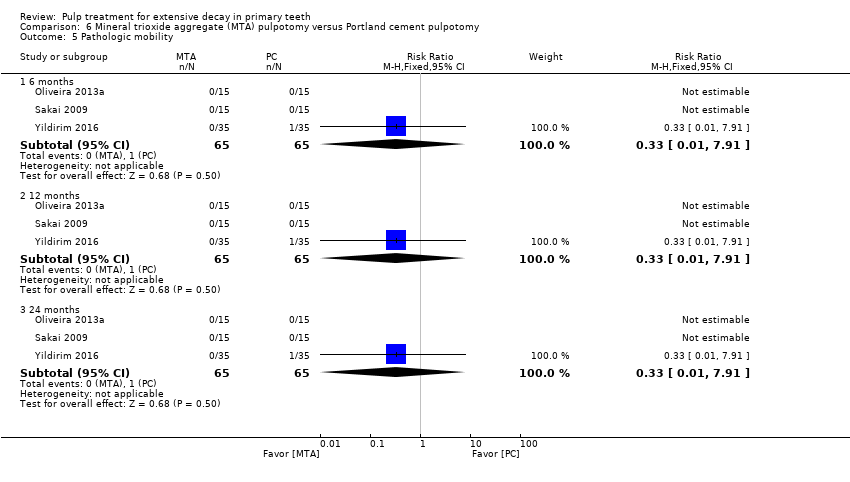
Comparison 6 Mineral trioxide aggregate (MTA) pulpotomy versus Portland cement pulpotomy, Outcome 5 Pathologic mobility.
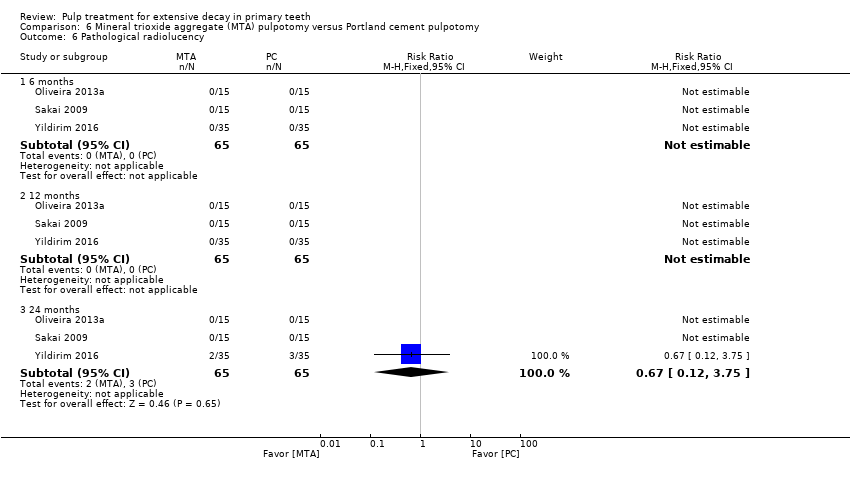
Comparison 6 Mineral trioxide aggregate (MTA) pulpotomy versus Portland cement pulpotomy, Outcome 6 Pathological radiolucency.

Comparison 6 Mineral trioxide aggregate (MTA) pulpotomy versus Portland cement pulpotomy, Outcome 7 Pathological root resorption.

Comparison 6 Mineral trioxide aggregate (MTA) pulpotomy versus Portland cement pulpotomy, Outcome 8 Pulp canal obliteration.
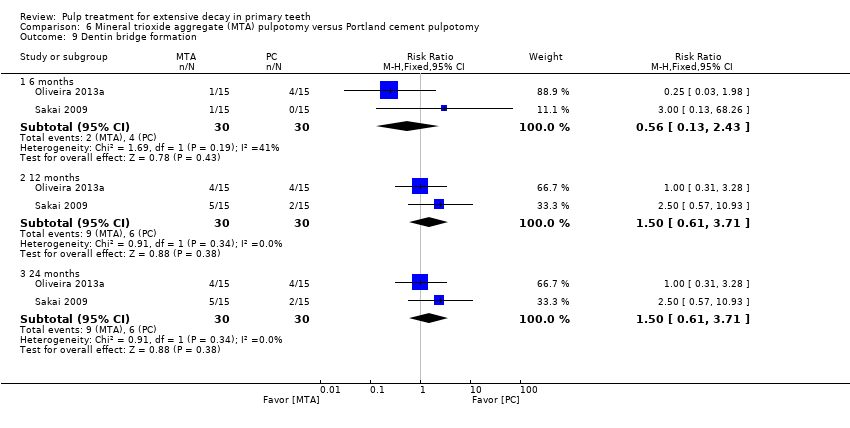
Comparison 6 Mineral trioxide aggregate (MTA) pulpotomy versus Portland cement pulpotomy, Outcome 9 Dentin bridge formation.

Comparison 7 Biodentine pulpotomy versus Mineral trioxide aggregate (MTA) pulpotomy, Outcome 1 Clinical failure.
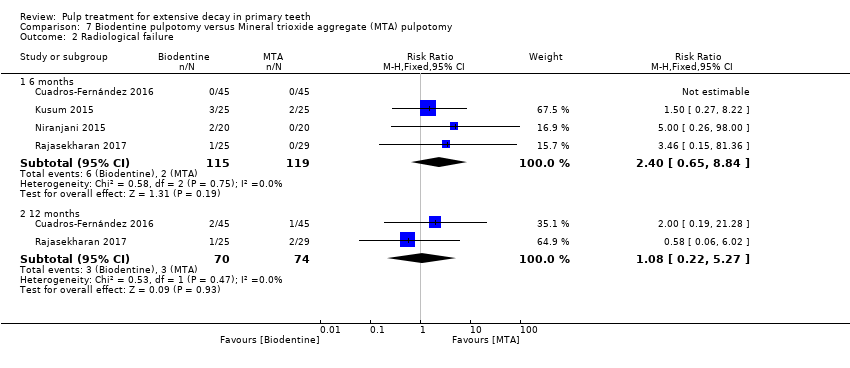
Comparison 7 Biodentine pulpotomy versus Mineral trioxide aggregate (MTA) pulpotomy, Outcome 2 Radiological failure.

Comparison 7 Biodentine pulpotomy versus Mineral trioxide aggregate (MTA) pulpotomy, Outcome 3 Pain.

Comparison 7 Biodentine pulpotomy versus Mineral trioxide aggregate (MTA) pulpotomy, Outcome 4 Soft tissue pathology.
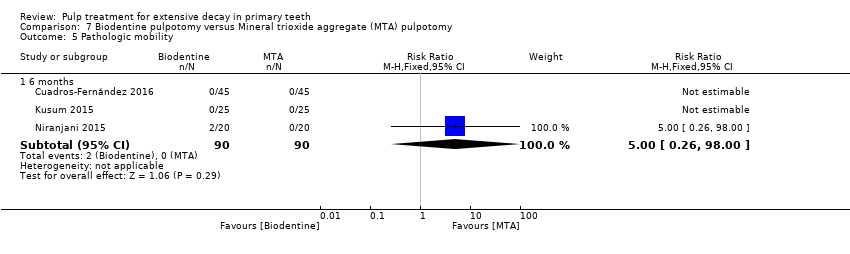
Comparison 7 Biodentine pulpotomy versus Mineral trioxide aggregate (MTA) pulpotomy, Outcome 5 Pathologic mobility.

Comparison 7 Biodentine pulpotomy versus Mineral trioxide aggregate (MTA) pulpotomy, Outcome 6 Pathological radiolucency.
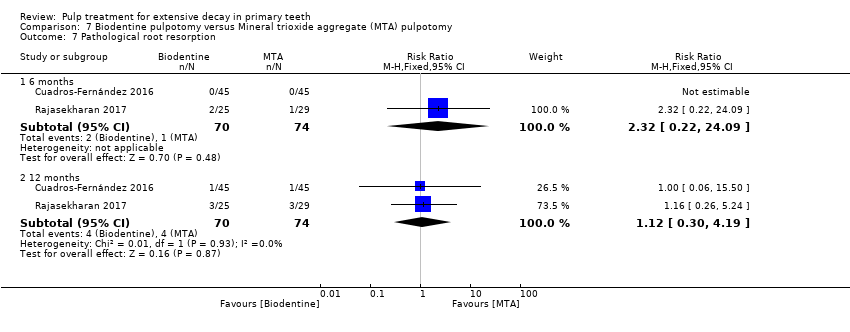
Comparison 7 Biodentine pulpotomy versus Mineral trioxide aggregate (MTA) pulpotomy, Outcome 7 Pathological root resorption.
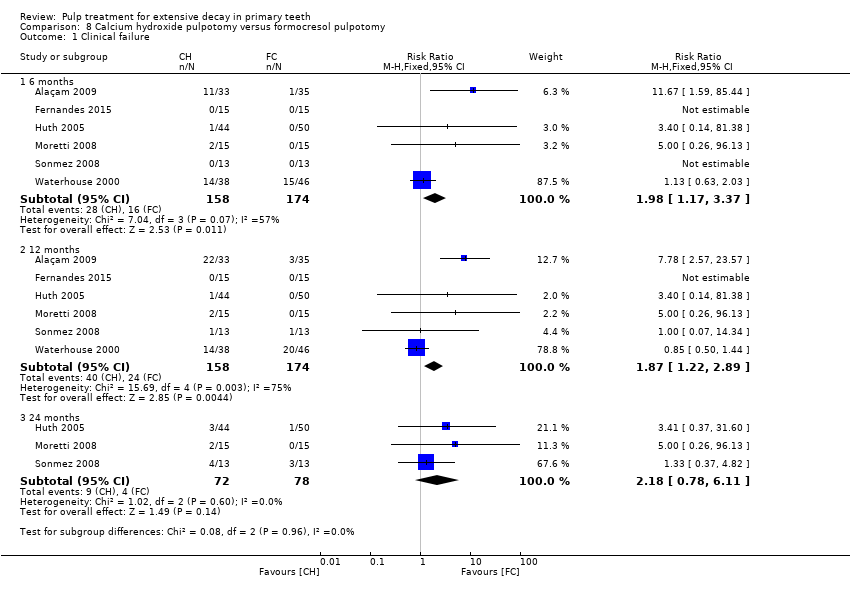
Comparison 8 Calcium hydroxide pulpotomy versus formocresol pulpotomy, Outcome 1 Clinical failure.

Comparison 8 Calcium hydroxide pulpotomy versus formocresol pulpotomy, Outcome 2 Radiological failure.

Comparison 8 Calcium hydroxide pulpotomy versus formocresol pulpotomy, Outcome 3 Overall failure.
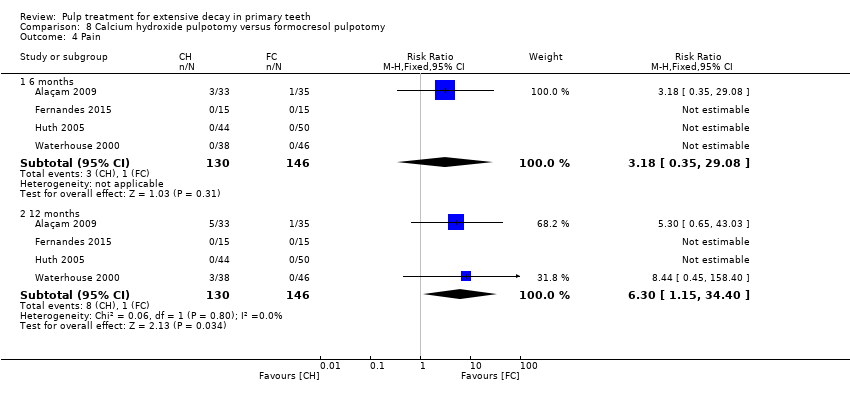
Comparison 8 Calcium hydroxide pulpotomy versus formocresol pulpotomy, Outcome 4 Pain.

Comparison 8 Calcium hydroxide pulpotomy versus formocresol pulpotomy, Outcome 5 Soft tissue pathology.

Comparison 8 Calcium hydroxide pulpotomy versus formocresol pulpotomy, Outcome 6 Pathological mobility.
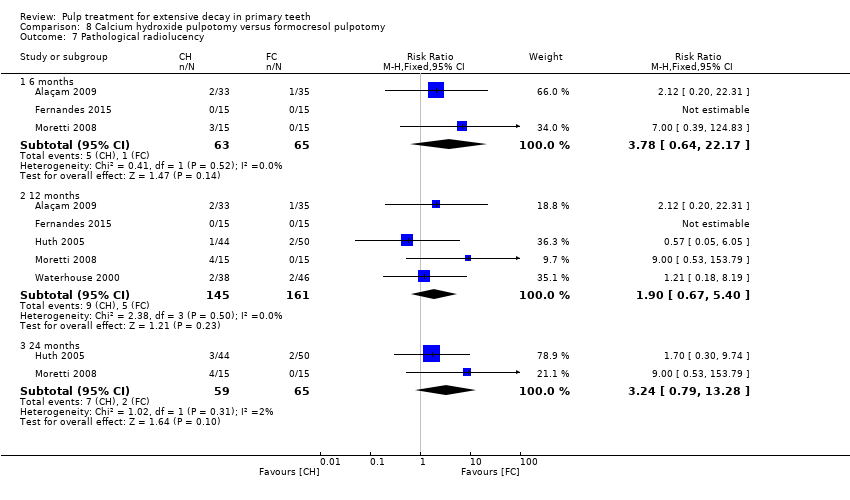
Comparison 8 Calcium hydroxide pulpotomy versus formocresol pulpotomy, Outcome 7 Pathological radiolucency.
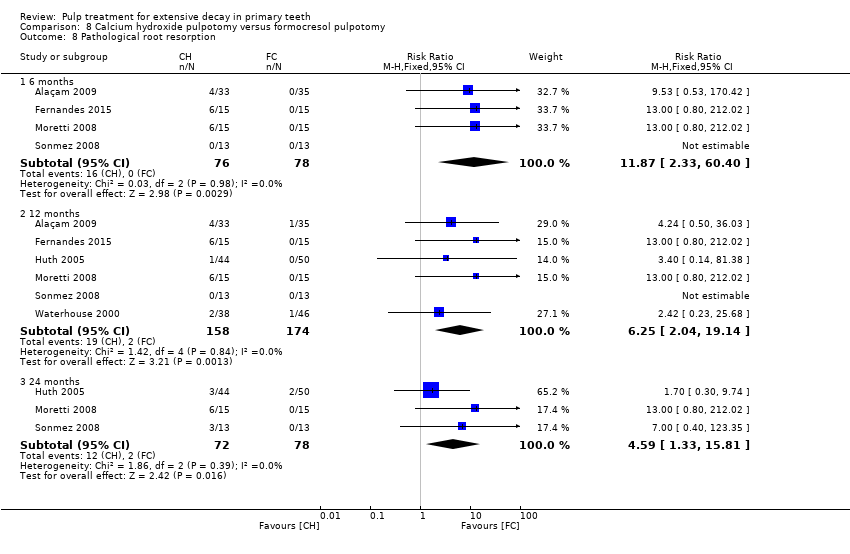
Comparison 8 Calcium hydroxide pulpotomy versus formocresol pulpotomy, Outcome 8 Pathological root resorption.
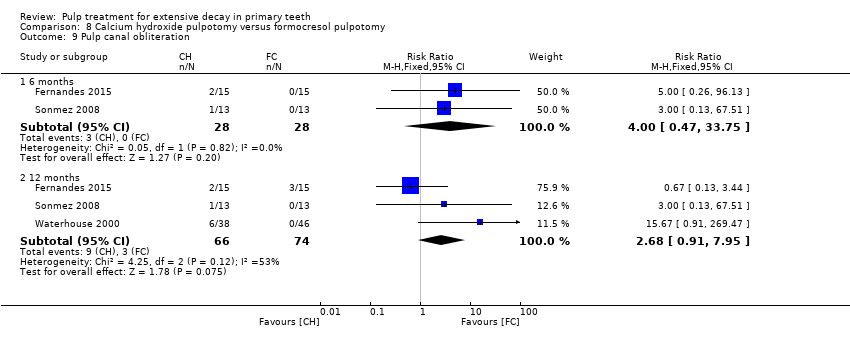
Comparison 8 Calcium hydroxide pulpotomy versus formocresol pulpotomy, Outcome 9 Pulp canal obliteration.

Comparison 8 Calcium hydroxide pulpotomy versus formocresol pulpotomy, Outcome 10 Dentin bridge formation.

Comparison 9 Calcium hydroxide pulpotomy versus ferric sulphate pulpotomy, Outcome 1 Clinical failure.

Comparison 9 Calcium hydroxide pulpotomy versus ferric sulphate pulpotomy, Outcome 2 Radiological failure.
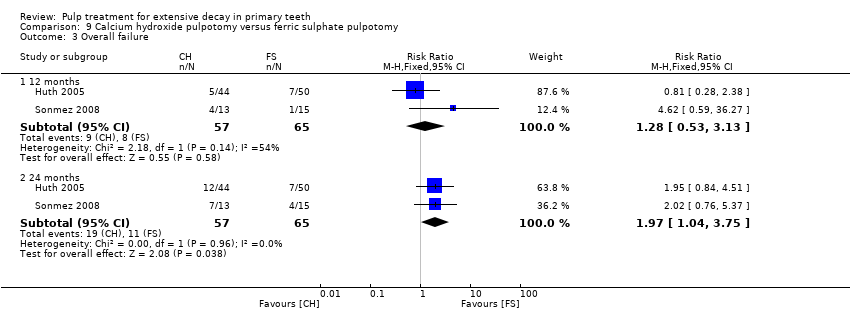
Comparison 9 Calcium hydroxide pulpotomy versus ferric sulphate pulpotomy, Outcome 3 Overall failure.
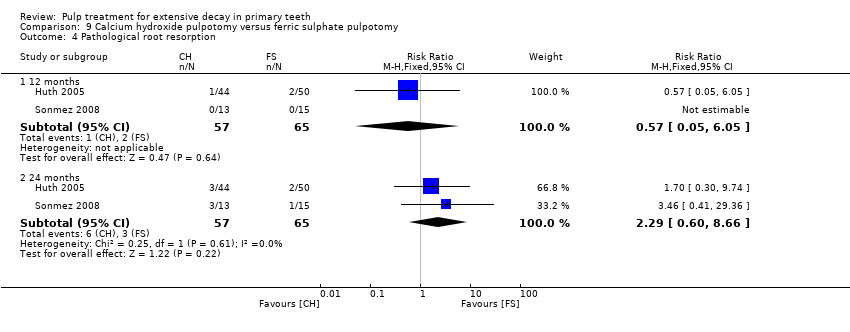
Comparison 9 Calcium hydroxide pulpotomy versus ferric sulphate pulpotomy, Outcome 4 Pathological root resorption.

Comparison 10 Ferric sulphate pulpotomy versus formocresol pulpotomy, Outcome 1 Clinical failure.
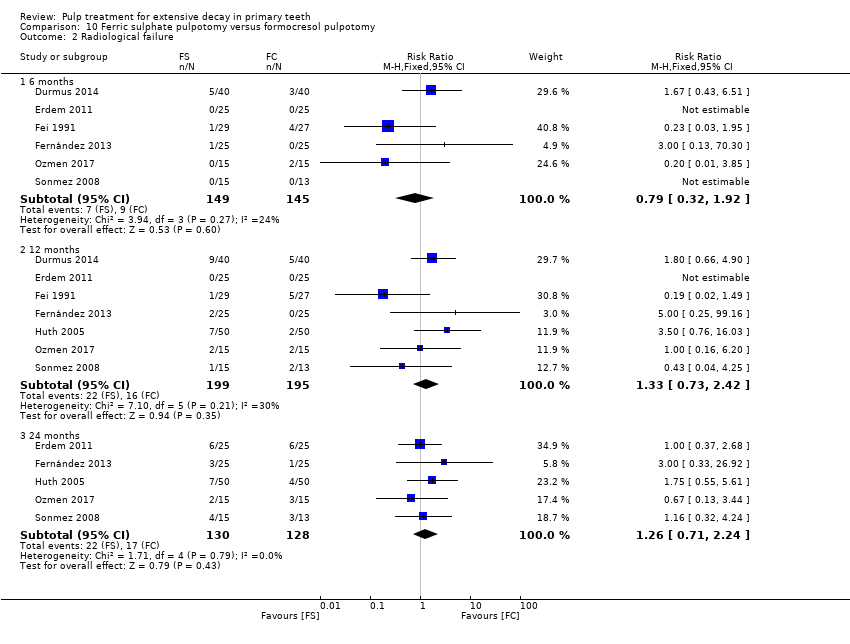
Comparison 10 Ferric sulphate pulpotomy versus formocresol pulpotomy, Outcome 2 Radiological failure.

Comparison 10 Ferric sulphate pulpotomy versus formocresol pulpotomy, Outcome 3 Overall failure.

Comparison 10 Ferric sulphate pulpotomy versus formocresol pulpotomy, Outcome 4 Pain.

Comparison 10 Ferric sulphate pulpotomy versus formocresol pulpotomy, Outcome 5 Pathological radiolucency.

Comparison 10 Ferric sulphate pulpotomy versus formocresol pulpotomy, Outcome 6 Pathological root resorption.

Comparison 10 Ferric sulphate pulpotomy versus formocresol pulpotomy, Outcome 7 Pulp canal obliteration.
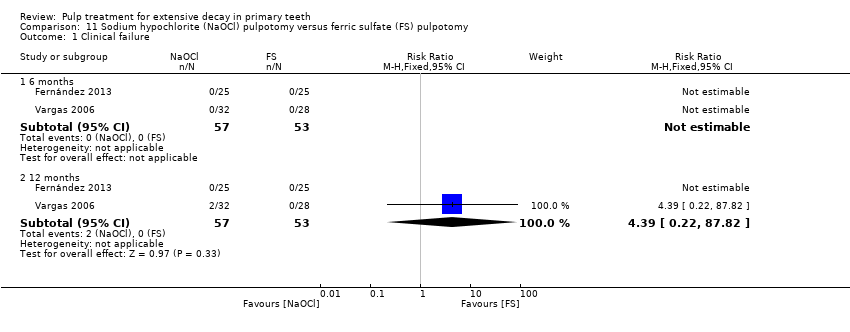
Comparison 11 Sodium hypochlorite (NaOCl) pulpotomy versus ferric sulfate (FS) pulpotomy, Outcome 1 Clinical failure.

Comparison 11 Sodium hypochlorite (NaOCl) pulpotomy versus ferric sulfate (FS) pulpotomy, Outcome 2 Radiological failure.
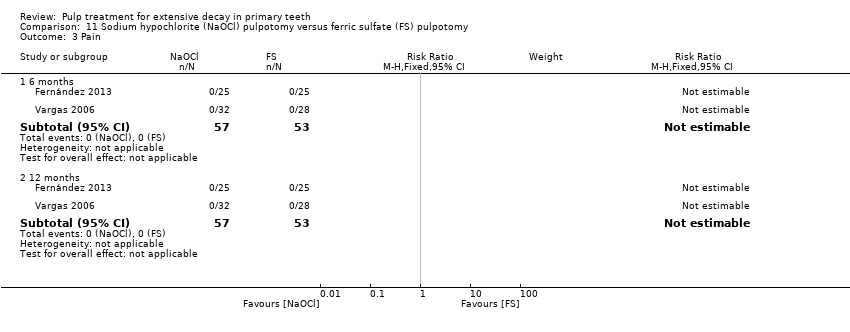
Comparison 11 Sodium hypochlorite (NaOCl) pulpotomy versus ferric sulfate (FS) pulpotomy, Outcome 3 Pain.
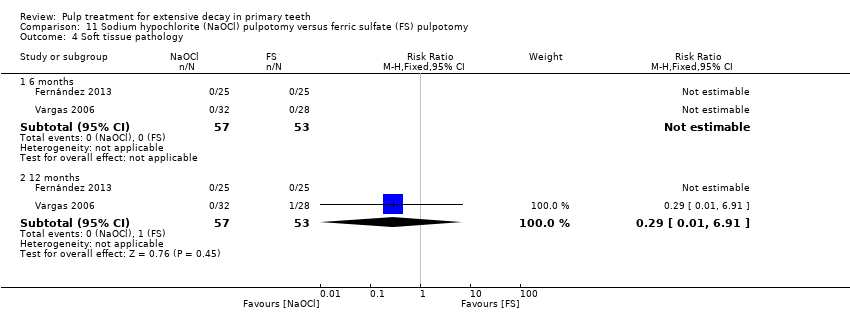
Comparison 11 Sodium hypochlorite (NaOCl) pulpotomy versus ferric sulfate (FS) pulpotomy, Outcome 4 Soft tissue pathology.
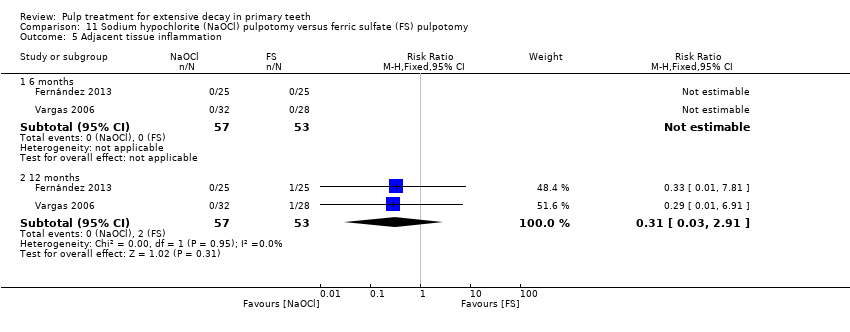
Comparison 11 Sodium hypochlorite (NaOCl) pulpotomy versus ferric sulfate (FS) pulpotomy, Outcome 5 Adjacent tissue inflammation.

Comparison 11 Sodium hypochlorite (NaOCl) pulpotomy versus ferric sulfate (FS) pulpotomy, Outcome 6 Pathologic mobility.

Comparison 11 Sodium hypochlorite (NaOCl) pulpotomy versus ferric sulfate (FS) pulpotomy, Outcome 7 Pathologic radiolucency.
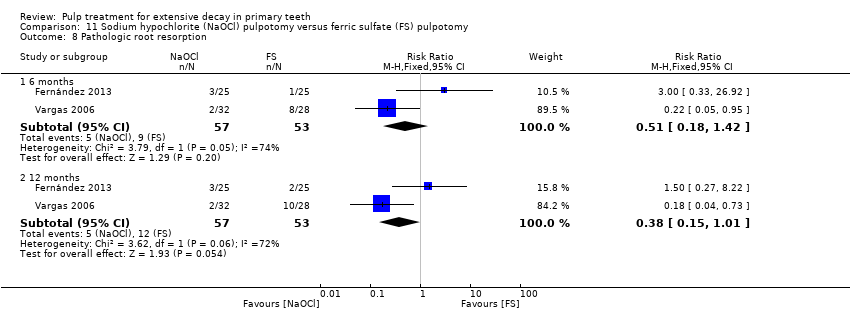
Comparison 11 Sodium hypochlorite (NaOCl) pulpotomy versus ferric sulfate (FS) pulpotomy, Outcome 8 Pathologic root resorption.

Comparison 12 Diode laser pulpotomy versus ferric sulfate (FS) pulpotomy, Outcome 1 Clinical failure.

Comparison 12 Diode laser pulpotomy versus ferric sulfate (FS) pulpotomy, Outcome 2 Radiological failure.

Comparison 12 Diode laser pulpotomy versus ferric sulfate (FS) pulpotomy, Outcome 3 Pain.

Comparison 12 Diode laser pulpotomy versus ferric sulfate (FS) pulpotomy, Outcome 4 Pathological radiolucency.
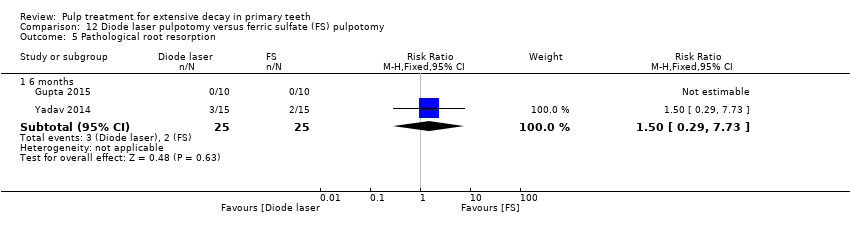
Comparison 12 Diode laser pulpotomy versus ferric sulfate (FS) pulpotomy, Outcome 5 Pathological root resorption.
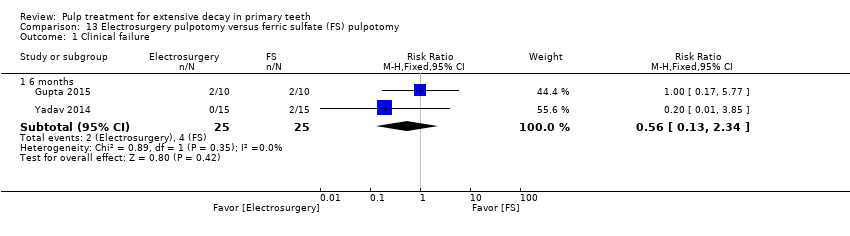
Comparison 13 Electrosurgery pulpotomy versus ferric sulfate (FS) pulpotomy, Outcome 1 Clinical failure.
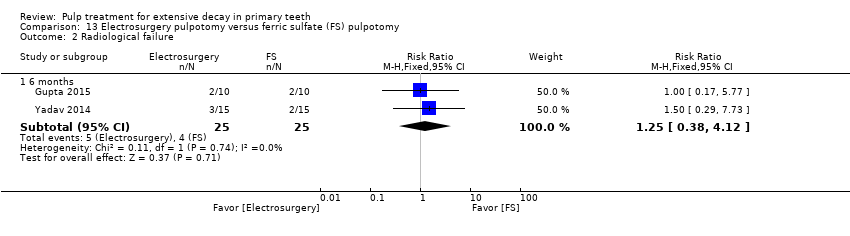
Comparison 13 Electrosurgery pulpotomy versus ferric sulfate (FS) pulpotomy, Outcome 2 Radiological failure.
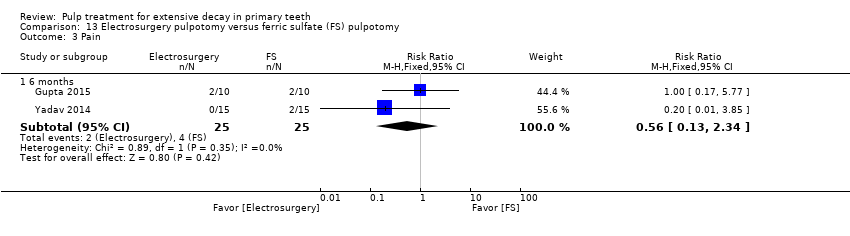
Comparison 13 Electrosurgery pulpotomy versus ferric sulfate (FS) pulpotomy, Outcome 3 Pain.

Comparison 13 Electrosurgery pulpotomy versus ferric sulfate (FS) pulpotomy, Outcome 4 Pathological mobility.

Comparison 13 Electrosurgery pulpotomy versus ferric sulfate (FS) pulpotomy, Outcome 5 Pathological root resorption.

Comparison 13 Electrosurgery pulpotomy versus ferric sulfate (FS) pulpotomy, Outcome 6 Pulp canal obliteration.

Comparison 14 Ankaferd Blood Stopper (ABS) versus Ferric Sulfate (FS) pulpotomy, Outcome 1 Clinical failure.

Comparison 14 Ankaferd Blood Stopper (ABS) versus Ferric Sulfate (FS) pulpotomy, Outcome 2 Radiological failure.

Comparison 14 Ankaferd Blood Stopper (ABS) versus Ferric Sulfate (FS) pulpotomy, Outcome 3 Pain.
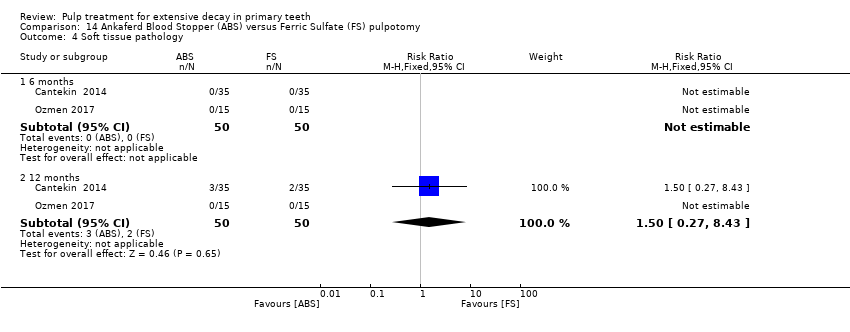
Comparison 14 Ankaferd Blood Stopper (ABS) versus Ferric Sulfate (FS) pulpotomy, Outcome 4 Soft tissue pathology.
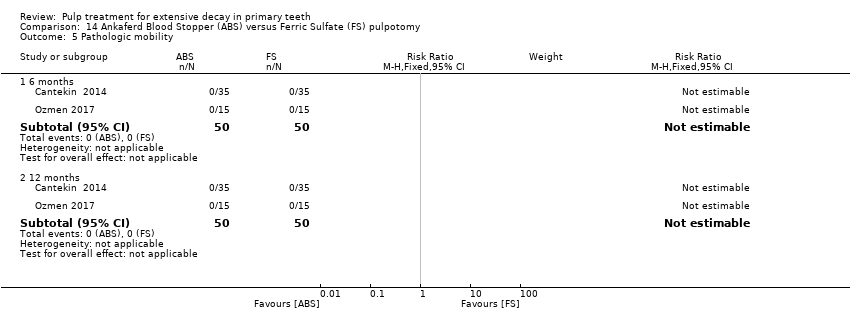
Comparison 14 Ankaferd Blood Stopper (ABS) versus Ferric Sulfate (FS) pulpotomy, Outcome 5 Pathologic mobility.

Comparison 14 Ankaferd Blood Stopper (ABS) versus Ferric Sulfate (FS) pulpotomy, Outcome 6 Pathologic radiolucency.

Comparison 14 Ankaferd Blood Stopper (ABS) versus Ferric Sulfate (FS) pulpotomy, Outcome 7 Pathologic root resorption.
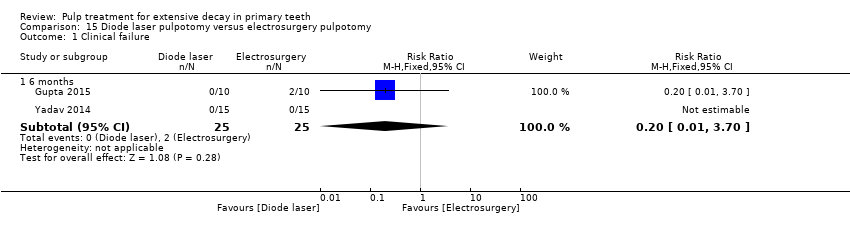
Comparison 15 Diode laser pulpotomy versus electrosurgery pulpotomy, Outcome 1 Clinical failure.

Comparison 15 Diode laser pulpotomy versus electrosurgery pulpotomy, Outcome 2 Radiological failure.

Comparison 15 Diode laser pulpotomy versus electrosurgery pulpotomy, Outcome 3 Pain.
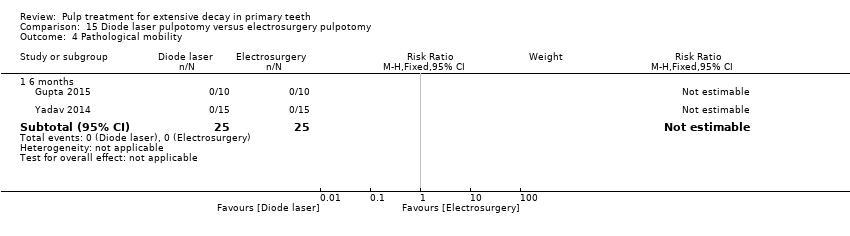
Comparison 15 Diode laser pulpotomy versus electrosurgery pulpotomy, Outcome 4 Pathological mobility.

Comparison 15 Diode laser pulpotomy versus electrosurgery pulpotomy, Outcome 5 Pathological radiolucency.
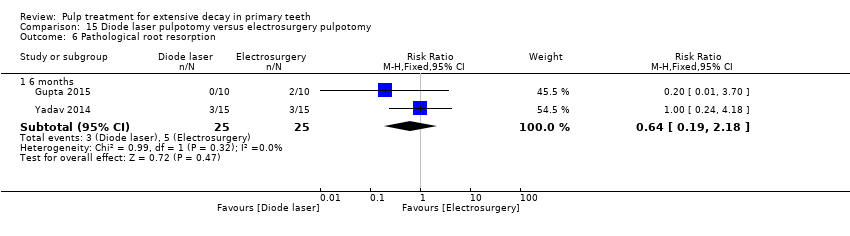
Comparison 15 Diode laser pulpotomy versus electrosurgery pulpotomy, Outcome 6 Pathological root resorption.

Comparison 15 Diode laser pulpotomy versus electrosurgery pulpotomy, Outcome 7 Pulp canal obliteration.

Comparison 16 Sodium hypochlorite (NaOCl) pulpotomy versus 1:5 diluted formocresol pulpotomy, Outcome 1 Clinical failure.

Comparison 16 Sodium hypochlorite (NaOCl) pulpotomy versus 1:5 diluted formocresol pulpotomy, Outcome 2 Radiological failure.
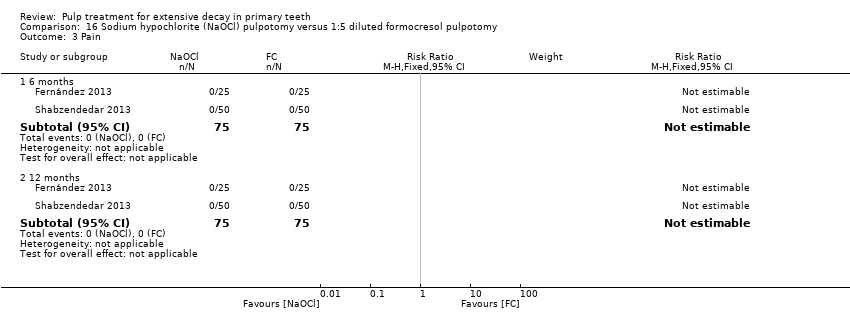
Comparison 16 Sodium hypochlorite (NaOCl) pulpotomy versus 1:5 diluted formocresol pulpotomy, Outcome 3 Pain.

Comparison 16 Sodium hypochlorite (NaOCl) pulpotomy versus 1:5 diluted formocresol pulpotomy, Outcome 4 Soft tissue pathology.

Comparison 16 Sodium hypochlorite (NaOCl) pulpotomy versus 1:5 diluted formocresol pulpotomy, Outcome 5 Pathologic mobility.

Comparison 16 Sodium hypochlorite (NaOCl) pulpotomy versus 1:5 diluted formocresol pulpotomy, Outcome 6 Pathologic radiolucency.

Comparison 16 Sodium hypochlorite (NaOCl) pulpotomy versus 1:5 diluted formocresol pulpotomy, Outcome 7 Pathologic root resorption.

Comparison 17 Enamel matrix derivative (EMD) pulpotomy versus formocresol pulpotomy, Outcome 1 Clinical failure.

Comparison 17 Enamel matrix derivative (EMD) pulpotomy versus formocresol pulpotomy, Outcome 2 Pain.

Comparison 17 Enamel matrix derivative (EMD) pulpotomy versus formocresol pulpotomy, Outcome 3 Soft tissue pathology.

Comparison 17 Enamel matrix derivative (EMD) pulpotomy versus formocresol pulpotomy, Outcome 4 Pathologic mobility.
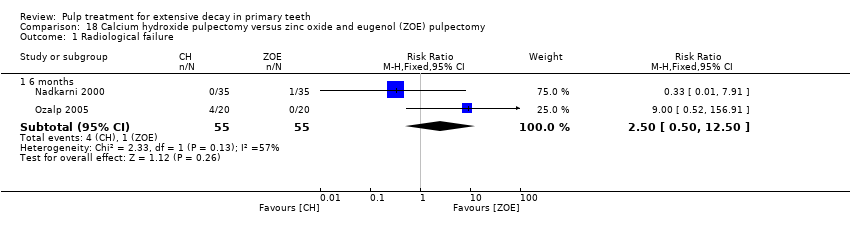
Comparison 18 Calcium hydroxide pulpectomy versus zinc oxide and eugenol (ZOE) pulpectomy, Outcome 1 Radiological failure.

Comparison 18 Calcium hydroxide pulpectomy versus zinc oxide and eugenol (ZOE) pulpectomy, Outcome 2 Pain.

Comparison 18 Calcium hydroxide pulpectomy versus zinc oxide and eugenol (ZOE) pulpectomy, Outcome 3 Pathological mobility.
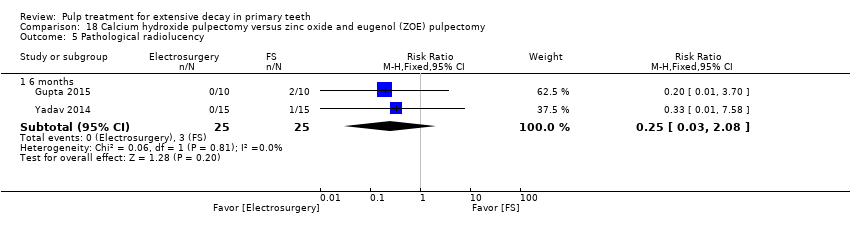
Comparison 18 Calcium hydroxide pulpectomy versus zinc oxide and eugenol (ZOE) pulpectomy, Outcome 4 Pathological radiolucency.
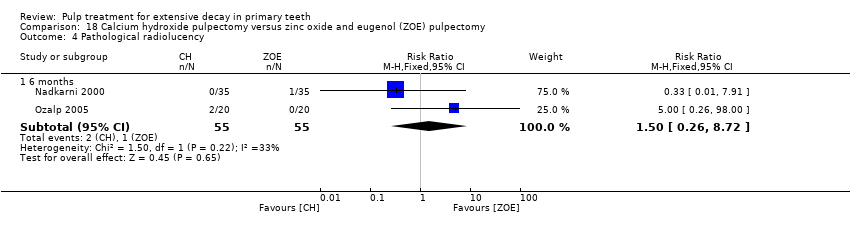
Comparison 18 Calcium hydroxide pulpectomy versus zinc oxide and eugenol (ZOE) pulpectomy, Outcome 5 Pathological radiolucency.

Comparison 19 Metapex versus zinc oxide eugenol (ZOE) pulpectomy, Outcome 1 Clinical failure.
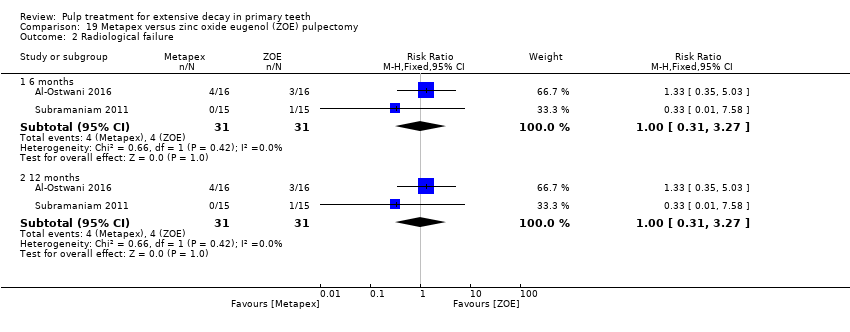
Comparison 19 Metapex versus zinc oxide eugenol (ZOE) pulpectomy, Outcome 2 Radiological failure.

Comparison 20 Metapex pulpectomy versus Endoflas pulpectomy, Outcome 1 Clincal failure.

Comparison 20 Metapex pulpectomy versus Endoflas pulpectomy, Outcome 2 Radiological failure.
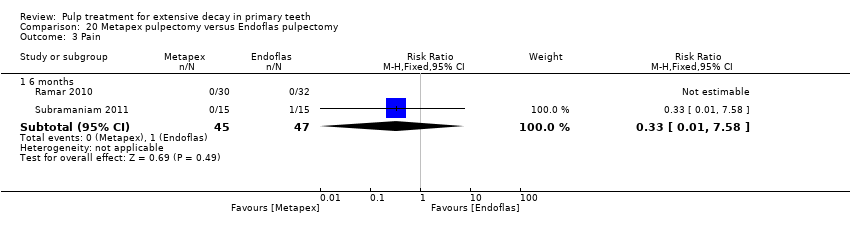
Comparison 20 Metapex pulpectomy versus Endoflas pulpectomy, Outcome 3 Pain.

Comparison 20 Metapex pulpectomy versus Endoflas pulpectomy, Outcome 4 Soft tissue pathology.

Comparison 20 Metapex pulpectomy versus Endoflas pulpectomy, Outcome 5 Pathologic mobility.

Comparison 20 Metapex pulpectomy versus Endoflas pulpectomy, Outcome 6 Pathological radiolucency.

Comparison 20 Metapex pulpectomy versus Endoflas pulpectomy, Outcome 7 Pathological root resorption.

Comparison 21 Vitapex pulpectomy versus zinc oxide and eugenol (ZOE) pulpectomy, Outcome 1 Clinical failure.
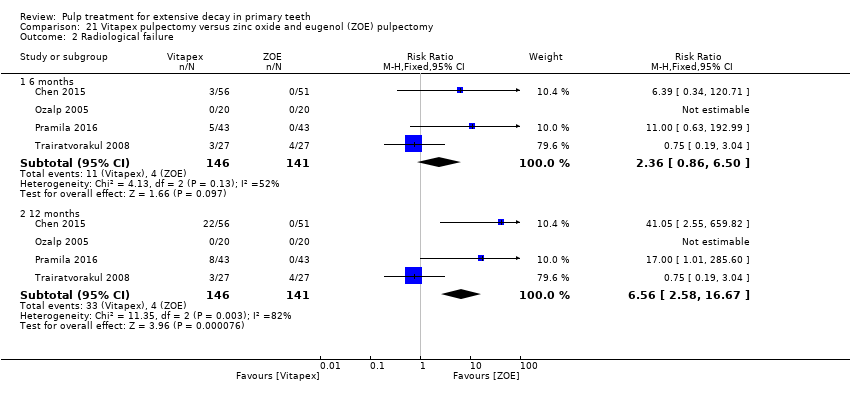
Comparison 21 Vitapex pulpectomy versus zinc oxide and eugenol (ZOE) pulpectomy, Outcome 2 Radiological failure.
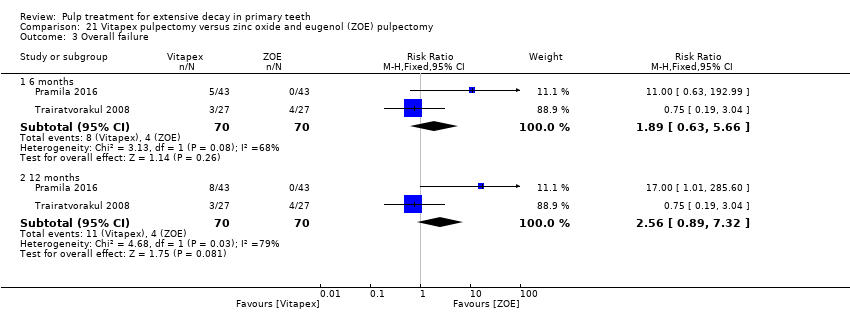
Comparison 21 Vitapex pulpectomy versus zinc oxide and eugenol (ZOE) pulpectomy, Outcome 3 Overall failure.

Comparison 21 Vitapex pulpectomy versus zinc oxide and eugenol (ZOE) pulpectomy, Outcome 4 Pain.
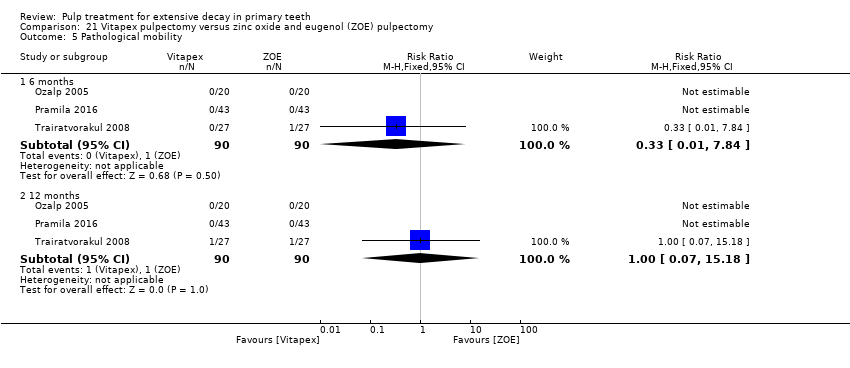
Comparison 21 Vitapex pulpectomy versus zinc oxide and eugenol (ZOE) pulpectomy, Outcome 5 Pathological mobility.

Comparison 22 Endoflas pulpectomy versus zinc oxide eugenol (ZOE) pulpectomy, Outcome 1 Clinical failure.
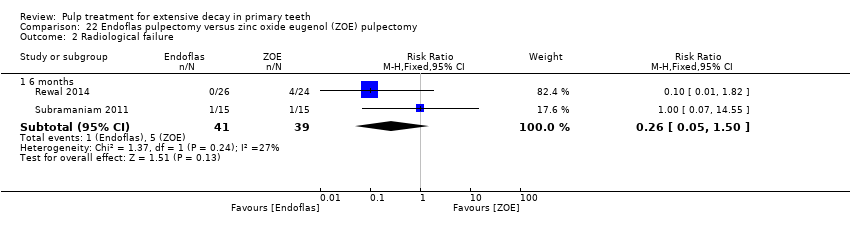
Comparison 22 Endoflas pulpectomy versus zinc oxide eugenol (ZOE) pulpectomy, Outcome 2 Radiological failure.

Comparison 22 Endoflas pulpectomy versus zinc oxide eugenol (ZOE) pulpectomy, Outcome 3 Pain.
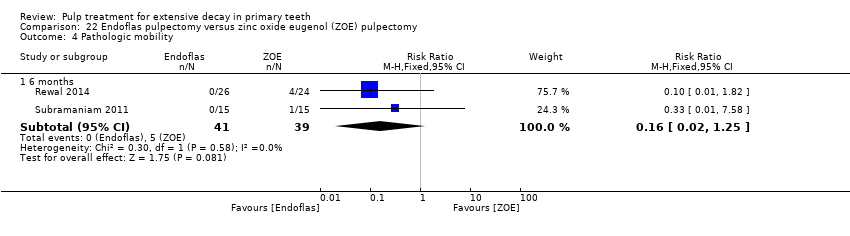
Comparison 22 Endoflas pulpectomy versus zinc oxide eugenol (ZOE) pulpectomy, Outcome 4 Pathologic mobility.

Comparison 22 Endoflas pulpectomy versus zinc oxide eugenol (ZOE) pulpectomy, Outcome 5 Pathologic radiolucency.
| Pulpotomy compared with pulpotomy using alternative medicament/technique for extensive decay in primary teeth | ||||||
| Population: children with extensive decay in primary teeth Settings: primary care Intervention: pulpotomy with one type of medicament Comparison: pulpotomy using alternative medicament or different technique | ||||||
| Outcomes | Illustrative comparative risks* (95% CI) | Relative effect | Number of participants | Quality of the evidence | Comments | |
| Assumed risk | Corresponding risk | |||||
| Control | Experimental | |||||
| MTA versus formocresol | ||||||
| Clinical failure (12 months) | 28 per 1000 | 8.6 per 1000 (2.8 per 1000 to 26.0 per 1000) | RR 0.31 (0.10 to 0.93) | 740 (12 studies) | ⊕⊕⊕⊝ | Failure rate less than 3% across both the MTA and formocresol treatment groups. Seven of the 12 studies had no failures at 12 months. No evidence of a difference in clinical failure at 6 months or 24 months |
| Radiological failure (12 months) | 50 per 1000 | 20.5 per 1000 (9.5 per 1000 to 44.5 per 1000) | RR 0.41 (0.19 to 0.89) | 740 (12 studies) | ⊕⊕⊕⊝ | Failure rate 5% across formocresol treatment groups and 2.1% across MTA treatment groups. Five of the 12 studies had no failures at 12 months. Results similar at 6 and 24 months |
| MTA versus calcium hydroxide | ||||||
| Clinical failure (12 months) | 14 per 1000 | 2.2 per 1000 (0.02 per 1000 to 9.8 per 1000) | RR 0.16 (0.04 to 0.70) | 150 (4 studies) | ⊕⊕⊕⊝ | Results similar at 24 months. No evidence of a difference in clinical failure at 6 months |
| Radiological failure (12 months) | 351 per 1000 | 42.1 per 1000 (14 per 1000 to 126.4 per 1000) | RR 0.12 (0.04 to 0.36) | 150 (4 studies) | ⊕⊕⊝⊝ | Results similar at 6 and 24 months |
| Calcium hydroxide versus formocresol | ||||||
| Clinical failure (12 months) | 115 per 1000 | 215 per 1000 (140.3 per 1000 to 332.4 per 1000) | RR 1.87 (1.22 to 2.89) | 332 (6 studies) | ⊕⊕⊕⊝ | Results similar at 6 months No evidence of a difference in clinical failure at 24 months |
| Radiological failure (12 months) | 253 per 1000 | 470.6 per 1000 (359.3 per 1000 to 617.3 per 1000) | RR 1.86 (1.42 to 2.44) | 332 (6 studies) | ⊕⊕⊕⊝ | Results similar at 6 and 24 months |
| Other comparisons assessed in more than one trial that had treatment failures | ||||||
| Clinical failure (at six, 12 and 24 months) | The quality of the evidence waslow for 4 comparisons3: laser versus ferric sulphate; Biodentine versus MTA; ferric sulphate versus formocresol; electrosurgery versus ferric sulphate; calcium hydroxide versus ferric sulphate. The quality of the evidence was very low for 5 comparisons: NaOCl versus ferric sulphate4; laser versus electrosurgery4; MTA versus ferric sulphate5; ABS versus ferric sulphate6; EMD versus formocresol7. | |||||
| Radiological failure (at six, 12 and 24 months) | The quality of the evidence waslow for 8 comparisons: NaOCl versus ferric sulphate2; MTA versus ferric sulphate3; Biodentine versus MTA3; ferric sulphate versus formocresol3; laser versus ferric sulphate3; electrosurgery versus ferric sulphate3; ABS versus ferric sulphate3; laser versus electrosurgery3; calcium hydroxide versus ferric sulphate (favouring ferric sulphate)3. | |||||
| *The basis for the assumed risk (e.g. the median control group risk across studies) is provided in footnotes. The corresponding risk (and its 95% confidence interval) is based on the assumed risk in the comparison group and the relative effect of the intervention (and its 95% CI). | ||||||
| GRADE Working Group grades of evidence | ||||||
| 1. Downgraded 1 level due to high risk of bias | ||||||
| Pulpectomy compared with pulpectomy using alternative medicament for extensive decay in primary teeth | ||||||
| Population: children with extensive decay in primary teeth Settings: primary care Intervention: pulpectomy with 1 type of medicament Comparison: pulpectomy using alternative medicament | ||||||
| Outcomes | Illustrative comparative risks* (95% CI) | Relative effect | Number of Participants | Quality of the evidence | Comments | |
| Assumed risk | Corresponding risk | |||||
| Control | Experimental | |||||
| Endoflas versus ZOE | ||||||
| Clinical failure (6 months) | 128 per 1000 | 33.3 per 1000 (6.4 per 1000 to 192 per 1000) | RR 0.26 (0.05 to 1.50) | 80 (2 studies) | ⊕⊕⊕⊝ | One trial assessed failure at 12 months: RR 1.00, 95% 0.07 to 14.55 |
| Radiological failure (6 months) | 128 per 1000 | 33.3 per 1000 (6.4 per 1000 to 192 per 1000) | RR 0.26 (0.05 to 1.50) | 80 (2 studies) | ⊕⊕⊕⊝ | |
| Metapex versus ZOE | ||||||
| Clinical failure (12 months) | 97 per 1000 | 68.9 per 1000 (14.6 per 1000 to 323 per 1000) | RR 0.71 (0.15 to 3.33) | 62 (2 studies) | ⊕⊕⊕⊝ | Results similar at 6 months |
| Radiological failure (12 months) | 129 per 1000 | 129 per 1000 (40 per 1000 to 421.8 per 1000) | RR 1.00 (0.31 to 3.27) | 62 (2 studies) | ⊕⊕⊕⊝ | Results similar at 6 months |
| Other comparisons assessed in more than one trial that had treatment failures | ||||||
| Clinical failure | The quality of the evidence was rated as low for 1 comparison: Vitapex versus ZOE (favouring ZOE)2 | |||||
| Radiological failure | The quality of the evidence was rated as low for 2 comparisons: Vitapex versus ZOE2 (favouring ZOE); calcium hydroxide versus ZOE3 | |||||
| 1. Downgraded 1 level due to imprecision | ||||||
| Direct pulp capping compared with direct pulp capping using alternative medicament for extensive decay in primary teeth | ||||||
| Population: children with extensive decay in primary teeth Settings: primary care Intervention: direct pulp capping with 1 type of medicament Comparison: direct pulp capping using alternative medicament | ||||||
| Outcomes | Illustrative comparative risks* (95% CI) | Relative effect | Number of participants | Quality of the evidence | Comments | |
| Assumed risk | Corresponding risk | |||||
| Control | Experimental | |||||
| Seven trials evaluated 22 comparisons of different medicaments for direct pulp capping. Each comparison was assessed by a single trial. There were no clinical or radiological failures in two comparisons: acetone‐based total‐etch adhesive versus calcium hydroxide; MTA versus calcium hydroxide. | ||||||
| Clinical failure (at six, 12 and 24 months) | The quality of the evidence was assessed as low for 5 comparisons1: calcium hydroxide versus formocresol (favouring formocrescol), MTA versus 3Mix and MTA versus simvastatin (favouring MTA), 3Mix versus 3Mixtatin and 3Mixtatin versus simvastatin (favouring 3Mixtatin). The quality of the evidence was rated as very low for all other comparisons.2 | |||||
| Radiological failure (at six, 12 and 24 months) | The quality of the evidence was rated as low for 1 comparison: calcium hydroxide versus formocresol1 (favouring formocresol). The quality of the evidence was rated as very low for all other comparisons.2 | |||||
| *The basis for the assumed risk (e.g. the median control group risk across studies) is provided in footnotes. The corresponding risk (and its 95% confidence interval) is based on the assumed risk in the comparison group and the relative effect of the intervention (and its 95% CI). | ||||||
| GRADE Working Group grades of evidence | ||||||
| 1. Downgraded 1 level due to risk of bias and 1 level due to imprecision | ||||||
| Outcome | Time point (months) | No. of studies | Risk ratio (95% CI) |
| Pain | mean 22 | 1 | Not estimable* |
| Soft tissue pathology | mean 22 | 1 | Not estimable* |
| Pathological mobility | mean 22 | 1 | Not estimable* |
| Pathological radiolucency | mean 22 | 1 | 3.46 (0.17 to 70.69) |
| Pathological root resorption | mean 22 | 1 | 2.75 (0.82 to 9.29) |
| Pulp canal obliteration | mean 22 | 1 | 0.83 (0.51 to 1.33) |
| *due to lack of events Abbreviations ‐ CI: confidence interval; FS: ferric sulphate; MTA: mineral trioxide aggregate | |||
| Outcome | Time point (months) | No. of studies | Risk ratio (95% CI) |
| Clinical failure | 6, 12 and 18 | 1 | Not estimable* |
| Radiological failure | 6 | 1 | Not estimable* |
| 12 | 1 | 0.33 (0.04 to 2.94) | |
| 18 | 1 | 0.33 (0.04 to 2.94) | |
| Pathological root resorption | 6 | 1 | Not estimable* |
| 12 | 1 | 0.33 (0.04 to 2.94) | |
| 18 | 1 | 0.33 (0.04 to 2.94) | |
| *due to lack of events Abbreviations ‐ CEM: calcium‐enriched mixture; CI: confidence interval; MTA: mineral trioxide aggregate | |||
| Outcome | Time point (months) | No. of studies | Risk ratio (95% CI) |
| Clinical failure | 6 and 12 | 1 | Not estimable* |
| 24 | 1 | 0.33 (0.01, 7.81) | |
| Radiological failure | 6 and 12 | 1 | 0.14 (0.01, 2.63) |
| 24 | 1 | 0.33 (0.04, 2.99) | |
| Overall failure | 24 | 1 | 0.33 (0.04, 2.99) |
| Pain | 6, 12 and 24 months | 1 | Not estimable* |
| Soft tissue pathology | 6 and 12 | 1 | Not estimable* |
| 24 | 1 | 0.33 (0.01, 7.81) | |
| Pathologic mobility | 6, 12 and 24 months | 1 | Not estimable* |
| Pathologic radiolucency | 6, 12 and 24 months | 1 | Not estimable* |
| Pathologicroot resorption | 6 and 12 | 1 | 0.14 (0.01, 2.63) |
| 24 | 1 | 0.33 (0.04, 2.99) | |
| *due to lack of events Abbreviations ‐ CI: confidence interval; MTA: mineral trioxide aggregate; NaOCl: sodium hypochlorite | |||
| Outcome | Time point (months) | No. of studies | Risk ratio (95% CI) |
| Clinical failure | 6 and 12 | 1 | Not estimable* |
| Radiological failure | 6 | 1 | Not estimable* |
| 12 | 1 | 0.09 (0.01, 1.58) | |
| Soft tissue pathology | 6 and 12 | 1 | Not estimable* |
| Pathologic mobility | 6 and 12 | 1 | Not estimable* |
| Adjacent tissue inflammation | 6 and 12 | 1 | Not estimable* |
| Pathologic radiolucency | 6 | 1 | Not estimable* |
| 12 | 1 | 0.14 (0.01, 2.66) | |
| Pathologicroot resorption | 6 | 1 | Not estimable* |
| 12 | 1 | 0.14 (0.01, 2.66) | |
| Pulp canal obliteration | 6 | 1 | Not estimable* |
| 12 | 1 | 0.44 (0.15, 1.29) | |
| *due to lack of events Abbreviations ‐ CI: confidence interval; MTA: mineral trioxide aggregate; CH: calcium hydroxyde; NaOCl; sodium hypochlorite | |||
| Outcome | Time point (months) | No. of studies | Risk ratio (95% CI) |
| Clinical failure | 6 and 12 | 1 | Not estimable* |
| Radiological failure | 6 | 1 | Not estimable* |
| 12 | 1 | 0.20 (0.02, 1.61) | |
| Soft tissue pathology | 6 and 12 | 1 | Not estimable* |
| Pathologic mobility | 6 and 12 | 1 | Not estimable* |
| Adjacent tissue inflammation | 6 and 12 | 1 | Not estimable* |
| Pathologic radiolucency | 6 | 1 | Not estimable* |
| 12 | 1 | 0.14 (0.01, 2.66) | |
| Pathologic root resorption | 6 | 1 | Not estimable* |
| 12 | 1 | 0.33 (0.04, 3.03) | |
| Pulp canal obliteration | 6 | 1 | Not estimable* |
| 12 | 1 | 0.67 (0.27, 1.65) | |
| *due to lack of events Abbreviations ‐ CI: confidence interval; MTA: mineral trioxide aggregate; NaOCl; sodium hypochlorite; CH: calcium hydroxyde. | |||
| Outcome | Time point (months) | No. of studies | Risk ratio (95% CI) |
| Pain | 6 | 1 | 0.06 (0.00, 0.98) |
| Soft tissue pathology | 6 | 1 | 0.08 (0.00, 1.31) |
| Pathologic mobility | 6 | 1 | 0.06 (0.00, 0.98) |
| Pathologic radiolucency | 6 | 1 | 0.03 (0.00, 0.55) |
| Pathologic root resorption | 6 | 1 | 0.05 (0.00, 0.78) |
| Pulp canal obliteration | 6 | 1 | 0.11 (0.01, 1.98) |
| *due to lack of events Abbreviations ‐ CI: confidence interval; MTA: mineral trioxide aggregate. | |||
| Outcome | Time point (months) | No. of studies | Risk ratio (95% CI) |
| Clinical failure | 6 | 1 | Not estimable* |
| 12 | 1 | Not estimable* | |
| 24 | 1 | 0.20 (0.03 to 1.59) | |
| Radiological failure | 6 | 1 | 0.33 (0.01 to 7.81) |
| 12 | 1 | 0.20 (0.01 to 3.97) | |
| 24 | 1 | 0.10 (0.01 to 0.72) | |
| Overall failure | 6 | 1 | 0.33 (0.01 to 7.81) |
| 12 | 1 | 0.20 (0.01 to 3.97) | |
| 24 | 1 | 0.13 (0.02 to 0.93) | |
| Pain | 6 | 1 | Not estimable* |
| 12 | 1 | Not estimable* | |
| 24 | 1 | 3.00 (0.13 to 70.30) | |
| Pathological radiolucency | 6 | 1 | Not estimable* |
| 12 | 1 | Not estimable* | |
| 24 | 1 | 3.00 (0.13 to 70.30) | |
| Pathological root resorption | 6 | 1 | 0.33 (0.01 to 7.81) |
| 12 | 1 | 0.33 (0.01 to 7.81) | |
| 24 | 1 | 0.08 (0.00 to 1.30) | |
| Pulp canal obliteration | 6 | 1 | Not estimable* |
| 12 | 1 | 3.00 (0.13 to 70.30) | |
| 24 | 1 | 11.0 (0.64 to 188.96) | |
| Physiological root resorption | 6 | 1 | Not estimable* |
| 12 | 1 | Not estimable* | |
| 24 | 1 | 0.20 (0.01 to 3.97) | |
| *due to lack of events Abbreviations ‐ CI: confidence interval; MTA: mineral trioxide aggregate; ZOE: zinc oxide and eugenol | |||
| Outcome | Time point (months) | No. of studies | Risk ratio (95% CI) |
| Clinical failure | 15.7 | 1 | Not estimable* |
| Radiological failure | 15.7 | 1 | 4.00 (0.48 to 33.42) |
| Overall failure | 15.7 | 1 | 2.00 (0.40 to 9.99) |
| Pathological radiolucency | 15.7 | 1 | 3.00 (0.33 to 26.99) |
| Pathological root resorption | 15.7 | 1 | 1.50 (0.27 to 8.25) |
| *due to lack of events Abbreviations ‐ CI: confidence interval; FC: formocresol; MTA: mineral trioxide aggregate; ZOE: zinc oxide and eugenol | |||
| Outcome | Time point (months) | No. of studies | Risk ratio (95% CI) |
| Clinical failure | 6, 12 and 24 | 1 | 0.14 (0.01, 2.67) |
| Radiological failure | 24 | 1 | 0.29 (0.06, 1.28) |
| Overall failure | 6, 12 and 24 | 1 | 0.14 (0.01, 2.67) |
| Pain | 6, 12 and 24 | 1 | 0.33 (0.01, 7.91) |
| Soft tissue pathology | 6, 12 and 24 | 1 | 0.20 (0.01, 4.02) |
| Pathologic mobility | 6, 12 and 24 | 1 | 0.20 (0.01, 4.02) |
| Pathologic radiolucency | 24 | 1 | 0.40 (0.08, 1.93) |
| Pathologic root resorption | 24 | 1 | 0.20 (0.01, 4.02) |
| Abbreviations ‐ CI: confidence interval; MTA: mineral trioxide aggregate; EMD: enamel matrix derivative | |||
| Outcome | Time point (months) | No. of studies | Risk ratio (95% CI) |
| Clinical failure | 6 and 12 | 1 | 3.21 (0.14, 75.68) |
| Radiological failure | 6 | 1 | 9.64 (0.54, 171.09) |
| 12 | 1 | 2.69 (0.57, 12.70) | |
| Pathological radiolucency | 6 | 1 | 3.21 (0.14, 75.68) |
| 12 | 1 | 2.15 (0.43, 10.79) | |
| Pathological root resorption | 6 | 1 | 6.44 (0.83, 50.11) |
| 12 | 1 | 4.30 (1.00, 18.47) | |
| Pulp canal obliteration | 6 | 1 | 3.76 (0.85, 16.54) |
| 12 | 1 | 1.61 (0.78, 3.33) | |
| Dentine bridge formation | 6 | 1 | 0.15 (0.01, 2.83) |
| 12 | 1 | 0.07 (0.00, 1.19) | |
| Abbreviation: CI: confidence interval | |||
| Outcome | Time point (months) | No. of studies | Risk ratio (95% CI) |
| Clinical failure | 6 and 12 | 1 | Not estimable* |
| Radiological failure | 6 and 12 | 1 | 0.33 (0.01, 7.88) |
| Soft tissue pathology | 6 and 12 | 1 | Not estimable* |
| Pathologic mobility | 6 and 12 | 1 | Not estimable* |
| Adjacent tissue inflammation | 6 and 12 | 1 | Not estimable* |
| Pathologic radiolucency | 6 and 12 | 1 | Not estimable* |
| Pathologic root resorption | 6 and 12 | 1 | 0.33 (0.01, 7.88) |
| Pulp canal obliteration | 6 | 1 | Not estimable* |
| 12 | 1 | 0.67 (0.21, 2.13) | |
| * due to lack of events Abbreviations ‐ CI: confidence interval; MTA: mineral trioxide aggregate; NaOCl; sodium hypochlorite. | |||
| Outcome | Time point (months) | No. of studies | Risk ratio (95% CI) |
| Clinical failure | 6 | 1 | Not estimable* |
| 12 | 1 | 0.33 (0.01, 7.98) | |
| Radiological failure | 6 | 1 | 1.00 (0.06, 15.52) |
| 12 | 1 | 0.50 (0.05, 5.33) | |
| Pain | 6 and 12 | 1 | Not estimable* |
| Soft tissue pathology | 6 | 1 | Not estimable* |
| 12 | 1 | 0.33 (0.01, 7.98) | |
| Pathologic mobility | 6 and 12 | 1 | Not estimable* |
| Pathologic radiolucency | 6 | 1 | 0.33 (0.01, 7.98) |
| 12 | 1 | 0.20 (0.01, 4.06) | |
| Pathologic root resorption | 6 | 1 | 3.00 (0.13, 71.82) |
| 12 | 1 | 1.00 (0.06, 15.52) | |
| *due to lack of events Abbreviation: CI: confidence interval. | |||
| Outcome | Time point (months) | No. of studies | Risk ratio (95% CI) |
| Clinical failure | 6 and 12 | 1 | Not estimable* |
| Radiological failure | 6 and 12 | 1 | 0.35 (0.04, 3.22) |
| Pain | 6 and 12 | 1 | Not estimable* |
| Soft tissue pathology | 6 and 12 | 1 | Not estimable* |
| Pathologic mobility | 6 and 12 | 1 | Not estimable* |
| Pathologic radiolucency | 6 and 12 | 1 | 0.35 (0.01, 8.32) |
| Pathologic root resorption | 6 and 12 | 1 | 0.35 (0.04, 3.22) |
| *due to lack of events Abbreviation: CI: confidence interval. | |||
| Outcome | Time point (months) | No. of studies | Risk ratio (95% CI) |
| Clinical failure | 6 | 1 | Not estimable* |
| 12 | 1 | 3.13 (0.13, 74.85) | |
| Radiological failure | 6 | 1 | 0.35 (0.04, 3.22) |
| 12 | 1 | 0.70 (0.12, 3.98) | |
| Pain | 6 and 12 | 1 | Not estimable* |
| Soft tissue pathology | 6 | 1 | Not estimable* |
| 12 | 1 | 3.13 (0.13, 74.85) | |
| Pathologic mobility | 6 and 12 | 1 | Not estimable* |
| Pathologic radiolucency | 6 | 1 | 1.04 (0.07, 16.19) |
| 12 | 1 | 2.09 (0.20, 22.24) | |
| Pathologic root resorption | 6 | 1 | 0.15 (0.01, 2.81) |
| 12 | 1 | 0.35 (0.04, 3.22) | |
| *due to lack of events Abbreviation: CI: confidence interval. | |||
| Outcome | Time point (months) | No. of studies | Risk ratio (95% CI) |
| Clinical failure | 6 | 1 | 5.00 (0.26, 96.13) |
| 12 and 24 | 1 | 13.00 (0.80, 212.02) | |
| Radiological failure | 6 | 1 | 13.00 (0.80, 212.02) |
| 12 | 1 | 17.00 (1.07 to 270.41) | |
| 24 | 1 | 21.00 (1.34 to 328.86) | |
| Soft tissue pathology | 6 | 1 | 5.00 (0.26, 96.13) |
| 12 and 24 | 1 | 13.00 (0.80, 212.02) | |
| Pathologic mobility | 6 | 1 | 5.00 (0.26, 96.13) |
| 12 and 24 | 1 | 13.00 (0.80, 212.02) | |
| Adjacent tissue inflammation | 6, 12 and 24 | 1 | Not estimable * |
| Pathologic radiolucency | 6 | 1 | 13.00 (0.80, 212.02) |
| 12 | 1 | 17.00 (1.07 to 270.41) | |
| 24 | 1 | 21.00 (1.34 to 328.86) | |
| Pathologic root resorption | 6 | 1 | 13.00 (0.80, 212.02) |
| 12 | 1 | 17.00 (1.07 to 270.41) | |
| 24 | 1 | 21.00 (1.34 to 328.86) | |
| Dentine bridge formation | 6, 12 and 24 | 1 | 0.50 (0.11 to 2.33) |
| *due to lack of events Abbreviations ‐ CI: confidence interval; CH: calcium hydroxide; PC: Portland cement. | |||
| Outcome | Time point (months) | No. of studies | Risk ratio (95% CI) |
| Clinical failure | 6 | 1 | Not estimable* |
| 12 | 1 | 3.00 (0.13, 70.92) | |
| Radiological failure | 6 | 1 | 5.00 (0.62, 40.36) |
| 12 | 1 | 8.00 (1.06, 60.21) | |
| Soft tissue pathology | 6 | 1 | Not estimable* |
| 12 | 1 | 3.00 (0.13, 70.92) | |
| Pathologic mobility | 6 and 12 | 1 | Not estimable* |
| Adjacent tissue inflammation | 6 and 12 | 1 | Not estimable* |
| Pathologic radiolucency | 6 | 1 | Not estimable* |
| 12 | 1 | 15.00 (0.89, 251.77) | |
| Pathologic root resorption | 6 | 1 | Not estimable* |
| 12 | 17.00 (1.02, 282.30) | ||
| Pulp canal obliteration | 6 | 1 | Not estimable* |
| 12 | 1 | 1.33 (0.52, 3.39) | |
| *due to lack of events Abbreviations ‐ CI: confidence interval; CH: calcium hydroxyde; MTA: mineral trioxide aggregate; NaOCl; sodium hypochlorite. | |||
| Outcome | Time point (months) | No. of studies | Risk ratio (95% CI) |
| Clinical failure | 6 | 1 | 0.31 (0.01 to 7.48) |
| 12 | 1 | 0.94 (0.60 to 14.52) | |
| 24 | 1 | 0.62 (0.11 to 3.56) | |
| Radiological failure | 12 | 1 | 0.56 (0.14 to 2.21) |
| 24 | 1 | 0.31 (0.11 to 0.90) | |
| Overall failure | 12 | 1 | 0.56 (0.14 to 2.21) |
| 24 | 1 | 0.31 (0.11 to 0.90) | |
| Pain | 6, 12 and 24 | 1 | Not estimable* |
| Soft tissue pathology | 6, 12 and 24 | 1 | Not estimable* |
| Pathological mobility | 6, 12 and 24 | 1 | Not estimable* |
| Pathological radiolucency | 12 | 1 | 0.31 (0.01 to 7.48) |
| 24 | 1 | 0.62 (0.11 to 3.56) | |
| Pathological root resorption | 12 | 1 | 0.94 (0.60 to 14.52) |
| 24 | 1 | 0.62 (0.11 to 3.56) | |
| *due to lack of events Abbreviations ‐ CI: confidence interval; Er:YAG: erbium:yttrium‐aluminium garnet; CH: calcium hydroxide. | |||
| Outcome | Time point (months) | No. of studies | Risk ratio (95% CI) |
| Clinical failure | 6 | 1 | 1.41 (0.77 to 2.58) |
| 12 | 1 | 1.13 (0.82 to 1.54) | |
| Radiological failure | 6 | 1 | 1.33 (0.89 to 2.00) |
| 12 | 1 | 1.17 (0.87 to 1.59) | |
| Pain | 6 | 1 | 1.72 (0.45 to 6.61) |
| 12 | 1 | 1.03 (0.33 to 3.23) | |
| Soft tissue pathology | 6 | 1 | 1.55 (0.28 to 8.65) |
| 12 | 1 | 1.03 (0.22 to 4.74) | |
| Pathological radiolucency | 6 and 12 | 1 | 5.15 (0.26 to 103.31) |
| Pathological root resorption | 6 | 1 | 1.72 (0.45 to 6.61) |
| 12 | 1 | 1.29 (0.38 to 4.37) | |
| CI: confidence interval; CH: calcium hydroxide. | |||
| Outcome | Time point (months) | No. of studies | Risk ratio (95% CI) |
| Clinical failure | 6 | 1 | Not estimable* |
| 12 | 1 | 0.33 (0.01, 7.88) | |
| Radiological failure | 6 | 1 | 0.09 (0.01, 1.58) |
| 12 | 1 | 0.63 (0.23, 1.70) | |
| Soft tissue pathology | 6 | 1 | Not estimable* |
| 12 | 1 | 0.33 (0.01, 7.88) | |
| Pathologic mobility | 6 and 12 | 1 | Not estimable* |
| Adjacent tissue inflammation | 6 and 12 | 1 | Not estimable* |
| Pathologic radiolucency | 6 | 1 | Not estimable* |
| 12 | 1 | 0.43 (0.12, 1.51) | |
| Pathologic root resorption | 6 | 1 | Not estimable* |
| 12 | 0.38 (0.11, 1.28) | ||
| Pulp canal obliteration | 6 | 1 | Not estimable* |
| 12 | 1 | 1.13 (0.50, 2.53) | |
| *due to lack of events Abbreviations ‐ CI: confidence interval; CH: calcium hydroxide; NaOCl: sodium hypochlorite. | |||
| Outcome | Time point (months) | No. of studies | Risk ratio (95% CI) |
| Pain | 6 | 1 | 0.25 (0.06, 1.08) |
| Soft tissue pathology | 6 | 1 | 0.33 (0.07, 1.52) |
| Pathologic mobility | 6 | 1 | 0.75 (0.30, 1.90) |
| Pathologic radiolucency | 6 | 1 | 1.14 (0.69, 1.90) |
| Pathologic root resorption | 6 | 1 | 1.20 (0.61, 2.34) |
| Pulp canal obliteration | 6 | 1 | 0.11 (0.01, 1.98) |
| *due to lack of events Abbreviations ‐ CI: confidence interval; FS: ferric sulfate. | |||
| Outcome | Time point (months) | No. of studies | Risk ratio (95% CI) |
| Clinical failure | 6 and 12 | 1 | Not estimable* |
| 24 | 1 | 1.20 (0.42 to 3.43) | |
| Radiological failure | 6 | 1 | 0.33 (0.01 to 7.81) |
| 12 | 1 | 0.20 (0.01 to 3.97) | |
| 24 | 1 | 0.60 (0.26 to 1.40) | |
| Overall failure | 6 | 1 | 0.33 (0.01 to 7.81) |
| 12 | 1 | 0.20 (0.01 to 3.97) | |
| 24 | 1 | 0.38 (0.11 to 1.25) | |
| Pain | 6, 12 and 24 | 1 | Not estimable* |
| Pathological radiolucency | 6, 12 and 24 | 1 | Not estimable* |
| Pathological root resorption | 6 | 1 | 0.33 (0.01 to 7.81) |
| 12 | 1 | 0.33 (0.01 to 7.81) | |
| 24 | 1 | 0.17 (0.02 to 1.29) | |
| Physiological root resorption | 6 and 12 | 1 | Not estimable* |
| 24 | 1 | 1.50 (0.27 to 8.22) | |
| Pulp canal obliteration | 6, 12 and 24 | 1 | Not estimable* |
| *due to lack of events Abbreviations ‐ CI: confidence interval; FS: ferric sulphate; ZOE: zinc oxide and eugenol | |||
| Outcome | Time point (months) | No. of studies | Risk ratio (95% CI) |
| Clinical failure | 6 | 1 | Not estimable* |
| 12 | 1 | 3.19 (0.13 to 76.37) | |
| 24 | 1 | 5.31 (0.26 to 107.86) | |
| Radiological failure | 12 | 1 | 0.46 (0.13 to 1.66) |
| 24 | 1 | 0.61 (0.19 to 1.94) | |
| Overall failure | 12 | 1 | 0.46 (0.13 to 1.66) |
| 24 | 1 | 0.61 (0.19 to 1.94) | |
| Pain | 6, 12 and 24 | 1 | Not estimable* |
| Soft tissue pathology | 6, 12 and 24 | 1 | Not estimable* |
| Pathological mobility | 6, 12 and 24 | 1 | Not estimable* |
| Pathological radiolucency | 12 | 1 | 0.15 (0.01 to 2.86) |
| 24 | 1 | 0.71 (0.12 to 4.06) | |
| Pathological root resorption | 12 | 1 | 0.53 (0.05 to 5.67) |
| 24 | 1 | 1.06 (0.16 to 7.25) | |
| *due to lack of events Abbreviations ‐ CI: confidence interval; Er:YAG: erbium:yttrium‐aluminium garnet; FS: ferric sulphate | |||
| Outcome | Time point (months) | No. of studies | Risk ratio (95% CI) |
| Pain | mean 22 | 1 | 0.25 (0.01 to 6.08) |
| Soft tissue pathology | mean 22 | 1 | 0.25 (0.01 to 6.08) |
| Pathological mobility | mean 22 | 1 | 0.15 (0.01 to 3.09) |
| Adjacent tissue inflammation | mean 22 | 1 | 0.25 (0.01 to 6.08) |
| Pathological radiolucency | mean 22 | 1 | 0.29 (0.01 to 6.92) |
| Pathological root resorption | mean 22 | 1 | 0.60 (0.31 to 1.19) |
| Pulp canal obliteration | mean 22 | 1 | 1.39 (0.78 to 2.49) |
| CI: confidence interval; FS: ferric sulphate; MTA: mineral trioxide aggregate | |||
| Outcome | Time point (months) | No. of studies | Risk ratio (95% CI) |
| Clinical failure | 6, 12 and 24 | 1 | 2.00 (0.19, 21.06) |
| Radiological failure | 24 | 1 | 0.80 (0.23, 2.73) |
| Overall failure | 6, 12 and 24 | 1 | 2.00 (0.19, 21.06) |
| Pain | 6, 12 and 24 | 1 | 1.00 (0.07, 15.36) |
| Soft tissue pathology | 6, 12 and 24 | 1 | 2.00 (0.19, 21.06) |
| Pathologic mobility | 6, 12 and 24 | 1 | 3.00 (0.13, 71.22) |
| Pathologic radiolucency | 24 | 1 | 1.00 (0.22, 4.62) |
| Pathologic root resorption | 24 | 1 | 0.50 (0.05, 5.27) |
| Abbreviations ‐ CI: confidence interval; PC: Portland cement; FC: formocresol | |||
| Outcome | Time point (months) | No. of studies | Risk ratio (95% CI) |
| Clinical failure | 6, 12 and 24 | 1 | 0.67 (0.12, 3.75) |
| Radiological failure | 24 | 1 | 0.57 (0.18, 1.78) |
| Overall failure | 6, 12 and 24 | 1 | 0.67 (0.12, 3.75) |
| Pain | 6, 12 and 24 | 1 | 1.00 (0.07, 15.36) |
| Soft tissue pathology | 6, 12 and 24 | 1 | 1.00 (0.15, 6.71) |
| Pathologic mobility | 6, 12 and 24 | 1 | 0.50 (0.05, 5.27) |
| Pathologic radiolucency | 24 | 1 | 0.60 (0.16, 2.32) |
| Pathologic root resorption | 24 | 1 | 0.50 (0.05, 5.27) |
| *due to lack of events Abbreviations ‐ CI: confidence interval; PC: Portland cement; EMD: enamel matrix derivative | |||
| Outcome | Time point (months) | No. of studies | Risk ratio (95% CI) |
| Clinical failure | 12 | 1 | 2.90 (0.32 to 26.38) |
| Radiological failure | 12 | 1 | 1.11 (0.46 to 2.67) |
| Pain | 12 | 1 | Not estimable* |
| Pathological radiolucency | 12 | 1 | 0.97 (0.39 to 2.43) |
| Pathological root resorption | 12 | 1 | 0.97 (0.15 to 6.44) |
| *due to lack of events Abbreviations ‐ CH: calcium hydroxide; CI: confidence interval; ZOE: zinc oxide and eugenol | |||
| Outcome | Time point (months) | No. of studies | Risk ratio (95% CI) |
| Clinical failure | 6 | 1 | 0.83 (0.26, 2.73) |
| Radiological failure | 6 | 1 | 0.94 (0.47, 1.88) |
| Overall failure | 6 | 1 | 0.94 (0.47, 1.88) |
| Pain | 6 | 1 | Not estimable* |
| Soft tissue pathology | 6 | 1 | 0.83 (0.26, 2.73) |
| Pathologic mobility | 6 | 1 | Not estimable* |
| Pathologic radiolucency | 6 | 1 | 1.04 (0.43, 2.51) |
| Pathologic root resorption | 6 | 1 | 0.75 (0.28, 2.02) |
| Pulp canal obliteration | 6 | 1 | 1.04 (0.16, 6.80) |
| *due to lack of events Abbreviations ‐ CI: confidence interval; CH: calcium hydroxide; ZOE: zinc oxide eugenol | |||
| Outcome | Time point (months) | No. of studies | Risk ratio (95% CI) |
| Clinical failure | 9 | 1 | 3.00 (0.13 to 71.22) |
| Radiological failure | 9 | 1 | 5.00 (0.62 to 40.64) |
| Pain | 6 | 1 | Not estimable* |
| Soft tissue pathology | 6 | 1 | 3.00 (0.13 to 71.22) |
| Pathological mobility | 6 | 1 | Not estimable* |
| Pathological radiolucency | 6 | 1 | 5.00 (0.25 to 100.54) |
| Pathological root resorption | 6 | 1 | 5.00 (0.25 to 100.54) |
| *due to lack of events Abbreviations ‐ CI: confidence interval; FC: formocresol | |||
| Outcome | Time point (months) | No. of studies | Risk ratio (95% CI) |
| Clinical failure | 6 and 12 | 1 | 1.08 (0.07, 16.36) |
| Radiological failure | 6 and 12 | 1 | 0.54 (0.11, 2.70) |
| Pathological radiolucency | 6 | 1 | 2.16 (0.21, 22.38) |
| 12 | 1 | 0.54 (0.11, 2.70) | |
| Pathological root resorption | 6 | 1 | 0.36 (0.08, 1.62) |
| 12 | 1 | 0.31 (0.07, 1.35) | |
| Pulp canal obliteration | 6 | 1 | 1.39 (0.61, 3.17) |
| 12 | 1 | 1.08 (0.60, 1.94) | |
| Dentine bridge formation | 6 | 1 | Not estimable* |
| 12 | 1 | 11.85 (0.69, 203.86) | |
| *due to lack of events Abbreviations ‐ CI: confidence interval | |||
| Outcome | Time point (months) | No. of studies | Risk ratio (95% CI) |
| Clinical failure | 6 | 1 | 16.41 (2.30 to 117.26) |
| 12 | 1 | 9.11 (3.04 to 27.31) | |
| Radiological failure | 6 | 1 | 24.06 (3.44 to 168.43) |
| 12 | 1 | 9.11 (3.04 to 27.31) | |
| Pain | 6 | 1 | 5.47 (0.67 to 44.34) |
| 12 | 1 | 5.47 (0.67 to 44.34) | |
| Soft tissue pathology | 6 | 1 | 7.64 (0.41 to 142.35) |
| 12 | 1 | 7.64 (0.41 to 142.35) | |
| Pathological radiolucency | 6 | 1 | 2.19 (0.21 to 22.99) |
| 12 | 1 | 2.19 (0.21 to 22.99) | |
| Pathological root resorption | 6 | 1 | 12.00 (0.69 to 208.77) |
| 12 | 1 | 5.47 (0.67 to 44.34) | |
| Abbreviations ‐ CH: calcium hydroxide; CI: confidence interval; FC: formocresol | |||
| Outcome | Time point (months) | No. of studies | Risk ratio (95% CI) |
| Clinical failure | 6 | 1 | Not estimable* |
| 12 | 1 | Not estimable* | |
| 24 | 1 | 0.83 (0.29 to 2.38) | |
| Radiological failure | 6 | 1 | 3.00 (0.13 to 70.30) |
| 12 | 1 | 5.00 (0.25 to 99.17) | |
| 24 | 1 | 1.67 (0.71 to 3.89) | |
| Overall failure | 6 | 1 | 3.00 (0.13 to 70.30) |
| 12 | 1 | 5.00 (0.25 to 99.17) | |
| 24 | 1 | 2.67 (0.80 to 8.90) | |
| Pain | 6, 12 and 24 | 1 | Not estimable* |
| Pathological radiolucency | 6, 12 and 24 | 1 | Not estimable* |
| Pathological root resorption | 6 | 1 | 3.00 (0.13 to 70.30) |
| 12 | 1 | 3.00 (0.13 to 70.30) | |
| 24 | 1 | 6.00 (0.78 to 46.29) | |
| Pulp canal obliteration | 6 | 1 | Not estimable* |
| 12 | 1 | 0.20 (0.01 to 3.97) | |
| 24 | 1 | 0.20 (0.01 to 3.97) | |
| Physiological root resorption | 6 | 1 | Not estimable* |
| 12 | 1 | Not estimable* | |
| 24 | 1 | 2.00 (0.19 to 20.67) | |
| *due to lack of events Abbreviations ‐ CI: confidence interval; FC: formocresol; ZOE: zinc oxide and eugenol | |||
| Outcome | Time point (months) | No. of studies | Risk ratio (95% CI) |
| Clinical failure | 6 | 1 | Not estimable* |
| 12 | 1 | 3.19 (0.13 to 76.37) | |
| 24 | 1 | 2.13 (0.20 to 22.70) | |
| Radiological failure | 6 | 1 | Not estimable* |
| 12 | 1 | 1.60 (0.28 to 9.13) | |
| 24 | 1 | 1.06 (0.28 to 4.01) | |
| Overall failure | 6 | 1 | Not estimable* |
| 12 | 1 | 1.60 (0.28 to 9.13) | |
| 24 | 1 | 1.06 (0.28 to 4.01) | |
| Pain | 6, 12 and 24 | 1 | Not estimable* |
| Soft tissue pathology | 6 | 1 | Not estimable* |
| 12 | 1 | Not estimable* | |
| 24 | 1 | 0.35 (0.01 to 8.49) | |
| Pathological mobility | 6, 12 and 24 | 1 | Not estimable* |
| Pathological radiolucency | 6 | 1 | Not estimable* |
| 12 | 1 | 0.21 (0.01 to 4.31) | |
| 24 | 1 | 1.06 (0.16 to 7.25) | |
| Pathological root resorption | 6 | 1 | Not estimable* |
| 12 | 1 | 3.19 (0.13 to 76.37) | |
| 24 | 1 | 1.06 (0.16 to 7.25) | |
| *due to lack of events Abbreviations ‐ CI: confidence interval; Er:YAG: erbium:yttrium‐aluminium garnet; FC: formocresol | |||
| Outcome | Time point (months) | No. of studies | Risk ratio (95% CI) |
| Clinical failure | 6 | 1 | Not estimable* |
| 12 | 1 | 0.33 (0.01, 7.95) | |
| Radiological failure | 6 | 1 | 1.67 (0.43, 6.51) |
| 12 | 1 | 2.00 (0.75, 5.33) | |
| *due to lack of events Abbreviations ‐ CI: confidence interval; FC: formocresol. | |||
| Outcome | Time point (months) | No. of studies | Risk ratio (95% CI) |
| Clinical failure | 6 and 12 | 1 | 0.33 (0.01, 7.58) |
| 24 | 1 | 1.00 (0.16, 6.20) | |
| Radiological failure | 6 and 12 | 1 | 1.00 (0.16, 6.20) |
| 24 | 1 | 0.67 (0.13, 3.44) | |
| Pain | 6 and 12 | 1 | 0.33 (0.01, 7.58) |
| 24 | 1 | 1.00 (0.16, 6.20) | |
| Soft tissue pathology | 6, 12 and 24 months | 1 | 0.33 (0.01, 7.58) |
| Pathologic mobility | 6, 12 and 24 months | 1 | 0.33 (0.01, 7.58) |
| Pathological radiolucency | 6 and 12 | 1 | Not estimable* |
| Pathological root resorption | 6 and 12 | 1 | 1.00 (0.16, 6.20) |
| 24 | 1 | 0.67 (0.13, 3.44) | |
| *due to lack of events Abbreviation ‐ CI: confidence interval | |||
| Outcome | Time point (months) | No. of studies | Risk ratio (95% CI) |
| Clinical failure | 6 | 1 | 1.00 (0.07 to 14.90) |
| 12 | 1 | 0.50 (0.10 to 2.43) | |
| Radiological failure | 6 and 12 | 1 | 0.50 (0.10 to 2.43) |
| Pain | 6 and 12 | 1 | 1.00 (0.07 to 14.90) |
| Pathological mobility | 6 and 12 | 1 | 1.00 (0.07 to 14.90) |
| Pathological radiolucency | 6 and 12 | 1 | 0.20 (0.01 to 3.92) |
| Pathological root resorption | 6 and 12 | 1 | 5.00 (0.26 to 98.00) |
| Filling material anomaly | 6 and 12 | 1 | Not estimable* |
| *due to lack of events Abbreviations ‐ CI: confidence interval; Sealapex: eugenol‐free CH; CH: calcium hydroxide. | |||
| Outcome | Time point (months) | No. of studies | Risk ratio (95% CI) |
| Clinical failure | 6 | 1 | 0.33 (0.01 to 7.72) |
| 12 | 1 | 0.11 (0.01 to 1.94) | |
| Radiological failure | 6 and 12 | 1 | 0.11 (0.01 to 1.94) |
| Pain | 6 and 12 | 1 | 0.33 (0.01 to 7.72) |
| Pathological mobility | 6 and 12 | 1 | 0.33 (0.01 to 7.72) |
| Pathological radiolucency | 6 and 12 | 1 | 0.20 (0.01 to 3.92) |
| Pathological root resorption | 6 and 12 | 1 | Not estimable* |
| Filling material anomaly | 6 and 12 | 1 | 3.00 (0.13 to 69.52) |
| *due to lack of events Abbreviations ‐ CI: confidence interval; Vitapex: CH/iodoform; CH: calcium hydroxide. | |||
| Outcome | Time point (months) | No. of studies | Risk ratio (95% CI) |
| Clinical failure | 6 | 1 | 0.33 (0.01 to 7.72) |
| 12 | 1 | 0.20 (0.01 to 3.92) | |
| Radiological failure | 6 and 12 | 1 | 0.20 (0.01 to 3.92) |
| Pain | 6 and 12 | 1 | 0.33 (0.01 to 7.72) |
| Pathological mobility | 6 and 12 | 1 | 0.33 (0.01 to 7.72) |
| Pathological radiolucency | 6 and 12 | 1 | Not estimable* |
| Pathological root resorption | 6 and 12 | 1 | 0.20 (0.01 to 3.92) |
| Filling material anomaly | 6 and 12 | 1 | 3.00 (0.13 to 69.52) |
| *due to lack of events Abbreviations ‐ CI: confidence interval; Vitapex: CH/iodoform; CH: calcium hydroxide; Sealapex: eugenol‐free CH. | |||
| Outcome | Time point (months) | No. of studies | Risk ratio (95% CI) |
| Clinical failure | 6 | 1 | Not estimable* |
| 12 | 1 | 1.0 (0.07 to 15.12) | |
| Radiological failure | 6 | 1 | 1.25 (0.38 to 4.12) |
| 12 | 1 | 1.83 (0.80 to 4.19) | |
| Pain | 6 | 1 | Not estimable* |
| 12 | 1 | 3.00 (0.13 to 70.30) | |
| Soft tissue pathology | 6 | 1 | Not estimable* |
| 12 | 1 | 1.0 (0.07 to 15.12) | |
| Pathological mobility | 6 and 12 | 1 | Not estimable* |
| Pathological radiolucency | 6 | 1 | 1.50 (0.27 to 8.22) |
| 12 | 1 | 2.75 (1.01 to 7.48) | |
| Pathological root resorption | 6 and 12 | 1 | 0.20 (0.01 to 3.97) |
| Pulp canal obliteration | 6 | 1 | Not estimable* |
| 12 | 1 | 0.20 (0.01 to 3.97) | |
| *due to lack of events Abbreviations ‐ CI: confidence interval; Vitapex: CH/iodoform; CH: calcium hydroxide; 3Mix: ciprofloxacin + metronidazole + minocycline. | |||
| Outcome | Time point (months) | No. of studies | Risk ratio (95% CI) |
| Clinical failure | 6 | 1 | Not estimable* |
| 12 | 1 | 21.79 (1.32, 360.78) | |
| Radiological failure | 6 | 1 | 6.63 (0.35, 125.41) |
| 12 | 1 | 42.63 (2.65, 685.54) | |
| *due to lack of events Abbreviations ‐ CI: confidence interval; Vitapex: CH/iodoform; MPRCF: ZOE (zinc oxide eugenol), calcium hydroxide, iodoform. | |||
| Outcome | Time point (months) | No. of studies | Risk ratio (95% CI) |
| Pain | 24 | 1 | 1.80 (0.07 to 43.88) |
| Soft tissue pathology | 24 | 1 | 4.21 (0.22 to 80.70) |
| Pathological radiolucency | 24 | 1 | 0.60 (0.25 to 1.46) |
| Pathological root resorption | 24 | 1 | 21.04 (1.28 to 346.39) |
| Pulp canal obliteration | 24 | 1 | 27.05 (1.66 to 441.49) |
| Abbreviations ‐ CI: confidence interval; FS: ferric sulphate; Sedanol=ZOE: zinc oxide and eugenol. | |||
| Outcome | Time point (months) | No. of studies | Risk ratio (95% CI) |
| Clinical failure | 6 | 1 | 3.00 (0.13, 70.83) |
| 12 | 1 | 5.00 (0.25, 99.95) | |
| Pain | 6 | 1 | 3.00 (0.13, 70.83) |
| 12 | 1 | 5.00 (0.25, 99.95) | |
| Soft tissue pathology | 6 | 1 | Not estimable* |
| 12 | 1 | 3.00 (0.13, 70.83) | |
| Pathologic mobility | 6 and 12 | 1 | 3.00 (0.13, 70.83) |
| Pathologic radiolucency | 6 | 1 | 23.00 (1.42, 373.46) |
| 12 | 1 | 11.00 (0.64, 190.53) | |
| *due to lack events Abbreviations ‐ CI: confidence interval; 3Mix: ciprofloxacin + metronidazole + minocycline. | |||
| Outcome | Time point (months) | No. of studies | Risk ratio (95% CI) |
| Clinical failure | 24 | 1 | 3.83 (1.68 to 8.74) |
| Radiological failure | 24 | 1 | 3.11 (1.61 to 6.02) |
| Pain | 6 | 1 | 7.00 (0.37 to 132.66) |
| 12 | 1 | 9.00 (0.50 to 163.59) | |
| 24 | 1 | 4.00 (0.89 to 18.06) | |
| Soft tissue pathology | 6 | 1 | 7.00 (0.37 to 132.66) |
| 12 | 1 | 2.5 (0.50 to 12.39) | |
| 24 | 1 | 1.8 (0.64 to 5.06) | |
| Pathological radiolucency | 6 | 1 | Not estimable* |
| 12 | 1 | 4.00 (0.46 to 34.75) | |
| 24 | 1 | 5.00 (1.14 to 21.86) | |
| Pathological root resorption | 6 | 1 | Not estimable* |
| 12 | 1 | 3.33 (0.96 to 11.51) | |
| 24 | 1 | 2.00 (0.87 to 4.60) | |
| *due to lack of events Abbreviations ‐ CH: calcium hydroxide; CI: confidence interval; FC: formocresol. | |||
| Outcome | Time point (months) | No. of studies | Risk ratio (95% CI) |
| Clinical failure | 6 | 1 | Not estimable* |
| 12 and 24 | 1 | 3.00 (0.13 to 69.52) | |
| Radiological failure | 6 | 1 | Not estimable* |
| 12 | 1 | 3.00 (0.13 to 69.52) | |
| 24 | 1 | 7.00 (0.38 to 127.33) | |
| Pain | 6 | 1 | Not estimable* |
| 12 and 24 | 1 | 3.00 (0.13 to 69.52) | |
| Pathological radiolucency | 6 | 1 | Not estimable* |
| 12 | 1 | 3.00 (0.13 to 69.52) | |
| 24 | 1 | 7.00 (0.38 to 127.33) | |
| Pathological root resorption | 6, 12 and 24 | 1 | Not estimable* |
| *due to lack of events Abbreviations ‐ CH: calcium hydroxide; CI: confidence interval | |||
| Outcome | Time point (months) | No. of studies | Risk ratio (95% CI) |
| Clinical failure | 6, 12 and 24 | 1 | 3.00 (0.13 to 69.52) |
| Radiological failure | 6 | 1 | Not estimable* |
| 12 and 24 | 1 | 3.00 (0.13 to 69.52) | |
| Pain | 6 | 1 | Not estimable* |
| 12 and 24 | 1 | 3.00 (0.13 to 69.52) | |
| Pathological radiolucency | 6 | 1 | Not estimable* |
| 12 and 24 | 1 | 3.00 (0.13 to 69.52) | |
| Pathological root resorption | 6, 12 and 24 | 1 | Not estimable* |
| *due to lack of events Abbreviations ‐ CH: calcium hydroxide; CI: confidence interval | |||
| Outcome | Time point (months) | No. of studies | Risk ratio (95% CI) |
| Clinical failure | 6 | 1 | Not estimable* |
| 12 and 24 | 1 | 3.00 (0.13 to 69.52) | |
| Radiological failure | 6 and 12 | 1 | 3.00 (0.13 to 69.52) |
| 24 | 1 | 7.00 (0.38 to 127.33) | |
| Pain | 6 | 1 | Not estimable* |
| 12 and 24 | 1 | 3.00 (0.13 to 69.52) | |
| Pathological radiolucency | 6 | 1 | Not estimable* |
| 12 and 24 | 1 | 3.00 (0.13 to 69.52) | |
| Pathological root resorption | 6, 12 and 24 | 1 | Not estimable* |
| *due to lack of events Abbreviation ‐ CI: confidence interval. | |||
| Outcome | Time point (months) | No. of studies | Risk ratio (95% CI) |
| Clinical failure | 6, 12 and 24 | 1 | 3.00 (0.13 to 69.52) |
| Radiological failure | 6 | 1 | Not estimable* |
| 12 and 24 | 1 | 3.00 (0.13 to 69.52) | |
| Pain | 6 | 1 | Not estimable* |
| 12 and 24 | 1 | 3.00 (0.13 to 69.52) | |
| Pathological radiolucency | 6 | 1 | Not estimable* |
| 12 and 24 | 1 | 3.00 (0.13 to 69.52) | |
| Pathological root resorption | 6, 12 and 24 | 1 | Not estimable* |
| *due to lack of events Abbreviation ‐ CI: confidence interval | |||
| Outcome | Time point (months) | No. of studies | Risk ratio (95% CI) |
| Clinical failure | 6 | 1 | Not estimable* |
| 12 and 24 | 1 | 3.00 (0.13 to 69.52) | |
| Radiological failure | 6 | 1 | Not estimable* |
| 12 | 1 | 3.00 (0.13 to 69.52) | |
| 24 | 1 | 7.00 (0.38 to 127.33) | |
| Pain | 6 | 1 | Not estimable* |
| 12 and 24 | 1 | 3.00 (0.13 to 69.52) | |
| Pathological radiolucency | 6 | 1 | Not estimable* |
| 12 | 1 | 3.00 (0.13 to 69.52) | |
| 24 | 1 | 7.00 (0.38 to 127.33) | |
| Pathological root resorption | 6, 12 and 24 | 1 | Not estimable* |
| *due to lack of events Abbreviations ‐ CI: confidence interval. | |||
| Outcome | Time point (months) | No. of studies | Risk ratio (95% CI) |
| Clinical failure | 6, 12 and 24 | 1 | 3.00 (0.13 to 69.52) |
| Radiological failure | 6 | 1 | Not estimable* |
| 12 and 24 | 1 | 1.00 (0.07 to 14.90) | |
| Pain | 6 | 1 | Not estimable* |
| 12 and 24 | 1 | 3.00 (0.13 to 69.52) | |
| Pathological radiolucency | 6 | 1 | Not estimable* |
| 12 and 24 | 1 | 1.00 (0.07 to 14.90) | |
| Pathological root resorption | 6, 12 and 24 | 1 | Not estimable* |
| *due to lack of events Abbreviation ‐ CI: confidence interval. | |||
| Outcome | Time point (months) | No. of studies | Risk ratio (95% CI) |
| Clinical failure | 6 | 1 | 3.00 (0.13 to 69.52) |
| 12 and 24 | 1 | 1.00 (0.07 to 14.90) | |
| Radiological failure | 6 | 1 | 0.33 (0.01 to 7.72) |
| 12 | 1 | 1.00 (0.07 to 14.90) | |
| 24 | 1 | 0.33 (0.04 to 2.94) | |
| Pain | 6 | 1 | Not estimable* |
| 12 | 1 | 3.00 (0.13 to 69.52) | |
| 24 | 1 | 1.00 (0.07 to 14.90) | |
| Pathological radiolucency | 6 | 1 | Not estimable* |
| 12 | 1 | 1.00 (0.07 to 14.90) | |
| 24 | 1 | 0.33 (0.04 to 2.94) | |
| Pathological root resorption | 6, 12 and 24 | 1 | Not estimable* |
| *due to lack of events Abbreviation ‐ CI: confidence interval. | |||
| Outcome | Time point (months) | No. of studies | Risk ratio (95% CI) |
| Clinical failure | 1, 3, 6 | 1 | 5.00 (0.26, 98.00) |
| 9 | 1 | 7.00 (0.38, 127.32) | |
| 12 | 1 | 4.00 (0.49, 32.72) | |
| Radiological failure | 1, 3, 6 | 1 | 5.00 (0.26, 98.00) |
| 9 | 1 | 3.00 (0.34, 26.45) | |
| 12 | 1 | 1.67 (0.46, 6.06) | |
| Pain | 1, 3, 6, 9 | 1 | Not estimable* |
| 12 | 1 | 3.00 (0.13, 69.52) | |
| Soft tissue pathology | 1, 3, 6, 9 | 1 | 5.00 (0.26, 98.00) |
| 12 | 1 | 2.00 (0.20, 20.33) | |
| Pathologic mobility | 1, 3, 6, 9 | 1 | 5.00 (0.26, 98.00) |
| 12 | 1 | 2.00 (0.20, 20.33) | |
| Pathologic radiolucency | 1, 3, 6 | 1 | 5.00 (0.26, 98.00) |
| 9 | 1 | 3.00 (0.34, 26.45) | |
| 12 | 1 | 1.33 (0.34, 5.21) | |
| Pathologic root resorption | 1, 3, 6 | 1 | 5.00 (0.26, 98.00) |
| 9 | 1 | 2.00 (0.20, 20.33) | |
| 12 | 1.33 (0.34, 5.21) | ||
| *due to lack of events Abbreviation ‐ CI: confidence interval. | |||
| Outcome or subgroup title | No. of studies | No. of participants | Statistical method | Effect size |
| 1 Clinical failure Show forest plot | 14 | Risk Ratio (M‐H, Fixed, 95% CI) | Subtotals only | |
| 1.1 6 months | 13 | 1048 | Risk Ratio (M‐H, Fixed, 95% CI) | 0.37 [0.07, 1.89] |
| 1.2 12 months | 12 | 740 | Risk Ratio (M‐H, Fixed, 95% CI) | 0.31 [0.10, 0.93] |
| 1.3 24 months | 9 | 548 | Risk Ratio (M‐H, Fixed, 95% CI) | 0.47 [0.18, 1.19] |
| 2 Radiological failure Show forest plot | 13 | Risk Ratio (M‐H, Fixed, 95% CI) | Subtotals only | |
| 2.1 6 months | 12 | 922 | Risk Ratio (M‐H, Fixed, 95% CI) | 0.38 [0.17, 0.86] |
| 2.2 12 months | 12 | 740 | Risk Ratio (M‐H, Fixed, 95% CI) | 0.41 [0.19, 0.89] |
| 2.3 24 months | 9 | 548 | Risk Ratio (M‐H, Fixed, 95% CI) | 0.42 [0.22, 0.80] |
| 3 Overall failure Show forest plot | 7 | Risk Ratio (M‐H, Fixed, 95% CI) | Subtotals only | |
| 3.1 6 months | 6 | 328 | Risk Ratio (M‐H, Fixed, 95% CI) | 0.23 [0.04, 1.32] |
| 3.2 12 months | 6 | 328 | Risk Ratio (M‐H, Fixed, 95% CI) | 0.48 [0.17, 1.36] |
| 3.3 24 months | 7 | 368 | Risk Ratio (M‐H, Fixed, 95% CI) | 0.50 [0.25, 1.01] |
| 4 Pain Show forest plot | 7 | Risk Ratio (M‐H, Fixed, 95% CI) | Subtotals only | |
| 4.1 6 months | 6 | 390 | Risk Ratio (M‐H, Fixed, 95% CI) | 0.33 [0.01, 7.91] |
| 4.2 12 months | 6 | 410 | Risk Ratio (M‐H, Fixed, 95% CI) | 0.25 [0.03, 2.18] |
| 4.3 24 months | 4 | 290 | Risk Ratio (M‐H, Fixed, 95% CI) | 0.71 [0.14, 3.56] |
| 5 Soft tissue pathology Show forest plot | 8 | Risk Ratio (M‐H, Fixed, 95% CI) | Subtotals only | |
| 5.1 6 months | 7 | 410 | Risk Ratio (M‐H, Fixed, 95% CI) | 0.33 [0.01, 7.91] |
| 5.2 12 months | 7 | 430 | Risk Ratio (M‐H, Fixed, 95% CI) | 0.22 [0.05, 1.01] |
| 5.3 24 months | 5 | 310 | Risk Ratio (M‐H, Fixed, 95% CI) | 0.33 [0.04, 3.10] |
| 6 Pathological mobility Show forest plot | 5 | Risk Ratio (M‐H, Fixed, 95% CI) | Subtotals only | |
| 6.1 6 months | 5 | 250 | Risk Ratio (M‐H, Fixed, 95% CI) | 0.0 [0.0, 0.0] |
| 6.2 12 months | 4 | 200 | Risk Ratio (M‐H, Fixed, 95% CI) | 0.2 [0.01, 3.97] |
| 6.3 24 months | 3 | 150 | Risk Ratio (M‐H, Fixed, 95% CI) | 0.0 [0.0, 0.0] |
| 7 Pathological radiolucency Show forest plot | 14 | Risk Ratio (M‐H, Fixed, 95% CI) | Subtotals only | |
| 7.1 6 months | 13 | 1010 | Risk Ratio (M‐H, Fixed, 95% CI) | 0.54 [0.27, 1.08] |
| 7.2 12 months | 11 | 652 | Risk Ratio (M‐H, Fixed, 95% CI) | 0.43 [0.19, 0.98] |
| 7.3 24 months | 8 | 460 | Risk Ratio (M‐H, Fixed, 95% CI) | 0.55 [0.25, 1.22] |
| 8 Pathological root resorption Show forest plot | 12 | Risk Ratio (M‐H, Fixed, 95% CI) | Subtotals only | |
| 8.1 6 months | 11 | 866 | Risk Ratio (M‐H, Fixed, 95% CI) | 0.47 [0.18, 1.21] |
| 8.2 12 months | 9 | 508 | Risk Ratio (M‐H, Fixed, 95% CI) | 0.26 [0.07, 1.03] |
| 8.3 24 months | 6 | 338 | Risk Ratio (M‐H, Fixed, 95% CI) | 0.25 [0.08, 0.81] |
| 9 Pulp canal obliteration Show forest plot | 9 | Risk Ratio (M‐H, Fixed, 95% CI) | Subtotals only | |
| 9.1 6 months | 9 | 712 | Risk Ratio (M‐H, Fixed, 95% CI) | 1.52 [1.00, 2.30] |
| 9.2 12 months | 7 | 410 | Risk Ratio (M‐H, Fixed, 95% CI) | 1.70 [0.81, 3.57] |
| 9.3 24 months | 6 | 338 | Risk Ratio (M‐H, Fixed, 95% CI) | 2.05 [1.07, 3.94] |
| 10 Dentin bridge formation Show forest plot | 3 | Risk Ratio (M‐H, Fixed, 95% CI) | Subtotals only | |
| 10.1 6 months | 3 | 322 | Risk Ratio (M‐H, Fixed, 95% CI) | 18.16 [3.63, 90.91] |
| 10.2 12 months | 2 | 70 | Risk Ratio (M‐H, Fixed, 95% CI) | 6.0 [0.76, 47.22] |
| 10.3 24 months | 2 | 70 | Risk Ratio (M‐H, Fixed, 95% CI) | 6.0 [0.76, 47.22] |
| 11 Physiological root resorption Show forest plot | 2 | Risk Ratio (M‐H, Fixed, 95% CI) | Subtotals only | |
| 11.1 6 months | 2 | 170 | Risk Ratio (M‐H, Fixed, 95% CI) | 0.0 [0.0, 0.0] |
| 11.2 12 months | 2 | 170 | Risk Ratio (M‐H, Fixed, 95% CI) | 0.0 [0.0, 0.0] |
| 11.3 24 months | 2 | 170 | Risk Ratio (M‐H, Fixed, 95% CI) | 0.33 [0.01, 7.81] |
| Outcome or subgroup title | No. of studies | No. of participants | Statistical method | Effect size |
| 1 Clinical failure Show forest plot | 7 | Risk Ratio (M‐H, Fixed, 95% CI) | Subtotals only | |
| 1.1 6 months | 6 | 538 | Risk Ratio (M‐H, Fixed, 95% CI) | 0.70 [0.09, 5.64] |
| 1.2 12 months | 5 | 432 | Risk Ratio (M‐H, Fixed, 95% CI) | 0.45 [0.12, 1.68] |
| 1.3 24 months | 3 | 290 | Risk Ratio (M‐H, Fixed, 95% CI) | 0.33 [0.04, 3.14] |
| 2 Radiological failure Show forest plot | 5 | Risk Ratio (M‐H, Fixed, 95% CI) | Subtotals only | |
| 2.1 6 months | 4 | 362 | Risk Ratio (M‐H, Fixed, 95% CI) | 0.29 [0.05, 1.79] |
| 2.2 12 months | 5 | 432 | Risk Ratio (M‐H, Fixed, 95% CI) | 0.28 [0.08, 0.98] |
| 2.3 24 months | 3 | 290 | Risk Ratio (M‐H, Fixed, 95% CI) | 0.2 [0.06, 0.67] |
| 3 Pain Show forest plot | 3 | Risk Ratio (M‐H, Fixed, 95% CI) | Subtotals only | |
| 3.1 6 months | 2 | 190 | Risk Ratio (M‐H, Fixed, 95% CI) | 0.33 [0.01, 7.91] |
| 3.2 12 months | 3 | 260 | Risk Ratio (M‐H, Fixed, 95% CI) | 0.25 [0.03, 2.18] |
| 3.3 24 months | 2 | 190 | Risk Ratio (M‐H, Fixed, 95% CI) | 0.33 [0.04, 3.14] |
| 4 Soft tissue pathology Show forest plot | 3 | Risk Ratio (M‐H, Fixed, 95% CI) | Subtotals only | |
| 4.1 6 months | 2 | 190 | Risk Ratio (M‐H, Fixed, 95% CI) | 0.33 [0.01, 7.91] |
| 4.2 12 months | 3 | 260 | Risk Ratio (M‐H, Fixed, 95% CI) | 0.25 [0.03, 2.18] |
| 4.3 24 months | 2 | 190 | Risk Ratio (M‐H, Fixed, 95% CI) | 0.33 [0.01, 7.91] |
| 5 Pathological radiolucency Show forest plot | 5 | Risk Ratio (M‐H, Fixed, 95% CI) | Subtotals only | |
| 5.1 6 months | 4 | 388 | Risk Ratio (M‐H, Fixed, 95% CI) | 0.16 [0.01, 2.95] |
| 5.2 12 months | 4 | 332 | Risk Ratio (M‐H, Fixed, 95% CI) | 0.61 [0.16, 2.38] |
| 5.3 24 months | 2 | 190 | Risk Ratio (M‐H, Fixed, 95% CI) | 0.45 [0.11, 1.95] |
| 6 Pathological root resorption Show forest plot | 4 | Risk Ratio (M‐H, Fixed, 95% CI) | Subtotals only | |
| 6.1 6 months | 3 | 316 | Risk Ratio (M‐H, Fixed, 95% CI) | 0.11 [0.01, 1.95] |
| 6.2 12 months | 3 | 260 | Risk Ratio (M‐H, Fixed, 95% CI) | 0.33 [0.01, 7.91] |
| 6.3 24 months | 2 | 190 | Risk Ratio (M‐H, Fixed, 95% CI) | 0.13 [0.02, 0.98] |
| 7 Pulp canal obliteration Show forest plot | 2 | Risk Ratio (M‐H, Fixed, 95% CI) | Subtotals only | |
| 7.1 6 months | 2 | 192 | Risk Ratio (M‐H, Fixed, 95% CI) | 0.0 [0.0, 0.0] |
| 7.2 12 months | 2 | 192 | Risk Ratio (M‐H, Fixed, 95% CI) | 12.76 [0.79, 206.70] |
| Outcome or subgroup title | No. of studies | No. of participants | Statistical method | Effect size |
| 1 Clinical failure Show forest plot | 8 | Risk Ratio (M‐H, Fixed, 95% CI) | Subtotals only | |
| 1.1 6 months | 8 | 560 | Risk Ratio (M‐H, Fixed, 95% CI) | 0.16 [0.01, 3.06] |
| 1.2 12 months | 7 | 308 | Risk Ratio (M‐H, Fixed, 95% CI) | 0.16 [0.02, 1.28] |
| 1.3 24 months | 6 | 258 | Risk Ratio (M‐H, Fixed, 95% CI) | 0.51 [0.18, 1.42] |
| 2 Radiological failure Show forest plot | 8 | Risk Ratio (M‐H, Fixed, 95% CI) | Subtotals only | |
| 2.1 6 months | 8 | 560 | Risk Ratio (M‐H, Fixed, 95% CI) | 0.41 [0.17, 1.03] |
| 2.2 12 months | 7 | 308 | Risk Ratio (M‐H, Fixed, 95% CI) | 0.56 [0.20, 1.53] |
| 2.3 24 months | 6 | 258 | Risk Ratio (M‐H, Fixed, 95% CI) | 0.67 [0.31, 1.46] |
| 3 Pain Show forest plot | 4 | Risk Ratio (M‐H, Fixed, 95% CI) | Subtotals only | |
| 3.1 6 months | 4 | 200 | Risk Ratio (M‐H, Fixed, 95% CI) | 0.0 [0.0, 0.0] |
| 3.2 12 months | 3 | 150 | Risk Ratio (M‐H, Fixed, 95% CI) | 0.0 [0.0, 0.0] |
| 3.3 24 months | 2 | 100 | Risk Ratio (M‐H, Fixed, 95% CI) | 3.0 [0.13, 70.30] |
| 4 Soft tissue pathology Show forest plot | 5 | Risk Ratio (M‐H, Fixed, 95% CI) | Subtotals only | |
| 4.1 6 months | 5 | 220 | Risk Ratio (M‐H, Fixed, 95% CI) | 0.0 [0.0, 0.0] |
| 4.2 12 months | 4 | 170 | Risk Ratio (M‐H, Fixed, 95% CI) | 0.2 [0.02, 1.65] |
| 4.3 24 months | 3 | 120 | Risk Ratio (M‐H, Fixed, 95% CI) | 0.33 [0.01, 7.72] |
| 5 Pathological mobility Show forest plot | 4 | Risk Ratio (M‐H, Fixed, 95% CI) | Subtotals only | |
| 5.1 6 months | 4 | 180 | Risk Ratio (M‐H, Fixed, 95% CI) | 0.0 [0.0, 0.0] |
| 5.2 12 months | 3 | 130 | Risk Ratio (M‐H, Fixed, 95% CI) | 0.2 [0.01, 3.97] |
| 5.3 24 months | 2 | 80 | Risk Ratio (M‐H, Fixed, 95% CI) | 0.0 [0.0, 0.0] |
| 6 Pathological radiolucency Show forest plot | 9 | Risk Ratio (M‐H, Fixed, 95% CI) | Subtotals only | |
| 6.1 6 months | 9 | 622 | Risk Ratio (M‐H, Fixed, 95% CI) | 0.61 [0.30, 1.27] |
| 6.2 12 months | 7 | 320 | Risk Ratio (M‐H, Fixed, 95% CI) | 0.36 [0.13, 1.02] |
| 6.3 24 months | 6 | 270 | Risk Ratio (M‐H, Fixed, 95% CI) | 0.6 [0.23, 1.57] |
| 7 Pathological root resorption Show forest plot | 8 | Risk Ratio (M‐H, Fixed, 95% CI) | Subtotals only | |
| 7.1 6 months | 8 | 550 | Risk Ratio (M‐H, Fixed, 95% CI) | 0.70 [0.24, 1.99] |
| 7.2 12 months | 6 | 248 | Risk Ratio (M‐H, Fixed, 95% CI) | 0.25 [0.05, 1.14] |
| 7.3 24 months | 4 | 148 | Risk Ratio (M‐H, Fixed, 95% CI) | 0.43 [0.10, 1.92] |
| 8 Pulp canal obliteration Show forest plot | 7 | Risk Ratio (M‐H, Fixed, 95% CI) | Subtotals only | |
| 8.1 6 months | 7 | 520 | Risk Ratio (M‐H, Fixed, 95% CI) | 1.52 [1.00, 2.30] |
| 8.2 12 months | 5 | 218 | Risk Ratio (M‐H, Fixed, 95% CI) | 1.0 [0.44, 2.26] |
| 8.3 24 months | 5 | 218 | Risk Ratio (M‐H, Fixed, 95% CI) | 1.97 [0.99, 3.89] |
| Outcome or subgroup title | No. of studies | No. of participants | Statistical method | Effect size |
| 1 Clinical failure Show forest plot | 4 | Risk Ratio (M‐H, Fixed, 95% CI) | Subtotals only | |
| 1.1 6 months | 4 | 190 | Risk Ratio (M‐H, Fixed, 95% CI) | 0.08 [0.00, 1.31] |
| 1.2 12 months | 3 | 130 | Risk Ratio (M‐H, Fixed, 95% CI) | 0.2 [0.01, 3.97] |
| 1.3 24 months | 3 | 130 | Risk Ratio (M‐H, Fixed, 95% CI) | 0.52 [0.20, 1.39] |
| 2 Radiological failure Show forest plot | 4 | Risk Ratio (M‐H, Fixed, 95% CI) | Subtotals only | |
| 2.1 6 months | 4 | 190 | Risk Ratio (M‐H, Fixed, 95% CI) | 0.06 [0.01, 0.40] |
| 2.2 12 months | 3 | 130 | Risk Ratio (M‐H, Fixed, 95% CI) | 0.71 [0.15, 3.44] |
| 2.3 24 months | 3 | 130 | Risk Ratio (M‐H, Fixed, 95% CI) | 0.58 [0.25, 1.36] |
| 3 Overall failure Show forest plot | 4 | Risk Ratio (M‐H, Fixed, 95% CI) | Subtotals only | |
| 3.1 6 months | 4 | 190 | Risk Ratio (M‐H, Fixed, 95% CI) | 0.06 [0.01, 0.40] |
| 3.2 12 months | 3 | 130 | Risk Ratio (M‐H, Fixed, 95% CI) | 0.71 [0.15, 3.44] |
| 3.3 24 months | 3 | 130 | Risk Ratio (M‐H, Fixed, 95% CI) | 0.78 [0.32, 1.89] |
| 4 Pain Show forest plot | 3 | Risk Ratio (M‐H, Fixed, 95% CI) | Subtotals only | |
| 4.1 6 months | 3 | 160 | Risk Ratio (M‐H, Fixed, 95% CI) | 0.2 [0.01, 4.00] |
| 4.2 12 months | 2 | 100 | Risk Ratio (M‐H, Fixed, 95% CI) | 0.0 [0.0, 0.0] |
| 5 Soft tissue pathology Show forest plot | 2 | Risk Ratio (M‐H, Fixed, 95% CI) | Subtotals only | |
| 5.1 6 months | 2 | 110 | Risk Ratio (M‐H, Fixed, 95% CI) | 0.2 [0.01, 4.00] |
| 6 Pathologic mobility Show forest plot | 2 | Risk Ratio (M‐H, Fixed, 95% CI) | Subtotals only | |
| 6.1 6 months | 2 | 110 | Risk Ratio (M‐H, Fixed, 95% CI) | 0.08 [0.00, 1.31] |
| 7 Pathologic radiolucency Show forest plot | 3 | Risk Ratio (M‐H, Fixed, 95% CI) | Subtotals only | |
| 7.1 6 months | 3 | 160 | Risk Ratio (M‐H, Fixed, 95% CI) | 0.03 [0.00, 0.48] |
| 7.2 12 months | 2 | 100 | Risk Ratio (M‐H, Fixed, 95% CI) | 0.33 [0.01, 7.81] |
| 7.3 24 months | 2 | 100 | Risk Ratio (M‐H, Fixed, 95% CI) | 0.2 [0.01, 3.97] |
| 8 Pathological root resorption Show forest plot | 4 | Risk Ratio (M‐H, Fixed, 95% CI) | Subtotals only | |
| 8.1 6 months | 4 | 190 | Risk Ratio (M‐H, Fixed, 95% CI) | 0.07 [0.01, 0.53] |
| 8.2 12 months | 3 | 130 | Risk Ratio (M‐H, Fixed, 95% CI) | 0.2 [0.01, 3.97] |
| 8.3 24 months | 3 | 130 | Risk Ratio (M‐H, Fixed, 95% CI) | 0.56 [0.12, 2.51] |
| 9 Pulp canal obliteration Show forest plot | 3 | Risk Ratio (M‐H, Fixed, 95% CI) | Subtotals only | |
| 9.1 6 months | 3 | 140 | Risk Ratio (M‐H, Fixed, 95% CI) | 0.0 [0.0, 0.0] |
| 9.2 12 months | 2 | 80 | Risk Ratio (M‐H, Fixed, 95% CI) | 3.0 [0.13, 70.30] |
| 9.3 24 months | 2 | 80 | Risk Ratio (M‐H, Fixed, 95% CI) | 1.57 [0.47, 5.27] |
| Outcome or subgroup title | No. of studies | No. of participants | Statistical method | Effect size |
| 1 Clinical failure Show forest plot | 5 | Risk Ratio (M‐H, Fixed, 95% CI) | Subtotals only | |
| 1.1 6 months | 4 | 150 | Risk Ratio (M‐H, Fixed, 95% CI) | 0.2 [0.01, 3.85] |
| 1.2 12 months | 4 | 150 | Risk Ratio (M‐H, Fixed, 95% CI) | 0.16 [0.04, 0.70] |
| 1.3 24 months | 5 | 284 | Risk Ratio (M‐H, Fixed, 95% CI) | 0.25 [0.12, 0.52] |
| 2 Radiological failure Show forest plot | 5 | Risk Ratio (M‐H, Fixed, 95% CI) | Subtotals only | |
| 2.1 6 months | 4 | 150 | Risk Ratio (M‐H, Fixed, 95% CI) | 0.08 [0.02, 0.41] |
| 2.2 12 months | 4 | 150 | Risk Ratio (M‐H, Fixed, 95% CI) | 0.12 [0.04, 0.36] |
| 2.3 24 months | 5 | 284 | Risk Ratio (M‐H, Fixed, 95% CI) | 0.14 [0.08, 0.26] |
| 3 Overall failure Show forest plot | 2 | Risk Ratio (M‐H, Fixed, 95% CI) | Subtotals only | |
| 3.1 6 months | 2 | 68 | Risk Ratio (M‐H, Fixed, 95% CI) | 0.2 [0.01, 3.92] |
| 3.2 12 months | 2 | 68 | Risk Ratio (M‐H, Fixed, 95% CI) | 0.34 [0.10, 1.19] |
| 3.3 24 months | 2 | 68 | Risk Ratio (M‐H, Fixed, 95% CI) | 0.42 [0.18, 0.95] |
| 4 Pain Show forest plot | 2 | Risk Ratio (M‐H, Fixed, 95% CI) | Subtotals only | |
| 4.1 24 months | 2 | 196 | Risk Ratio (M‐H, Fixed, 95% CI) | 0.41 [0.09, 1.73] |
| 5 Soft tissue pathology Show forest plot | 4 | Risk Ratio (M‐H, Fixed, 95% CI) | Subtotals only | |
| 5.1 6 months | 3 | 122 | Risk Ratio (M‐H, Fixed, 95% CI) | 0.2 [0.02, 1.62] |
| 5.2 12 months | 3 | 122 | Risk Ratio (M‐H, Fixed, 95% CI) | 0.12 [0.02, 0.62] |
| 5.3 24 months | 4 | 256 | Risk Ratio (M‐H, Fixed, 95% CI) | 0.17 [0.06, 0.47] |
| 6 Pathological mobility Show forest plot | 4 | Risk Ratio (M‐H, Fixed, 95% CI) | Subtotals only | |
| 6.1 6 months | 3 | 122 | Risk Ratio (M‐H, Fixed, 95% CI) | 0.2 [0.02, 1.62] |
| 6.2 12 months | 3 | 122 | Risk Ratio (M‐H, Fixed, 95% CI) | 0.09 [0.01, 0.66] |
| 6.3 24 months | 4 | 256 | Risk Ratio (M‐H, Fixed, 95% CI) | 0.09 [0.01, 0.66] |
| 7 Pathological radiolucency Show forest plot | 5 | Risk Ratio (M‐H, Fixed, 95% CI) | Subtotals only | |
| 7.1 6 months | 4 | 162 | Risk Ratio (M‐H, Fixed, 95% CI) | 0.10 [0.02, 0.50] |
| 7.2 12 months | 4 | 162 | Risk Ratio (M‐H, Fixed, 95% CI) | 0.14 [0.04, 0.47] |
| 7.3 24 months | 5 | 296 | Risk Ratio (M‐H, Fixed, 95% CI) | 0.08 [0.03, 0.22] |
| 8 Pathological root resorption Show forest plot | 6 | Risk Ratio (M‐H, Fixed, 95% CI) | Subtotals only | |
| 8.1 6 months | 5 | 190 | Risk Ratio (M‐H, Fixed, 95% CI) | 0.10 [0.02, 0.39] |
| 8.2 12 months | 5 | 190 | Risk Ratio (M‐H, Fixed, 95% CI) | 0.07 [0.02, 0.29] |
| 8.3 24 months | 6 | 324 | Risk Ratio (M‐H, Fixed, 95% CI) | 0.08 [0.03, 0.18] |
| 9 Pulp canal obliteration Show forest plot | 4 | Risk Ratio (M‐H, Fixed, 95% CI) | Subtotals only | |
| 9.1 6 months | 3 | 120 | Risk Ratio (M‐H, Fixed, 95% CI) | 7.77 [1.56, 38.69] |
| 9.2 12 months | 3 | 120 | Risk Ratio (M‐H, Fixed, 95% CI) | 2.01 [0.97, 4.17] |
| 9.3 24 months | 4 | 254 | Risk Ratio (M‐H, Fixed, 95% CI) | 2.05 [1.01, 4.19] |
| 10 Dentin bridge formation Show forest plot | 2 | Risk Ratio (M‐H, Fixed, 95% CI) | Subtotals only | |
| 10.1 6 months | 2 | 60 | Risk Ratio (M‐H, Fixed, 95% CI) | 0.2 [0.05, 0.84] |
| 10.2 12 months | 2 | 60 | Risk Ratio (M‐H, Fixed, 95% CI) | 0.8 [0.37, 1.74] |
| 10.3 24 months | 2 | 60 | Risk Ratio (M‐H, Fixed, 95% CI) | 0.8 [0.37, 1.74] |
| Outcome or subgroup title | No. of studies | No. of participants | Statistical method | Effect size |
| 1 Clinical failure Show forest plot | 3 | Risk Ratio (M‐H, Fixed, 95% CI) | Subtotals only | |
| 1.1 6 months | 3 | 130 | Risk Ratio (M‐H, Fixed, 95% CI) | 0.2 [0.01, 4.02] |
| 1.2 12 months | 3 | 130 | Risk Ratio (M‐H, Fixed, 95% CI) | 0.2 [0.01, 4.02] |
| 1.3 24 months | 3 | 130 | Risk Ratio (M‐H, Fixed, 95% CI) | 0.2 [0.01, 4.02] |
| 2 Radiological failure Show forest plot | 3 | Risk Ratio (M‐H, Fixed, 95% CI) | Subtotals only | |
| 2.1 6 months | 3 | 130 | Risk Ratio (M‐H, Fixed, 95% CI) | 0.0 [0.0, 0.0] |
| 2.2 12 months | 3 | 130 | Risk Ratio (M‐H, Fixed, 95% CI) | 0.0 [0.0, 0.0] |
| 2.3 24 months | 3 | 130 | Risk Ratio (M‐H, Fixed, 95% CI) | 0.5 [0.10, 2.56] |
| 3 Pain Show forest plot | 3 | Risk Ratio (M‐H, Fixed, 95% CI) | Subtotals only | |
| 3.1 6 months | 3 | 130 | Risk Ratio (M‐H, Fixed, 95% CI) | 0.33 [0.01, 7.91] |
| 3.2 12 months | 3 | 130 | Risk Ratio (M‐H, Fixed, 95% CI) | 0.33 [0.01, 7.91] |
| 3.3 24 months | 3 | 130 | Risk Ratio (M‐H, Fixed, 95% CI) | 0.33 [0.01, 7.91] |
| 4 Soft tissue pathology Show forest plot | 3 | Risk Ratio (M‐H, Fixed, 95% CI) | Subtotals only | |
| 4.1 6 months | 3 | 130 | Risk Ratio (M‐H, Fixed, 95% CI) | 0.2 [0.01, 4.02] |
| 4.2 12 months | 3 | 130 | Risk Ratio (M‐H, Fixed, 95% CI) | 0.2 [0.01, 4.02] |
| 4.3 24 months | 3 | 130 | Risk Ratio (M‐H, Fixed, 95% CI) | 0.2 [0.01, 4.02] |
| 5 Pathologic mobility Show forest plot | 3 | Risk Ratio (M‐H, Fixed, 95% CI) | Subtotals only | |
| 5.1 6 months | 3 | 130 | Risk Ratio (M‐H, Fixed, 95% CI) | 0.33 [0.01, 7.91] |
| 5.2 12 months | 3 | 130 | Risk Ratio (M‐H, Fixed, 95% CI) | 0.33 [0.01, 7.91] |
| 5.3 24 months | 3 | 130 | Risk Ratio (M‐H, Fixed, 95% CI) | 0.33 [0.01, 7.91] |
| 6 Pathological radiolucency Show forest plot | 3 | Risk Ratio (M‐H, Fixed, 95% CI) | Subtotals only | |
| 6.1 6 months | 3 | 130 | Risk Ratio (M‐H, Fixed, 95% CI) | 0.0 [0.0, 0.0] |
| 6.2 12 months | 3 | 130 | Risk Ratio (M‐H, Fixed, 95% CI) | 0.0 [0.0, 0.0] |
| 6.3 24 months | 3 | 130 | Risk Ratio (M‐H, Fixed, 95% CI) | 0.67 [0.12, 3.75] |
| 7 Pathological root resorption Show forest plot | 3 | Risk Ratio (M‐H, Fixed, 95% CI) | Subtotals only | |
| 7.1 6 months | 3 | 130 | Risk Ratio (M‐H, Fixed, 95% CI) | 0.0 [0.0, 0.0] |
| 7.2 12 months | 3 | 130 | Risk Ratio (M‐H, Fixed, 95% CI) | 0.0 [0.0, 0.0] |
| 7.3 24 months | 3 | 130 | Risk Ratio (M‐H, Fixed, 95% CI) | 0.33 [0.01, 7.91] |
| 8 Pulp canal obliteration Show forest plot | 2 | Risk Ratio (M‐H, Fixed, 95% CI) | Subtotals only | |
| 8.1 6 months | 2 | 60 | Risk Ratio (M‐H, Fixed, 95% CI) | 0.73 [0.49, 1.08] |
| 8.2 12 months | 2 | 60 | Risk Ratio (M‐H, Fixed, 95% CI) | 0.83 [0.60, 1.14] |
| 8.3 24 months | 2 | 60 | Risk Ratio (M‐H, Fixed, 95% CI) | 0.96 [0.71, 1.29] |
| 9 Dentin bridge formation Show forest plot | 2 | Risk Ratio (M‐H, Fixed, 95% CI) | Subtotals only | |
| 9.1 6 months | 2 | 60 | Risk Ratio (M‐H, Fixed, 95% CI) | 0.56 [0.13, 2.43] |
| 9.2 12 months | 2 | 60 | Risk Ratio (M‐H, Fixed, 95% CI) | 1.5 [0.61, 3.71] |
| 9.3 24 months | 2 | 60 | Risk Ratio (M‐H, Fixed, 95% CI) | 1.5 [0.61, 3.71] |
| Outcome or subgroup title | No. of studies | No. of participants | Statistical method | Effect size |
| 1 Clinical failure Show forest plot | 4 | Risk Ratio (M‐H, Fixed, 95% CI) | Subtotals only | |
| 1.1 6 months | 4 | 234 | Risk Ratio (M‐H, Fixed, 95% CI) | 1.72 [0.42, 6.99] |
| 1.2 12 months | 2 | 144 | Risk Ratio (M‐H, Fixed, 95% CI) | 0.75 [0.16, 3.62] |
| 2 Radiological failure Show forest plot | 4 | Risk Ratio (M‐H, Fixed, 95% CI) | Subtotals only | |
| 2.1 6 months | 4 | 234 | Risk Ratio (M‐H, Fixed, 95% CI) | 2.40 [0.65, 8.84] |
| 2.2 12 months | 2 | 144 | Risk Ratio (M‐H, Fixed, 95% CI) | 1.08 [0.22, 5.27] |
| 3 Pain Show forest plot | 3 | Risk Ratio (M‐H, Fixed, 95% CI) | Subtotals only | |
| 3.1 6 months | 3 | 180 | Risk Ratio (M‐H, Fixed, 95% CI) | 5.0 [0.26, 98.00] |
| 4 Soft tissue pathology Show forest plot | 3 | Risk Ratio (M‐H, Fixed, 95% CI) | Subtotals only | |
| 4.1 6 months | 3 | 180 | Risk Ratio (M‐H, Fixed, 95% CI) | 5.0 [0.26, 98.00] |
| 5 Pathologic mobility Show forest plot | 3 | Risk Ratio (M‐H, Fixed, 95% CI) | Subtotals only | |
| 5.1 6 months | 3 | 180 | Risk Ratio (M‐H, Fixed, 95% CI) | 5.0 [0.26, 98.00] |
| 6 Pathological radiolucency Show forest plot | 2 | Risk Ratio (M‐H, Fixed, 95% CI) | Subtotals only | |
| 6.1 6 months | 2 | 144 | Risk Ratio (M‐H, Fixed, 95% CI) | 3.46 [0.15, 81.36] |
| 6.2 12 months | 2 | 144 | Risk Ratio (M‐H, Fixed, 95% CI) | 1.09 [0.19, 6.27] |
| 7 Pathological root resorption Show forest plot | 2 | Risk Ratio (M‐H, Fixed, 95% CI) | Subtotals only | |
| 7.1 6 months | 2 | 144 | Risk Ratio (M‐H, Fixed, 95% CI) | 2.32 [0.22, 24.09] |
| 7.2 12 months | 2 | 144 | Risk Ratio (M‐H, Fixed, 95% CI) | 1.12 [0.30, 4.19] |
| Outcome or subgroup title | No. of studies | No. of participants | Statistical method | Effect size |
| 1 Clinical failure Show forest plot | 6 | Risk Ratio (M‐H, Fixed, 95% CI) | Subtotals only | |
| 1.1 6 months | 6 | 332 | Risk Ratio (M‐H, Fixed, 95% CI) | 1.98 [1.17, 3.37] |
| 1.2 12 months | 6 | 332 | Risk Ratio (M‐H, Fixed, 95% CI) | 1.87 [1.22, 2.89] |
| 1.3 24 months | 3 | 150 | Risk Ratio (M‐H, Fixed, 95% CI) | 2.18 [0.78, 6.11] |
| 2 Radiological failure Show forest plot | 6 | Risk Ratio (M‐H, Fixed, 95% CI) | Subtotals only | |
| 2.1 6 months | 4 | 154 | Risk Ratio (M‐H, Fixed, 95% CI) | 15.48 [3.86, 62.06] |
| 2.2 12 months | 6 | 332 | Risk Ratio (M‐H, Fixed, 95% CI) | 1.86 [1.42, 2.44] |
| 2.3 24 months | 3 | 150 | Risk Ratio (M‐H, Fixed, 95% CI) | 3.63 [1.73, 7.61] |
| 3 Overall failure Show forest plot | 2 | Risk Ratio (M‐H, Fixed, 95% CI) | Subtotals only | |
| 3.1 12 months | 2 | 120 | Risk Ratio (M‐H, Fixed, 95% CI) | 2.41 [0.80, 7.21] |
| 3.2 24 months | 2 | 120 | Risk Ratio (M‐H, Fixed, 95% CI) | 2.93 [1.35, 6.34] |
| 4 Pain Show forest plot | 4 | Risk Ratio (M‐H, Fixed, 95% CI) | Subtotals only | |
| 4.1 6 months | 4 | 276 | Risk Ratio (M‐H, Fixed, 95% CI) | 3.18 [0.35, 29.08] |
| 4.2 12 months | 4 | 276 | Risk Ratio (M‐H, Fixed, 95% CI) | 6.30 [1.15, 34.40] |
| 5 Soft tissue pathology Show forest plot | 5 | Risk Ratio (M‐H, Fixed, 95% CI) | Subtotals only | |
| 5.1 6 months | 5 | 306 | Risk Ratio (M‐H, Fixed, 95% CI) | 5.14 [0.63, 42.25] |
| 5.2 12 months | 5 | 306 | Risk Ratio (M‐H, Fixed, 95% CI) | 6.77 [1.23, 37.10] |
| 5.3 24 months | 2 | 124 | Risk Ratio (M‐H, Fixed, 95% CI) | 2.64 [0.51, 13.55] |
| 6 Pathological mobility Show forest plot | 4 | Risk Ratio (M‐H, Fixed, 95% CI) | Subtotals only | |
| 6.1 6 months | 4 | 238 | Risk Ratio (M‐H, Fixed, 95% CI) | 1.21 [0.18, 8.19] |
| 6.2 12 months | 4 | 238 | Risk Ratio (M‐H, Fixed, 95% CI) | 1.14 [0.40, 3.31] |
| 6.3 24 months | 2 | 124 | Risk Ratio (M‐H, Fixed, 95% CI) | 9.0 [0.53, 153.79] |
| 7 Pathological radiolucency Show forest plot | 5 | Risk Ratio (M‐H, Fixed, 95% CI) | Subtotals only | |
| 7.1 6 months | 3 | 128 | Risk Ratio (M‐H, Fixed, 95% CI) | 3.78 [0.64, 22.17] |
| 7.2 12 months | 5 | 306 | Risk Ratio (M‐H, Fixed, 95% CI) | 1.90 [0.67, 5.40] |
| 7.3 24 months | 2 | 124 | Risk Ratio (M‐H, Fixed, 95% CI) | 3.24 [0.79, 13.28] |
| 8 Pathological root resorption Show forest plot | 6 | Risk Ratio (M‐H, Fixed, 95% CI) | Subtotals only | |
| 8.1 6 months | 4 | 154 | Risk Ratio (M‐H, Fixed, 95% CI) | 11.87 [2.33, 60.40] |
| 8.2 12 months | 6 | 332 | Risk Ratio (M‐H, Fixed, 95% CI) | 6.25 [2.04, 19.14] |
| 8.3 24 months | 3 | 150 | Risk Ratio (M‐H, Fixed, 95% CI) | 4.59 [1.33, 15.81] |
| 9 Pulp canal obliteration Show forest plot | 3 | Risk Ratio (M‐H, Fixed, 95% CI) | Subtotals only | |
| 9.1 6 months | 2 | 56 | Risk Ratio (M‐H, Fixed, 95% CI) | 4.0 [0.47, 33.75] |
| 9.2 12 months | 3 | 140 | Risk Ratio (M‐H, Fixed, 95% CI) | 2.68 [0.91, 7.95] |
| 10 Dentin bridge formation Show forest plot | 2 | Risk Ratio (M‐H, Fixed, 95% CI) | Subtotals only | |
| 10.1 6 months | 2 | 60 | Risk Ratio (M‐H, Fixed, 95% CI) | 13.0 [1.81, 93.60] |
| 10.2 12 months | 2 | 60 | Risk Ratio (M‐H, Fixed, 95% CI) | 14.0 [1.95, 100.26] |
| Outcome or subgroup title | No. of studies | No. of participants | Statistical method | Effect size |
| 1 Clinical failure Show forest plot | 2 | Risk Ratio (M‐H, Fixed, 95% CI) | Subtotals only | |
| 1.1 6 months | 2 | 122 | Risk Ratio (M‐H, Fixed, 95% CI) | 3.4 [0.14, 81.38] |
| 1.2 12 months | 2 | 122 | Risk Ratio (M‐H, Fixed, 95% CI) | 3.41 [0.37, 31.61] |
| 1.3 24 months | 2 | 122 | Risk Ratio (M‐H, Fixed, 95% CI) | 3.44 [0.90, 13.18] |
| 2 Radiological failure Show forest plot | 2 | Risk Ratio (M‐H, Fixed, 95% CI) | Subtotals only | |
| 2.1 12 months | 2 | 122 | Risk Ratio (M‐H, Fixed, 95% CI) | 1.28 [0.53, 3.13] |
| 2.2 24 months | 2 | 122 | Risk Ratio (M‐H, Fixed, 95% CI) | 1.97 [1.04, 3.75] |
| 3 Overall failure Show forest plot | 2 | Risk Ratio (M‐H, Fixed, 95% CI) | Subtotals only | |
| 3.1 12 months | 2 | 122 | Risk Ratio (M‐H, Fixed, 95% CI) | 1.28 [0.53, 3.13] |
| 3.2 24 months | 2 | 122 | Risk Ratio (M‐H, Fixed, 95% CI) | 1.97 [1.04, 3.75] |
| 4 Pathological root resorption Show forest plot | 2 | Risk Ratio (M‐H, Fixed, 95% CI) | Subtotals only | |
| 4.1 12 months | 2 | 122 | Risk Ratio (M‐H, Fixed, 95% CI) | 0.57 [0.05, 6.05] |
| 4.2 24 months | 2 | 122 | Risk Ratio (M‐H, Fixed, 95% CI) | 2.29 [0.60, 8.66] |
| Outcome or subgroup title | No. of studies | No. of participants | Statistical method | Effect size |
| 1 Clinical failure Show forest plot | 7 | Risk Ratio (M‐H, Fixed, 95% CI) | Subtotals only | |
| 1.1 6 months | 7 | 394 | Risk Ratio (M‐H, Fixed, 95% CI) | 1.0 [0.15, 6.87] |
| 1.2 12 months | 7 | 394 | Risk Ratio (M‐H, Fixed, 95% CI) | 1.38 [0.45, 4.27] |
| 1.3 24 months | 5 | 258 | Risk Ratio (M‐H, Fixed, 95% CI) | 0.83 [0.40, 1.70] |
| 2 Radiological failure Show forest plot | 7 | Risk Ratio (M‐H, Fixed, 95% CI) | Subtotals only | |
| 2.1 6 months | 6 | 294 | Risk Ratio (M‐H, Fixed, 95% CI) | 0.79 [0.32, 1.92] |
| 2.2 12 months | 7 | 394 | Risk Ratio (M‐H, Fixed, 95% CI) | 1.33 [0.73, 2.42] |
| 2.3 24 months | 5 | 258 | Risk Ratio (M‐H, Fixed, 95% CI) | 1.26 [0.71, 2.24] |
| 3 Overall failure Show forest plot | 5 | Risk Ratio (M‐H, Fixed, 95% CI) | Subtotals only | |
| 3.1 6 months | 4 | 184 | Risk Ratio (M‐H, Fixed, 95% CI) | 0.53 [0.12, 2.37] |
| 3.2 12 months | 5 | 284 | Risk Ratio (M‐H, Fixed, 95% CI) | 1.16 [0.51, 2.64] |
| 3.3 24 months | 4 | 228 | Risk Ratio (M‐H, Fixed, 95% CI) | 1.49 [0.74, 3.01] |
| 4 Pain Show forest plot | 4 | Risk Ratio (M‐H, Fixed, 95% CI) | Subtotals only | |
| 4.1 6 months | 4 | 230 | Risk Ratio (M‐H, Fixed, 95% CI) | 0.33 [0.01, 7.58] |
| 4.2 12 months | 4 | 230 | Risk Ratio (M‐H, Fixed, 95% CI) | 0.33 [0.01, 7.58] |
| 4.3 24 months | 4 | 230 | Risk Ratio (M‐H, Fixed, 95% CI) | 0.2 [0.01, 3.85] |
| 5 Pathological radiolucency Show forest plot | 4 | Risk Ratio (M‐H, Fixed, 95% CI) | Subtotals only | |
| 5.1 12 months | 4 | 230 | Risk Ratio (M‐H, Fixed, 95% CI) | 1.8 [0.40, 8.17] |
| 5.2 24 months | 4 | 230 | Risk Ratio (M‐H, Fixed, 95% CI) | 2.2 [0.51, 9.50] |
| 6 Pathological root resorption Show forest plot | 6 | Risk Ratio (M‐H, Fixed, 95% CI) | Subtotals only | |
| 6.1 6 months | 5 | 214 | Risk Ratio (M‐H, Fixed, 95% CI) | 0.67 [0.12, 3.84] |
| 6.2 12 months | 6 | 314 | Risk Ratio (M‐H, Fixed, 95% CI) | 1.64 [0.53, 5.08] |
| 6.3 24 months | 5 | 258 | Risk Ratio (M‐H, Fixed, 95% CI) | 1.21 [0.50, 2.96] |
| 7 Pulp canal obliteration Show forest plot | 3 | Risk Ratio (M‐H, Fixed, 95% CI) | Subtotals only | |
| 7.1 6 months | 3 | 134 | Risk Ratio (M‐H, Fixed, 95% CI) | 0.0 [0.0, 0.0] |
| 7.2 12 months | 3 | 134 | Risk Ratio (M‐H, Fixed, 95% CI) | 0.94 [0.54, 1.64] |
| 7.3 24 months | 2 | 78 | Risk Ratio (M‐H, Fixed, 95% CI) | 1.24 [0.28, 5.54] |
| Outcome or subgroup title | No. of studies | No. of participants | Statistical method | Effect size |
| 1 Clinical failure Show forest plot | 2 | Risk Ratio (M‐H, Fixed, 95% CI) | Subtotals only | |
| 1.1 6 months | 2 | 110 | Risk Ratio (M‐H, Fixed, 95% CI) | 0.0 [0.0, 0.0] |
| 1.2 12 months | 2 | 110 | Risk Ratio (M‐H, Fixed, 95% CI) | 4.39 [0.22, 87.82] |
| 2 Radiological failure Show forest plot | 2 | Risk Ratio (M‐H, Fixed, 95% CI) | Subtotals only | |
| 2.1 6 months | 2 | 110 | Risk Ratio (M‐H, Fixed, 95% CI) | 0.55 [0.22, 1.39] |
| 2.2 12 months | 2 | 110 | Risk Ratio (M‐H, Fixed, 95% CI) | 0.42 [0.17, 1.02] |
| 3 Pain Show forest plot | 2 | Risk Ratio (M‐H, Fixed, 95% CI) | Subtotals only | |
| 3.1 6 months | 2 | 110 | Risk Ratio (M‐H, Fixed, 95% CI) | 0.0 [0.0, 0.0] |
| 3.2 12 months | 2 | 110 | Risk Ratio (M‐H, Fixed, 95% CI) | 0.0 [0.0, 0.0] |
| 4 Soft tissue pathology Show forest plot | 2 | Risk Ratio (M‐H, Fixed, 95% CI) | Subtotals only | |
| 4.1 6 months | 2 | 110 | Risk Ratio (M‐H, Fixed, 95% CI) | 0.0 [0.0, 0.0] |
| 4.2 12 months | 2 | 110 | Risk Ratio (M‐H, Fixed, 95% CI) | 0.29 [0.01, 6.91] |
| 5 Adjacent tissue inflammation Show forest plot | 2 | Risk Ratio (M‐H, Fixed, 95% CI) | Subtotals only | |
| 5.1 6 months | 2 | 110 | Risk Ratio (M‐H, Fixed, 95% CI) | 0.0 [0.0, 0.0] |
| 5.2 12 months | 2 | 110 | Risk Ratio (M‐H, Fixed, 95% CI) | 0.31 [0.03, 2.91] |
| 6 Pathologic mobility Show forest plot | 2 | Risk Ratio (M‐H, Fixed, 95% CI) | Subtotals only | |
| 6.1 6 months | 2 | 110 | Risk Ratio (M‐H, Fixed, 95% CI) | 0.0 [0.0, 0.0] |
| 6.2 12 months | 2 | 110 | Risk Ratio (M‐H, Fixed, 95% CI) | 0.0 [0.0, 0.0] |
| 7 Pathologic radiolucency Show forest plot | 2 | Risk Ratio (M‐H, Fixed, 95% CI) | Subtotals only | |
| 7.1 6 months | 2 | 110 | Risk Ratio (M‐H, Fixed, 95% CI) | 0.88 [0.06, 13.35] |
| 7.2 12 months | 2 | 110 | Risk Ratio (M‐H, Fixed, 95% CI) | 0.56 [0.07, 4.17] |
| 8 Pathologic root resorption Show forest plot | 2 | Risk Ratio (M‐H, Fixed, 95% CI) | Subtotals only | |
| 8.1 6 months | 2 | 110 | Risk Ratio (M‐H, Fixed, 95% CI) | 0.51 [0.18, 1.42] |
| 8.2 12 months | 2 | 110 | Risk Ratio (M‐H, Fixed, 95% CI) | 0.38 [0.15, 1.01] |
| Outcome or subgroup title | No. of studies | No. of participants | Statistical method | Effect size |
| 1 Clinical failure Show forest plot | 3 | Risk Ratio (M‐H, Fixed, 95% CI) | Subtotals only | |
| 1.1 6 months | 3 | 130 | Risk Ratio (M‐H, Fixed, 95% CI) | 0.23 [0.04, 1.30] |
| 1.2 12 months | 2 | 100 | Risk Ratio (M‐H, Fixed, 95% CI) | 0.2 [0.02, 1.62] |
| 2 Radiological failure Show forest plot | 3 | Risk Ratio (M‐H, Fixed, 95% CI) | Subtotals only | |
| 2.1 6 months | 3 | 130 | Risk Ratio (M‐H, Fixed, 95% CI) | 0.89 [0.38, 2.12] |
| 2.2 12 months | 2 | 100 | Risk Ratio (M‐H, Fixed, 95% CI) | 0.91 [0.44, 1.92] |
| 3 Pain Show forest plot | 2 | Risk Ratio (M‐H, Fixed, 95% CI) | Subtotals only | |
| 3.1 6 months | 2 | 50 | Risk Ratio (M‐H, Fixed, 95% CI) | 0.2 [0.03, 1.60] |
| 4 Pathological radiolucency Show forest plot | 2 | Risk Ratio (M‐H, Fixed, 95% CI) | Subtotals only | |
| 4.1 6 months | 2 | 50 | Risk Ratio (M‐H, Fixed, 95% CI) | 0.25 [0.03, 2.08] |
| 5 Pathological root resorption Show forest plot | 2 | Risk Ratio (M‐H, Fixed, 95% CI) | Subtotals only | |
| 5.1 6 months | 2 | 50 | Risk Ratio (M‐H, Fixed, 95% CI) | 1.5 [0.29, 7.73] |
| Outcome or subgroup title | No. of studies | No. of participants | Statistical method | Effect size |
| 1 Clinical failure Show forest plot | 2 | Risk Ratio (M‐H, Fixed, 95% CI) | Subtotals only | |
| 1.1 6 months | 2 | 50 | Risk Ratio (M‐H, Fixed, 95% CI) | 0.56 [0.13, 2.34] |
| 2 Radiological failure Show forest plot | 2 | Risk Ratio (M‐H, Fixed, 95% CI) | Subtotals only | |
| 2.1 6 months | 2 | 50 | Risk Ratio (M‐H, Fixed, 95% CI) | 1.25 [0.38, 4.12] |
| 3 Pain Show forest plot | 2 | Risk Ratio (M‐H, Fixed, 95% CI) | Subtotals only | |
| 3.1 6 months | 2 | 50 | Risk Ratio (M‐H, Fixed, 95% CI) | 0.56 [0.13, 2.34] |
| 4 Pathological mobility Show forest plot | 2 | Risk Ratio (M‐H, Fixed, 95% CI) | Subtotals only | |
| 4.1 6 months | 2 | 50 | Risk Ratio (M‐H, Fixed, 95% CI) | 0.0 [0.0, 0.0] |
| 5 Pathological root resorption Show forest plot | 2 | Risk Ratio (M‐H, Fixed, 95% CI) | Subtotals only | |
| 5.1 6 months | 2 | 50 | Risk Ratio (M‐H, Fixed, 95% CI) | 2.2 [0.54, 8.88] |
| 6 Pulp canal obliteration Show forest plot | 2 | Risk Ratio (M‐H, Fixed, 95% CI) | Subtotals only | |
| 6.1 6 months | 2 | 50 | Risk Ratio (M‐H, Fixed, 95% CI) | 0.0 [0.0, 0.0] |
| Outcome or subgroup title | No. of studies | No. of participants | Statistical method | Effect size |
| 1 Clinical failure Show forest plot | 2 | Risk Ratio (M‐H, Fixed, 95% CI) | Subtotals only | |
| 1.1 6 months | 2 | 100 | Risk Ratio (M‐H, Fixed, 95% CI) | 0.0 [0.0, 0.0] |
| 1.2 12 months | 2 | 100 | Risk Ratio (M‐H, Fixed, 95% CI) | 1.25 [0.37, 4.27] |
| 2 Radiological failure Show forest plot | 2 | Risk Ratio (M‐H, Fixed, 95% CI) | Subtotals only | |
| 2.1 6 months | 2 | 100 | Risk Ratio (M‐H, Fixed, 95% CI) | 1.0 [0.16, 6.20] |
| 2.2 12 months | 2 | 100 | Risk Ratio (M‐H, Fixed, 95% CI) | 0.88 [0.34, 2.23] |
| 3 Pain Show forest plot | 2 | Risk Ratio (M‐H, Fixed, 95% CI) | Subtotals only | |
| 3.1 6 months | 2 | 100 | Risk Ratio (M‐H, Fixed, 95% CI) | 0.0 [0.0, 0.0] |
| 3.2 12 months | 2 | 100 | Risk Ratio (M‐H, Fixed, 95% CI) | 1.0 [0.15, 6.71] |
| 4 Soft tissue pathology Show forest plot | 2 | Risk Ratio (M‐H, Fixed, 95% CI) | Subtotals only | |
| 4.1 6 months | 2 | 100 | Risk Ratio (M‐H, Fixed, 95% CI) | 0.0 [0.0, 0.0] |
| 4.2 12 months | 2 | 100 | Risk Ratio (M‐H, Fixed, 95% CI) | 1.5 [0.27, 8.43] |
| 5 Pathologic mobility Show forest plot | 2 | Risk Ratio (M‐H, Fixed, 95% CI) | Subtotals only | |
| 5.1 6 months | 2 | 100 | Risk Ratio (M‐H, Fixed, 95% CI) | 0.0 [0.0, 0.0] |
| 5.2 12 months | 2 | 100 | Risk Ratio (M‐H, Fixed, 95% CI) | 0.0 [0.0, 0.0] |
| 6 Pathologic radiolucency Show forest plot | 2 | Risk Ratio (M‐H, Fixed, 95% CI) | Subtotals only | |
| 6.1 6 months | 2 | 100 | Risk Ratio (M‐H, Fixed, 95% CI) | 0.0 [0.0, 0.0] |
| 6.2 12 months | 2 | 100 | Risk Ratio (M‐H, Fixed, 95% CI) | 0.67 [0.12, 3.75] |
| 7 Pathologic root resorption Show forest plot | 2 | Risk Ratio (M‐H, Fixed, 95% CI) | Subtotals only | |
| 7.1 6 months | 2 | 100 | Risk Ratio (M‐H, Fixed, 95% CI) | 5.0 [0.26, 96.13] |
| 7.2 12 months | 2 | 100 | Risk Ratio (M‐H, Fixed, 95% CI) | 1.0 [0.31, 3.23] |
| Outcome or subgroup title | No. of studies | No. of participants | Statistical method | Effect size |
| 1 Clinical failure Show forest plot | 2 | Risk Ratio (M‐H, Fixed, 95% CI) | Subtotals only | |
| 1.1 6 months | 2 | 50 | Risk Ratio (M‐H, Fixed, 95% CI) | 0.2 [0.01, 3.70] |
| 2 Radiological failure Show forest plot | 2 | Risk Ratio (M‐H, Fixed, 95% CI) | Subtotals only | |
| 2.1 6 months | 2 | 50 | Risk Ratio (M‐H, Fixed, 95% CI) | 0.64 [0.19, 2.18] |
| 3 Pain Show forest plot | 2 | Risk Ratio (M‐H, Fixed, 95% CI) | Subtotals only | |
| 3.1 6 months | 2 | 50 | Risk Ratio (M‐H, Fixed, 95% CI) | 0.2 [0.01, 3.70] |
| 4 Pathological mobility Show forest plot | 2 | Risk Ratio (M‐H, Fixed, 95% CI) | Subtotals only | |
| 4.1 6 months | 2 | 50 | Risk Ratio (M‐H, Fixed, 95% CI) | 0.0 [0.0, 0.0] |
| 5 Pathological radiolucency Show forest plot | 2 | Risk Ratio (M‐H, Fixed, 95% CI) | Subtotals only | |
| 5.1 6 months | 2 | 50 | Risk Ratio (M‐H, Fixed, 95% CI) | 0.0 [0.0, 0.0] |
| 6 Pathological root resorption Show forest plot | 2 | Risk Ratio (M‐H, Fixed, 95% CI) | Subtotals only | |
| 6.1 6 months | 2 | 50 | Risk Ratio (M‐H, Fixed, 95% CI) | 0.64 [0.19, 2.18] |
| 7 Pulp canal obliteration Show forest plot | 2 | Risk Ratio (M‐H, Fixed, 95% CI) | Subtotals only | |
| 7.1 6 months | 2 | 50 | Risk Ratio (M‐H, Fixed, 95% CI) | 0.0 [0.0, 0.0] |
| Outcome or subgroup title | No. of studies | No. of participants | Statistical method | Effect size |
| 1 Clinical failure Show forest plot | 2 | Risk Ratio (M‐H, Fixed, 95% CI) | Subtotals only | |
| 1.1 6 months | 2 | 150 | Risk Ratio (M‐H, Fixed, 95% CI) | 0.0 [0.0, 0.0] |
| 1.2 12 months | 2 | 150 | Risk Ratio (M‐H, Fixed, 95% CI) | 0.0 [0.0, 0.0] |
| 2 Radiological failure Show forest plot | 2 | Risk Ratio (M‐H, Fixed, 95% CI) | Subtotals only | |
| 2.1 6 months | 2 | 150 | Risk Ratio (M‐H, Fixed, 95% CI) | 1.29 [0.33, 5.08] |
| 2.2 12 months | 2 | 150 | Risk Ratio (M‐H, Fixed, 95% CI) | 1.86 [0.52, 6.59] |
| 3 Pain Show forest plot | 2 | Risk Ratio (M‐H, Fixed, 95% CI) | Subtotals only | |
| 3.1 6 months | 2 | 150 | Risk Ratio (M‐H, Fixed, 95% CI) | 0.0 [0.0, 0.0] |
| 3.2 12 months | 2 | 150 | Risk Ratio (M‐H, Fixed, 95% CI) | 0.0 [0.0, 0.0] |
| 4 Soft tissue pathology Show forest plot | 2 | Risk Ratio (M‐H, Fixed, 95% CI) | Subtotals only | |
| 4.1 6 months | 2 | 150 | Risk Ratio (M‐H, Fixed, 95% CI) | 0.0 [0.0, 0.0] |
| 4.2 12 months | 2 | 150 | Risk Ratio (M‐H, Fixed, 95% CI) | 0.0 [0.0, 0.0] |
| 5 Pathologic mobility Show forest plot | 2 | Risk Ratio (M‐H, Fixed, 95% CI) | Subtotals only | |
| 5.1 6 months | 2 | 150 | Risk Ratio (M‐H, Fixed, 95% CI) | 0.0 [0.0, 0.0] |
| 5.2 12 months | 2 | 150 | Risk Ratio (M‐H, Fixed, 95% CI) | 0.0 [0.0, 0.0] |
| 6 Pathologic radiolucency Show forest plot | 2 | Risk Ratio (M‐H, Fixed, 95% CI) | Subtotals only | |
| 6.1 6 months | 2 | 150 | Risk Ratio (M‐H, Fixed, 95% CI) | 0.0 [0.0, 0.0] |
| 6.2 12 months | 2 | 150 | Risk Ratio (M‐H, Fixed, 95% CI) | 0.0 [0.0, 0.0] |
| 7 Pathologic root resorption Show forest plot | 2 | Risk Ratio (M‐H, Fixed, 95% CI) | Subtotals only | |
| 7.1 6 months | 2 | 150 | Risk Ratio (M‐H, Fixed, 95% CI) | 1.29 [0.33, 5.08] |
| 7.2 12 months | 2 | 150 | Risk Ratio (M‐H, Fixed, 95% CI) | 1.86 [0.52, 6.59] |
| Outcome or subgroup title | No. of studies | No. of participants | Statistical method | Effect size |
| 1 Clinical failure Show forest plot | 2 | Risk Ratio (M‐H, Fixed, 95% CI) | Subtotals only | |
| 1.1 6 months | 2 | 100 | Risk Ratio (M‐H, Fixed, 95% CI) | 0.8 [0.23, 2.83] |
| 2 Pain Show forest plot | 2 | Risk Ratio (M‐H, Fixed, 95% CI) | Subtotals only | |
| 2.1 6 months | 2 | 100 | Risk Ratio (M‐H, Fixed, 95% CI) | 0.4 [0.08, 1.92] |
| 3 Soft tissue pathology Show forest plot | 2 | Risk Ratio (M‐H, Fixed, 95% CI) | Subtotals only | |
| 3.1 6 months | 2 | 100 | Risk Ratio (M‐H, Fixed, 95% CI) | 2.0 [0.19, 21.06] |
| 4 Pathologic mobility Show forest plot | 2 | Risk Ratio (M‐H, Fixed, 95% CI) | Subtotals only | |
| 4.1 6 months | 2 | 100 | Risk Ratio (M‐H, Fixed, 95% CI) | 5.0 [0.26, 96.13] |
| Outcome or subgroup title | No. of studies | No. of participants | Statistical method | Effect size |
| 1 Radiological failure Show forest plot | 2 | Risk Ratio (M‐H, Fixed, 95% CI) | Subtotals only | |
| 1.1 6 months | 2 | 110 | Risk Ratio (M‐H, Fixed, 95% CI) | 2.5 [0.50, 12.50] |
| 2 Pain Show forest plot | 2 | Risk Ratio (M‐H, Fixed, 95% CI) | Subtotals only | |
| 2.1 6 months | 2 | 110 | Risk Ratio (M‐H, Fixed, 95% CI) | 1.0 [0.14, 6.90] |
| 3 Pathological mobility Show forest plot | 2 | Risk Ratio (M‐H, Fixed, 95% CI) | Subtotals only | |
| 3.1 6 months | 2 | 110 | Risk Ratio (M‐H, Fixed, 95% CI) | 1.0 [0.14, 6.90] |
| 4 Pathological radiolucency Show forest plot | 2 | Risk Ratio (M‐H, Fixed, 95% CI) | Subtotals only | |
| 4.1 6 months | 2 | 110 | Risk Ratio (M‐H, Fixed, 95% CI) | 1.5 [0.26, 8.72] |
| 5 Pathological radiolucency Show forest plot | 2 | Risk Ratio (M‐H, Fixed, 95% CI) | Subtotals only | |
| 5.1 6 months | 2 | 50 | Risk Ratio (M‐H, Fixed, 95% CI) | 0.25 [0.03, 2.08] |
| Outcome or subgroup title | No. of studies | No. of participants | Statistical method | Effect size |
| 1 Clinical failure Show forest plot | 2 | Risk Ratio (M‐H, Fixed, 95% CI) | Subtotals only | |
| 1.1 6 months | 2 | 62 | Risk Ratio (M‐H, Fixed, 95% CI) | 0.6 [0.08, 4.29] |
| 1.2 12 months | 2 | 62 | Risk Ratio (M‐H, Fixed, 95% CI) | 0.71 [0.15, 3.33] |
| 2 Radiological failure Show forest plot | 2 | Risk Ratio (M‐H, Fixed, 95% CI) | Subtotals only | |
| 2.1 6 months | 2 | 62 | Risk Ratio (M‐H, Fixed, 95% CI) | 1.0 [0.31, 3.27] |
| 2.2 12 months | 2 | 62 | Risk Ratio (M‐H, Fixed, 95% CI) | 1.0 [0.31, 3.27] |
| Outcome or subgroup title | No. of studies | No. of participants | Statistical method | Effect size |
| 1 Clincal failure Show forest plot | 2 | Risk Ratio (M‐H, Fixed, 95% CI) | Subtotals only | |
| 1.1 6 months | 2 | 92 | Risk Ratio (M‐H, Fixed, 95% CI) | 0.33 [0.01, 7.58] |
| 2 Radiological failure Show forest plot | 2 | Risk Ratio (M‐H, Fixed, 95% CI) | Subtotals only | |
| 2.1 6 months | 2 | 92 | Risk Ratio (M‐H, Fixed, 95% CI) | 2.02 [0.79, 5.15] |
| 3 Pain Show forest plot | 2 | Risk Ratio (M‐H, Fixed, 95% CI) | Subtotals only | |
| 3.1 6 months | 2 | 92 | Risk Ratio (M‐H, Fixed, 95% CI) | 0.33 [0.01, 7.58] |
| 4 Soft tissue pathology Show forest plot | 2 | Risk Ratio (M‐H, Fixed, 95% CI) | Subtotals only | |
| 4.1 6 months | 2 | 92 | Risk Ratio (M‐H, Fixed, 95% CI) | 0.33 [0.01, 7.58] |
| 5 Pathologic mobility Show forest plot | 2 | Risk Ratio (M‐H, Fixed, 95% CI) | Subtotals only | |
| 5.1 6 months | 2 | 92 | Risk Ratio (M‐H, Fixed, 95% CI) | 0.0 [0.0, 0.0] |
| 6 Pathological radiolucency Show forest plot | 2 | Risk Ratio (M‐H, Fixed, 95% CI) | Subtotals only | |
| 6.1 6 months | 2 | 92 | Risk Ratio (M‐H, Fixed, 95% CI) | 2.02 [0.79, 5.15] |
| 7 Pathological root resorption Show forest plot | 2 | Risk Ratio (M‐H, Fixed, 95% CI) | Subtotals only | |
| 7.1 6 months | 2 | 92 | Risk Ratio (M‐H, Fixed, 95% CI) | 0.0 [0.0, 0.0] |
| Outcome or subgroup title | No. of studies | No. of participants | Statistical method | Effect size |
| 1 Clinical failure Show forest plot | 4 | Risk Ratio (M‐H, Fixed, 95% CI) | Subtotals only | |
| 1.1 6 months | 4 | 287 | Risk Ratio (M‐H, Fixed, 95% CI) | 0.33 [0.01, 7.84] |
| 1.2 12 months | 4 | 287 | Risk Ratio (M‐H, Fixed, 95% CI) | 4.75 [1.21, 18.55] |
| 2 Radiological failure Show forest plot | 4 | Risk Ratio (M‐H, Fixed, 95% CI) | Subtotals only | |
| 2.1 6 months | 4 | 287 | Risk Ratio (M‐H, Fixed, 95% CI) | 2.36 [0.86, 6.50] |
| 2.2 12 months | 4 | 287 | Risk Ratio (M‐H, Fixed, 95% CI) | 6.56 [2.58, 16.67] |
| 3 Overall failure Show forest plot | 2 | Risk Ratio (M‐H, Fixed, 95% CI) | Subtotals only | |
| 3.1 6 months | 2 | 140 | Risk Ratio (M‐H, Fixed, 95% CI) | 1.89 [0.63, 5.66] |
| 3.2 12 months | 2 | 140 | Risk Ratio (M‐H, Fixed, 95% CI) | 2.56 [0.89, 7.32] |
| 4 Pain Show forest plot | 3 | Risk Ratio (M‐H, Fixed, 95% CI) | Subtotals only | |
| 4.1 6 months | 3 | 180 | Risk Ratio (M‐H, Fixed, 95% CI) | 0.0 [0.0, 0.0] |
| 4.2 12 months | 3 | 180 | Risk Ratio (M‐H, Fixed, 95% CI) | 0.0 [0.0, 0.0] |
| 5 Pathological mobility Show forest plot | 3 | Risk Ratio (M‐H, Fixed, 95% CI) | Subtotals only | |
| 5.1 6 months | 3 | 180 | Risk Ratio (M‐H, Fixed, 95% CI) | 0.33 [0.01, 7.84] |
| 5.2 12 months | 3 | 180 | Risk Ratio (M‐H, Fixed, 95% CI) | 1.0 [0.07, 15.18] |
| Outcome or subgroup title | No. of studies | No. of participants | Statistical method | Effect size |
| 1 Clinical failure Show forest plot | 2 | Risk Ratio (M‐H, Fixed, 95% CI) | Subtotals only | |
| 1.1 6 months | 2 | 80 | Risk Ratio (M‐H, Fixed, 95% CI) | 0.26 [0.05, 1.50] |
| 2 Radiological failure Show forest plot | 2 | Risk Ratio (M‐H, Fixed, 95% CI) | Subtotals only | |
| 2.1 6 months | 2 | 80 | Risk Ratio (M‐H, Fixed, 95% CI) | 0.26 [0.05, 1.50] |
| 3 Pain Show forest plot | 2 | Risk Ratio (M‐H, Fixed, 95% CI) | Subtotals only | |
| 3.1 6 months | 2 | 80 | Risk Ratio (M‐H, Fixed, 95% CI) | 0.26 [0.05, 1.50] |
| 4 Pathologic mobility Show forest plot | 2 | Risk Ratio (M‐H, Fixed, 95% CI) | Subtotals only | |
| 4.1 6 months | 2 | 80 | Risk Ratio (M‐H, Fixed, 95% CI) | 0.16 [0.02, 1.25] |
| 5 Pathologic radiolucency Show forest plot | 2 | Risk Ratio (M‐H, Fixed, 95% CI) | Subtotals only | |
| 5.1 6 months | 2 | 80 | Risk Ratio (M‐H, Fixed, 95% CI) | 0.64 [0.11, 3.63] |