Leczenie miazgi zębowej w rozległej próchnicy zębów mlecznych
Abstract
Background
In children, dental caries (tooth decay) is among the most prevalent chronic diseases worldwide. Pulp interventions are indicated for extensive tooth decay. Depending on the severity of the disease, three pulp treatment techniques are available: direct pulp capping, pulpotomy and pulpectomy. After treatment, the cavity is filled with a medicament. Materials commonly used include mineral trioxide aggregate (MTA), calcium hydroxide, formocresol or ferric sulphate.
This is an update of a Cochrane Review published in 2014 when insufficient evidence was found to clearly identify one superior pulpotomy medicament and technique.
Objectives
To assess the effects of different pulp treatment techniques and associated medicaments for the treatment of extensive decay in primary teeth.
Search methods
Cochrane Oral Health's Information Specialist searched the Cochrane Oral Health Group's Trials Register (to 10 August 2017), the Cochrane Central Register of Controlled Trials (CENTRAL) (The Cochrane Library 2017, Issue 7), MEDLINE Ovid (1946 to 10 August 2017), Embase Ovid (1980 to 10 August 2017) and the Web of Science (1945 to 10 August 2017). OpenGrey was searched for grey literature. The US National Institutes of Health Trials Registry (ClinicalTrials.gov) and the World Health Organization International Clinical Trials Registry Platform were searched for ongoing trials. No restrictions were placed on the language or date of publication when searching the electronic databases.
Selection criteria
We included randomised controlled trials (RCTs) comparing interventions that combined a pulp treatment technique with a medicament or device in children with extensive decay in the dental pulp of their primary teeth.
Data collection and analysis
Two review authors independently extracted data and assessed 'Risk of bias'. We contacted authors of RCTs for additional information when necessary. The primary outcomes were clinical failure and radiological failure, as defined in trials, at six, 12 and 24 months. We performed data synthesis with pair‐wise meta‐analyses using fixed‐effect models. We assessed statistical heterogeneity by using I² coefficients.
Main results
We included 40 new trials bringing the total to 87 included trials (7140 randomised teeth) for this update. All were small, single‐centre trials (median number of randomised teeth = 68). All trials were assessed at unclear or high risk of bias.
The 87 trials examined 125 different comparisons: 75 comparisons of different medicaments or techniques for pulpotomy; 25 comparisons of different medicaments for pulpectomy; four comparisons of pulpotomy and pulpectomy; and 21 comparisons of different medicaments for direct pulp capping.
The proportion of clinical failures and radiological failures was low in all trials. In many trials, there were either no clinical failures or no radiographic failures in either study arm.
For pulpotomy, we assessed three comparisons as providing moderate‐quality evidence. Compared with formocresol, MTA reduced both clinical and radiological failures, with a statistically significant difference at 12 months for clinical failure and at six, 12 and 24 months for radiological failure (12 trials, 740 participants). Compared with calcium hydroxide, MTA reduced both clinical and radiological failures, with statistically significant differences for clinical failure at 12 and 24 months. MTA also appeared to reduce radiological failure at six, 12 and 24 months (four trials, 150 participants) (low‐quality evidence). When comparing calcium hydroxide with formocresol, there was a statistically significant difference in favour of formocresol for clinical failure at six and 12 months and radiological failure at six, 12 and 24 months (six trials (one with no failures), 332 participants).
Regarding pulpectomy, we found moderate‐quality evidence for two comparisons. The comparison between Metapex and zinc oxide and eugenol (ZOE) paste was inconclusive, with no clear evidence of a difference between the interventions for failure at 6 or 12 months (two trials, 62 participants). Similarly inconclusive, there was no clear evidence of a difference in failure between Endoflas and ZOE (outcomes measured at 6 months; two trials, 80 participants). There was low‐quality evidence of a difference in failure at 12 months that suggested ZOE paste may be better than Vitapex (calcium hydroxide/iodoform) paste (two trials, 161 participants).
Regarding direct pulp capping, the small number of studies undertaking the same comparison limits any interpretation. We assessed the quality of the evidence as low or very low for all comparisons. One trial appeared to favour formocresol over calcium hydroxide; however, there are safety concerns about formocresol.
Authors' conclusions
Pulp treatment for extensive decay in primary teeth is generally successful. Many included trials had no clinical or radiological failures in either trial arm, and the overall proportion of failures was low. Any future trials in this area would require a very large sample size and follow up of a minimum of one year.
The evidence suggests MTA may be the most efficacious medicament to heal the root pulp after pulpotomy of a deciduous tooth. As MTA is relatively expensive, future research could be undertaken to confirm if Biodentine, enamel matrix derivative, laser treatment or Ankaferd Blood Stopper are acceptable second choices, and whether, where none of these treatments can be used, application of sodium hypochlorite is the safest option. Formocresol, though effective, has known concerns about toxicity.
Regarding pulpectomy, there is no conclusive evidence that one medicament or technique is superior to another, and so the choice of medicament remains at the clinician's discretion. Research could be undertaken to confirm if ZOE paste is more effective than Vitapex and to evaluate other alternatives.
Regarding direct pulp capping, the small number of studies and low quality of the evidence limited interpretation. Formocresol may be more successful than calcium hydroxide; however, given its toxicity, any future research should focus on alternatives.
PICO
Streszczenie prostym językiem
Leczenie miazgi zębowej w rozległej próchnicy zębów mlecznych
Pytanie badawcze
Jaka jest skuteczność różnych metod leczenia rozległej próchnicy zębów mlecznych u dzieci w przypadku występowania objawów (zazwyczaj ból, obrzęk, nieprawidłowa ruchomość zęba) oraz objawów stwierdzonych w badaniu radiologicznym (zdjęcie rentgenowskie)?
Wprowadzenie
Próchnica zębów należy do najpowszechniejszych chorób dziecięcych. Próchnica zębów mlecznych rozwija się bardzo dynamicznie, często atakując miazgę zębową ‐ unerwioną i unaczynioną tkankę łączną, która stanowi centralny element zęba. Stomatolodzy często muszą zastosować jedną z trzech metod leczenia miazgi: pokrycie bezpośrednie miazgi, gdzie preparat leczniczy jest nakładany bezpośrednio na obnażoną miazgę; pulpotomię (usunięcie części miazgi) lub pulpektomię, czyli usunięcie całej miazgi znajdującej się w komorze miazgi i kanale korzeniowym zęba.
Najpowszechniejsze materiały wypełniające używane do pokrycia bezpośredniego miazgi to wodorotlenek wapnia, konglomerat trójtlenków metali – materiał najnowszy, ale droższy), formokrezol lub żywica adhezyjna (środek wiążący na bazie żywicy, który nanosi się bezpośrednio na nerw zębowy).
Po przeprowadzeniu pulpotomii stosowany jest jeden z czterech następujących materiałów wypełniających: siarczan żelaza, formokrezol, wodorotlenek wapnia lub konglomerat trójtlenków.
Po przeprowadzeniu pulpektomii ubytek powstały na skutek usunięcia miazgi jest wypełniany preparatem opatrunkowym. Preparat ten nie powinien zakłócać wchłaniania korzenia zębów mlecznych, by umożliwić wyrośnięcie zębów stałych.
Charakterystyka badań
Autorzy przeglądu współpracujący z Zespołem Cochrane ds. Zdrowia Jamy Ustnej przeprowadzili analizę dostępnych badań z randomizacją. Dane są aktualne do sierpnia 2017 roku.
Przegląd objął 87 badań, w których przeanalizowano udane leczenie miazgi zębów mlecznych. Badania opublikowano w latach 1989 – 2017 i dotyczyły one 125 porównań różnych sposobów leczenia.
Główne wyniki
Leczenie miazgi w rozległej próchnicy zębów mlecznych zasadniczo jest skuteczne. Odsetek niepowodzeń leczenia był niski, a w wielu badaniach nie wykazało niepowodzenia którejkolwiek z dwóch porównywanych metod leczenia.
Po przeprowadzonej pulpotomii konglomerat trójtlenków metali (MTA) wydaje się być preparatem najlepiej nadającym się do kontaktu z resztą korzenia nerwu zębowego (pod względem biokompatybilności i skuteczności). Dane wykazały, że jego skuteczność jest wyższa niż w przypadku wodorotlenku wapnia czy formokrezolu.
W przypadku pulpektomii nie ma pewności, który ze środków jest skuteczniejszy. Tlenek cynku z eugenolem może dawać lepsze wyniki niż pasta Vitapex (tlenek cynku/jodoform), jednak należy przeprowadzić więcej badań, aby to potwierdzić oraz ocenić inne sposoby leczenia.
W przypadku pokrycia bezpośredniego miazgi wykazano niewielką liczbę badań wykorzystujących takie same porównania, co ogranicza jakąkolwiek interpretację. Formokrezol może mieć przewagę nad wodorotlenkiem wapnia pod względem klinicznym i radiologicznym, jednak z powodu jego toksyczności pod uwagę powinny być brane bezpieczniejsze warianty.
Jakość danych naukowych
Jakość danych naukowych sugerujących przewagę MTA nad wodorotlenkiem wapnia lub formokrezolem po pulpotomii oceniono jako umiarkowaną. W przypadku pozostałych porównań jakość danych naukowych jest niska albo bardzo niska, co oznacza, że nie ma pewności co do osiągniętych wyników. Niska jakość danych naukowych wynika z wad metod badawczych zastosowanych w poszczególnych badaniach klinicznych, małej liczby dzieci uczestniczących w badaniach i krótkiego okresu obserwacji po zakończonym leczeniu.
Kolejne badania oceniające, które preparaty lecznicze są najskuteczniejsze w trzech typach terapii miazgi, wymagałyby bardzo dużej próby badawczej i co najmniej rocznego okresu obserwacji uczestników.
Authors' conclusions
Summary of findings
| Pulpotomy compared with pulpotomy using alternative medicament/technique for extensive decay in primary teeth | ||||||
| Population: children with extensive decay in primary teeth Settings: primary care Intervention: pulpotomy with one type of medicament Comparison: pulpotomy using alternative medicament or different technique | ||||||
| Outcomes | Illustrative comparative risks* (95% CI) | Relative effect | Number of participants | Quality of the evidence | Comments | |
| Assumed risk | Corresponding risk | |||||
| Control | Experimental | |||||
| MTA versus formocresol | ||||||
| Clinical failure (12 months) | 28 per 1000 | 8.6 per 1000 (2.8 per 1000 to 26.0 per 1000) | RR 0.31 (0.10 to 0.93) | 740 (12 studies) | ⊕⊕⊕⊝ | Failure rate less than 3% across both the MTA and formocresol treatment groups. Seven of the 12 studies had no failures at 12 months. No evidence of a difference in clinical failure at 6 months or 24 months |
| Radiological failure (12 months) | 50 per 1000 | 20.5 per 1000 (9.5 per 1000 to 44.5 per 1000) | RR 0.41 (0.19 to 0.89) | 740 (12 studies) | ⊕⊕⊕⊝ | Failure rate 5% across formocresol treatment groups and 2.1% across MTA treatment groups. Five of the 12 studies had no failures at 12 months. Results similar at 6 and 24 months |
| MTA versus calcium hydroxide | ||||||
| Clinical failure (12 months) | 14 per 1000 | 2.2 per 1000 (0.02 per 1000 to 9.8 per 1000) | RR 0.16 (0.04 to 0.70) | 150 (4 studies) | ⊕⊕⊕⊝ | Results similar at 24 months. No evidence of a difference in clinical failure at 6 months |
| Radiological failure (12 months) | 351 per 1000 | 42.1 per 1000 (14 per 1000 to 126.4 per 1000) | RR 0.12 (0.04 to 0.36) | 150 (4 studies) | ⊕⊕⊝⊝ | Results similar at 6 and 24 months |
| Calcium hydroxide versus formocresol | ||||||
| Clinical failure (12 months) | 115 per 1000 | 215 per 1000 (140.3 per 1000 to 332.4 per 1000) | RR 1.87 (1.22 to 2.89) | 332 (6 studies) | ⊕⊕⊕⊝ | Results similar at 6 months No evidence of a difference in clinical failure at 24 months |
| Radiological failure (12 months) | 253 per 1000 | 470.6 per 1000 (359.3 per 1000 to 617.3 per 1000) | RR 1.86 (1.42 to 2.44) | 332 (6 studies) | ⊕⊕⊕⊝ | Results similar at 6 and 24 months |
| Other comparisons assessed in more than one trial that had treatment failures | ||||||
| Clinical failure (at six, 12 and 24 months) | The quality of the evidence waslow for 4 comparisons3: laser versus ferric sulphate; Biodentine versus MTA; ferric sulphate versus formocresol; electrosurgery versus ferric sulphate; calcium hydroxide versus ferric sulphate. The quality of the evidence was very low for 5 comparisons: NaOCl versus ferric sulphate4; laser versus electrosurgery4; MTA versus ferric sulphate5; ABS versus ferric sulphate6; EMD versus formocresol7. | |||||
| Radiological failure (at six, 12 and 24 months) | The quality of the evidence waslow for 8 comparisons: NaOCl versus ferric sulphate2; MTA versus ferric sulphate3; Biodentine versus MTA3; ferric sulphate versus formocresol3; laser versus ferric sulphate3; electrosurgery versus ferric sulphate3; ABS versus ferric sulphate3; laser versus electrosurgery3; calcium hydroxide versus ferric sulphate (favouring ferric sulphate)3. | |||||
| *The basis for the assumed risk (e.g. the median control group risk across studies) is provided in footnotes. The corresponding risk (and its 95% confidence interval) is based on the assumed risk in the comparison group and the relative effect of the intervention (and its 95% CI). | ||||||
| GRADE Working Group grades of evidence | ||||||
| 1. Downgraded 1 level due to high risk of bias | ||||||
| Pulpectomy compared with pulpectomy using alternative medicament for extensive decay in primary teeth | ||||||
| Population: children with extensive decay in primary teeth Settings: primary care Intervention: pulpectomy with 1 type of medicament Comparison: pulpectomy using alternative medicament | ||||||
| Outcomes | Illustrative comparative risks* (95% CI) | Relative effect | Number of Participants | Quality of the evidence | Comments | |
| Assumed risk | Corresponding risk | |||||
| Control | Experimental | |||||
| Endoflas versus ZOE | ||||||
| Clinical failure (6 months) | 128 per 1000 | 33.3 per 1000 (6.4 per 1000 to 192 per 1000) | RR 0.26 (0.05 to 1.50) | 80 (2 studies) | ⊕⊕⊕⊝ | One trial assessed failure at 12 months: RR 1.00, 95% 0.07 to 14.55 |
| Radiological failure (6 months) | 128 per 1000 | 33.3 per 1000 (6.4 per 1000 to 192 per 1000) | RR 0.26 (0.05 to 1.50) | 80 (2 studies) | ⊕⊕⊕⊝ | |
| Metapex versus ZOE | ||||||
| Clinical failure (12 months) | 97 per 1000 | 68.9 per 1000 (14.6 per 1000 to 323 per 1000) | RR 0.71 (0.15 to 3.33) | 62 (2 studies) | ⊕⊕⊕⊝ | Results similar at 6 months |
| Radiological failure (12 months) | 129 per 1000 | 129 per 1000 (40 per 1000 to 421.8 per 1000) | RR 1.00 (0.31 to 3.27) | 62 (2 studies) | ⊕⊕⊕⊝ | Results similar at 6 months |
| Other comparisons assessed in more than one trial that had treatment failures | ||||||
| Clinical failure | The quality of the evidence was rated as low for 1 comparison: Vitapex versus ZOE (favouring ZOE)2 | |||||
| Radiological failure | The quality of the evidence was rated as low for 2 comparisons: Vitapex versus ZOE2 (favouring ZOE); calcium hydroxide versus ZOE3 | |||||
| 1. Downgraded 1 level due to imprecision | ||||||
| Direct pulp capping compared with direct pulp capping using alternative medicament for extensive decay in primary teeth | ||||||
| Population: children with extensive decay in primary teeth Settings: primary care Intervention: direct pulp capping with 1 type of medicament Comparison: direct pulp capping using alternative medicament | ||||||
| Outcomes | Illustrative comparative risks* (95% CI) | Relative effect | Number of participants | Quality of the evidence | Comments | |
| Assumed risk | Corresponding risk | |||||
| Control | Experimental | |||||
| Seven trials evaluated 22 comparisons of different medicaments for direct pulp capping. Each comparison was assessed by a single trial. There were no clinical or radiological failures in two comparisons: acetone‐based total‐etch adhesive versus calcium hydroxide; MTA versus calcium hydroxide. | ||||||
| Clinical failure (at six, 12 and 24 months) | The quality of the evidence was assessed as low for 5 comparisons1: calcium hydroxide versus formocresol (favouring formocrescol), MTA versus 3Mix and MTA versus simvastatin (favouring MTA), 3Mix versus 3Mixtatin and 3Mixtatin versus simvastatin (favouring 3Mixtatin). The quality of the evidence was rated as very low for all other comparisons.2 | |||||
| Radiological failure (at six, 12 and 24 months) | The quality of the evidence was rated as low for 1 comparison: calcium hydroxide versus formocresol1 (favouring formocresol). The quality of the evidence was rated as very low for all other comparisons.2 | |||||
| *The basis for the assumed risk (e.g. the median control group risk across studies) is provided in footnotes. The corresponding risk (and its 95% confidence interval) is based on the assumed risk in the comparison group and the relative effect of the intervention (and its 95% CI). | ||||||
| GRADE Working Group grades of evidence | ||||||
| 1. Downgraded 1 level due to risk of bias and 1 level due to imprecision | ||||||
Background
Description of the condition
Dental caries (tooth decay) is a bacterial infection that causes demineralisation and destruction of tooth tissues. The severity ranges from the early clinically visible changes in enamel caused by demineralisation to extensive cavitation. If the cavitation exposes dentine, then the caries has progressed to a 'distinct cavitation'. In more severe cases, there is obvious loss of tooth structure, the cavity is both deep and wide, and the dentine is clearly visible; a cavity that involves at least half of a tooth surface or possibly reaches the pulp is referred to as 'extensive' (ICDAS II 2011). In children, dental caries is among the most prevalent chronic diseases worldwide. Extensive tooth decay is the most common disease of primary teeth; 42% of children aged from two to 11 years have dental caries in their primary teeth, with a mean of 1.6 decayed teeth for each child (NHANES 2010; Selwitz 2007). Most dental caries in children are left untreated (CDC 2011). Decay in primary teeth is a risk factor for decay in permanent teeth (Al‐Shalan 1997; Finucane 2012; Kaste 1992).
Description of the intervention
Pulp interventions combine a pulp treatment technique and a medicament. The primary objective of pulp interventions is to maintain the integrity of the tooth and the health of its supporting tissues. Depending on the severity of the disease, three pulp treatment techniques are available: direct pulp capping, pulpotomy and pulpectomy (Guideline Pulp Therapy 2014; Guideline Pulp Therapy 2016). These treatments consist of the eviction of caries, followed by the eviction of a part of the pulp tissue and then setting in place medicaments. This treatment keeps the temporary tooth on the arch until it is replaced by the permanent tooth.
Direct pulp capping is usually indicated in a primary tooth with normal pulp (accidentally) exposed 1 mm or less. The exposed pulp is capped with a medicament before placing a restoration that seals the tooth. A pulpotomy is performed in a primary tooth with extensive caries but without evidence of radicular pathology. The coronal pulp is removed, and the remaining vital radicular pulp tissue is covered with a medicament. A pulpectomy is performed in a primary tooth with irreversible pulpitis. The radicular pulp is removed, and then a medicament is used to fill the canals. The tooth is restored with a restoration.
These treatments are combined with a variety of medicaments, to protect the pulp or the periradicular tissues, or to fill the substance loss, or both.
How the intervention might work
Pulp interventions involve the elimination of the infection and protection of the decontaminated tooth from future microbial invasion. Several medicaments are available for the obturation of the decontaminated surfaces or canals, the most frequently used are mineral trioxide aggregate (MTA), calcium hydroxide, formocresol or ferric sulphate.
Formocresol is a solution of cresol 35% and formaldehyde 19% in a vehicle of glycerine 15% and water (Buckley's formocresol). One part of this formula is normally mixed with three parts glycerine and one part water. This mixture prevents tissue autolysis by bonding to protein. Cresol is locally destructive to vital tissues but presents negligible potential for systemic distribution following the pulp treatment technique. However, formaldehyde is distributed systemically after pulp treatment technique and is classified by the International Agency for Research on Cancer (IARC) of the World Health Organization (WHO) as a known human carcinogen (IARC 2017). Although a 1:5 or 1:25 dilution of formocresol is generally advocated, many dentists use a more concentrated formula.
Ferric sulphate is a haemostatic compound that forms a metal‐protein clot at the surface of the pulp stumps, which seals blood capillaries and acts as a barrier to irritating components of the materials applied after. No concerns about toxic or harmful effects of ferric sulphate have been published in the dental or medical literature.
Calcium hydroxide was the first agent used in pulpotomies that demonstrated a capacity to induce dentine regeneration by becoming very alkaline when mixed with water. However, calcium hydroxide may possibly wound the primary tooth pulp to permit internal resorption or dystrophic calcification.
MTA is a recent mineral material that results ‐ when mixed with water ‐ in a hydrated calcium silicate gel containing calcium hydroxide. It is also very alkaline and promotes tissue regeneration when placed in contact with the pulp or periradicular tissues. It is biocompatible, non‐toxic and non‐resorbable and leads to minimal leakage around the margins.
Why it is important to do this review
Cochrane Oral Health undertook an extensive prioritisation exercise in 2014 to identify a core portfolio of titles that were the most clinically important to maintain on the Cochrane Library (Worthington 2015). Consequently, this review was identified as a priority title by the paediatric expert panel (Cochrane Oral Health priority review portfolio).
Because formocresol contains a known human carcinogen and is widely used for direct pulp capping and pulpotomy in children, finding a biocompatible and efficient alternative is a priority.
This is an update of a Cochrane Review first published in 2003 (Nadin 2003) and updated in October 2014 (Smaïl‐Faugeron 2014a). The 2003 version review included three randomised controlled trials (RCTs). We wrote a new protocol and searched for up‐to‐date evidence for an update in 2014. The 2014 update included 47 RCTs, on the basis of which the review authors concluded there was insufficient evidence supporting the superiority of one type of treatment over another. Since the 2014 version, results of new trials have been published and new medicaments have been introduced, and so we considered it important to synthesise new findings with existing evidence.
Objectives
To assess the effects of different pulp treatment techniques and associated medicaments for the treatment of extensive decay in primary teeth.
Methods
Criteria for considering studies for this review
Types of studies
Randomised controlled trials (RCTs) comparing different pulp interventions combining a pulp treatment technique and a medicament in primary teeth. We included trials that compared different medicaments for the same pulp treatment technique or different pulp treatment techniques with each other.
Types of participants
Children with extensive decay involving dental pulp in primary teeth.
Types of interventions
All pulp interventions combining a pulp treatment technique (pulpotomy, pulpectomy or direct pulp capping) and a medicament (any medication or device).
Types of outcome measures
Primary outcomes
We defined two primary outcomes: clinical failure and radiological failure as defined in primary studies, at six, 12 and 24 months.
Secondary outcomes
According to our classification of outcomes (Smaïl‐Faugeron 2013), we considered the following secondary outcomes to be relevant:
-
overall failure;
-
secondary clinical outcomes: pain, soft tissue pathology, pathological mobility, adjacent tissue inflammation, defective restoration (clinically), secondary caries at the margin (clinically), periodontal pocket formation, dental anxiety/phobia, premature tooth loss, signs of exfoliation, smell; and
-
secondary radiological outcomes: pathological radiolucency, pathological root resorption, pulp canal obliteration, dentin bridge formation, physiological root resorption, defective restoration (radiographically), secondary caries (radiographically), and filling material anomaly.
Search methods for identification of studies
Electronic searches
Cochrane Oral Health’s Information Specialist conducted systematic searches in the following databases for RCTs and controlled clinical trials. There were no language, publication year or publication status restrictions:
-
Cochrane Oral Health's Trials Register (to 10 August 2017) (Appendix 1);
-
Cochrane Central Register of Controlled Trials (CENTRAL; 2017, Issue 7) in the Cochrane Library (searched 10 August 2017) (Appendix 2);
-
MEDLINE Ovid (1946 to 10 August 2017) (Appendix 3);
-
Embase Ovid (1980 to 10 August 2017) (Appendix 4);
-
Web of Science (1945 to 10 August 2017) (Appendix 5); and
-
OpenGrey (to 10 August 2017) (Appendix 6).
There were no restrictions on the language or date of publication when searching the electronic databases. We identified and translated references in German, Serbian, Spanish, Japanese, Chinese, Danish, Italian, Arabic and Iranian.
Subject strategies were modelled on the search strategy designed for MEDLINE Ovid. Where appropriate, they were combined with subject strategy adaptations of the highly sensitive search strategy designed by Cochrane for identifying RCTs and controlled clinical trials as described in the Cochrane Handbook for Systematic Reviews of Interventions Chapter 6 (Lefebvre 2011).
Searching other resources
Handsearching and identification of unpublished studies
The following databases were searched for ongoing trials, seeAppendix 7 for the search strategy:
-
US National Institutes of Health Ongoing Trials Register (clinicaltrials.gov; searched 10 August 2017); and
-
World Health Organization International Clinical Trials Registry Platform (apps.who.int/trialsearch; searched 10 August 2017).
We handsearched the following journals:
-
Pediatric Dentistry (1995 to 2001);
-
European Journal of Paediatric Dentistry (2000 to 2002);
-
Journal of Clinical Pediatric Dentistry (1996 to 2002);
-
Journal of Endodontics (1996 to 2002); and
-
International Journal of Paediatric Dentistry (1991 to 2002).
Reference searching
We checked the references of all eligible trials for relevant studies. We scanned reference lists from review articles identified in the searches for further studies and consulted reference lists from paediatric dentistry textbooks.
We contacted experts in the field to help identify unpublished literature.
Data collection and analysis
Selection of studies
Two review authors independently scanned the titles of all records identified by the search to determine whether the studies were relevant. We resolved disagreements by discussion. Two review authors independently scanned selected abstracts to determine whether the study was relevant. If necessary, we obtained the full article. We resolved disagreements by discussion. We obtained the full report for all relevant articles. Two review authors independently scanned the full reports and completed the data extraction form to determine whether the article should be included or excluded. Disagreements were resolved by discussion. Finally, we included studies after checking for multiple publications of a given study (Characteristics of included studies). We recorded excluded studies, with reasons for exclusion (Characteristics of excluded studies).
Data extraction and management
Two review authors independently collected data using a specially designed data extraction form. Two review authors had pilot‐tested the data extraction form with 10 articles and modified it as required before use. We extracted data presented in graphs and figures whenever possible but included data only if both review authors independently had the same result or the authors could provide clarification of data. We resolved disagreements by discussion. We attempted to contact all study authors for clarification or missing information. We excluded data until further clarification was available, if we could not reach agreement. For each trial, we recorded the following data: year of publication and country of origin, inclusion/exclusion criteria specified, detailed description of interventions, sample size, mean age of participants, duration of follow‐up and outcome data. We tabulated all outcomes as reported in trials at six, 12, and 24 months.
Assessment of risk of bias in included studies
Two review authors independently graded all relevant articles in duplicate. This process followed the domain‐based evaluation described in the Cochrane Handbook for Systematic Reviews of Interventions 5.1.0 (updated March 2011) (Higgins 2011). The two review authors compared evaluations and resolved any disagreements by discussion. The two review authors assessed the following domains in terms of 'low', 'unclear' or 'high' risk of bias: generation of sequence allocation, allocation concealment, blinding of participants and personnel, blinding of clinical outcome assessors, blinding of radiological outcome assessors and complete outcome data (both intention‐to‐treat and missing data). We tried to assess selective outcome reporting by looking for the trials in the clinicaltrials.gov register and comparing the 'Methods' and 'Results' sections of the publication.
Assessment of overall risk of bias considered the importance of different domains and studies and was classified as follows: low risk of bias (plausible bias unlikely to seriously alter the results) if all criteria were met; unclear risk of bias (plausible bias that raises some doubt about the results) if one or more criteria were assessed as unclear; or high risk of bias (plausible bias that seriously weakens confidence in the results) if one or more criteria were not met.
Measures of treatment effect
For dichotomous outcomes, we expressed the estimate of treatment effect as risk ratios together with 95% confidence intervals (CIs).
For continuous outcomes (such as mean participant satisfaction scores), where studies used the same scale to measure the outcome, we used the mean difference with 95% CIs. Where different scales were used, we expressed the treatment effect as a standardised mean difference and 95% CI.
Unit of analysis issues
The unit of analysis was the tooth, because teeth were randomly assigned to interventions. Some trials had a split‐mouth design, whereby one tooth was randomly allocated to the experimental treatment and another tooth in the same child was allocated to the control treatment. Pairing of data needed to be taken into account in the analysis. Split‐mouth trials that ignore the pairing show a unit‐of‐analysis error. Failure to account for correlation is likely to underestimate the precision of the trial (i.e. a CI that is too wide). We reported such errors, but could not re‐analyse data appropriately.
Dealing with missing data
To allow for an intention‐to‐treat analysis, we imputed missing outcome data as treatment success.
Assessment of heterogeneity
To investigate statistical heterogeneity, we examined forest plots, as well as Cochran's homogeneity tests, I² co‐efficients and between‐trial variances. We used the I² statistic with an approximate guide for interpretation as follows: 0% to 40% might not be important; 30% to 60% may represent moderate heterogeneity; 50% to 90% may represent substantial heterogeneity; 75% to 100% represents considerable heterogeneity.
Assessment of reporting biases
We did not assess within‐study selective outcome reporting because we did not have access to study protocols. We planned to assess a possible between‐study reporting bias by producing a funnel plot of effect estimates against their standard errors if at least 10 trials were included in a meta‐analysis. If asymmetry of the funnel plot was found by inspection and confirmed by statistical tests, possible explanations were planned to be taken into account in the interpretation of the overall estimate of treatment effects.
Data synthesis
When two or more similar outcomes were reported in the same trial (e.g. spontaneous pain and pain on palpation), we considered only the most frequently reported outcome across all trials included in the meta‐analysis (Appendix 8). In addition, the different types of mineral trioxide aggregate (MTA) (unspecified MTA, grey MTA and white MTA) were combined, and if a trial compared two types of MTA, we included data for both arms.
We synthesised trials comparing different medicaments for the same pulp treatment technique (pulpotomy versus pulpotomy; pulpectomy versus pulpectomy; direct pulp capping versus direct pulp capping). The decision about whether to combine the results of individual studies depended on the assessment of heterogeneity. Combined estimates and associated 95% CIs were calculated by Mantel‐Haenszel fixed‐effect or random‐effects methods. In all cases, we considered the results from both fixed‐effect and random‐effects models. For random‐effects models, the estimate of the heterogeneity parameter is likely to be unreliable when the meta‐analysis is based on a small number of studies. Hence, when results from the trials were consistent, we preferred fixed‐effect analysis (Whitehead 2002). All P values were two‐sided and P value < 0.05 was deemed significant.
Subgroup analysis and investigation of heterogeneity
Where possible, subgroup analyses were to be undertaken to compare: results for teeth that were symptomatic versus symptom free preoperatively; effect of participant age at treatment, e.g. up to seven years and seven to 10 years; comparison of different types of final filling materials; and site of treatment ‐ primary versus secondary care sectors.
Sensitivity analysis
Sensitivity analyses were to be undertaken as follows:
-
excluding unpublished studies;
-
excluding studies of the lowest quality; and
-
excluding one or more large studies (if found) to assess how much they dominated the result.
Summarising findings and assessing the quality of the evidence
We created three 'Summary of findings' tables (one each for pulpotomy, pulpectomy and direct pulp capping) to present effect estimates for our main comparisons and primary outcomes. We also presented our assessment of the quality of the evidence, which we assessed as high, moderate, low or very low, according to GRADE critieria (Schünemann 2011).
Results
Description of studies
Results of the search
We provide summary details in the Characteristics of included studies, Characteristics of excluded studies and Characteristics of ongoing studies tables.
Searches from all sources identified 3330 references, 1709 of which remained after removing duplicates. After scanning the titles and abstracts (when available), we obtained the full reports of 157 records that looked potentially eligible and performed data extraction. After communication or attempted communication with 30 authors, and partial or complete translation of 20 papers, we listed 55 as excluded studies, with reasons for exclusion. We classified 14 registered trials as ongoing studies (see Characteristics of ongoing studies), none of which had reported results.
In total, 87 trials (91 references) satisfied the eligibility criteria and were included in the review (Figure 1).

Study flow diagram
The 87 trials involved 7140 randomised teeth. Seventeen studies (20%) were split‐mouth design (without description of appropriate analysis); the remaining 70 studies (80%) were parallel‐arm design.
Included studies
Year of publication, setting and operators
The earliest trial was published in 1989 (Alaçam 1989), 34 trials (39%) were published between 2005 and 2012, and 38 trials (44%) were published between 2013 and 2017.
All included studies were single‐centre trials conducted primarily in paediatric dentistry departments of universities. Treatment settings and operators varied.
-
20 (23%) trials were conducted in India (Chandra 2014; Goyal 2014; Goyal 2016; Grewal 2016; Gupta 2015; Kalra 2017; Kusum 2015; Nadkarni 2000; Naik 2005; Niranjani 2015; Pinky 2011; Prabhakar 2008; Pramila 2016; Ramar 2010; Rewal 2014; Subramaniam 2009; Subramaniam 2011; Uloopi 2016; Yadav 2014);
-
16 (18%) in Turkey (Akcay 2014; Alaçam 1989; Alaçam 2009; Arikan 2016; Bezgin 2016; Cantekin 2014; Celik 2013; Demir 2007; Durmus 2014; Erdem 2011; Ozalp 2005; Ozmen 2017; Sonmez 2008; Tuna 2008; Ulusoy 2014a; Yildirim 2016);
-
12 (14%) in Iran (Aeinehchi 2007; Aminabadi 2010; Aminabadi 2016; Ansari 2010; Bahrololoomi 2008; Fallahinejad Ghajari 2013; Haghgoo 2009; Khorakian 2014; Malekafzali 2011; Mortazavi 2004; Noorollahian 2008; Shabzendedar 2013);
-
six (7%) in the USA (Dean 2002; Fei 1991; Fishman 1996; Vargas 2006; Zealand 2010; Zurn 2008);
-
six (7%) in Brazil (Coser 2008; Fernandes 2015; Lourenço 2015a; Moretti 2008; Oliveira 2013a; Sakai 2009);
-
four (5%) in Canada (Casas 2004; Doyle 2010; Nguyen 2017; Saltzman 2005);
-
three (3%) in Israel (Eidelman 2001; Fuks 1997; Holan 2005);
-
two in Egypt (Agamy 2004; Sabbarini 2008);
-
three in Saudi Arabia (El Meligy 2016; Farsi 2005; Shumayrikh 1999);
-
two in Thailand (Nakornchai 2010; Trairatvorakul 2008);
-
two in Spain (Cuadros‐Fernández 2016; Fernández 2013);
-
one each in Germany (Huth 2005), Kuwait (Ibricevic 2000), Mexico (Garrocho‐Rangel 2009), Serbia and Montenegro (Markovic 2005), Korea (Kang 2015), Nigeria (Olatosi 2015), Syria (Al‐Ostwani 2016) Belgium (Rajasekharan 2017), and the UK (Waterhouse 2000).
The study setting was not mentioned in 19 (22%) trials.
Operators were dentists in 38 (43%) trials, undergraduate dental students supervised by senior staff members of clinics in one trial (Alaçam 2009), postgraduate dental students supervised by one or two investigators in two trials (Cuadros‐Fernández 2016; Khorakian 2014), and professor, doctoral graduate, doctoral student, master graduate and master student in one trial (Rajasekharan 2017). Operators were not mentioned in 44 (50%) trials.
Participants
The weighted mean age of children in the 87 included studies was 6.3 years. Age‐related inclusion criteria varied among studies; children's ages ranged from two years to 13 years.
All included studies were small; the median number of enrolled children in each trial was 45.5 (interquartile range (IQR) 27 to 71; minimum to maximum 15 to 155). The median number of treated teeth for each trial was 70 (IQR 50 to 100; minimum to maximum 20 to 291).
Interventions
Number of arms
Overall, 17 (20%) were split‐mouth studies, 38 (44%) trials were two‐arm studies, 21 (24%) were three‐arm studies, 10 (11%) were four‐arm studies, and one trial described a five‐arm study (Demir 2007).
Treatments and medicaments
The 87 trials described 125 different combinations of pulp treatment (pulpotomy, pulpectomy or direct pulp capping) and medicament.
Pulpotomy
In total, 53 trials (61%) compared different medicaments/techniques for pulpotomy (75 comparisons):
-
Mineral trioxide aggregate (MTA) compared with formocresol in 19 trials (23%)
-
full strength formocresol (Aeinehchi 2007; Agamy 2004; Eidelman 2001; Farsi 2005; Haghgoo 2009; Holan 2005; Jayam 2014; Saltzman 2005; Yildirim 2016)
-
1:5 diluted formocresol (Ansari 2010; Erdem 2011; Fernández 2013; Moretti 2008; Naik 2005; Noorollahian 2008; Olatosi 2015; Sonmez 2008; Subramaniam 2009; Zealand 2010).
-
-
MTA compared with calcium hydroxide in six trials (Akcay 2014; Celik 2013; Liu 2011; Moretti 2008; Oliveira 2013a; Sonmez 2008);
-
MTA compared with ferric sulphate with or without eugenol, in five trials (Doyle 2010; Erdem 2011; Fernández 2013; Goyal 2016; Sonmez 2008) (two comparisons);
-
MTA compared with ferric sulphate + MTA (Doyle 2010);
-
MTA compared with Portland cement in three trials (Oliveira 2013a; Sakai 2009; Yildirim 2016);
-
MTA compared with calcium‐enriched mixture (CEM) (Malekafzali 2011);
-
MTA compared with sodium hypochlorite (NaOCl) (Fernández 2013);
-
MTA compared with calcium hydroxide + NaOCl (Akcay 2014);
-
MTA + NaOCl versus calcium hydroxide + NaOCl (Akcay 2014);
-
MTA compared with buffered glutaraldehyde (Goyal 2016);
-
MTA compared with zinc oxide eugenol (ZOE) (Erdem 2011);
-
MTA compared with diode laser (Niranjani 2015);
-
MTA + diode laser versus formocresol + ZOE (Saltzman 2005);
-
MTA compared with low‐level laser therapy (LLLT) (Uloopi 2016);
-
MTA compared with enamel matrix derivative (EMD) (Yildirim 2016);
-
MTA compared with Biodentine in four trials (Cuadros‐Fernández 2016; Kusum 2015; Niranjani 2015; Rajasekharan 2017);
-
MTA compared with propolis (Kusum 2015);
-
MTA compared with aloe vera (Aloe barbadensis Mill, family Liliaceae) (Kalra 2017);
-
MTA compared with Tempophore (iodoform‐based paste) (Rajasekharan 2017);
-
Comparisons between different types of MTA:
-
white MTA compared with grey MTA (Agamy 2004);
-
MTA versus MTA + NaOCl (Akcay 2014);
-
ProRoot MTA compared with OrthoMTA (Kang 2015);
-
ProRoot MTA compared with RetroMTA (Kang 2015);
-
OrthoMTA compared with RetroMTA (Kang 2015).
-
-
calcium hydroxide compared with formocresol in eight trials (9%):
-
full strength formocresol (Alaçam 2009; Markovic 2005);
-
1:5 diluted formocresol (Fernandes 2015; Huth 2005; Moretti 2008; Sonmez 2008; Waterhouse 2000; Zurn 2008).
-
-
calcium hydroxide compared with ferric sulphate in three trials (Huth 2005; Markovic 2005; Sonmez 2008);
-
calcium hydroxide compared with Portland cement (Oliveira 2013a);
-
calcium hydroxide compared with MTA + NaOCl (Akcay 2014);
-
calcium hydroxide compared with Er:YAG laser (Huth 2005);
-
calcium hydroxide compared with calcium hydroxide/iodoform (Alaçam 2009);
-
calcium hydroxide compared with low‐level laser therapy (LLLT) (Fernandes 2015);
-
calcium hydroxide compared with LLLT + calcium hydroxide (Fernandes 2015);
-
calcium hydroxide + LLLT compared with LLLT (Fernandes 2015);
-
calcium hydroxide compared with calcium hydroxide + NaOCl (Akcay 2014);
-
calcium hydroxide compared with Biodentine (Grewal 2016).
-
ferric sulphate compared with formocresol in 10 trials (11%):
-
full strength formocresol (Fei 1991; Ibricevic 2000; Markovic 2005);
-
1:5 diluted formocresol (Durmus 2014; Erdem 2011; Fernández 2013; Fuks 1997; Huth 2005; Ozmen 2017; Sonmez 2008).
-
-
ferric sulphate compared with NaOCl in two trials (Fernández 2013; Vargas 2006);
-
ferric sulphate compared with buffered glutaraldehyde (Goyal 2016);
-
ferric sulphate versus ZOE (Erdem 2011);
-
ferric sulphate compared with Er:YAG laser (Huth 2005);
-
ferric sulphate compared with diode laser in three trials (Durmus 2014; Gupta 2015; Yadav 2014);
-
ferric sulphate compared with electrosurgery in two trials (Gupta 2015; Yadav 2014);
-
ferric sulphate/MTA compared with ferric sulphate (with or without eugenol) (Doyle 2010) (two comparisons);
-
ferric sulphate compared with Ankaferd Blood Stopper in two trials (Cantekin 2014; Ozmen 2017):
-
full strength formocresol (Fei 1991; Ibricevic 2000; Markovic 2005);
-
1:5 diluted formocresol (Durmus 2014; Erdem 2011; Fernández 2013; Fuks 1997; Huth 2005; Ozmen 2017; Sonmez 2008).
-
-
Portland cement compared with full strength formocresol (Yildirim 2016);
-
Portland cement compared with EMD (Yildirim 2016);
-
Portland cement compared with Portland cement + radio‐opacifying agents (iodoform (CHI₃ or zirconium oxide (ZrO₂)) (Lourenço 2015a) (two comparisons);
-
Glutaraldehyde + calcium hydroxide compared with full strength formocresol (Alaçam 1989);
-
Glutaraldehyde + ZOE compared with full strength formocresol (Alaçam 1989);
-
Glutaraldehyde + calcium hydroxide compared with glutaraldehyde + ZOE in two trials (Alaçam 1989; Shumayrikh 1999);
-
Electrofulguration + calcium hydroxide compared with electrofulguration + ZOE (Fishman 1996).
-
Electrosurgery compared with formocresol in two trials:
-
full strength formocresol (Dean 2002);
-
1:5 diluted formocresol (Bahrololoomi 2008).
-
-
Electrosurgery compared with diode laser in two trials (Gupta 2015; Yadav 2014);
-
Electrosurgery compared with CEM (Khorakian 2014);
-
Biodentine compared with formocresol (El Meligy 2016)
-
Biodentine compared with diode laser (Niranjani 2015);
-
Biodentine compared with Tempophore (Rajasekharan 2017);
-
Biodentine compared with propolis (Kusum 2015).
-
1:5 diluted formocresol compared with NaOCl in two trials (Fernández 2013; Shabzendedar 2013);
-
Full strength formocresol compared with calcium hydroxide/iodoform (Alaçam 2009);
-
1:5 diluted formocresol compared with ZOE (Erdem 2011);
-
1:5 diluted formocresol compared with Er:YAG laser (Huth 2005);
-
1:5 diluted formocresol compared with diode laser (Durmus 2014);
-
1:5 diluted formocresol compared with LLLT (Fernandes 2015);
-
1:5 diluted formocresol compared with LLLT + calcium hydroxide (Fernandes 2015);
-
1:5 diluted formocresol compared with Ankaferd Blood Stopper (Ozmen 2017);
-
formocresol compared with EMD in two trials:
-
full strength formocresol (Yildirim 2016);
-
1:5 diluted formocresol (Sabbarini 2008);
-
-
Full strength formocresol compared with 1:5 diluted formocresol (Goyal 2014);
-
Full strength formocresol compared with 1:25 diluted formocresol (Goyal 2014);
-
1:5 diluted formocresol compared with 1:25 diluted formocresol (Goyal 2014).
Pulpectomy
In total, 15 trials (17%) compared different medicaments for pulpectomy (25 comparisons):
-
calcium hydroxide compared with ZOE in two trials (Nadkarni 2000; Ozalp 2005);
-
calcium hydroxide compared with Sealapex (composition: isobutyl salicylate resin, SiO₂, BiO₃, TiO₂, N‐ethyl toluene sulfenamide resin, ZnO, CaO, eugenol‐free calcium hydroxide) (Ozalp 2005);
-
calcium hydroxide compared with Vitapex (calcium hydroxide/ 50% iodoform) (Ozalp 2005);
-
Metapex (composition: calcium hydroxide < 36 w/w%, iodoform 30 to 37w/w%, polydimethylsiloxane < 26 w/w%) compared with ZOE in two trials (Al‐Ostwani 2016; Subramaniam 2011);
-
Metapex compared with ZOE + calcium hydroxide with iodoform (Endoflas) in two trials (Ramar 2010; Subramaniam 2011);
-
Metapex compared with ZOE with iodoform (RC Fill) (Ramar 2010);
-
Metapex compared with endoflas‐chlorophenol‐free (Endoflas‐CF) (Al‐Ostwani 2016);
-
Metapex compared with zinc oxide and propolis (ZOP) (Al‐Ostwani 2016);
-
Sealapex compared with ZOE (Ozalp 2005);
-
Sealapex compared with Vitapex (Ozalp 2005);
-
Vitapex compared with ZOE in five trials (Chen 2015; Mortazavi 2004; Ozalp 2005; Pramila 2016; Trairatvorakul 2008);
-
Vitapex compared with 3Mix (ciprofloxacin + metronidazole + minocycline) (Nakornchai 2010);
-
Vitapex compared with RC Fill (Pramila 2016);
-
Vitapex compared with a mixture of ZOE + calcium hydroxide + iodoform (unnamed product) (Chen 2015);
-
Endoflas compared with ZOE in two trials (Rewal 2014; Subramaniam 2011);
-
Endoflas compared with RC Fill (Ramar 2010);
-
Endoflas‐CF compared with ZOE (Al‐Ostwani 2016);
-
Endoflas‐CF compared with ZOP (Al‐Ostwani 2016);
-
ZOE compared with ozonated sesame oil‐ZO (Chandra 2014);
-
ZOE compared with RC Fill (Pramila 2016);
-
ZOE compared with ZOP (Al‐Ostwani 2016);
-
ZOE compared with ZOE + calcium hydroxide + iodoform (unnamed product) (Chen 2015);
-
ciprofloxacin + metronidazole + minocycline (3Mix) compared with ciprofloxacin + ornidazole + minocycline (Pinky 2011);
-
MTA compared with intermediate restorative material (IRM) (Arikan 2016);
-
MTA compared with gutta‐percha/AH‐Plus (Bezgin 2016).
Both pulpotomy and pulpectomy
Four trials compared pulpotomy and pulpectomy with different medicaments (four comparisons):
-
full strength formocresol pulpotomy compared with calcium hydroxide pulpectomy (Coser 2008).
-
ferric sulphate/ZOE pulpotomy compared with ZOE pulpectomy (Casas 2004);
-
ferric sulphate/MTA pulpotomy compared with ZOE (Sedanol) pulpectomy (Nguyen 2017).
-
3Mix (ciprofloxacin + metronidazole + minocycline) pulpotomy compared with 3Mix pulpectomy (Prabhakar 2008).
Direct pulp capping
Seven trials (8%) compared different medicaments for direct pulp capping (21 comparisons):
-
calcium hydroxide compared with formocresol (Aminabadi 2010);
-
calcium hydroxide compared with acetone‐based total‐etch adhesive (with or without non‐rinse conditioner or total etching with 36% phosphoric acid) (Demir 2007, four comparisons);
-
calcium hydroxide compared with EMD (Garrocho‐Rangel 2009);
-
calcium hydroxide compared with MTA (Tuna 2008);
-
Acetone‐based total‐etch adhesive compared with acetone‐based total‐etch adhesive + non‐rinse conditioner or total‐etching with 36% phosphoric acid or self etch adhesive system (Demir 2007) (3 comparisons);
-
Non‐rinse conditioner + acetone‐based total‐etch adhesive compared with acetone‐based total‐etch adhesive + total‐etching with 36% phosphoric acid or self‐etch adhesive system (Demir 2007, two comparisons);
-
Self etch adhesive system + acetone‐based total‐etch adhesive versus total‐etching with 36% phosphoric acid + acetone‐based total‐etch adhesive (Demir 2007);
-
MTA compared with CEM (Fallahinejad Ghajari 2013);
-
MTA compared with 3Mix (Aminabadi 2016);
-
MTA compared with 3Mixtatin (a combination of simvastatin and 3Mix antibiotic) (Aminabadi 2016);
-
MTA compared with simvastatin (Aminabadi 2016);
-
3Mix compared with 3Mixtatin (Aminabadi 2016);
-
3Mix compared with simvastatin (Aminabadi 2016);
-
3Mixtatin compared with simvastatin (Aminabadi 2016);
-
calcium hydroxide cement (Dycal) compared with a bone graft calcium sulphate hemihydrate material (DentoGen) (Ulusoy 2014a).
Duration of follow‐up
The duration of follow‐up was fixed in 78 (90%) trials. Data were assessed at six months in 70 (80%) trials, at 12 months in 59 (68%) trials and at 24 months in 24 (28%) trials.
Rubber dam
In 67 trials (77%), treatments were completed with rubber dam isolation. In four trials, either rubber dam or cotton rolls were used (Ozalp 2005; Waterhouse 2000; Zealand 2010; Zurn 2008); in four trials, cotton rolls were used (Alaçam 1989; Fallahinejad Ghajari 2013; Markovic 2005; Sonmez 2008); and in 12 trials there was insufficient information to determine if a rubber dam or cotton rolls were used (Arikan 2016; Cantekin 2014; Chen 2015; Demir 2007; Goyal 2014; Goyal 2016; Liu 2011; Mortazavi 2004; Nadkarni 2000; Naik 2005; Niranjani 2015; Pinky 2011).
Pulp access
Caries were removed prior to pulpal access in 68 (78%) trials. Pulp was accessed with a high‐speed bur in 37 (43%) trials, a slow‐speed bur in six trials (Aminabadi 2010; Aminabadi 2016; Markovic 2005; Moretti 2008; Ramar 2010; Shabzendedar 2013), a high‐speed followed by a slow‐speed bur in six trials (Casas 2004; Celik 2013; Cuadros‐Fernández 2016; Doyle 2010; Fernández 2013; Nguyen 2017), a combination of slow‐speed bur and excavator in one trial (Nadkarni 2000), a combination of high‐speed bur and round carbide bur in three trials (Fallahinejad Ghajari 2013; Kang 2015; Lourenço 2015a), a high‐speed followed by a combination of slow‐speed bur and round carbide bur in one trial (Ulusoy 2014a), a number 557 round bur in one trial (Kalra 2017), or a handpiece with a round bur (with no precision) followed by a high speed and round carbide bur in one trial (Oliveira 2013a).
Removal of coronal pulp involved an excavator in 35 (40%) trials, a combination of slow‐speed bur and excavator in 11 (13%) trials, a slow‐speed bur in 11 (13%) trials, a high‐speed bur in two trials (Ibricevic 2000; Markovic 2005), a high speed bur followed by excavator in one trial (Celik 2013), round burs numbers ½ and ¼ or excavator in one trial (Grewal 2016), or a number 6 carbide round bur in one trial (Shabzendedar 2013).
In the case of pulpectomy, complete extirpation of the pulp involved barbed broaches, K files or H files.
Haemostasis
Before application of the pulpotomy or direct pulp capping medicament, haemostasis of the pulp stumps was achieved with either dry or moistened (water or saline) cotton wool pellets in 53 trials (61%).
In two trials, haemostasis of the pulp stumps was achieved with techniques that differed according to the group: in Coser 2008, haemostasis was obtained with dry cotton wool pellets in the pulpotomy group and with moistened cotton pellets with saline in the pulpectomy group; whereas, in Doyle 2010, haemostasis was obtained with saline/water flush in the three ferric sulphate arms and with dry cotton pellets in the MTA arm.
In five trials, haemostasis was obtained using other techniques: a sterile cotton pellet soaked in 1.25% sodium hypochlorite solution and placed over the exposure site for 62 seconds without pressure (Demir 2007), a damp sterile cotton pellet (Farsi 2005), a dry sterile cotton pellet and electrofulguration (Fishman 1996), a cotton pellet moistened with 10% sodium hypochlorite maintained for one minute in one group (no haemostasis in the other group, Nakornchai 2010), a cotton pellet moistened with 3% hydrogen peroxide (Shumayrikh 1999), or diode laser (810 nm with the pulsed contact mode of application for two seconds delivered by optical fibre tip and 1.5 W power) (Niranjani 2015). The other trials involved no haemostasis technique or no details about haemostasis.
Irrigation
Irrigation was performed in 48 (55%) trials (in one group only in three trials (Nguyen 2017; Prabhakar 2008; Saltzman 2005). Irrigants used were:
-
saline in 33 (38%) trials;
-
0.9% saline solution (Shumayrikh 1999);
-
0.5% saline (Coser 2008);
-
5.25% sodium hypochlorite and distilled water (Al‐Ostwani 2016);
-
2.5% sodium hypochlorite in three trials (Chen 2015; Nakornchai 2010; Trairatvorakul 2008);
-
2.5% sodium hypochlorite and saline in four trials (Arikan 2016; Chandra 2014; Nadkarni 2000; Rewal 2014);
-
1% sodium hypochlorite and saline or water in three trials (Aminabadi 2016; Bezgin 2016; Subramaniam 2011);
-
5% sodium hypochlorite followed by a 0.5% metronidazole solution (Ozalp 2005);
-
a mixture of 2.25% sodium hypochlorite (1.5 mL) and 0.12% chlorhexidine gluconate (1.5 mL) (Ramar 2010);
-
alternating irrigations of sterile saline and a chlorhexidine solution (Garrocho‐Rangel 2009);
-
saline and finally with 2% chlorhexidine (Pramila 2016);
-
3% hydrogen peroxide and sterile saline (Alaçam 1989); and
-
water in three trials (Nguyen 2017; Vargas 2006; Yildirim 2016).
Number of visits
Only one intervention session for both groups was necessary for 62 (71%) trials. In six trials (7%), the number of visits was one in one treatment group and two (Akcay 2014; Ansari 2010; Bezgin 2016; Kang 2015; Noorollahian 2008; Sonmez 2008) or one or two (Ibricevic 2000; Nakornchai 2010) in the other groups.
The number of visits was:
-
one or two in both groups in two trials (Cantekin 2014; Ozalp 2005);
-
two in 12 (14%) trials (Chen 2015; Goyal 2014; Goyal 2016; Grewal 2016; Jayam 2014; Kusum 2015; Mortazavi 2004; Nadkarni 2000; Naik 2005; Shumayrikh 1999; Subramaniam 2009; Subramaniam 2011);
-
three in two trials (Arikan 2016; Pinky 2011); and
-
four in one trial (Coser 2008).
Description of medicaments used
Pulpotomy
The formocresol technique used in 31 trials (36%) involved application of a cotton wool pellet soaked with formocresol on the pulp stumps for five minutes after pulpotomy. Alaçam 2009 and Yildirim 2016 involved applying the cotton wool pellet soaked with formocresol on the pulp stumps for three to four minutes, and Subramaniam 2009 and Shabzendedar 2013 involved applying a cotton wool pellet soaked with formocresol on the pulp stumps for one minute after pulpotomy.
The MTA technique used after pulpotomy involved a 3:1 powder:saline ratio in 21 trials (24%), followed by placement of moistened cotton pellet over MTA for 15 minutes in one trial (Jayam 2014). The MTA technique used by Moretti 2008 after pulpotomy involved a 1:1 powder:saline ratio. Oliveira 2013a or Kalra 2017 did not define the powder:saline ratio involved (they tried to obtain a "homogeneous paste" or a "thick paste").
The calcium hydroxide technique used by Celik 2013 involved application of calcium hydroxide powder mixed with sterile water in a 3:1 ratio to produce a homogeneous paste. The calcium hydroxide technique used by Grewal 2016 involved application of calcium hydroxide paste with the help of disposable tip topped by light cured calcium hydroxide.
The ferric sulphate technique used by Casas 2004 and Nguyen 2017 involved application of a 16% or 15.5% aqueous ferric sulphate solution on the pulp stumps for 10 to 15 seconds after pulpotomy, followed by a water flush in the pulp chamber (with an air‐water syringe). The ferric sulphate technique used in nine (10%) trials involved application of 15.5% aqueous ferric sulphate or eugenol‐free ferric sulphate for 15 seconds (Doyle 2010; Durmus 2014; Erdem 2011; Fei 1991; Fuks 1997; Ibricevic 2000; Markovic 2005; Ozmen 2017; Sonmez 2008), or 10 to 15 seconds (Fuks 1997; Sonmez 2008), after pulpotomy. The technique used by Huth 2005 involved application of 15.5% ferric sulphate. The ferric sulphate technique used by Vargas 2006, Gupta 2015 and Cantekin 2014 was described as application of ferric sulphate for 15 seconds after pulpotomy (followed by irrigation of saline in Cantekin 2014). The ferric sulphate technique used by Goyal 2016 and Yadav 2014 involved application of a 15.5% ferric sulphate solution on the pulp stumps for 15 seconds after pulpotomy, followed by irrigation of normal saline.
The ferric sulphate‐MTA technique used by Doyle 2010 involved application of a 15.5% aqueous ferric sulphate solution, followed by MTA application for 15 seconds after pulpotomy.
The Portland cement technique, with or without CHI₃ or ZrO₂, used by Lourenço 2015a, involved application of cements prepared using an MTA kit spoon (1 g) of powder as the measure parameter with two drops (0.3 mL) of distilled water and mixed in sterilised glass to obtain a paste consistency; cements were applied with a spatula. The Portland cement technique used by Oliveira 2013a involved 0.1 g Portland cement (previously sterilised with ethylene oxide and then mixed with sterile water) mixed with sterile saline to produce a homogeneous paste. The Portland cement technique used by Yildirim 2016 was sterilised with ethylene oxide prior to use, and 0.16 g of the cement was mixed with distilled water until a homogeneous paste was obtained.
The 5% NaOCl technique used by Vargas 2006 and Fernández 2013 involved application of a cotton wool pellet soaked with 5% NaOCl on the pulp stumps for 30 seconds after pulpotomy. The 3% NaOCl technique used by Shabzendedar 2013 involved application of a cotton pellet saturated with 3% NaOCI on the pulp stumps for 30 seconds after pulpotomy.
The 2% unbuffered glutaraldehyde technique used by Alaçam 1989 involved application on the pulp stumps of 2% unbuffered glutaraldehyde for five minutes after pulpotomy, followed by ZOE in one group, and calcium hydroxide in the other group. Goyal 2016 used the same technique followed by ZOE. Shumayrikh 1999 used the same technique, except glutaraldehyde was applied for three minutes after pulpotomy, followed by eugenol + intermediate restorative material (IRM) (a reinforced ZOE) in one group and calcium hydroxide in the other group.
The CEM technique used by Khorakian 2014 involved application of a 2 mm layer of CEM cement directly over the radicular pulp (3:1 powder:liquid ratio).
The technique used by Niranjani 2015 involved a diode laser of 810 nm with the pulsed contact mode of application for two seconds delivered by an optical fibre tip with at 1.5 W. The diode laser technique used by Durmus 2014 involved a beam at a wavelength of 810 nm transmitted; the diode laser fibre tip was kept 1 mm to 2 mm away from the tissue; the pulp at canal orifices was treated for 10 seconds with a frequency of 30 Hz, at 50 mJ, and 1.5 W, under air‐cooling operation mode without water. In Gupta 2015, the pulp was ablated to the level of the canal orifice using a diode laser at 980 nm wavelength, 3 W power and the continuous pulse mode. The laser energy of 4.0 J/cm² was delivered through a 0.5 mm diameter optical fibre in contact with the pulp tissue for 2 minutes and 31 seconds. If additional ablation was required, subsequent multiple applications were administered. In Yadav 2014, the remaining coronal pulp tissue was exposed to laser energy through an optical fibre using a diode laser of 810 nm and 7 W set at a 3 W power in the continuous mode. The laser energy was delivered through a 400 μm diameter optical fibre in a non contact mode but close to the pulp tissue for not more than two to three seconds (PD = 2388.53, Fluence = 7165.60).
The erbium:yttrium‐aluminium garnet (Er:YAG) laser technique used by Huth 2005 involved an application of 2 Hz and 180 mJ laser in the pulse mode without water cooling, with a mean number (± standard deviation) of laser pulses for each tooth of 31.5 ± 5.9 equally distributed to each pulp stump.
The low‐level laser therapy (LLLT) technique used by Uloopi 2016 involved a diode laser wavelength 810 nm, under continuous mode; an energy of 2 J/cm² was applied over the radicular stumps for about 10 seconds. The InGaAlP laser radiation used by Fernandes 2015 was delivered through a 320 lm diameter optical fibre in contact with pulp tissue; the parameters were set at 660 nm wavelength, 10 mW power output, 2.5 J/cm² energy density, 50 to 60 Hz frequency, 0.04 cm² focus beam diameter and irradiation time of 10 seconds. The same author used the LLLT (as described before) followed by calcium hydroxide.
The electrosurgery technique used by Bahrololoomi 2008 and Dean 2002 involved a maximum of three applications of one second to each pulpal orifice, with cool‐down periods of five seconds (Dean 2002), or 10 to 15 seconds (Bahrololoomi 2008), between applications to limit heat build‐up, at 40% power. In Gupta 2015, an electrosurgery electrode tip (unit T4, fine wire; 50 W power; 110 V ± 5% 50/60 Hz 92 VA; work frequency 1.5 ˜ 1.7 MHz ± 5%) was used for the pulpotomy procedure. During the procedure, the electrode tip was positioned slightly above the pulp tissue but close enough for electrical arcing to occur (about 1 mm above the tissue). The current was applied for 1 to 2 seconds over each pulpal stump. This procedure was repeated up to three times on each pulpal orifice, until brown appearance was observed in the tissue. In Yadav 2014, the ART‐E1 electrosurgery unit was set to the COAG 1 mode to perform both electrofulguration and electrocoagulation.The handpiece with appropriate electrode tips, kept 1 to 2 mm away from the pulpal tissue, was used to deliver the electric arc. The duration of application was not more than two to three seconds followed by a cool‐down period of five seconds. If necessary, this procedure was repeated up to a maximum of three times. After each current application, a new large moist sterile cotton pellet was placed with pressure on the pulpal tissue near to orifice to absorb any blood or tissue fluids before the next current application (e.g. pellet‐electrode‐pellet‐electrode). When properly completed, the pulpal stumps appeared dry and completely blackened. The electrosurgery/electrofulguration (Hyfrecator) used by Fishman 1996 involved application of the active electrode tip about 1 mm above each pulpal stump tissue for one to two seconds; if additional fulguration was required, 10 seconds elapsed before subsequent current application. In Khorakian 2014, an electrosurgical ball‐shaped electrode was immediately used for tissue coagulation. The unit was set at 55 W, 3.69 MHz, 600 Ω, and COAG mode. The electrode was placed 1 to 2 mm above the pulp orifices and then electrical arc allowed to bridge for 1 second. This procedure was repeated up to three times on each pulpal orifice with 5 to 10 second cool‐down intervals, until a dark brown appearance was observed in the tissues; then copious irrigation.
The enamel matrix derivative (EMD) technique used by Sabbarini 2008 after pulpotomy involved application of a cotton pellet on the amputated pulpal stump; the tooth was then conditioned with polyacrylic acid gel; the cotton pellet was then removed, and the amputated pulpal stump was covered with protein EMD gel from a 0.3 mL syringe. The technique used by Yildirim 2016 involved 0.7 mL of EMD injected over the root pulp tissue.
The Biodentine technique used by Kusum 2015 involved mixing pre‐measured unit dose capsules for 30 seconds at 4200 rpm in a triturator to obtain a putty‐like consistency. It was then carried with an amalgam carrier and condensed lightly with a metal condenser on the pulp stumps, to a thickness of 2 to 3 mm. The Biodentine used by Grewal 2016 involved the following procedure: before the capsule was opened, it was tapped gently on a hard surface to diffuse the powder; five drops of liquid from the single‐dose dispenser were poured into the capsule, after which the capsule was placed in a triturator for 30 seconds; the material was then transferred with the aid of the manufacturer‐supplied spatula and placed inside the cavity with the aid of an amalgam carrier or spatula. A plugger or sterile cotton pellet was used to adjust the material against the walls without excessive compression.
The propolis technique used by Kusum 2015 involved 1.5 g 100% standardised propolis extract powder mixed with 1.75 mL of polyethylene glycol to form a thick consistency on a clean dry glass slab using a metal spatula. The paste was carried to the pulp stumps with a metal carrier and then condensed lightly to a thickness of 2 to 3 mm.
The aloe vera technique used by Kalra 2017 involved use of a healthy plant of pure aloe vera, approximately four years old, certified by the Indian Agricultural Research Institute, procured at regular intervals throughout the study period. A healthy leaf was selected from the plant and cut from its stem base, cleaned with 70% ethyl alcohol, and stored in distilled water for one hour to eliminate aloin. After one hour, the outer green rind portion was removed using a sterile Bard‐Parker blade, and the blade was introduced inside the inner mucilage layer. The mucilage or the inner clear jelly‑like substance (approximately 10 mm) was removed and washed again. The mucilage was cut in half and placed onto the pulp stumps of the tooth.
The Ankaferd Blood Stopper technique used by Cantekin 2014 and Ozmen 2017 involved application of solution to the pulp stumps with a dental syringe for 15 seconds, before the pulp stumps were rinsed with saline solution and pulp chamber dried with sterile cotton pellets.
The following techniques after pulpotomy were not described in sufficient detail: formocresol (Coser 2008), diode laser with MTA (Akcay 2014; Sakai 2009; Saltzman 2005), MTA (Kusum 2015; Liu 2011), ZOE (Erdem 2011), calcium hydroxide (Akcay 2014; Alaçam 2009; Aminabadi 2010; Coser 2008; Demir 2007; Fernandes 2015; Huth 2005; Liu 2011; Markovic 2005; Moretti 2008; Oliveira 2013a; Sonmez 2008; Waterhouse 2000; Zurn 2008), CEM (Malekafzali 2011), Portland cement (Sakai 2009) and Biodentine (Cuadros‐Fernández 2016; El Meligy 2016; Niranjani 2015).
Pulpectomy
The Vitapex paste technique used by Mortazavi 2004 after pulpectomy involved application of an formocresol‐moistened cotton pellet in the pulp chamber after pulpotomy, followed by a ZOE paste (zonalin) temporary restoration at the first visit. Vitapex was applied after pulpectomy during the second visit. The Vitapex technique used by (Pramila 2016) was available in preformed syringes, the syringe was inserted into the canal near the apex, the paste was extruded into the canal, and the syringe was then slowly withdrawn as it filled the entire canal.
For the ZOE technique, Mortazavi 2004 also applied an formocresol‐moistened cotton pellet in the pulp chamber after pulpotomy, followed by a ZOE paste (zonalin) temporary restoration at the first visit; a ZOE paste was applied after pulpectomy during the second visit. The ZOE technique used by Nadkarni 2000 and Chandra 2014 involved application of ZOE with a needle placed 1 or 2 mm short of the radiographic apex. The ZOE technique used by Casas 2004, Al‐Ostwani 2016 and Nguyen 2017 involved application of ZOE paste after pulpectomy to the root canal with a spiral paste filler inserted into the canal to a point just short of the apex. The ZOE technique used by Pramila 2016 involved application of ZOE in the root canal with an endodontic pressure syringe. The ZOE technique used by Rewal 2014 involved use of a Lentulo spiral mounted on a slow‐speed hand piece.
For the Metapex technique, Al‐Ostwani 2016 used performed syringe with disposable plastic needles to inject the paste into the root canal; after inserting the tape of the needle near the apex, and the paste was gently pressed into the canal pulling the tape back slowly until the canal was filled.
The calcium hydroxide technique used by Nadkarni 2000 involved application of calcium hydroxide with a needle placed 2 mm short of the radiographic apex.
The MTA technique used by Arikan 2016 involved application of approximately 3 mm of MTA on the pulpal floor, then a moistened cotton pellet in contact with the MTA was left in the cavity before application of the temporary filling material. The MTA technique used by Bezgin 2016 involved application of MTA (mixed according to the manufacturer’s recommendations) in the canal using the MTA Gun System and compacted using endodontic pluggers; the MTA was allowed to set completely by placing a cotton pellet moistened with sterile water inside the pulp chamber.
The RC Fill technique used by Pramila 2016 was available in powder and liquid form, mixed to the desired consistency according to the manufacturer’s instructions; a Lentulo spiral was used to place the RC Fill.
The gutta‐percha/AH‐Plus technique used by Bezgin 2016 involved application of gutta‐percha points filling root canals, using a size 30 master cone and size 25, 20 and 15 accessory cones, with finger spreaders sizes 25 and 20 and AH‐Plus Sealer using a cold lateral condensation technique.
The ozonated sesame oil‐ZO technique used by Chandra 2014 involved application of a mixture of ZO powder (0.2 g, arsenic free) and ozonated sesame oil filling root canals 1 mm short of the apex using Lentulo spirals.
The Endoflas technique used by Rewal 2014 involved a Lentulo spiral mounted on a slow‐speed hand piece.
The technique used by Al‐Ostwani 2016 involved application of Endoflas‐CF. The powder of Endoflas‐CF paste was synthesised by adding 56.5% zinc oxide, 40.6% iodoform, 1.63% barium sulphate and 1.07% calcium hydroxide, and mixed with eugenol without adding chlorophenol. Paste was inserted into the root canal using Lentulo spirals at low speed.
The 3Mix (ciprofloxacin + metronidazole + minocycline) and the ciprofloxacin + ornidazole + minocycline technique after pulpectomy involved application of ciprofloxacin, metronidazole and minocycline in the first group and ciprofloxacin, ornidazole and minocycline in the second group (Pinky 2011). After removal of the coating, the drugs were pulverised using a sterile porcelain mortar and pestle. The powdered drugs were mixed in two different combinations at a ratio of 1:3:3 and kept separately to prevent exposure to light and moisture. One increment of each powdered drug was mixed with propylene glycol to form an ointment just before use. Canal orifices were enlarged to receive the medication using a round bur, then cavities were cleaned and irrigated using saline and dried.
The pulpectomy techniques used by Prabhakar 2008 involved application of 3Mix after necrotic coronal pulp removal in one group and after removal of both necrotic coronal as well as all accessible radicular pulp tissue in the other group.
The pulpectomy technique used by Al‐Ostwani 2016 involved application of ZOP. The hydrolytic propolis of ZOP paste was extracted from raw propolis. ZOP paste was synthesised by mixing 50% zinc oxide powder with 50% hydrolytic propolis, to form a radiopaque paste with appropriate viscosity for filling the root canal. The paste was inserted into the root canal using Lentulo spirals at low speed.
The following techniques after pulpectomy were not described in sufficient detail: IRM (Arikan 2016), MTA (Celik 2013; Ozalp 2005; Subramaniam 2011), Vitapex technique (Nakornchai 2010; Ozalp 2005; Trairatvorakul 2008), 3Mix (Nakornchai 2010), Sealapex and calcium hydroxide (Ozalp 2005), RC Fill, Metapex, ZOE + Metapex techniques and Endoflas (Ramar 2010; Subramaniam 2011).
Direct pulp capping
The formocresol technique involved application of a cotton pellet soaked with formocresol on the pulp exposure for five minutes (Aminabadi 2010).
The MTA technique involved a 3:1 powder:saline ratio in Tuna 2008. In Aminabadi 2016, MTA was mixed with normal saline to form a creamy mixture delivered to the exposure site using a small amalgam carrier to reach a thickness of 1.5 to 2 mm and extending 2 mm beyond the margins of the exposure site. A wet cotton pellet was pressed slightly for better adaptation of capping material with pulp at the exposure site.
The etch‐and‐rinse adhesive technique involved application of 36% phosphoric acid gel on enamel margins for 15 seconds, followed by extending the gel application to the cavity for an additional 10 seconds with care not to contact the exposed pulp (Demir 2007).
The calcium sulphate hemihydrate technique involved application of calcium sulphate powder, mixed with three to four drops of regular‐set liquid until a putty‐like consistency was achieved, and applied with ball‐ended instruments at the exposure site (Ulusoy 2014a).
In Aminabadi 2016, 3Mix, 3Mixtatin and simvastatin were mixed with normal saline to form a creamy mixture and delivered to the exposure site using a small amalgam carrier to reach a thickness of 1.5 to 2 mm and extending 2 mm beyond the margins of the exposure site. A dry cotton pellet was pressed slightly for better adaptation of capping material with pulp at the exposure site.
The following techniques after direct pulp capping were not described in sufficient detail: EMD (Garrocho‐Rangel 2009), calcium hydroxide (Garrocho‐Rangel 2009; Tuna 2008), acetone‐based total‐etch adhesive, non‐rinse conditioner, self‐etch adhesive system (Demir 2007), calcium hydroxide cement (Dycal) (Ulusoy 2014a), CEM (Fallahinejad Ghajari 2013), Biodentine (Rajasekharan 2017), Tempophore (Rajasekharan 2017) and MTA (Fallahinejad Ghajari 2013; Rajasekharan 2017).
Intermediate restoration
Formocresol techniques were followed by placement of:
-
ZOE in 14 trials (16%);
-
ZOE and IRM in eight trials (Agamy 2004; Eidelman 2001; Farsi 2005; Fei 1991; Fernandes 2015; Fuks 1997; Holan 2005; Moretti 2008);
-
IRM in six trials (Ansari 2010; Dean 2002; El Meligy 2016; Huth 2005; Shabzendedar 2013; Zealand 2010);
-
two successive IRM temporary restorations (formocresol dressing changed after seven days, ZOE placement at third visit) (Coser 2008);
-
calcium hydroxide liner and glass‐ionomer cement (Markovic 2005);
-
Cavit (Sabbarini 2008);
-
ZOE and zinc phosphate cement (Sonmez 2008); and
-
ZOE and glass ionomer cement in two trials (Durmus 2014; Yildirim 2016).
The type of intermediate restoration after formocresol technique was not specified in two trials (Alaçam 2009; Goyal 2014).
MTA techniques were followed by placement of:
-
IRM in 15 trials (17%);
-
ZOE in nine trials (Erdem 2011; Goyal 2016; Jayam 2014; Naik 2005; Noorollahian 2008; Olatosi 2015; Sonmez 2008; Subramaniam 2009; Tuna 2008);
-
glass‐ionomer cement in six trials (Celik 2013; Kalra 2017; Liu 2011; Rajasekharan 2017; Uloopi 2016; Yildirim 2016);
-
metal‐reinforced glass ionomer cement (Arikan 2016);
-
reinforced glass ionomer cement (Bezgin 2016); and
-
ZOE and glass ionomer cement (Kusum 2015).
There was no intermediate restoration in three trials after MTA technique (Aeinehchi 2007; Fallahinejad Ghajari 2013; Saltzman 2005).
Calcium hydroxide techniques were followed by placement of:
-
ZOE in five trials (Aminabadi 2010; Nadkarni 2000; Niranjani 2015; Tuna 2008; Waterhouse 2000);
-
IRM in five trials (Coser 2008; Huth 2005; Moretti 2008; Oliveira 2013a);
-
ZOE and IRM (Fernandes 2015);
-
glass‐ionomer cement in four trials (Celik 2013; Grewal 2016; Liu 2011; Markovic 2005); and
-
dentine adhesive (Garrocho‐Rangel 2009).
The type of intermediate restoration after calcium hydroxide technique was not specified (Alaçam 2009), and there was no intermediate restoration in three trials (Demir 2007; Sonmez 2008; Zurn 2008).
Ferric sulphate techniques were followed by placement of:
-
IRM in three trials (Doyle 2010; Huth 2005; Vargas 2006);
-
IRM and glass ionomer cement (Cantekin 2014);
-
ZOE in six trials (Casas 2004; Erdem 2011; Goyal 2016; Gupta 2015; Ozmen 2017; Yadav 2014);
-
ZOE and glass‐ionomer cement (Durmus 2014); and
-
MTA followed by a layer of light‐cured glass ionomer (Nguyen 2017).
Eugenol‐free ferric sulphate was followed by placement of:
-
Cimpact S (Doyle 2010);
-
ZOE then IRM for five days over the ZOE paste for very uncooperative children (Ibricevic 2000);
-
calcium hydroxide and glass‐ionomer cement (Markovic 2005); and
-
ZOE and zinc phosphate cement (Sonmez 2008).
Ferric sulphate/MTA technique was followed by IRM (Doyle 2010).
Calcium hydroxide cement and calcium sulphate hemihydrate techniques were followed by glass‐ionomer cement restoration (Ulusoy 2014a).
Portland cement technique was followed by:
-
IRM in three trials (Lourenço 2015a; Oliveira 2013a; Sakai 2009); and
-
ZOE and glass ionomer cement (Yildirim 2016).
NaOCl techniques were followed by IRM in three trials (Fernández 2013; Shabzendedar 2013; Vargas 2006).
The techniques for 2% glutaraldehyde + eugenol + IRM and 2% glutaraldehyde + calcium hydroxide were followed by placement of compomer in Shumayrikh 1999. There was no intermediate restoration after 2% unbuffered glutaraldehyde + ZOE and 2% unbuffered glutaraldehyde + calcium hydroxide techniques in Alaçam 1989. Goyal 2016 reported use of 2% buffered glutaraldehyde followed by ZOE.
EMD technique was followed by ZOE and glass ionomer cement in Yildirim 2016. There was no intermediate restoration in Garrocho‐Rangel 2009 and Sabbarini 2008.
CEM technique was followed by IRM in Malekafzali 2011. There was no intermediate restoration after CEM in Fallahinejad Ghajari 2013 and Khorakian 2014.
Diode laser technique was followed by:
-
ZOE in three trials (Gupta 2015; Niranjani 2015; Yadav 2014); and
-
ZOE and glass ionomer cement (Durmus 2014).
Er:YAG laser technique was followed by IRM (Huth 2005).
Electrosurgery techniques were followed by placement of:
-
ZOE in five trials (Bahrololoomi 2008; Fishman 1996; Gupta 2015; Khorakian 2014; Yadav 2014);
-
IRM (Dean 2002); and
-
calcium hydroxide (Fishman 1996).
LLLT technique was followed by glass ionomer cement in Uloopi 2016 and by ZOE + IRM in Fernandes 2015.
Biodentine technique was followed by ZOE and glass ionomer cement in Kusum 2015, by IRM in Cuadros‐Fernández 2016, and by glass ionomer cement in Rajasekharan 2017. There was no intermediate restoration following Biodentine in three trials (El Meligy 2016; Grewal 2016; Niranjani 2015).
Propolis technique was followed by ZOE and glass ionomer cement in Kusum 2015.
Aloe vera technique was followed by a layer of collagen sponge and glass ionomer cement in Kalra 2017.
Ankaferd Blood Stopper technique was followed by IRM and glass ionomer cement in Cantekin 2014, and by ZOE in Ozmen 2017.
Tempophore was followed by glass ionomer cement in Rajasekharan 2017.
Vitapex technique was followed by IRM placement (Nakornchai 2010) and glass‐ionomer cement (Pramila 2016). There was no intermediate restoration in three trials (Mortazavi 2004; Ozalp 2005; Trairatvorakul 2008).
Metapex technique was followed by ZOE placement in Ramar 2010, ZOE and glass ionomer (Miracle mix) (Subramaniam 2011), and glass ionomer (Al‐Ostwani 2016).
ZOE + Metapex and RC Fill techniques were followed by placement of ZOE (Ramar 2010).
Endoflas technique was followed by placement of ZOE and glass ionomer (Miracle mix) (Subramaniam 2011), ZOE (Rewal 2014), and glass ionomer (Al‐Ostwani 2016).
ZOE technique was followed by glass ionomer in four trials (Al‐Ostwani 2016; Nguyen 2017; Pramila 2016; Subramaniam 2011), thick ZOE paste (Rewal 2014), and no intermediate restoration in six trials (Chandra 2014; Erdem 2011; Mortazavi 2004; Nadkarni 2000; Ozalp 2005; Trairatvorakul 2008).
IRM technique was followed by placement of metal‐reinforced glass ionomer cement (Arikan 2016).
The type of intermediate restoration after calcium hydroxide/iodoform techniques was not specified in Alaçam 2009.
3Mix and ciprofloxacin + ornidazole + minocycline techniques were followed by ZOE or IRM in three trials (Aminabadi 2016; Nakornchai 2010; Pinky 2011).
3Mixtatin and simvastatin were followed by IRM in Aminabadi 2016.
The gutta‐percha/AH‐Plus technique was followed by reinforced glass ionomer cement in Bezgin 2016.
There was no intermediate restoration following ozonated sesame oil‐ZO technique in Chandra 2014.
ZOP technique was followed by glass ionomer in Al‐Ostwani 2016.
There was no intermediate restoration after ZOE technique (Casas 2004), acetone‐based total‐etch adhesive (Demir 2007), Sealapex technique (Ozalp 2005), calcium hydroxide technique (Ozalp 2005), and antibacterial mix technique (Prabhakar 2008).
Final restoration
Final restorations after placement of formocresol were:
-
stainless‐steel crown in 18 (21%) trials;
-
amalgam in four trials (Bahrololoomi 2008; Erdem 2011; Markovic 2005; Sonmez 2008);
-
glass‐ionomer cement and stainless‐steel crown in three trials (Sabbarini 2008; Saltzman 2005; Subramaniam 2009);
-
amalgam or stainless‐steel crown in three trials (Ansari 2010; Ibricevic 2000; Ozmen 2017);
-
amalgam or glass‐ionomer cement (Aeinehchi 2007);
-
glass‐ionomer cement or stainless‐steel crown if the restoration was not satisfactory (Coser 2008);
-
composite or stainless‐steel crown (Holan 2005);
-
glass‐ionomer cement or composite or stainless‐steel crown (Huth 2005);
-
glass‐ionomer cement in two trials (Fernandes 2015; Moretti 2008);
-
stainless steel crown and/or glass ionomer restoration and silver amalgam (Jayam 2014);
-
glass‐ionomer cement or composite or amalgam, and stainless‐steel crown if indicated (Waterhouse 2000).
Final restoration after placement of formocresol was not mentioned in Alaçam 1989.
Final restorations after placement of MTA were:
-
stainless‐steel crown in 21 trials (24%);
-
amalgam in five trials (Aeinehchi 2007; Celik 2013; Fallahinejad Ghajari 2013; Sonmez 2008; Tuna 2008), followed by a light‐cured fissure sealant material in one trial (Celik 2013);
-
glass‐ionomer cement in two trials (Moretti 2008; Sakai 2009);
-
resin modified glass ionomer cement (Oliveira 2013a);
-
composite resin in two trials (Bezgin 2016; Liu 2011);
-
composite resin or amalgam or stainless (Holan 2005);
-
amalgam or stainless‐steel crown (Malekafzali 2011);
-
glass ionomer and amalgam (Aminabadi 2016);
-
stainless steel crown and/or glass ionomer restoration and silver amalgam (Jayam 2014);
-
glass‐ionomer cement and stainless‐steel crown (Subramaniam 2009).
Final restorations after placement of calcium hydroxide were:
-
stainless‐steel crown in four trials (Alaçam 2009; Aminabadi 2010; Garrocho‐Rangel 2009; Nadkarni 2000);
-
amalgam in four trials (Celik 2013; Demir 2007; Markovic 2005; Tuna 2008) followed by a light‐cured fissure sealant material (Celik 2013);
-
glass‐ionomer cement or stainless‐steel crown if the restoration was not satisfactory (Coser 2008);
-
glass‐ionomer cement or composite or stainless‐steel crown (Huth 2005);
-
glass‐ionomer cement in two trials (Fernandes 2015; Moretti 2008);
-
resin modified glass ionomer cement (Oliveira 2013a);
-
glass‐ionomer cement and amalgam (Sonmez 2008);
-
glass‐ionomer cement or composite or amalgam, and stainless‐steel crown if indicated (Waterhouse 2000);
-
glass‐ionomer cement and stainless‐steel crown (Zurn 2008)
-
composite resin (Liu 2011); and
-
nanohybrid composite resin (Grewal 2016).
Final restorations after placement of ferric sulphate were:
-
stainless‐steel crown in eight trials (Cantekin 2014; Doyle 2010; Durmus 2014; Fei 1991; Fuks 1997; Goyal 2016; Gupta 2015; Vargas 2006);
-
amalgam in three trials (Erdem 2011; Markovic 2005; Sonmez 2008);
-
amalgam or stainless‐steel crown in three trials (Casas 2004; Ibricevic 2000; Ozmen 2017);
-
glass‐ionomer cement (Yadav 2014);
-
acid etch resin (Nguyen 2017); and
-
glass‐ionomer cement or composite or stainless‐steel crown (Huth 2005).
Final restorations after placement of ZOE were amalgam in three trials (Erdem 2011; Mortazavi 2004; Ozalp 2005), stainless‐steel crown in four trials (Nadkarni 2000; Rewal 2014; Subramaniam 2011; Trairatvorakul 2008) and acid‐etch resin (Nguyen 2017).
Final restoration after placement of 2% glutaraldehyde + eugenol + IRM and 2% glutaraldehyde + calcium hydroxide techniques was stainless‐steel crown in one trial (Shumayrikh 1999). Final restoration after placement of 2% unbuffered glutaraldehyde + ZOE and 2% unbuffered glutaraldehyde + calcium hydroxide was not mentioned in one trial (Alaçam 1989). Final restoration after placement of 2% buffered glutaraldehyde was stainless steel crown in one trial (Goyal 2016).
Final restoration after diode laser was stainless steel crown in three trials (Durmus 2014; Gupta 2015; Niranjani 2015) and glass‐ionomer cement in one trial (Yadav 2014).
Final restorations after electrosurgery were stainless‐steel crowns in four trials (Dean 2002; Fishman 1996; Gupta 2015; Khorakian 2014), amalgam in one trial (Bahrololoomi 2008) and glass‐ionomer cement in one trial (Yadav 2014).
Final restoration after placement of acetone‐based total‐etch adhesive, acetone‐based total‐etch adhesive, total‐etching with 36% phosphoric acid and self etch adhesive system was composite in one trial (Demir 2007).
Final restorations after placement of EMD were stainless‐steel crowns in two trials (Garrocho‐Rangel 2009; Yildirim 2016), and glass‐ionomer cement and stainless‐steel crowns in one other trial (Sabbarini 2008).
Final restorations after Er:YAG laser were glass‐ionomer cement and composite or stainless‐steel crowns in one trial (Huth 2005).
Final restoration after LLLT was stainless‐steel crown in one trial (Uloopi 2016) and glass ionomer cement in one trial (Fernandes 2015).
Final restorations after placement of CEM were amalgam or stainless‐steel crowns in one trial (Malekafzali 2011), amalgam in one trial (Fallahinejad Ghajari 2013), and stainless steel crown in one trial (Khorakian 2014).
Final restoration after placement of Portland cement was:
-
glass‐ionomer cement in two trials (Lourenço 2015a; Sakai 2009);
-
resin‐modified glass‐ionomer cement in one trial (Oliveira 2013a); and
-
stainless steel crown in one trial (Yildirim 2016)
Final restoration after placement of calcium hydroxide cement and calcium sulphate hemihydrate was amalgam followed by a light‐cured fissure sealant material in one trial (Ulusoy 2014a).
Final restoration after placement of Biodentine was stainless steel crown in five trials (Cuadros‐Fernández 2016; El Meligy 2016; Kusum 2015; Niranjani 2015; Rajasekharan 2017) and nanohybrid composite resin in one trial (Grewal 2016).
Final restoration was stainless steel crown after placement of propolis (Kusum 2015), Tempophore (Rajasekharan 2017) and aloe vera (Kalra 2017).
Final restoration after Ankaferd Blood Stopper was stainless steel crown in one trial (Cantekin 2014), and amalgam or stainless steel crown in one trial (Ozmen 2017).
Final restorations after placement of Vitapex or Metapex were:
-
amalgams in two trials (Mortazavi 2004; Ozalp 2005);
-
glass‐ionomer cement and stainless‐steel crowns in one trial (Nakornchai 2010); and
-
stainless‐steel crowns in five trials (Al‐Ostwani 2016; Pramila 2016; Ramar 2010; Subramaniam 2011; Trairatvorakul 2008).
Final restorations after placement of 3Mix were glass‐ionomer cement and stainless‐steel crowns in two trials (Nakornchai 2010; Pinky 2011), and glass ionomer and amalgam in one trial (Aminabadi 2016).
Final restoration after placement of 3Mixtatin and simvastatin were glass ionomer and amalgam in one trial (Aminabadi 2016).
Final restoration after placement of Sealapex or calcium hydroxide was amalgam in one trial (Ozalp 2005).
Final restorations after placement of ciprofloxacin + metronidazole + minocycline and ciprofloxacin + ornidazole + minocycline were glass‐ionomer cement and stainless‐steel crowns in one trial (Pinky 2011).
Final restorations after antibacterial mix technique were made of glass‐ionomer cement and composite resin in one trial (Prabhakar 2008).
Final restoration after gutta‐percha/AH‐Plus technique was resin composite in one trial (Bezgin 2016).
Final restoration after placement of calcium hydroxide/iodoform (Alaçam 2009), ZOE (Al‐Ostwani 2016; Casas 2004; Chandra 2014; Pramila 2016), IRM (Arikan 2016), ozonated sesame oil‐ZO (Chandra 2014), ferric sulphate: MTA (Doyle 2010), RC Fill (Pramila 2016; Ramar 2010), ZOE + Metapex (Ramar 2010), Endoflas or Endoflas‐CF (Al‐Ostwani 2016; Rewal 2014; Subramaniam 2011), ZOP (Al‐Ostwani 2016) and 3% or 5% NaOCl (Fernández 2013; Shabzendedar 2013; Vargas 2006) was stainless‐steel crown in 10 trials.
Excluded studies
We excluded 55 studies: 30 were not RCTs, 14 had only an abstract, with insufficient information and no response from authors; in 2 articles biomaterials were not compared; 4 articles were reviews, 2 were case reports and 1 was a terminated trial; 1 was an in vitro study in dogs and humans, 1 focused on restorative dentistry, and 1 was a duplicate.
Risk of bias in included studies
Summary details are given in the Characteristics of included studies table and Figure 2.
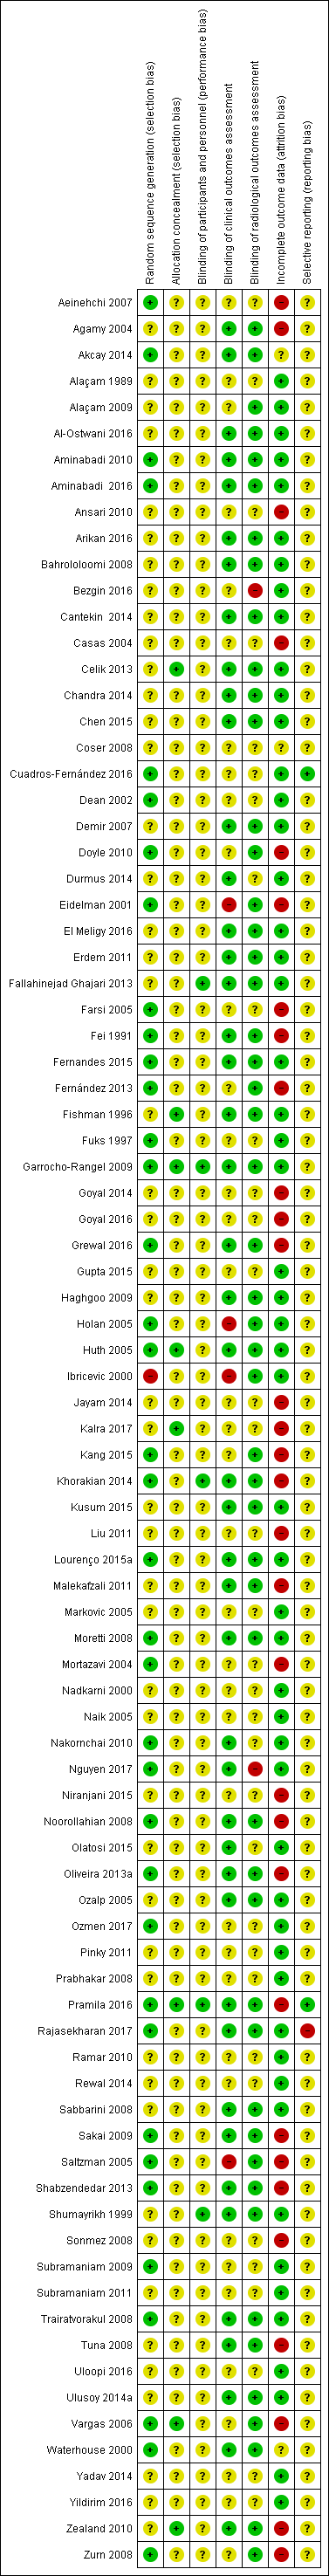
Risk of bias summary: review authors' judgements about each risk of bias item for each included study
Allocation
Random sequence generation
The risk of selection bias with regard to sequence generation was low in 37 trials (43%). The sequence was generated by random number tables or computerised random‐number generators in 24 trials (28%) and coin toss in 13 trials (15%).
One included trial described an alternate allocation (Ibricevic 2000), and was judged to be at high risk of bias.
There was insufficient information to make a clear judgement about risk of bias in 49 trials (56%).
Allocation concealment
Allocation concealment was applied for eight included studies (Celik 2013; Fishman 1996; Garrocho‐Rangel 2009; Huth 2005; Kalra 2017; Pramila 2016; Vargas 2006; Zealand 2010), which were assessed as being at low risk of bias for this domain. In the other 79 trials (91%), allocation concealment was unclear.
Blinding
Blinding of participants and personnel
Participants and personnel were blinded in five trials (Fallahinejad Ghajari 2013; Garrocho‐Rangel 2009; Khorakian 2014; Pramila 2016; Shumayrikh 1999). Blinding of participants and personnel was unclear in 82 included trials (94%).
Blinding of clinical outcomes assessment
The children were examined clinically by examiners blinded to the technique in 45 trials (50%). Children were examined clinically by examiners who were not blinded to the treatment in four trials (Eidelman 2001; Holan 2005; Ibricevic 2000; Saltzman 2005). There was insufficient information to make a clear judgement of blinding in 38 trials (44%).
Blinding of radiological outcomes assessment
The children were examined radiographically by examiners blinded to the technique in 51 trials (59%). Children were examined radiographically by examiners who were not blinded to the treatment in two trials (Bezgin 2016; Nguyen 2017). There was insufficient information to make a clear judgement on radiological blinding in 34 trials (39%).
Incomplete outcome data
The risk of bias for incomplete outcome data was low for 53 trials (61%): 32 trials (37%) had no missing data, the proportion of missing outcomes was lower than 10% of children or teeth randomly assigned for 18 trials (21%), and missing outcome data balanced in numbers across intervention groups, with similar reasons for missing data across groups in three trials (Aminabadi 2016; Cuadros‐Fernández 2016; Rajasekharan 2017).
The proportion of missing outcomes was higher than 10% of children or teeth randomly assigned for 31 trials (36%)
There was insufficient information pertaining to attrition/exclusion in three trials (Akcay 2014; Coser 2008; Waterhouse 2000).
Selective reporting
We assessed two trials as being at low risk of reporting bias (Cuadros‐Fernández 2016; Pramila 2016). We did not have access to 97% of trial protocols, so we judged these trials to be at unclear risk of bias for the selective outcome reporting. We judged Rajasekharan 2017 to be at high risk of bias.
Overall risk of bias
The overall risk of bias was high in 36 trials (41%) (Aeinehchi 2007; Agamy 2004; Ansari 2010; Bezgin 2016; Casas 2004; Doyle 2010; Eidelman 2001; Farsi 2005; Fei 1991; Fernández 2013; Goyal 2014; Goyal 2016; Grewal 2016; Holan 2005; Ibricevic 2000; Jayam 2014; Kalra 2017; Kang 2015; Khorakian 2014; Liu 2011; Malekafzali 2011; Mortazavi 2004; Nguyen 2017; Niranjani 2015; Noorollahian 2008; Oliveira 2013a; Pramila 2016; Rajasekharan 2017; Sakai 2009; Saltzman 2005; Shabzendedar 2013; Sonmez 2008; Tuna 2008; Vargas 2006; Zealand 2010; Zurn 2008).
For the other 51 trials (59%), the risk of bias was unclear, frequently due to lack of information about allocation concealment and blinding of participants and staff.
Effects of interventions
See: Summary of findings for the main comparison Pulpotomy compared with pulpotomy using alternative medicament/technique for extensive decay in primary teeth; Summary of findings 2 Pulpectomy compared with pulpectomy using alternative medicament for extensive decay in primary teeth; Summary of findings 3 Direct pulp capping compared with direct pulp capping using alternative medicament for extensive decay in primary teeth
We identified 19 trials for the comparison of MTA and formocresol, six for the comparison of MTA and calcium hydroxide, five for the comparison of MTA and ferric sulphate, three for the comparison of MTA and Portland cement, four for the comparison of MTA and Biodentine, eight for the comparison of calcium hydroxide and formocresol, three for the comparison of calcium hydroxide and ferric sulphate, 10 for the comparison of ferric sulphate and formocresol, two for the comparison of NaOCl and ferric sulphate, three for the comparison of diode laser and ferric sulphate, two for the comparison of electrosurgery and ferric sulphate, two for the comparison of ferric sulphate and Ankaferd Blood Stopper, two for the comparison of glutaraldehyde + calcium hydroxide versus glutaraldehyde + ZOE, two for the comparison of diode laser and electrosurgery, two for the comparison of NaOCl and formocresol, two for the comparison of EMD and formocresol, two for the comparison of calcium hydroxide and ZOE, two for the comparison of Metapex and ZOE, two for the comparison of Metapex and Endoflas, five for the comparison of Vitapex and ZOE, and two for the comparison of Endoflas and ZOE. Two trials compared two different types of MTA (Agamy 2004; Celik 2013); we combined data for these two arms as prespecified. All other comparisons were addressed by only one trial each. Overall, only 59 of 87 trials (68%) were included in meta‐analyses.
Pulpotomy versus pulpotomy
We included 53 trials that compared pulpotomy using different types of medicaments. We assessed that 28 (32%) trials were at high risk of bias, and for 25 (29%) other trials, the risk of bias was unclear.
MTA versus full strength or 1:5 diluted formocresol
Clinical failure
At six months, data were extractable from 13 RCTs totaling 1048 teeth. In 10 of the 13 trials, there was no clinical failure in any of the participants regardless of the intervention. From the three remaining trials (N = 394 participants), the pooled results showed no statistically significant difference in clinical failure with MTA compared with formocresol. The pooled risk ratio (RR) was 0.37 (95% confidence interval (CI) 0.07 to 1.89). At 12 months, data were extractable from 12 RCTs totaling 740 teeth. In seven of the 12 trials, there was no clinical failure in any of the participants regardless of the intervention. From the five remaining trials, the results showed a statistically significant difference (RR 0.31, 95% CI 0.10 to 0.93) with no evidence of statistical heterogeneity among included trials (I² = 0%). At 24 months, data were extractable from nine RCTs totaling 548 teeth. In five of the nine trials, there was no clinical failure in any of the participants regardless of the intervention. From the four remaining trials, the results showed no statistically significant difference (RR 0.47, 95% CI 0.18 to 1.19; Analysis 1.1).
The results showed no statistically significant difference at any time point in clinical failure when full strength formocresol and 1:5 diluted formocresol results were not pooled (Analysis 2.1; Analysis 3.1).
Radiological failure
At six months, data were extractable from 12 RCTs totaling 922 teeth. In eight of the 12 trials, there was no radiological failure in any participants regardless of the intervention. From the four remaining trials, the pooled results showed a statistically significant difference in radiological failure with MTA compared with formocresol. The pooled RR was 0.38 (95% CI 0.17 to 0.86) with no evidence of statistical heterogeneity among included trials (I² = 0%). At 12 months, results were similar with seven trials providing data for a pooled RR of 0.41 (95% CI 0.19 to 0.89) with no evidence of statistical heterogeneity among included trials (I² = 0%). At 24 months, data were extractable from nine RCTs totaling 548 teeth, with eight trials providing data. The results showed a statistically significant difference (RR 0.42, 95% CI 0.22 to 0.80) with no evidence of statistical heterogeneity among included trials (I² = 18%; Analysis 1.2).
The results showed a statistically significant difference at 12 and 24 months in radiological failure for MTA compared with full strength formocresol (Analysis 2.2) (no statistically significant difference at 6 months); the results showed no statistically significant difference at any point in radiological failure for MTA compared with 1:5 diluted formocresol (Analysis 3.2).
Overall failure
At six months, data were extractable from six RCTs totaling 328 teeth. In four of the six trials, there was no overall failure in any of the participants regardless of the intervention. From the two remaining trials, the results showed no statistically significant difference in overall failure with MTA compared with formocresol (RR 0.23, 95% CI 0.04 to 1.32). Results were similar at 12 months with four trials providing data for an overall pooled RR of 0.48 (96% CI 0.17 to 1.36). At 24 months, data were extractable from seven RCTs totaling 368 teeth, with all seven trials providing data for a pooled RR of 0.50 (95% CI 0.25 to 1.01; Analysis 1.3).
Five of six included trials compared MTA with 1:5 diluted formocresol. One compared MTA with full strength formocresol with no statistically significant difference (Jayam 2014).
Two additional trials, which randomised 32 (Eidelman 2001) and 64 teeth (Holan 2005), did not assess overall failure at a fixed time point but at a mean (range) follow‐up of 13 (6 to 31) and 36 (4 to 74) months, respectively. The RRs were 0.30 (95% CI 0.01 to 6.77) for Eidelman 2001 and 0.19 (95% CI 0.02 to 1.52) for Holan 2005.
Pain
At six months, data were extractable from six RCTs totaling 390 teeth. In five trials, there was no pain in any of the participants regardless of the intervention. From the remaining trial, the results showed no statistically significant difference (RR 0.33, 95% CI 0.01 to 7.91). Results were similar at 12 months, with two trials providing data for a pooled RR of 0.25 (95% CI 0.03 to 2.18). At 24 months, data were extractable from four RCTs totaling 290 teeth. In one of the four trials, there was no pain in any of the participants regardless of the intervention. For the three remaining trials, the pooled results showed no statistically significant difference in pain with MTA compared with formocresol (RR 0.71, 95% CI 0.14 to 3.56; Analysis 1.4).
The results showed no statistically significant difference at any point in pain for MTA compared with full strength formocresol or 1:5 diluted formocresol (Analysis 2.3; Analysis 3.3).
One trial, which randomised 32 teeth, did not assess pain at a fixed time point but at a mean (range) follow‐up of 13 (6 to 31) (Eidelman 2001). There was no pain in any of the participants regardless of the intervention.
Soft tissue pathology
At six months, data were extractable from seven RCTs totaling 410 teeth. In six trials, there was no soft tissue pathology in any participants regardless of the intervention. For the remaining trial, the results showed no statistically significant difference (RR 0.33, 95% CI 0.01 to 7.91). At 12 months, in three trials, there was no soft tissue pathology in any participants regardless of the intervention. Of the remaining four trials, results showed no statistically significant difference (RR 0.22, 95% CI 0.05 to 1.01). At 24 months, data were extractable from five RCTs totaling 310 teeth, with two trials providing data for a pooled RR of 0.33 (95% CI 0.04 to 3.10; Analysis 1.5).
The results showed no statistically significant difference at any time point in soft tissue pathology for MTA compared either with full strength formocresol or 1:5 diluted formocresol (Analysis 2.4; Analysis 3.4).
In addition, two trials, which randomised 32 (Eidelman 2001) and 64 (Holan 2005) teeth, did not assess soft tissue pathology at a fixed time point but at a mean (range) follow‐up of 13 (6 to 31) for Eidelman 2001 and 38 (4 to 74) months for Holan 2005. There was no soft tissue pathology in any of the participants regardless of the intervention in Eidelman 2001, and for Holan 2005, the RR was 0.94 (95% CI 0.06 to 14.4).
Pathological mobility
At six months, data were extractable from five RCTs totaling 250 teeth. In both trials, there was no pathological mobility in any of the participants regardless of the intervention. At 12 months, data were extractable from four RCTs totaling 200 teeth. For three trials, there was no pathological mobility in any of the participants regardless of the intervention. Results from the remaining trial showed no statistically significant difference (RR 0.20, 95% CI 0.01 to 3.97). At 24 months, data were extractable from three RCTs totaling 150 teeth. In both trials, there was no pathological mobility in any of the participants regardless of the intervention (Analysis 1.6).
The results showed no statistically significant difference at any time point in pathological mobility between MTA and either full strength formocresol or 1:5 diluted formocresol (Analysis 2.5; Analysis 3.5).
Pathological radiolucency
At six months, data were extractable from 13 RCTs totaling 1010 teeth. In nine of the 13 trials, there was no pathological radiolucency in any of the participants regardless of the intervention. From the four remaining trials, the pooled results showed no evidence of a statistically significant difference in pathological radiolucency with MTA compared with formocresol (pooled RR 0.54, 95% CI 0.27 to 1.08). At 12 months, data were extractable from 11 RCTs totaling 652 teeth. In five of the 11 trials, there was no pathological radiolucency in any participants regardless of the intervention. From the six remaining trials, the pooled results showed evidence of a statistically significant difference in pathological radiolucency between MTA and formocresol (pooled RR 0.43, 95% CI 0.19 to 0.98) with no evidence of statistical heterogeneity among included trials (I² = 0%). At 24 months, data were extractable from eight RCTs totaling 460 teeth. In two of the eight trials, there was no pathological radiolucency in any participants regardless of the intervention. From the six remaining trials, the pooled results showed no evidence of a statistically significant difference in pathological radiolucency with MTA compared with formocresol (pooled RR 0.55, 95% CI 0.25 to 1.22; Analysis 1.7).
The results showed no statistically significant difference at any time point in pathological radiolucency between MTA and either full strength formocresol or 1:5 diluted formocresol (Analysis 2.5; Analysis 3.6).
In addition, two trials, which randomised 32 (Eidelman 2001) and 64 (Holan 2005) teeth, did not assess pathological radiolucency at a fixed time point but at a mean (range) follow‐up of 13 (6 to 31) for Eidelman 2001 and 36 (4 to 74) months for Holan 2005. For one trial, there was no pathological radiolucency in any of the participants regardless of the intervention, and for the other trial, the RR was 0.94 (95% CI 0.06 to 14.4).
Pathological root resorption
At six months, data were extractable from 11 RCTs totaling 866 teeth. In seven of the trials, there was no pathological root resorption in any participants regardless of the intervention. From the four remaining trials, the pooled results showed no evidence of a statistically significant difference in pathological root resorption with MTA compared with formocresol (pooled RR 0.47, 95% CI 0.18 to 1.21). At 12 months, data were extractable from nine RCTs totaling 508 teeth. In five of the trials, there was no pathological root resorption in any participants regardless of the intervention. From the four remaining trials, the pooled results showed no evidence of a statistically significant difference in pathological root resorption between MTA and formocresol (pooled RR 0.26, 95% CI 0.07 to 1.03). At 24 months, data were extractable from six RCTs totaling 338 teeth. In one of the five trials, there was no pathological root resorption in any of the participants regardless of the intervention. From the five remaining trials, the pooled results showed evidence of a statistically significant difference in pathological root resorption between MTA and formocresol (pooled RR 0.25, 95% CI 0.08 to 0.81), with no evidence of statistical heterogeneity among included trials (I² = 0%; Analysis 1.8).
The results showed a statistically significant difference at 24 months in pathological root resorption between MTA and full strength formocresol; the results showed no statistically significant difference at 6 and 12 months between MTA and full strength formocresol, or at any point between MTA and 1:5 diluted formocresol (Analysis 2.6; Analysis 3.7).
A further two trials, which randomised 32 (Eidelman 2001) and 64 (Holan 2005) teeth, did not assess pathological root resorption at a fixed time point but at a mean (range) follow‐up of 13 (6 to 31) months for Eidelman 2001 and 36 (4 to 74) months for Holan 2005. The RR was 0.06 (95% CI 0.00 to 0.92) for Eidelman 2001 and 0.30 (95% CI 0.01 to 6.77) for Holan 2005.
Pulp canal obliteration
At six months, data were extractable from nine RCTs totaling 712 teeth. In six of the trials, there was no pulp canal obliteration in any participants regardless of the intervention. From the three remaining trials, the pooled results showed no statistically significant difference in pulp canal obliteration between MTA and formocresol (pooled RR 1.52, 95% CI 1.00 to 2.30). Results were similar at 12 months, with five of seven trials providing data (RR 1.70, 95% CI 0.81 to 3.57). At 24 months, data were extractable from six RCTs totaling 338 teeth; the pooled results showed a larger risk of pulp canal obliteration with MTA compared with formocresol (RR 2.05, 95% CI 1.07 to 3.94), with no evidence of statistical heterogeneity among included trials (I² = 22%; Analysis 1.9).
The results showed no statistically significant difference at any time point in pulp canal obliteration between MTA and either full strength or 1:5 diluted formocresol (Analysis 2.7; Analysis 3.8).
One additional trial, which randomised 64 teeth, did not assess pulp canal obliteration at a fixed time point but at a mean (range) follow‐up of 36 (4 to 74) months (Holan 2005). The RR was 1.19 (95% CI 0.75 to 1.90).
Dentin bridge formation
At six months, data were extractable from three RCTs totaling 322 teeth. The pooled results showed a greater chance of dentin bridge formation with MTA than with formocresol (RR 18.16, 95% CI 3.63 to 90.91), with evidence of a moderate statistical heterogeneity among included trials (I² = 34%). At 12 months, data were extractable from two RCTs totaling 70 teeth; the pooled results showed no statistically significant difference in dentin bridge formation with MTA compared with formocresol. The pooled RR was 6.00 (95% CI 0.76 to 47.22). Results were similar at 24 months (Analysis 1.10).
All included trials compared MTA with 1:5 diluted formocresol.
In addition, the trial by Holan 2005, which randomised 64 teeth, did not assess dentin bridge formation at a fixed time point but at a mean (range) follow‐up of 36 (4 to 74) months. The RR was 2.82 (95% CI 0.12 to 66.82).
Physiological root resorption
At six months, data were extractable from two RCTs totaling 170 teeth. In both trials, there was no physiological root resorption in any of the participants regardless of the intervention. Results were similar at 12 months. At 24 months, one of the two trials showed no cases of physiological root resorption, regardless of the intervention. In the other trial, the results showed no statistically significant difference in physiological root resorption with MTA compared with formocresol (RR 0.33, 95% CI 0.01 to 7.83; Analysis 1.11).
The trial providing data assessed 1:5 diluted formocresol.
MTA versus calcium hydroxide
Clinical failure
At six months, data were extractable from four RCTs totaling 150 teeth. In three trials, there was no clinical failure in any participants regardless of the intervention. For the remaining trial, the results showed no statistically significant difference (RR 0.20, 95% CI 0.01 to 3.85). At 12 months, with four trials providing data, the pooled results showed a statistically significant difference in clinical failure between MTA and calcium hydroxide (RR 0.16 (95% CI 0.04 to 0.70), with no evidence of statistical heterogeneity among the included trials (I² = 0%). At 24 months, data were extractable from five RCTs totaling 284 teeth. All trials provided data. The pooled results showed a statistically significant difference in favour of MTA (RR 0.25, 95% CI 0.12 to 0.52), with evidence of a moderate statistical heterogeneity among included trials (I² = 31%; Analysis 5.1).
Radiological failure
At six months, data were extractable from four RCTs totaling 150 teeth. In one trial, there was no radiological failure in any participants regardless of the intervention. In the other trials, the results showed a statistically significant difference in radiological failure in favour of MTA compared to calcium hydroxide (RR 0.08, 95% CI 0.02 to 0.41), with no evidence of statistical heterogeneity among included trials (I² = 0%). Results were similar at 12 months (RR 0.12, 95% CI 0.04 to 0.36). At 24 months, data were extractable from five RCTs totaling 284 teeth. All trials provided data. The pooled results showed a statistically significant difference in favour of MTA (RR 0.14, 95% CI 0.08 to 0.26), with evidence of substantial statistical heterogeneity among included trials (I² = 68%; Analysis 5.2).
Overall failure
At six months, data were extractable from two RCTs totaling 68 teeth. In one trial, there was no overall failure in any of the participants regardless of the intervention. In the other trial, the results showed no statistically significant differences (RR 0.20, 95% CI 0.01 to 3.92). Results were similar at 12 months with all trials providing data (RR 0.34, 95% CI 0.10 to 1.19). At 24 months, the pooled results showed a statistically significant difference in favour of MTA (RR 0.42, 95% CI 0.18 to 0.95), with evidence of moderate statistical heterogeneity among included trials (I² = 36%; Analysis 5.3).
Pain
At six and 12 months, one trial, which randomised 62 teeth, assessed spontaneous pain (Akcay 2014). There was no pain in any of the participants regardless of the intervention. At 24 months, data were extractable from two RCTs totaling 196 teeth. The results showed no statistically significant difference between MTA and calcium hydroxide (RR 0.41, 95% CI 0.09 to 1.73; Analysis 5.4).
Defective restoration (clinically)
One trial, which randomised 139 teeth, assessed amalgam restorations with ditched margins (Celik 2013). At 24 months, there was no statistically significant difference between MTA and calcium hydroxide (RR 0.54, 95% CI 0.08 to 3.71).
Soft tissue pathology
At six months, data were extractable from three RCTs totaling 122 teeth. In one trial, there was no soft tissue pathology in any of the participants regardless of the intervention. In the other trials, results showed no statistically significant difference (RR 0.20, 95% CI 0.02 to 1.62). At 12 months, with all trials providing data, the results were statistically significant and in favour of MTA (RR 0.12, 95% CI 0.02 to 0.62), with no evidence of statistical heterogeneity among included trials (I² = 0%). At 24 months, data were extractable from four RCTs totaling 256 teeth. All trials provided data. The results were statistically significant (RR 0.17, 95% CI 0.06 to 0.47) with no evidence of statistical heterogeneity among included trials (I² = 0%; Analysis 5.5).
Pathological mobility
At six and 12 months, data were extractable from three RCTs totaling 122 teeth. In one trial, there was no pathological mobility in any of the participants regardless of the intervention. In the other trials, results showed no statistically significant difference (RR 0.20, 95% CI 0.02 to 1.62). Results were statistically significant at 12 and 24 months, clearly favouring MTA (RR 0.09, 95% CI 0.01 to 0.66), with no evidence of statistical heterogeneity among included trials (I² = 0%). At 24 months, data were extractable from four RCTs totaling 256 teeth with all trials providing data (Analysis 5.6).
Pathological radiolucency
At six months, data were extractable from four RCTs totaling 162 teeth. For one trial, there was no pathological radiolucency in any of the participants regardless of the intervention. For the remaining trials, results were statistically significant and in favour of MTA (RR 0.10, 95% CI 0.02 to 0.50), with no evidence of statistical heterogeneity among included trials (I² = 0%). Results were similar at 12 (RR 0.14, 95% CI 0.04 to 0.47) and 24 months (RR 0.08, 95% CI 0.03 to 0.22). At 24 months, data were extractable from five RCTs totaling 296 teeth with all trials providing data (Analysis 5.7).
Pathological root resorption
At six months, data were extractable from five RCTs totaling 190 teeth. In one of the trials, there was no pathological root resorption in any of the participants regardless of the intervention. From the other trials, the pooled results showed statistically significant difference in pathological root resorption between MTA and calcium hydroxide (RR 0.10, 95% CI 0.02 to 0.39) with no evidence of statistical heterogeneity among included trials (I² = 0%). Results were similar at 12 (RR 0.07, 95% CI 0.02 to 0.29) and 24 months (RR 0.08, 95% CI 0.03 to 0.18). At 24 months, data were extractable from five RCTs totaling 324 teeth with all trials providing data (Analysis 5.8).
Pulp canal obliteration
At six months, data were extractable from three RCTs totaling 120 teeth. In one of the trials, there was no pulp canal obliteration in any of the participants regardless of the intervention. From the other trials, the results showed a statistically significant difference between MTA and calcium hydroxide (RR 7.77, 95% CI 1.56 to 38.69), showing a higher risk of pulp canal obliteration with MTA than with calcium hydroxide, with no evidence of statistical heterogeneity among included trials (I² = 0%). At 12 months, results were not statistically significantly different with all trials providing data (RR 2.01, 95% CI 0.97 to 4.17). At 24 months, data were extractable from four RCTs totaling 254 teeth, with all trials providing data. The results showed a statistically significantly higher risk of pulp canal obliteration with MTA than with calcium hydroxide (RR 2.05, 95% CI 1.01 to 4.19), with evidence of substantial statistical heterogeneity among included trials (I² = 69%; Analysis 5.9).
Dentin bridge formation
Data were extractable from two RCTs totaling 60 teeth. At six months, the results showed a statistically significant difference and a greater chance of dentin bridge formation when MTA is applied than when calcium hydroxide is applied (RR 0.20, 95% CI 0.05 to 0.84), with no evidence of statistical heterogeneity among included trials (I² = 0%). Results were not statistically significant at 12 and 24 months (RR 0.80, 95% CI 0.37 to 1.74; Analysis 5.10).
MTA versus ferric sulphate
Clinical failure
At six months, data were extractable from four RCTs totaling 190 teeth. In three trials, there was no clinical failure in any of the participants regardless of the intervention. For the remaining trial, the results showed no statistically significant difference in clinical failure between MTA and ferric sulphate (RR 0.08, 95% CI 0.00 to 1.31). At 12 months, data were extractable from three RCTs totaling 130 teeth. In two trials, there was no clinical failure in any of the participants regardless of the intervention. For the remaining trial, the results showed no statistically significant difference in clinical failure for MTA compared with ferric sulphate (RR 0.20, 95% CI 0.01 to 3.97). Results were similar at 24 months, with all trials providing data (RR 0.52, 95% CI 0.20 to 1.39; Analysis 4.1).
Radiological failure
At six months, data were extractable from four RCTs totaling 190 teeth. In two trials, there was no clinical failure in any of the participants regardless of the intervention. For the two remaining trials, the pooled results showed a statistically significant difference (RR 0.06, 95% CI 0.01 to 0.40) with evidence of moderate statistical heterogeneity among included trials (I² = 30%). At 12 months, data were extractable from three RCTs totaling 130 teeth. In one trial, there was no clinical failure in any of the participants regardless of the intervention. For the remaining two trials, the pooled results showed no statistically significant difference (RR 0.71, 95% CI 0.15 to 3.44). Results were similar at 24 months, with all trials providing data (RR 0.58, 95% CI 0.25 to 1.36; Analysis 4.2).
Overall failure
At six months, data were extractable from four RCTs totaling 190 teeth. In two trials, there was no overall failure in any participants regardless of the intervention. For the two remaining trials, the pooled results showed a statistically significant difference favouring MTA over ferric sulphate (RR 0.06, 95% CI 0.01 to 0.40) with evidence of a moderate statistical heterogeneity among included trials (I² = 30%). At 12 months, data were extractable from three RCTs totaling 130 teeth. In one trial, there was no overall failure in any of the participants regardless of the intervention. For the remaining two trials, the pooled results showed no statistically significant difference (RR 0.71, 95% CI 0.15 to 3.44). Results were similar at 24 months, with all trials providing data (RR 0.78, 95% CI 0.32 to 1.89; Analysis 4.3).
Pain
At six months, data were extractable from three RCTs totaling 160 teeth. In two trials, there was no pain in any of the participants regardless of the intervention. For the remaining trial, the results showed no statistically significant difference (RR 0.20, 95% CI 0.01 to 4.00). At 12 months, data were extractable from two RCTs totaling 100 teeth. In the two trials, there was no pain in any of the participants regardless of the intervention (Analysis 4.4).
At 24 months, one trial, which randomised 50 teeth, assessed pain (Fernández 2013). There was no pain in any of the participants regardless of the intervention.
One additional trial, which randomised 111 teeth, did not assess pain at a fixed time point but at a mean (range) follow‐up of 22 (6 to 38) months (Doyle 2010). The RR was 0.36 (95% CI 0.02 to 8.75).
Soft tissue pathology
At six months, data were extractable from two RCTs totaling 110 teeth. In one trial, there was no soft tissue pathology in any of the participants regardless of the intervention. For the remaining trial, the results showed no statistically significant difference (RR 0.20, 95% CI 0.01 to 4.00; Analysis 4.5).
At 24 months, one trial, which randomised 50 teeth, assessed soft tissue pathology (Fernández 2013). There was no soft tissue pathology in any of the participants regardless of the intervention.
One additional trial assessed soft tissue pathology at a mean (range) follow‐up of 22 (6 to 38) months (Doyle 2010). There was no statistically significant difference between groups (RR 0.36, 95% CI 0.02 to 8.75).
Adjacent tissues inflammation
One trial, which randomised 50 teeth, assessed adjacent tissues inflammation (Fernández 2013). At six months, there was no adjacent tissue inflammation in any of the participants regardless of the intervention. At 12 and 24 months, the results showed no statistically significance between groups (RR 0.33, 95% CI 0.01 to 7.81; RR 0.20, 95% CI 0.01 to 3.97, respectively).
One additional trial, which randomised 111 teeth, assessed adjacent tissues inflammation at a mean (range) follow‐up of 22 (6 to 38) months (Doyle 2010). There was no statistically significant difference between groups (RR 0.36, 95% CI 0.02 to 8.75).
Pathological mobility
At six months, data were extractable from two RCTs totaling 110 teeth. In one trial, there was no pathological mobility in any of the participants regardless of the intervention. In the other trial, the results showed no statistically significant difference (RR 0.08, 95% CI 0.00 to 1.31; Analysis 4.6).
At 12 and 24 months, one trial, which randomised 50 teeth, assessed pathological mobility (Fernández 2013). There was no pathological mobility in any of the participants regardless of the intervention.
One additional trial, which randomised 111 teeth, assessed pathological mobility at a mean (range) follow‐up of 22 (6 to 38) months (Doyle 2010). There was no statistically significant difference between groups (RR 0.22, 95% CI 0.01 to 4.45).
Pathological radiolucency
At six months, data were extractable from three RCTs totaling 160 teeth. In two trials, there was no pathological radiolucency in any of the participants regardless of the intervention. In the remaining trial, the results showed a statistically significant difference favouring MTA over ferric sulphate (RR 0.03, 95% CI 0.00 to 0.48). At 12 and 24 months, data were extractable from two RCTs totaling 100 teeth. In one trial, there was no pathological radiolucency in any of the participants regardless of the intervention. For the remaining trial, the results showed no statistically significant difference at 12 and 24 months (RR 0.33, 95% CI 0.01 to 7.81; RR 0.20, 95% CI 0.01 to 3.97; respectively; Analysis 4.7).
One additional trial, which randomised 111 teeth, did not assess pathological radiolucency at a fixed time point but at a mean (range) follow‐up of 22 (6 to 38) months (Doyle 2010). The RR was 0.36 (95% CI 0.02 to 8.75).
Pathological root resorption
At six months, data were extractable from four RCTs totaling 190 teeth. In two trials, there was no pathological root resorption in any of the participants regardless of the intervention. For the two remaining trials, the pooled results showed a statistically significant difference favouring MTA over ferric sulphate (RR 0.07, 95% CI 0.01 to 0.53), with no evidence of statistical heterogeneity among included trials (I² = 8%). At 12 months, data were extractable from three RCTs totaling 130 teeth. In two trials, there was no pathological root resorption in any of the participants regardless of the intervention. For the remaining trial, the results showed no statistically significant difference (RR 0.20, 95% CI 0.01 to 3.97). Results were similar at 24 months, with all trials providing data (RR 0.56, 95% CI 0.12 to 2.51; Analysis 4.8).
One trial, which randomised 111 teeth, did not assess pathological root resorption at a fixed time point but at a mean (range) follow‐up of 22 (6 to 38) months (Doyle 2010). The RR was 0.22 (95% CI 0.07 to 0.71).
Pulp canal obliteration
At six months, data were extractable from three RCTs totaling 140 teeth. In the three trials, there was no pulp canal obliteration in any of the participants regardless of the intervention. At 12 months, data were extractable from two RCTs totaling 80 teeth. In one trial, there was no pulp canal obliteration in any of the participants regardless of the intervention. For the remaining trial, the results showed no statistically significant difference (RR 3.00, 95% CI 0.13 to 70.30). Results were similar at 24 months, with all trials providing data (RR 1.57, 95% CI 0.47 to 5.27; Analysis 4.9).
One additional trial, which randomised 111 teeth, did not assess pulp canal obliteration at a fixed time point but at a mean (range) follow‐up of 22 (6 to 38) months (Doyle 2010). The RR was 1.68 (95% CI 0.93 to 3.04).
Physiological root resorption
One trial, which randomised 50 teeth, assessed physiological root resorption (Erdem 2011). At six and 12 months, there was no physiological root resorption in any of the participants regardless of the intervention. At 24 months, the RR was 0.14 (95% CI 0.01 to 2.63).
Finally, one registered trial assessed clinical and radiographic success at six, nine and 12 months, but no resulting information was published (NCT02783911).
Ferric sulphate + MTA versus MTA
One trial, which randomised 130 teeth, assessed ferric sulphate + MTA versus MTA based on pain, soft tissue pathology, pathological mobility, pathological radiolucency, pathological root resorption and pulp canal obliteration (Doyle 2010). This trial did not assess the outcomes at a fixed time point but at a mean (range) follow‐up of 22 (6 to 38) months. There were no statistically significant differences for any outcome (Table 1).
| Outcome | Time point (months) | No. of studies | Risk ratio (95% CI) |
| Pain | mean 22 | 1 | Not estimable* |
| Soft tissue pathology | mean 22 | 1 | Not estimable* |
| Pathological mobility | mean 22 | 1 | Not estimable* |
| Pathological radiolucency | mean 22 | 1 | 3.46 (0.17 to 70.69) |
| Pathological root resorption | mean 22 | 1 | 2.75 (0.82 to 9.29) |
| Pulp canal obliteration | mean 22 | 1 | 0.83 (0.51 to 1.33) |
*due to lack of events
Abbreviations ‐ CI: confidence interval; FS: ferric sulphate; MTA: mineral trioxide aggregate
MTA versus Portland cement
Clinical failure
At six, 12 and 24 months, data were extractable from three RCTs totaling 130 teeth. In two trials, there was no clinical failure in any of the participants regardless of the intervention. For the remaining trial, the results showed no statistically significant difference (RR 0.20, 95% CI 0.01 to 4.02; Analysis 6.1).
Radiological failure
At six and 12 months, data were extractable from three RCTs totaling 130 teeth. In the three trials, there was no radiological failure in any of the participants regardless of the intervention. At 24 months, one trial provided data, and the results showed no statistically significant difference (RR 0.50, 95% CI 0.10 to 2.56; Analysis 6.2).
Pain
At six, 12 and 24 months, data were extractable from three RCTs totaling 130 teeth. In two trials, there was no pain in any of the participants regardless of the intervention. For the remaining trial, the results showed no statistically significant difference (RR 0.33, 95% CI 0.01 to 7.91; Analysis 6.3).
Soft tissue pathology
At six, 12 and 24 months, data were extractable from three RCTs totaling 130 teeth. In two trials, there was no clinical failure in any of the participants regardless of the intervention. For the remaining trial, the results showed no statistically significant difference (RR 0.20, 95% CI 0.01 to 4.02; Analysis 6.4).
Pathological mobility
At six, 12 and 24 months, data were extractable from three RCTs totaling 130 teeth. In two trials, there was no pain in any of the participants regardless of the intervention. For the remaining trial, the results showed no statistically significant difference (RR 0.33, 95% CI 0.01 to 7.91; Analysis 6.5).
Pathological radiolucency
At six and 12 months, data were extractable from three RCTs totaling 130 teeth. In the three trials, there was no radiological failure in any of the participants regardless of the intervention. At 24 months, one trial provided data, and the results showed no statistically significant difference (RR 0.67, 95% CI 0.12 to 3.75; Analysis 6.6).
Pathological root resorption
At six and 12 months, data were extractable from three RCTs totaling 130 teeth. In the three trials, there was no radiological failure in any of the participants regardless of the intervention. At 24 months, one trial provided data, and the results showed no statistically significant difference (RR 0.33, 95% CI 0.01 to 7.91; Analysis 6.7).
Smell
One trial, which randomised 30 teeth, assessed smell at six, 12 and 24 months (Sakai 2009). There was no smell at any time point regardless of the intervention.
Pulp canal obliteration
Data were extractable from two RCTs totaling 60 teeth. All trials provided data. Results were not statistically significant at 6 (RR 0.73, 95% CI 0.49 to 1.08), 12 (RR 0.83, 95% CI 0.60 to 1.14) and 24 months (RR 0.96, 95% CI 0.71 to 1.29; Analysis 6.8).
Dentin bridge formation
Data were extractable from two RCTs totaling 60 teeth. Results were not statistically significant at 6 (RR 0.56, 95% CI 0.13 to 2.43), 12 and 24 months (RR 1.50, 95% CI 0.61 to 3.71; Analysis 6.9).
Calcium‐enriched mixture (CEM) cement versus MTA
One trial, which randomised 80 teeth, assessed CEM cement versus MTA based on clinical failure, radiological failure and pathological root resorption (Malekafzali 2011). There were no statistically significant differences for any outcome or time point (Table 2).
| Outcome | Time point (months) | No. of studies | Risk ratio (95% CI) |
| Clinical failure | 6, 12 and 18 | 1 | Not estimable* |
| Radiological failure | 6 | 1 | Not estimable* |
| 12 | 1 | 0.33 (0.04 to 2.94) | |
| 18 | 1 | 0.33 (0.04 to 2.94) | |
| Pathological root resorption | 6 | 1 | Not estimable* |
| 12 | 1 | 0.33 (0.04 to 2.94) | |
| 18 | 1 | 0.33 (0.04 to 2.94) |
*due to lack of events
Abbreviations ‐ CEM: calcium‐enriched mixture; CI: confidence interval; MTA: mineral trioxide aggregate
MTA versus sodium hypochlorite (NaOCl)
One trial, which randomised 50 teeth, assessed MTA versus NaOCl based on clinical failure, radiological failure, overall failure, pain, soft tissue pathology, pathological mobility, pathological radiolucency and pathological root resorption (Fernández 2013). There were no statistically significant differences for any outcome or time point (Table 3).
| Outcome | Time point (months) | No. of studies | Risk ratio (95% CI) |
| Clinical failure | 6 and 12 | 1 | Not estimable* |
| 24 | 1 | 0.33 (0.01, 7.81) | |
| Radiological failure | 6 and 12 | 1 | 0.14 (0.01, 2.63) |
| 24 | 1 | 0.33 (0.04, 2.99) | |
| Overall failure | 24 | 1 | 0.33 (0.04, 2.99) |
| Pain | 6, 12 and 24 months | 1 | Not estimable* |
| Soft tissue pathology | 6 and 12 | 1 | Not estimable* |
| 24 | 1 | 0.33 (0.01, 7.81) | |
| Pathologic mobility | 6, 12 and 24 months | 1 | Not estimable* |
| Pathologic radiolucency | 6, 12 and 24 months | 1 | Not estimable* |
| Pathologicroot resorption | 6 and 12 | 1 | 0.14 (0.01, 2.63) |
| 24 | 1 | 0.33 (0.04, 2.99) |
*due to lack of events
Abbreviations ‐ CI: confidence interval; MTA: mineral trioxide aggregate; NaOCl: sodium hypochlorite
MTA versus calcium hydroxide + sodium hypochlorite (NaOCl)
One trial, which randomised 62 teeth, assessed MTA versus calcium hydroxide + NaOCl based on clinical failure, radiological failure, overall failure, pain, soft tissue pathology, pathological mobility, adjacent tissues pathology, pathological radiolucency, pathological root resorption and pulp canal obliteration (Akcay 2014). There were no statistically significant differences for any outcome or time point (Table 4).
| Outcome | Time point (months) | No. of studies | Risk ratio (95% CI) |
| Clinical failure | 6 and 12 | 1 | Not estimable* |
| Radiological failure | 6 | 1 | Not estimable* |
| 12 | 1 | 0.09 (0.01, 1.58) | |
| Soft tissue pathology | 6 and 12 | 1 | Not estimable* |
| Pathologic mobility | 6 and 12 | 1 | Not estimable* |
| Adjacent tissue inflammation | 6 and 12 | 1 | Not estimable* |
| Pathologic radiolucency | 6 | 1 | Not estimable* |
| 12 | 1 | 0.14 (0.01, 2.66) | |
| Pathologicroot resorption | 6 | 1 | Not estimable* |
| 12 | 1 | 0.14 (0.01, 2.66) | |
| Pulp canal obliteration | 6 | 1 | Not estimable* |
| 12 | 1 | 0.44 (0.15, 1.29) |
*due to lack of events
Abbreviations ‐ CI: confidence interval; MTA: mineral trioxide aggregate; CH: calcium hydroxyde; NaOCl; sodium hypochlorite
MTA + sodium hypochlorite (NaOCl) versus calcium hydroxide + NaOCl
One trial, which randomised 62 teeth, assessed MTA + NaOCl versus calcium hydroxide + NaOCl based on clinical failure, radiological failure, overall failure, pain, soft tissue pathology, pathological mobility, adjacent tissue pathology, pathological radiolucency, pathological root resorption and pulp canal obliteration (Akcay 2014). There were no statistically significant differences for any outcome or time point (Table 5).
| Outcome | Time point (months) | No. of studies | Risk ratio (95% CI) |
| Clinical failure | 6 and 12 | 1 | Not estimable* |
| Radiological failure | 6 | 1 | Not estimable* |
| 12 | 1 | 0.20 (0.02, 1.61) | |
| Soft tissue pathology | 6 and 12 | 1 | Not estimable* |
| Pathologic mobility | 6 and 12 | 1 | Not estimable* |
| Adjacent tissue inflammation | 6 and 12 | 1 | Not estimable* |
| Pathologic radiolucency | 6 | 1 | Not estimable* |
| 12 | 1 | 0.14 (0.01, 2.66) | |
| Pathologic root resorption | 6 | 1 | Not estimable* |
| 12 | 1 | 0.33 (0.04, 3.03) | |
| Pulp canal obliteration | 6 | 1 | Not estimable* |
| 12 | 1 | 0.67 (0.27, 1.65) |
*due to lack of events
Abbreviations ‐ CI: confidence interval; MTA: mineral trioxide aggregate; NaOCl; sodium hypochlorite; CH: calcium hydroxyde.
MTA versus buffered glutaraldehyde
One trial, which randomised 60 teeth, assessed MTA versus buffered glutaraldehyde based on pain, soft tissue pathology, pathological mobility, pathological radiolucency, pathological root resorption and pulp canal obliteration (Goyal 2016). The results showed a statistically significant difference for pain, pathological mobility, pathological radiolucency and pathological root resorption at six months, favouring MTA over buffered glutaraldehyde (RR 0.06, 95% CI 0.00 to 0.98; RR 0.06, 95% CI 0.00 to 0.98; RR 0.03, 95% CI 0.00 to 0.55; RR 0.05, 95% CI 0.00 to 0.78; respectively). There were no statistically significant differences for other outcomes at any time point (Table 6).
| Outcome | Time point (months) | No. of studies | Risk ratio (95% CI) |
| Pain | 6 | 1 | 0.06 (0.00, 0.98) |
| Soft tissue pathology | 6 | 1 | 0.08 (0.00, 1.31) |
| Pathologic mobility | 6 | 1 | 0.06 (0.00, 0.98) |
| Pathologic radiolucency | 6 | 1 | 0.03 (0.00, 0.55) |
| Pathologic root resorption | 6 | 1 | 0.05 (0.00, 0.78) |
| Pulp canal obliteration | 6 | 1 | 0.11 (0.01, 1.98) |
*due to lack of events
Abbreviations ‐ CI: confidence interval; MTA: mineral trioxide aggregate.
MTA versus zinc oxide and eugenol (ZOE)
One trial, which randomised 50 teeth, assessed MTA versus ZOE based on clinical failure, radiological failure, overall failure, pain, pathological radiolucency, pathological root resorption, pulp canal obliteration and physiological root resorption (Erdem 2011). There was a statistically significant difference in radiological failure at 24 months in favour of MTA (RR 0.10, 95% CI 0.01 to 0.72). There were no other statistically significant differences (Table 7).
| Outcome | Time point (months) | No. of studies | Risk ratio (95% CI) |
| Clinical failure | 6 | 1 | Not estimable* |
| 12 | 1 | Not estimable* | |
| 24 | 1 | 0.20 (0.03 to 1.59) | |
| Radiological failure | 6 | 1 | 0.33 (0.01 to 7.81) |
| 12 | 1 | 0.20 (0.01 to 3.97) | |
| 24 | 1 | 0.10 (0.01 to 0.72) | |
| Overall failure | 6 | 1 | 0.33 (0.01 to 7.81) |
| 12 | 1 | 0.20 (0.01 to 3.97) | |
| 24 | 1 | 0.13 (0.02 to 0.93) | |
| Pain | 6 | 1 | Not estimable* |
| 12 | 1 | Not estimable* | |
| 24 | 1 | 3.00 (0.13 to 70.30) | |
| Pathological radiolucency | 6 | 1 | Not estimable* |
| 12 | 1 | Not estimable* | |
| 24 | 1 | 3.00 (0.13 to 70.30) | |
| Pathological root resorption | 6 | 1 | 0.33 (0.01 to 7.81) |
| 12 | 1 | 0.33 (0.01 to 7.81) | |
| 24 | 1 | 0.08 (0.00 to 1.30) | |
| Pulp canal obliteration | 6 | 1 | Not estimable* |
| 12 | 1 | 3.00 (0.13 to 70.30) | |
| 24 | 1 | 11.0 (0.64 to 188.96) | |
| Physiological root resorption | 6 | 1 | Not estimable* |
| 12 | 1 | Not estimable* | |
| 24 | 1 | 0.20 (0.01 to 3.97) |
*due to lack of events
Abbreviations ‐ CI: confidence interval; MTA: mineral trioxide aggregate; ZOE: zinc oxide and eugenol
MTA versus diode laser
One trial, which randomised 40 teeth, assessed MTA versus diode laser based on pain, soft tissue pathology, pathological mobility, pathological radiolucency, pathological root resorption, and premature tooth loss (Niranjani 2015). There was no premature tooth loss at any time point regardless of the intervention.There were no statistically significant differences for the other outcomes at six months (RR 0.33, 95% CI 0.01 to 7.72).
Diode laser + MTA versus formocresol + zinc oxide and eugenol (ZOE)
One trial, which randomised 52 teeth, assessed diode laser + MTA versus formocresol + ZOE based on clinical failure, radiological failure, overall failure, pathological radiolucency and pathological root resorption (Saltzman 2005). This trial did not assess the outcomes at a fixed time point but at a mean (± standard deviation) follow‐up of 2.3 ± 2.1, 5.2 ± 1.9, 9.5 ± 2.3 and 15.7 ± 3 months. There was no clinical failure in any of the participants regardless of the delay. There was no statistically significant difference for radiological failure, overall failure, pathological radiolucency or pathological root resorption at any follow‐up session (Table 8).
| Outcome | Time point (months) | No. of studies | Risk ratio (95% CI) |
| Clinical failure | 15.7 | 1 | Not estimable* |
| Radiological failure | 15.7 | 1 | 4.00 (0.48 to 33.42) |
| Overall failure | 15.7 | 1 | 2.00 (0.40 to 9.99) |
| Pathological radiolucency | 15.7 | 1 | 3.00 (0.33 to 26.99) |
| Pathological root resorption | 15.7 | 1 | 1.50 (0.27 to 8.25) |
*due to lack of events
Abbreviations ‐ CI: confidence interval; FC: formocresol; MTA: mineral trioxide aggregate; ZOE: zinc oxide and eugenol
Low‐level diode laser versus MTA
One trial, which randomised 40 teeth, assessed low‐level diode laser versus MTA based on overall failure at six and 12 months (Uloopi 2016). There was no statistically significant difference at any time point (RR 3.00, 95% CI 0.34 to 26.45; RR 4.00, 95% CI 0.49 to 32.72, respectively).
MTA versus enamel matrix derivative (EMD)
One trial, which randomised 70 teeth, assessed MTA versus EMD based on clinical failure, radiological failure, overall failure, pain, soft tissue pathology, pathological mobility, pathological radiolucency and pathological root resorption (Yildirim 2016). There was no statistically significant difference for any outcome at any time point (Table 9).
| Outcome | Time point (months) | No. of studies | Risk ratio (95% CI) |
| Clinical failure | 6, 12 and 24 | 1 | 0.14 (0.01, 2.67) |
| Radiological failure | 24 | 1 | 0.29 (0.06, 1.28) |
| Overall failure | 6, 12 and 24 | 1 | 0.14 (0.01, 2.67) |
| Pain | 6, 12 and 24 | 1 | 0.33 (0.01, 7.91) |
| Soft tissue pathology | 6, 12 and 24 | 1 | 0.20 (0.01, 4.02) |
| Pathologic mobility | 6, 12 and 24 | 1 | 0.20 (0.01, 4.02) |
| Pathologic radiolucency | 24 | 1 | 0.40 (0.08, 1.93) |
| Pathologic root resorption | 24 | 1 | 0.20 (0.01, 4.02) |
Abbreviations ‐ CI: confidence interval; MTA: mineral trioxide aggregate; EMD: enamel matrix derivative
Biodentine versus MTA
Clinical failure
At six months, data were extractable from four RCTs totaling 234 teeth. In one trial, there was no clinical failure in any of the participants regardless of the intervention. For the remaining trials, the pooled results showed no statistically significant difference (RR 1.72, 95% CI 0.42 to 6.99). At 12 months, data were extractable from two RCTs totaling 144 teeth. The pooled results showed no statistically significant difference (RR 0.75, 95% CI 0.16 to 3.62; Analysis 7.1).
Radiological failure
At six months, data were extractable from four RCTs totaling 234 teeth. In one trial, there was no clinical failure in any of the participants regardless of the intervention. For the remaining trials, the pooled results showed no statistically significant difference (RR 2.40, 95% CI 0.65 to 8.84). At 12 months, data were extractable from two RCTs totaling 144 teeth. The pooled results showed no statistically significant difference (RR 1.08, 95% CI 0.22 to 5.27; Analysis 7.2).
Pain
At six months, data were extractable from three RCTs totaling 180 teeth. In two trials, there was no pain in any of the participants regardless of the intervention. For the remaining trial, the results showed no statistically significant difference (RR 5.00, 95% CI 0.26 to 98.00; Analysis 7.3). At 12 months, one trial, which randomised 90 teeth, assessed pain. There was no pain in any of the participants regardless of the intervention.
Soft tissue pathology
At six months, data were extractable from three RCTs totaling 180 teeth. In two trials, there was no soft tissue pathology in any of the participants regardless of the intervention. For the remaining trial, the results showed no statistically significant difference (RR 5.00, 95% CI 0.26 to 98.00; Analysis 7.4). At 12 months, one trial, which randomised 90 teeth, assessed soft tissue pathology. There was no soft tissue pathology in any of the participants regardless of the intervention.
Adjacent tissue inflammation
One trial, which randomised 90 teeth, assessed adjacent tissue inflammation. There was no statistically significant difference at six (RR 0.50, 95% CI 0.05 to 5.32) and 12 months (R 0.33, 95% CI 0.04 to 3.08).
Pathological mobility
At six months, data were extractable from three RCTs totaling 180 teeth. In two trials, there was no pathological mobility in any of the participants regardless of the intervention. For the remaining trial, the results showed no statistically significant difference (RR 5.00, 95% CI 0.26 to 98.00; Analysis 7.5). At 12 months, one trial, which randomised 90 teeth, assessed pathological mobility. There was no pathological mobility in any of the participants regardless of the intervention.
Pathological radiolucency
Data were extractable from two RCTs totaling 144 teeth. At six months, in one trial, there was no pathological radiolucency in any of the participants regardless of the intervention. For the remaining trial, the results showed no statistically significant evidence (RR 3.46, 95% CI 0.15 to 81.36). At 12 months, the pooled results showed no statistically significant evidence (RR 1.09, 95% CI 0.19 to 6.27; Analysis 7.6).
Pathological root resorption
Data were extractable from two RCTs totaling 144 teeth. At six months, in one trial, there was no pathological radiolucency in any of the participants regardless of the intervention. For the remaining trial, the results showed no statistically significant evidence (RR 2.32, 95% CI 0.22 to 24.09). At 12 months, the pooled results showed no statistically significant evidence (RR 1.12, 95% CI 0.30 to 4.19; Analysis 7.7).
Pulp canal obliteration
One trial, which randomised 54 teeth, assessed pulp canal obliteration (Rajasekharan 2017). There was a statistically significant difference at six (RR 5.22, 95% CI 1.24 to 21.94) and 12 months (RR 2.44, 95% CI 1.43 to 4.14) in favour of MTA.
Dentin bridge formation
One trial, which randomised 54 teeth, assessed pulp canal obliteration (Rajasekharan 2017). There was no statistically significant differences at six (RR 0.16, 95% CI 0.01 to 3.04) and 12 months (RR 1.28, 95% CI 0.65 to 2.49).
One additional registered trial assessed clinical success (no abscess or any swelling related to the tooth, no fistula or other pathology, no pathological mobility, no post‐operative pain, no pain on palpation or percussion), radiographic success (no root resorption (internal or external), no furcation involvement or periapical radiolucency, no loss of lamina dura, presence of normal appearance of periodontal ligament space) at 36 months (NCT02298504).
Propolis versus MTA
One trial, which randomised 50 teeth, assessed propolis versus MTA based on clinical failure and radiological failure (Kusum 2015). There was no statistically significant differences for any outcomes at six months (clinical failure: RR 3.00, 95% CI 0.13 to 70.30; radiological failure: RR 3.50, 95% CI 0.80 to 15.23).
Aloe vera versus MTA
One trial, which randomised 60 teeth, assessed Aloe vera versus MTA based on clinical failure, radiological failure and overall failure (Kalra 2017). For clinical and overall failures, there was a statistically significant difference at six (RR 51.00, 95% CI 3.25 to 801.15) and 12 months (RR 53.00, 95% CI 3.38 to 831.71) in favour of MTA. For radiological failure, there was a statistically significant difference at six and 12 months (RR 28.00, 95% CI 4.07 to 192.79) in favour of MTA.
Tempophore versus MTA
One trial which randomised 56 teeth, assessed Tempophore versus MTA based on clinical failure, radiological failure, pathological radiolucency, pathological root resorption, pulp canal obliteration and dentin bridge formation (Rajasekharan 2017). There were no statistically significant differences for all outcomes at any time points (Table 10).
| Outcome | Time point (months) | No. of studies | Risk ratio (95% CI) |
| Clinical failure | 6 and 12 | 1 | 3.21 (0.14, 75.68) |
| Radiological failure | 6 | 1 | 9.64 (0.54, 171.09) |
| 12 | 1 | 2.69 (0.57, 12.70) | |
| Pathological radiolucency | 6 | 1 | 3.21 (0.14, 75.68) |
| 12 | 1 | 2.15 (0.43, 10.79) | |
| Pathological root resorption | 6 | 1 | 6.44 (0.83, 50.11) |
| 12 | 1 | 4.30 (1.00, 18.47) | |
| Pulp canal obliteration | 6 | 1 | 3.76 (0.85, 16.54) |
| 12 | 1 | 1.61 (0.78, 3.33) | |
| Dentine bridge formation | 6 | 1 | 0.15 (0.01, 2.83) |
| 12 | 1 | 0.07 (0.00, 1.19) |
Abbreviation: CI: confidence interval
MTA versus MTA + sodium hypochlorite (NaOCl)
One trial, which randomised 62 teeth, assessed MTA versus MTA+NaOCl based on clinical failure, radiological failure, overall failure, pain, soft tissue pathology, pathological mobility, adjacent tissue pathology, pathological radiolucency, pathological root resorption and pulp canal obliteration (Akcay 2014). There were no statistically significant differences for any outcome or time point (Table 11).
| Outcome | Time point (months) | No. of studies | Risk ratio (95% CI) |
| Clinical failure | 6 and 12 | 1 | Not estimable* |
| Radiological failure | 6 and 12 | 1 | 0.33 (0.01, 7.88) |
| Soft tissue pathology | 6 and 12 | 1 | Not estimable* |
| Pathologic mobility | 6 and 12 | 1 | Not estimable* |
| Adjacent tissue inflammation | 6 and 12 | 1 | Not estimable* |
| Pathologic radiolucency | 6 and 12 | 1 | Not estimable* |
| Pathologic root resorption | 6 and 12 | 1 | 0.33 (0.01, 7.88) |
| Pulp canal obliteration | 6 | 1 | Not estimable* |
| 12 | 1 | 0.67 (0.21, 2.13) |
* due to lack of events
Abbreviations ‐ CI: confidence interval; MTA: mineral trioxide aggregate; NaOCl; sodium hypochlorite.
ProRoot MTA versus OrthoMTA
One trial, which randomised 94 teeth, assessed ProRoot MTA versus OrthoMTA based on clinical failure, radiological failure, pain, soft tissue pathology, pathological mobility, pathological radiolucency and pathological root resorption (Kang 2015). There were no statistically significant differences for any outcome or time point (Table 12).
| Outcome | Time point (months) | No. of studies | Risk ratio (95% CI) |
| Clinical failure | 6 | 1 | Not estimable* |
| 12 | 1 | 0.33 (0.01, 7.98) | |
| Radiological failure | 6 | 1 | 1.00 (0.06, 15.52) |
| 12 | 1 | 0.50 (0.05, 5.33) | |
| Pain | 6 and 12 | 1 | Not estimable* |
| Soft tissue pathology | 6 | 1 | Not estimable* |
| 12 | 1 | 0.33 (0.01, 7.98) | |
| Pathologic mobility | 6 and 12 | 1 | Not estimable* |
| Pathologic radiolucency | 6 | 1 | 0.33 (0.01, 7.98) |
| 12 | 1 | 0.20 (0.01, 4.06) | |
| Pathologic root resorption | 6 | 1 | 3.00 (0.13, 71.82) |
| 12 | 1 | 1.00 (0.06, 15.52) |
*due to lack of events
Abbreviation: CI: confidence interval.
ProRoot MTA versus RetroMTA
One trial, which randomised 96 teeth, assessed ProRoot MTA versus RetroMTA based on clinical failure, radiological failure, pain, soft tissue pathology, pathological mobility, pathological radiolucency and pathological root resorption (Kang 2015). There were no statistically significant differences for any outcome or time point (Table 13).
| Outcome | Time point (months) | No. of studies | Risk ratio (95% CI) |
| Clinical failure | 6 and 12 | 1 | Not estimable* |
| Radiological failure | 6 and 12 | 1 | 0.35 (0.04, 3.22) |
| Pain | 6 and 12 | 1 | Not estimable* |
| Soft tissue pathology | 6 and 12 | 1 | Not estimable* |
| Pathologic mobility | 6 and 12 | 1 | Not estimable* |
| Pathologic radiolucency | 6 and 12 | 1 | 0.35 (0.01, 8.32) |
| Pathologic root resorption | 6 and 12 | 1 | 0.35 (0.04, 3.22) |
*due to lack of events
Abbreviation: CI: confidence interval.
OrthoMTA versus RetroMTA
One trial, which randomised 96 teeth, assessed OrthoMTA versus RetroMTA based on clinical failure, radiological failure, pain, soft tissue pathology, pathological mobility, pathological radiolucency and pathological root resorption (Kang 2015). There were no statistically significant differences for any outcome or time point (Table 14).
| Outcome | Time point (months) | No. of studies | Risk ratio (95% CI) |
| Clinical failure | 6 | 1 | Not estimable* |
| 12 | 1 | 3.13 (0.13, 74.85) | |
| Radiological failure | 6 | 1 | 0.35 (0.04, 3.22) |
| 12 | 1 | 0.70 (0.12, 3.98) | |
| Pain | 6 and 12 | 1 | Not estimable* |
| Soft tissue pathology | 6 | 1 | Not estimable* |
| 12 | 1 | 3.13 (0.13, 74.85) | |
| Pathologic mobility | 6 and 12 | 1 | Not estimable* |
| Pathologic radiolucency | 6 | 1 | 1.04 (0.07, 16.19) |
| 12 | 1 | 2.09 (0.20, 22.24) | |
| Pathologic root resorption | 6 | 1 | 0.15 (0.01, 2.81) |
| 12 | 1 | 0.35 (0.04, 3.22) |
*due to lack of events
Abbreviation: CI: confidence interval.
Calcium hydroxide versus formocresol
Clinical failure
At six months, data were extractable from six RCTs totaling 332 teeth. In two of the trials, there was no clinical failure in any of the participants regardless of the intervention. From the four remaining trials, the pooled results showed a larger risk of clinical failure with calcium hydroxide compared with formocresol. The pooled RR was 1.98 (95% CI 1.17 to 3.37). The statistical heterogeneity among included trials was substantial (I² = 57%). Results were similar at 12 months (RR 1.87, 95% CI 1.22 to 2.89). At 24 months, data were extractable from three RCTs totaling 150 teeth. The pooled results showed no statistically significant difference (RR 2.18, 95% CI 0.78 to 6.11; Analysis 8.1).
One additional trial, which randomised 76 teeth, did not assess clinical failure at a fixed time point but at an interval follow‐up of zero to six, seven to 12 and 13 to 24 months (Zurn 2008). Between zero and six months, the RR was 1.00 (95% CI 0.06 to 15.41). Results were similar between seven and 12 months and between 13 and 24 months.
Radiological failure
At six months, data were extractable from four RCTs totaling 154 teeth. In one of the trials, there was no radiological failure in any of the participants regardless of the intervention. From the three remaining trials, the pooled results showed a larger risk of radiological failure with calcium hydroxide compared with formocresol (RR 15.48, 95% CI 3.86 to 62.06) with no evidence of statistical heterogeneity among included trials (I² = 0%). Results at 12 months were RR 1.86 (95% CI 1.42 to 2.44) with six trials providing data (332 teeth randomised) and with substantial statistical heterogeneity (I² = 89%), and at 24 months the RR was 3.63 (95% CI 1.73 to 7.61) with three trials providing data (150 teeth randomised) and with no evidence of statistical heterogeneity (I² = 0%) (Analysis 8.2).
The trial by Zurn 2008 did not assess radiological failure at a fixed time point but at an interval follow‐up of zero to six, seven to 12 and 13 to 24 months. Between zero and six months, the RR was 1.00 (95% CI 0.06 to 15.41). Results were similar between seven and 12 months. Between 13 and 24 months, the RR was 9 (95% CI 1.20 to 67.60).
Overall failure
At 12 months, data were extractable from two RCTs totaling 120 teeth. The pooled results showed no statistically significant difference in overall failure with calcium hydroxide compared with formocresol. The pooled RR was 2.41 (95% CI 0.80 to 7.21). Results were similar at 24 months, although the difference was statistically significant and in favour of formocresol (RR 2.93, 95% CI 1.35 to 6.34), with no evidence of statistical heterogeneity (I² = 0%; Analysis 8.3).
One additional trial did not assess overall failure at a fixed time point but at an interval follow‐up of zero to six, seven to 12 and 13 to 24 months (Zurn 2008). Between zero and six months, the RR was 1.00 (95% CI 0.15 to 6.74). Between seven and 12 months, the RR was 4.50 (95% CI 1.04 to 19.47). Results were similar between 13 and 24 months.
Pain
At six months, data were extractable from four RCTs totaling 276 teeth. In three of the trials, there was no pain in any of the participants regardless of the intervention. The results for the remaining trial showed no statistically significant difference in pain with calcium hydroxide compared with formocresol (RR 3.18, 95% CI 0.35 to 29.08). At 12 months, the results were statistically significant (RR 6.30, 95% CI 1.15 to 34.40), in favour of formocresol with no evidence of statistical heterogeneity (I² = 0%; Analysis 8.4).
Soft tissue pathology
At six months, data were extractable from five RCTs totaling 306 teeth. In three of the four trials, there was no soft tissue pathology in any of the participants regardless of the intervention. From the two remaining trials, the pooled results showed no statistical difference in soft tissue pathology with calcium hydroxide compared with formocresol. The pooled RR was 5.14 (95% CI 0.63 to 42.25). At 12 months, the results were statistically significant (RR 6.77, 95% CI 1.23 to 37.10) in favour of formocresol with three trials providing data and with no evidence of statistical heterogeneity (I² = 0%). However, this was not statistically significant at 24 months, with only two trials providing data (Analysis 8.5).
One additional trial, which randomised 76 teeth, did not assess soft tissue pathology at a fixed time point but at an interval follow‐up of zero to six, seven to 12 and 13 to 24 months (Zurn 2008). Between zero and six months, the RR was 1.00 (95% CI 0.06 to 15.41). Results were similar between seven and 12 months and between 13 and 24 months.
Pathological mobility
At six months, data were extractable from four RCTs totaling 238 teeth. In three of the trials, there was no pathological mobility in any of the participants regardless of the intervention. From the remaining trial, the results showed no statistically significant difference in pathological mobility between calcium hydroxide and formocresol (RR 1.21, 95% CI 0.18 to 8.19). At 12 months, results were similar with two of the four trials providing data (RR 1.14, 95% CI 0.40 to 3.31). At 24 months, results were similar with one of two trials providing data (124 teeth randomised) (RR 9.00, 95% CI 0.53 to 153.79; Analysis 8.6).
Secondary caries at the margin (clinically)
One trial, which randomised 84 teeth, assessed secondary caries at the margin (Waterhouse 2000). At six months, the RR was 0.17 (95% CI 0.01 to 3.23). Results were similar at 12 months.
Defective restoration (clinically)
One trial, which randomised 84 teeth, assessed defective restoration (Waterhouse 2000). At six months, there was no statistically significant difference in the number of defective restorations between treatment groups (RR 0.40, 95% CI 0.02 to 9.59); at 12 months, the RR was 1.21 (95% CI 0.08 to 18.72).
Pathological radiolucency
At six months, data were extractable from three RCTs totaling 98 teeth. For one trial, there was no pathological radiolucency in any of the participants regardless of the intervention. For the remaining trials, the pooled results showed no statistically significant difference in pathological radiolucency for calcium hydroxide compared with formocresol (RR 3.78, 95% CI 0.64 to 22.17). Results were similar at 12 months with four trials providing data (276 teeth randomised) (RR 1.90, 95% CI 0.67 to 5.40), and at 24 months with two trials providing data (124 teeth randomised) (RR 3.24, 95% CI 0.79 to 13.28; Analysis 8.7).
One additional trial, which randomised 76 teeth, did not assess pathological radiolucency at a fixed time point but at an interval follow‐up of zero to six, seven to 12 and 13 to 24 months (Zurn 2008). Between zero and six months, the RR was 1.00 (95% CI 0.15 to 6.74). Between seven and 12 months, the RR was 4.50 (95% CI 1.04 to 19.47). Results were similar between 13 and 24 months.
Pathological root resorption
At six months, data were extractable from four RCTs totaling 154 teeth. In one of the trials, there was no pathological root resorption in any of the participants regardless of the intervention. From the remaining trials, the pooled results showed a larger risk of pathological root resorption with calcium hydroxide compared with formocresol (RR 11.87, 95% CI 2.33 to 60.40), with no evidence of statistical heterogeneity among trials (I² = 0%). Results were similar at 12 months, with five of six trials providing data (332 teeth randomised) (RR 6.25, 95% CI 2.04 to 19.14), and at 24 months, with three trials providing data (150 teeth randomised) (RR 4.59, 95% CI 1.33 to 15.81; Analysis 8.8).
One additional trial, which randomised 76 teeth, did not assess pathological root resorption at a fixed time point but at an interval follow‐up of zero to six, seven to 12 and 13 to 24 months (Zurn 2008). Between zero and six months, the RR was 1.00 (95% CI 0.31 to 3.17). Results were similar between seven and 12 months and between 13 and 24 months.
Pulp canal obliteration
At six months, data were extractable from two trials totaling 56 teeth. There was no statistically significant difference (RR 4.00, 95% CI 0.47 to 33.75). At 12 months, data were extractable from three RCTs totaling 140 teeth. The pooled results showed no statistically significant difference in pulp canal obliteration with calcium hydroxide compared with formocresol (RR 2.68, 95% CI 0.91 to 7.95; Analysis 8.9).
One additional trial, which randomised 76 teeth, did not assess pulp canal obliteration at a fixed time point but at an interval follow‐up of zero to six, seven to 12 and 13 to 24 months. Between zero and six months, the RR was 1.00 (95% CI 0.42 to 2.39) (Zurn 2008). Results were similar between seven and 12 months. Between 13 and 24 months, the RR was 1.88 (95% CI 1.29 to 2.72).
Dentin bridge formation
Data were extractable from two RCTs totaling 60 teeth. There was a statistically significant difference in favour of calcium hydroxide at six (RR 13.00, 95% CI 1.81 to 93.60) and 12 months (RR 14.00, 95% CI 1.95 to 100.26; Analysis 8.10).
Physiological root resorption
One trial, which randomised 84 teeth, assessed physiological root resorption at 12 months (Waterhouse 2000). There was no statistically significant difference between groups (RR 0.40, 95% CI 0.12 to 1.39).
Secondary caries (radiographically)
One trial, which randomised 84 teeth, assessed secondary caries at 12 months (Waterhouse 2000). There was no statistically significant difference between groups (RR 3.62, 95% CI 0.15 to 86.28).
Calcium hydroxide versus ferric sulphate
Clinical failure
At six, 12 and 24 months, data were extractable from two RCTs totaling 122 teeth. At six months, one trial showed no cases of clinical failure in either treatment group. For the second trial, the results showed no statistically difference in clinical failure with calcium hydroxide compared with ferric sulphate (RR 3.40, 95% CI 0.14 to 81.38). At 12 months, the pooled results showed no statistically significant difference in clinical failure with calcium hydroxide compared with ferric sulphate (RR 3.41, 95% CI 0.37 to 31.61). Results were similar at 24 months (RR 3.44, 95% CI 0.90 to 13.18; Analysis 9.1).
Radiological failure
At 12 and 24 months, data were extractable from two RCTs totaling 122 teeth. At 12 months, the pooled results showed no statistically significant difference in radiological failure with calcium hydroxide compared with ferric sulphate. The pooled RR was 1.28 (95% CI 0.53 to 3.13). The direction of effect was the same at 24 months, although the difference was statistically significant (RR 1.97, 95% CI 1.04 to 3.75) in favour of ferric sulphate, and there was no evidence of statistical heterogeneity among included trials (I² = 0%; Analysis 9.2).
Overall failure
At 12 and 24 months, data were extractable from two RCTs totaling 122 teeth. At 12 months, the pooled results showed no statistically significant difference in overall failure with calcium hydroxide compared with ferric sulphate (RR 1.28, 95% CI 0.53 to 3.13). The statistical heterogeneity among included trials was substantial (I² = 54%). At 24 months, the difference was statistically significant (RR 1.97, 95% CI 1.04 to 3.75) in favour of ferric sulphate, with no evidence of statistical heterogeneity among included trials (I² = 0%; Analysis 9.3).
Pathological root resorption
At 12 and 24 months, data were extractable from two RCTs totaling 122 teeth. At 12 months, one of the two trials found no pathological root resorption in any of the participants regardless of the intervention. In the second trial, the results showed no statistically significant difference in pathological root resorption with calcium hydroxide compared with ferric sulphate (RR 0.57, 95% CI 0.05 to 6.05). Results were similar at 24 months, with the two trials providing data (RR 2.29, 95% CI 0.60 to 8.66; Analysis 9.4).
Pulp canal obliteration
One trial, which randomised 28 teeth, assessed pulp canal obliteration (Sonmez 2008). At six and 12 months, there was no pulp canal obliteration in any of the participants regardless of the intervention. At 24 months, the RR was 0.38 (95% CI 0.05 to 3.26).
Calcium hydroxide versus Portland cement
One trial, which randomised 30 teeth, assessed calcium hydroxide versus Portland cement based on clinical failure, radiological failure, soft tissue pathology, pathological mobility, pathological radiolucency, pathological root resorption, and dentin bridge formation (Oliveira 2013a). There were statistically significant differences for radiological failure, pathological radiolucency and pathological root resorption at 12 (RR 17.00, 95% CI 1.07 to 270.41) and 24 months (RR 21.00, 95% CI 1.34 to 328.86). There were no statistically significant differences for other outcomes (Table 15).
| Outcome | Time point (months) | No. of studies | Risk ratio (95% CI) |
| Clinical failure | 6 | 1 | 5.00 (0.26, 96.13) |
| 12 and 24 | 1 | 13.00 (0.80, 212.02) | |
| Radiological failure | 6 | 1 | 13.00 (0.80, 212.02) |
| 12 | 1 | 17.00 (1.07 to 270.41) | |
| 24 | 1 | 21.00 (1.34 to 328.86) | |
| Soft tissue pathology | 6 | 1 | 5.00 (0.26, 96.13) |
| 12 and 24 | 1 | 13.00 (0.80, 212.02) | |
| Pathologic mobility | 6 | 1 | 5.00 (0.26, 96.13) |
| 12 and 24 | 1 | 13.00 (0.80, 212.02) | |
| Adjacent tissue inflammation | 6, 12 and 24 | 1 | Not estimable * |
| Pathologic radiolucency | 6 | 1 | 13.00 (0.80, 212.02) |
| 12 | 1 | 17.00 (1.07 to 270.41) | |
| 24 | 1 | 21.00 (1.34 to 328.86) | |
| Pathologic root resorption | 6 | 1 | 13.00 (0.80, 212.02) |
| 12 | 1 | 17.00 (1.07 to 270.41) | |
| 24 | 1 | 21.00 (1.34 to 328.86) | |
| Dentine bridge formation | 6, 12 and 24 | 1 | 0.50 (0.11 to 2.33) |
*due to lack of events
Abbreviations ‐ CI: confidence interval; CH: calcium hydroxide; PC: Portland cement.
Calcium hydroxide versus MTA + sodium hypochlorite (NaOCl)
One trial, which randomised 62 teeth, assessed MTA+NaOCl versus calcium hydroxide + NaOCl based on clinical failure, radiological failure, overall failure, pain, soft tissue pathology, pathological mobility, adjacent tissue pathology, pathological radiolucency, pathological root resorption and pulp canal obliteration (Akcay 2014). The results showed statistically significant differences for radiological failure and pathological root resorption at 12 months (RR 8.00, 95% CI 1.06 to 60.21; RR 17.00, 95% CI 1.02 to 282.30, respectively). There were no statistically significant differences for other outcomes at any time point (Table 16).
| Outcome | Time point (months) | No. of studies | Risk ratio (95% CI) |
| Clinical failure | 6 | 1 | Not estimable* |
| 12 | 1 | 3.00 (0.13, 70.92) | |
| Radiological failure | 6 | 1 | 5.00 (0.62, 40.36) |
| 12 | 1 | 8.00 (1.06, 60.21) | |
| Soft tissue pathology | 6 | 1 | Not estimable* |
| 12 | 1 | 3.00 (0.13, 70.92) | |
| Pathologic mobility | 6 and 12 | 1 | Not estimable* |
| Adjacent tissue inflammation | 6 and 12 | 1 | Not estimable* |
| Pathologic radiolucency | 6 | 1 | Not estimable* |
| 12 | 1 | 15.00 (0.89, 251.77) | |
| Pathologic root resorption | 6 | 1 | Not estimable* |
| 12 | 17.00 (1.02, 282.30) | ||
| Pulp canal obliteration | 6 | 1 | Not estimable* |
| 12 | 1 | 1.33 (0.52, 3.39) |
*due to lack of events
Abbreviations ‐ CI: confidence interval; CH: calcium hydroxyde; MTA: mineral trioxide aggregate; NaOCl; sodium hypochlorite.
Erbium:yttrium‐aluminium garnet (Er:YAG) laser versus calcium hydroxide
One trial, which randomised 91 teeth, assessed Er:YAG laser versus calcium hydroxide based on clinical failure, radiological failure, overall failure, pain, soft tissue pathology, pathological mobility, pathological radiolucency and pathological root resorption (Huth 2005). Statistically significant differences were shown at 24 months with regard to radiological failure (RR 0.31 (95% CI 0.11 to 0.90) and overall failure (RR 0.31 (95% CI 0.11 to 0.90), in favour of Er:YAG laser. There were no statistically significant differences for any other outcome or time point (Table 17).
| Outcome | Time point (months) | No. of studies | Risk ratio (95% CI) |
| Clinical failure | 6 | 1 | 0.31 (0.01 to 7.48) |
| 12 | 1 | 0.94 (0.60 to 14.52) | |
| 24 | 1 | 0.62 (0.11 to 3.56) | |
| Radiological failure | 12 | 1 | 0.56 (0.14 to 2.21) |
| 24 | 1 | 0.31 (0.11 to 0.90) | |
| Overall failure | 12 | 1 | 0.56 (0.14 to 2.21) |
| 24 | 1 | 0.31 (0.11 to 0.90) | |
| Pain | 6, 12 and 24 | 1 | Not estimable* |
| Soft tissue pathology | 6, 12 and 24 | 1 | Not estimable* |
| Pathological mobility | 6, 12 and 24 | 1 | Not estimable* |
| Pathological radiolucency | 12 | 1 | 0.31 (0.01 to 7.48) |
| 24 | 1 | 0.62 (0.11 to 3.56) | |
| Pathological root resorption | 12 | 1 | 0.94 (0.60 to 14.52) |
| 24 | 1 | 0.62 (0.11 to 3.56) |
*due to lack of events
Abbreviations ‐ CI: confidence interval; Er:YAG: erbium:yttrium‐aluminium garnet; CH: calcium hydroxide.
Calcium hydroxide/iodoform versus calcium hydroxide
One trial, which randomised 65 teeth, assessed calcium hydroxide/iodoform versus calcium hydroxide based on clinical failure, radiological failure, pain, soft tissue pathology, pathological radiolucency and pathological root resorption (Alaçam 2009). There were no statistically significant differences for any outcome or time point (Table 18).
| Outcome | Time point (months) | No. of studies | Risk ratio (95% CI) |
| Clinical failure | 6 | 1 | 1.41 (0.77 to 2.58) |
| 12 | 1 | 1.13 (0.82 to 1.54) | |
| Radiological failure | 6 | 1 | 1.33 (0.89 to 2.00) |
| 12 | 1 | 1.17 (0.87 to 1.59) | |
| Pain | 6 | 1 | 1.72 (0.45 to 6.61) |
| 12 | 1 | 1.03 (0.33 to 3.23) | |
| Soft tissue pathology | 6 | 1 | 1.55 (0.28 to 8.65) |
| 12 | 1 | 1.03 (0.22 to 4.74) | |
| Pathological radiolucency | 6 and 12 | 1 | 5.15 (0.26 to 103.31) |
| Pathological root resorption | 6 | 1 | 1.72 (0.45 to 6.61) |
| 12 | 1 | 1.29 (0.38 to 4.37) |
CI: confidence interval; CH: calcium hydroxide.
Low‐level laser therapy (LLLT) versus calcium hydroxide
One trial, which randomised 30 teeth, assessed LLLT versus calcium hydroxide based on clinical failure, radiological failure, pain, soft tissue pathology, adjacent tissue inflammation, pathologic mobility, pathologic radiolucency, pathologic root resorption, pulp canal obliteration, and dentin bridge formation at six and 12 months (Fernandes 2015). There was no clinical failure, pain, soft tissue pathology, adjacent tissue inflammation pathologic mobility and pathologic radiolucency in any of the participants regardless of the intervention. There were no statistically significant differences for radiological failure and pathologic root resorption at six and 12 months (RR 0.50, 95% CI 0.15 to 1.64), pulp canal obliteration at six (RR 0.50, 95% CI 0.05 to 4.94) and 12 months (RR 2.50, 95% CI 0.57 to 10.93), and dentin bridge formation at six (RR 0.11, 95% CI 0.01 to 1.90) and 12 months (RR 0.09, 95% CI 0.01 to 1.51).
Low‐level laser therapy (LLLT) + calcium hydroxide versus calcium hydroxide
One trial, which randomised 30 teeth, assessed LLLT + calcium hydroxide versus calcium hydroxide based on clinical failure, radiological failure, pain, soft tissue pathology, adjacent tissue inflammation, pathologic mobility, pathologic radiolucency, pathologic root resorption, pulp canal obliteration, and dentin bridge formation at six and 12 months (Fernandes 2015). There was no clinical failure, pain, soft tissue pathology, adjacent tissue inflammation pathologic mobility and pathologic radiolucency in any of the participants regardless of the intervention. There were no statistically significant differences for radiological failure and pathologic root resorption at six (RR 0.33, 95% CI 0.08 to 1.39) and 12 months (RR 0.50, 95% CI 0.15 to 1.64), pulp canal obliteration at six and 12 months (RR 0.50, 95% CI 0.05 to 4.94), and dentin bridge formation at six (RR 1.75, 95% CI 0.64 to 4.75) and 12 months (RR 1.40, 95% CI 0.57 to 3.43).
Low‐level laser therapy (LLLT) versus LLLT + calcium hydroxide
One trial, which randomised 30 teeth, assessed LLLT versus LLLT + calcium hydroxide based on clinical failure, radiological failure, pain, soft tissue pathology, adjacent tissue inflammation, pathologic mobility, pathologic radiolucency, pathologic root resorption, pulp canal obliteration, and dentin bridge formation at six and 12 months (Fernandes 2015). There was no clinical failure, pain, soft tissue pathology, adjacent tissue inflammation pathologic mobility and pathologic radiolucency in any of the participants regardless of the intervention. There were no statistically significant differences for radiological failure and pathologic root resorption at six (RR 1.50, 95% CI 0.29 to 7.73) and 12 months (RR 1.00, 95% CI 0.24 to 4.18), pulp canal obliteration at six (RR 1.00, 95% CI 0.07 to 14.55) and 12 months (RR 5.00, 95% CI 0.66 to 37.85), and dentin bridge formation at six and 12 months (RR 0.07, 95% CI 0.00 to 1.07).
Calcium hydroxide + sodium hypochlorite (NaOCl) versus calcium hydroxide
One trial, which randomised 62 teeth, assessed calcium hydroxide + NaOCl versus calcium hydroxide based on clinical failure, radiological failure, overall failure, pain, soft tissue pathology, pathological mobility, adjacent tissue pathology, pathological radiolucency, pathological root resorption and pulp canal obliteration (Akcay 2014). There were no statistically significant differences for any outcome or time point (Table 19).
| Outcome | Time point (months) | No. of studies | Risk ratio (95% CI) |
| Clinical failure | 6 | 1 | Not estimable* |
| 12 | 1 | 0.33 (0.01, 7.88) | |
| Radiological failure | 6 | 1 | 0.09 (0.01, 1.58) |
| 12 | 1 | 0.63 (0.23, 1.70) | |
| Soft tissue pathology | 6 | 1 | Not estimable* |
| 12 | 1 | 0.33 (0.01, 7.88) | |
| Pathologic mobility | 6 and 12 | 1 | Not estimable* |
| Adjacent tissue inflammation | 6 and 12 | 1 | Not estimable* |
| Pathologic radiolucency | 6 | 1 | Not estimable* |
| 12 | 1 | 0.43 (0.12, 1.51) | |
| Pathologic root resorption | 6 | 1 | Not estimable* |
| 12 | 0.38 (0.11, 1.28) | ||
| Pulp canal obliteration | 6 | 1 | Not estimable* |
| 12 | 1 | 1.13 (0.50, 2.53) |
*due to lack of events
Abbreviations ‐ CI: confidence interval; CH: calcium hydroxide; NaOCl: sodium hypochlorite.
Biodentine versus calcium hydroxide
One trial, which randomised 62 teeth, assessed calcium hydroxide + NaOCl versus calcium hydroxide based on clinical failure, radiological failure, pain, soft tissue pathology, defective restoration (clinically), secondary caries at the margin (clinically), pathological radiolucency, and pathological root resorption (Grewal 2016). There were no radiological failures, no soft tissue pathology and no secondary caries at the margin at six and 12 months. There were no statistically significant differences for clinical failure and pain at six and 12 months (RR 0.33, 95% CI 0.01 to 7.72), defective restoration at 12 months (RR 1.00, 95% CI 0.39 to 2.58), and pathological root resorption at six (RR 0.33, 95% CI 0.01 to 7.72) and 12 months (RR 0.20, 95% CI 0.01 to 3.92).
Ferric sulphate versus formocresol
Clinical failure
At six months, data were extractable from six RCTs totaling 394 teeth. In five RCTs, there was no clinical failure in any of the participants regardless of the intervention. For the remaining trials, there was no statistically significant difference (RR 1.00, 95% CI 0.15 to 6.87). Results were similar at 12 months, with five trials providing data (RR 1.38, 95% CI 0.45 to 4.27). At 24 months, data were extractable from five RCTs totaling 258 teeth. The pooled results for the three trials showed no statistically significant difference in clinical failure (RR 0.83, 95% CI 0.40 to 1.70; Analysis 10.1).
One trial, which randomised 164 teeth, did not assess clinical failure at a fixed time point but at an interval follow‐up of three to 20 and 46 to 48 months (Ibricevic 2000). The RR was 1.00 (95% CI 0.02 to 49.04) at three to 20 months and RR 1.58 (95% CI 0.27 to 9.18) at 46 to 48 months.
Radiological failure
At six months, data were extractable from six RCTs totaling 294 teeth. In two trials, there was no radiological failure in any of the participants regardless of the intervention. From the remaining trials, the pooled results showed no statistically significant difference in clinical failure with ferric sulphate compared with formocresol (RR 0.79, 95% CI 0.32 to 1.92). Results were similar at 12 months, with six trials providing data (394 teeth randomised) (RR 1.33, 95% CI 0.73, 2.42), and at 24 months, with five trials providing data (258 teeth randomised) (RR 1.26, 95% CI 0.71 to 2.24; Analysis 10.2).
One trial, which randomised 164 teeth, did not assess radiological failure at a fixed time point but at an interval follow‐up of three to 20 and 46 to 48 months (Ibricevic 2000). The RR was 1.00 (95% CI 0.42 to 2.36) at three to 20 months. Results were similar at 46 to 48 months.
Overall failure
At six months, data were extractable from four RCTs totaling 184 teeth. In two trials, there was no overall failure in any of the participants regardless of the intervention. From the two remaining trials, the pooled results showed no statistically significant difference in clinical failure with ferric sulphate compared with formocresol (RR 0.53, 95% CI 0.12 to 2.37). Results were similar at 12 months, with four of five trials providing data (284 teeth randomised) (RR 1.16, 95% CI 0.51, 2.64), and at 24 months, with four trials providing data (228 teeth randomised) (RR 1.49, 95% CI 0.74 to 3.01; Analysis 10.3).
Two additional trials, which randomised 96 teeth (Fuks 1997) and 164 teeth (Ibricevic 2000), did not assess overall failure at a fixed time point but at an interval follow‐up of 24 to 35 months and 46 to 48 months, respectively. The RR was 0.44 (95% CI 0.13 to 1.45) for 24 to 35 months (Fuks 1997) and 1.33 (95% CI 0.44 to 4.03) for 46 to 48 months (Ibricevic 2000).
Pain
Data were extractable from four RCTs totaling 230 teeth. In three trials, no participant declared pain regardless of the intervention. For the remaining trial, there was no statistically significant difference at six, 12 (RR 0.33, 95% CI 0.01 to 7.58) and 24 months (RR 0.20, 95% CI 0.01 to 3.85; Analysis 10.4).
Soft tissue pathology
One trial, which randomised 30 teeth, assessed soft tissue pathology at six, 12 and 24 months (Ozmen 2017). There was no statistically significant evidence (RR 0.33, 95% CI 0.01 to 7.58).
Pathologic mobility
One trial, which randomised 30 teeth, assessed soft tissue pathology at six, 12 and 24 months (Ozmen 2017). There was no statistically significant evidence (RR 0.33, 95% CI 0.01 to 7.58).
Adjacent tissue inflammation
One trial, which randomised 50 teeth, assessed adjacent tissue inflammation (Fernández 2013). There was no adjacent tissue inflammation in any of the participants regardless of the intervention. At 12 and 24 months, there was no statistically significant difference (RR 5.00, 95% CI 0.25, 99.16).
Pathological radiolucency
At six months, two trials, which randomised 80 teeth, assessed pathological radiolucency (Fernández 2013, Ozmen 2017). There was no pathological radiolucency in any of the participants regardless of the intervention. At 12 months, data were extractable from four RCTs totaling 230 teeth. In two trials, there was no pathological radiolucency in any of the participants regardless of the intervention. From the remaining trials, the results showed no statistically significant difference in pathological radiolucency with ferric sulphate compared with formocresol (RR 1.80, 95% CI 0.40 to 8.17). Results were similar at 24 months (RR 2.20, 95% CI 0.51 to 9.50; Analysis 10.5).
Two additional trials, which randomised 96 (Fuks 1997) and 164 (Ibricevic 2000) teeth, did not assess pathological radiolucency at a fixed time point but at an interval follow‐up of six to 11, 12 to 23 and 24 to 35 months for Fuks 1997 and three to 20 and 46 to 48 months for Ibricevic 2000. In the two trials, there was no pathological radiolucency in any of the participants regardless of the intervention at the first delays. At 24 to 35 months, the RR was 0.44 (95% CI 0.08 to 2.49) (Fuks 1997) and at 46 to 48 months RR 2.86 (95% CI 0.30 to 26.90) (Ibricevic 2000).
Pathological root resorption
At six months, data were extractable from five RCTs totaling 314 teeth. In three trials, there was no pathological root resorption in any of the participants regardless of the intervention. For the remaining trials, the pooled results showed no statistically significant evidence (RR 0.67, 95% CI 0.12 to 3.84). At 12 months, data were extractable from SIX RCTs totaling 314 teeth. In two trials, there was no pathological root resorption in any of the participants regardless of the intervention. From the remaining trials, the pooled results showed no statistically significant difference in pathological root resorption with ferric sulphate compared with formocresol (RR 1.64, 95% CI 0.53 to 5.08). Results were similar at 24 months with four trials providing data (258 teeth randomised) (RR 1.21, 95% CI 0.50 to 2.96; Analysis 10.6).
Two additional trials did not assess pathological root resorption at a fixed time point but at an interval follow‐up of six to 11, 12 to 23 and 24 to 35 months for Fuks 1997 and three to 20 and 46 to 48 months for Ibricevic 2000. For Fuks 1997, there was no pathological root resorption in any of the participants regardless of the intervention at the first delays. At 24 to 35 months, the RR was 1.31 (95% CI 0.25 to 6.81). In Ibricevic 2000, the RR was 0.95 (95% CI 0.06 to 14.97) at three to 20 months and RR 0.63 (95% CI 0.11 to 3.70) at 46 to 48 months.
Pulp canal obliteration
At six months, data were extractable from three RCTs totaling 134 teeth. In all three trials, there was no pulp canal obliteration in any of the participants regardless of the intervention. At 12 months, data were extractable from three RCTs totaling 134 teeth. In one of the trials, there was no pulp canal obliteration in any of the participants regardless of the intervention. From the two remaining trials, the pooled results showed no statistically significant difference in pulp canal obliteration with ferric sulphate compared with formocresol (RR 0.94, 95% CI 0.54 to 1.64). At 24 months, data were extractable from two RCTs totaling 78 teeth. The pooled results showed no statistically significant difference in pulp canal obliteration with ferric sulphate compared with formocresol (RR 1.24, 95% CI 0.28 to 5.54; Analysis 10.7).
One additional trial, which randomised 96 teeth, did not assess pulp canal obliteration at a fixed time point but at an interval follow‐up of six to 11, 12 to 23 and 24 to 35 months (Fuks 1997). There was no pulp canal obliteration in any of the participants regardless of the intervention at six to 11 or 12 to 23 months. At 24 to 35 months, the RR was 1.64 (95% CI 0.55 to 4.85).
Physiological root resorption
One trial, which randomised 50 teeth, assessed physiological root resorption (Erdem 2011). At six and 12 months, there was no physiological root resorption in any of the participants regardless of the intervention. At 24 months, the RR was 3.00 (95% CI 0.33 to 26.92).
Succedaneous tooth structural anomaly
One trial, which randomised 164 teeth, assessed succedaneous tooth structural anomaly (Ibricevic 2000). At three to 20 and 46 to 48 months, there was no succedaneous tooth structural anomaly in any of the participants regardless of the intervention.
Sodium hypochlorite (NaOCl) versus ferric sulphate
Clinical failure
At six months, data were extractable from two RCTs totaling 110 teeth. In the two trials, there was no clinical failure in any of the participants regardless of the intervention. At 12 months, data were extractable from two RCTs totaling 110 teeth. In one trial, there was no clinical failure in any of the participants regardless of the intervention. For the remaining trial, the results showed no statistically significant difference (RR 4.39, 95% CI 0.22 to 87.82; Analysis 11.1).
At 24 months, one trial, which randomised 50 teeth, assessed clinical failure (Fernández 2013). The results showed no statistically significant difference (RR 3.00, 95% CI 0.13 to 70.30).
Radiological failure
At six months, data were extractable from two RCTs totaling 110 teeth. The results showed no statistically significant difference (RR 0.55, 95% CI 0.22 to 1.39). Results were similar at 12 months (RR 0.42, 95% CI 0.17 to 1.02; Analysis 11.2).
At 24 months, one trial, which randomised 50 teeth, assessed radiological failure (Fernández 2013). The results showed no statistically significant difference (RR 1.50, 95% CI 0.27 to 8.22).
Overall failure
One trial, which randomised 50 teeth, assessed overall failure (Fernández 2013). The results showed no statistically significant difference at six months (RR 3.00, 95% CI 0.33 to 26.92), 12 and 24 months (RR 1.50, 95% CI 0.27 to 8.22).
Pain
At six and 12 months, data were extractable from two RCTs totaling 110 teeth. In the two trials, there was no pain in any of the participants regardless of the intervention (Analysis 11.3).
At 24 months, one trial, which randomised 50 teeth, assessed pain (Fernández 2013). There was no pain in any of the participants regardless of the intervention.
Soft tissue pathology
At six and 12 months, data were extractable from two RCTs totaling 110 teeth. In the two trials, there was no soft tissue pathology in any of the participants regardless of the intervention (Analysis 11.4).
At 24 months, one trial, which randomised 50 teeth, assessed soft tissue pathology (Fernández 2013). There was no soft tissue pathology in any of the participants regardless of the intervention.
Adjacent tissue inflammation
At six months, data were extractable from two RCTs totaling 110 teeth. In the two trials, there was no adjacent tissue inflammation in any of the participants regardless of the intervention. At 12 months, data were extractable from two RCTs totaling 110 teeth. The pooled results showed no statistically significant difference (RR 0.31, 95% CI 0.03 to 2.91; Analysis 11.5).
At 24 months, one trial, which randomised 50 teeth, assessed clinical failure (Fernández 2013). The results showed no statistically significant difference (RR 0.50, 95% CI 0.05 to 5.17).
Pathological mobility
At six and 12 months, data were extractable from two RCTs totaling 110 teeth. In the two trials, there was no pathological mobility in any of the participants regardless of the intervention (Analysis 11.6).
At 24 months, one trial, which randomised 50 teeth, assessed pathological mobility (Fernández 2013). There was no pathological mobility in any of the participants regardless of the intervention.
Pathological radiolucency
At six months, data were extractable from two RCTs totaling 110 teeth. In one trial, there was no pathological radiolucency in any of the participants regardless of the intervention. For the remaining trial, the results showed no statistically significant difference (RR 0.88, 95% CI 0.06 to 13.35). Results were similar at 12 months, with the two trials providing data (RR 0.56, 95% CI 0.07 to 4.17; Analysis 11.7).
At 24 months, one trial, which randomised 50 teeth, assessed clinical failure (Fernández 2013). The results showed no statistically significant difference (RR 0.20, 95% CI 0.01 to 3.97).
Pathological root resorption
At six months, data were extractable from two RCTs totaling 110 teeth. The pooled results showed no statistically significant difference (RR 0.51, 95% CI 0.18 to 1.42). Results were similar at 12 months (RR 0.38, 95% CI 0.15 to 1.01; Analysis 11.8).
At 24 months, one trial, which randomised 50 teeth, assessed clinical failure (Fernández 2013). The results showed no statistically significant difference (RR 1.50, 95% CI 0.27 to 8.22).
Ferric sulphate versus buffered glutaraldehyde
One trial, which randomised 60 teeth, assessed ferric sulphate versus buffered glutaraldehyde based on pain, soft tissue pathology, pathological mobility, pathological radiolucency, pathological root resorption and pulp canal obliteration (Goyal 2016). There were no statistically significant differences for any outcome or time point (Table 20).
| Outcome | Time point (months) | No. of studies | Risk ratio (95% CI) |
| Pain | 6 | 1 | 0.25 (0.06, 1.08) |
| Soft tissue pathology | 6 | 1 | 0.33 (0.07, 1.52) |
| Pathologic mobility | 6 | 1 | 0.75 (0.30, 1.90) |
| Pathologic radiolucency | 6 | 1 | 1.14 (0.69, 1.90) |
| Pathologic root resorption | 6 | 1 | 1.20 (0.61, 2.34) |
| Pulp canal obliteration | 6 | 1 | 0.11 (0.01, 1.98) |
*due to lack of events
Abbreviations ‐ CI: confidence interval; FS: ferric sulfate.
Ferric sulphate versus zinc oxide and eugenol (ZOE)
One trial, which randomised 50 teeth, assessed ferric sulphate versus ZOE based on clinical failure, radiological failure, overall failure, pain, pathological radiolucency, pathological root resorption, pulp canal obliteration and physiological root resorption (Erdem 2011). There were no statistically significant differences for any outcome or time point (Table 21).
| Outcome | Time point (months) | No. of studies | Risk ratio (95% CI) |
| Clinical failure | 6 and 12 | 1 | Not estimable* |
| 24 | 1 | 1.20 (0.42 to 3.43) | |
| Radiological failure | 6 | 1 | 0.33 (0.01 to 7.81) |
| 12 | 1 | 0.20 (0.01 to 3.97) | |
| 24 | 1 | 0.60 (0.26 to 1.40) | |
| Overall failure | 6 | 1 | 0.33 (0.01 to 7.81) |
| 12 | 1 | 0.20 (0.01 to 3.97) | |
| 24 | 1 | 0.38 (0.11 to 1.25) | |
| Pain | 6, 12 and 24 | 1 | Not estimable* |
| Pathological radiolucency | 6, 12 and 24 | 1 | Not estimable* |
| Pathological root resorption | 6 | 1 | 0.33 (0.01 to 7.81) |
| 12 | 1 | 0.33 (0.01 to 7.81) | |
| 24 | 1 | 0.17 (0.02 to 1.29) | |
| Physiological root resorption | 6 and 12 | 1 | Not estimable* |
| 24 | 1 | 1.50 (0.27 to 8.22) | |
| Pulp canal obliteration | 6, 12 and 24 | 1 | Not estimable* |
*due to lack of events
Abbreviations ‐ CI: confidence interval; FS: ferric sulphate; ZOE: zinc oxide and eugenol
Erbium:yttrium‐aluminium garnet (Er:YAG) laser versus ferric sulphate
One trial, which randomised 97 teeth, assessed Er:YAG laser versus ferric sulphate by clinical failure, radiological failure, overall failure, pain, soft tissue pathology, pathological mobility, pathological radiolucency and pathological root resorption (Huth 2005). There were no statistically significant differences for any outcome or time point (Table 22).
| Outcome | Time point (months) | No. of studies | Risk ratio (95% CI) |
| Clinical failure | 6 | 1 | Not estimable* |
| 12 | 1 | 3.19 (0.13 to 76.37) | |
| 24 | 1 | 5.31 (0.26 to 107.86) | |
| Radiological failure | 12 | 1 | 0.46 (0.13 to 1.66) |
| 24 | 1 | 0.61 (0.19 to 1.94) | |
| Overall failure | 12 | 1 | 0.46 (0.13 to 1.66) |
| 24 | 1 | 0.61 (0.19 to 1.94) | |
| Pain | 6, 12 and 24 | 1 | Not estimable* |
| Soft tissue pathology | 6, 12 and 24 | 1 | Not estimable* |
| Pathological mobility | 6, 12 and 24 | 1 | Not estimable* |
| Pathological radiolucency | 12 | 1 | 0.15 (0.01 to 2.86) |
| 24 | 1 | 0.71 (0.12 to 4.06) | |
| Pathological root resorption | 12 | 1 | 0.53 (0.05 to 5.67) |
| 24 | 1 | 1.06 (0.16 to 7.25) |
*due to lack of events
Abbreviations ‐ CI: confidence interval; Er:YAG: erbium:yttrium‐aluminium garnet; FS: ferric sulphate
Diode laser versus ferric sulphate
Clinical failure
At six months, data were extractable from three RCTs totaling 130 teeth. The pooled results showed no statistically significant difference (RR 0.23, 95% CI 0.04 to 1.30). Results were similar at 12 months, with two trials providing data (100 teeth randomised) (RR 0.20, 95% CI 0.02 to 1.62; Analysis 12.1).
Radiological failure
At six months, data were extractable from three RCTs totaling 130 teeth. The pooled results showed no statistically significant difference (RR 0.89, 95% CI 0.38 to 2.12). Results were similar at 12 months, with two trials providing data (100 teeth randomised) (RR 0.91, 95% CI 0.44 to 1.92; Analysis 12.2).
Pain
At six months, data were extractable from two RCTs totaling 50 teeth. The pooled results showed no statistically significant difference (RR 0.20, 95% CI 0.03 to 1.60; Analysis 12.3).
Pathological radiolucency
At six months, data were extractable from two RCTs totaling 50 teeth. The pooled results showed no statistically significant difference (RR 0.25, 95% CI 0.03 to 2.08; Analysis 12.4).
Pathological root resorption
At six months, data were extractable from twoRCTs totaling 50 teeth. In one trial, there was no pathological root resorption in any of the participants regardless of the intervention. For the remaining trial, the results showed no statistically significant difference (RR 1.50, 95% CI 0.29 to 7.73; Analysis 12.5).
Electrosurgery versus ferric sulphate
Clinical failure
At six months, data were extractable from two RCTs totaling 50 teeth. The pooled results showed no statistically significant difference (RR 0.56, 95% CI 0.13 to 2.34; Analysis 13.1).
At 12 months, one trial, which randomised 20 teeth, assessed clinical failure (Gupta 2015). The results showed no statistically significant difference (RR 1.00, 95% CI 0.17 to 5.77).
Radiological failure
At six months, data were extractable from two RCTs totaling 50 teeth. The pooled results showed no statistically significant difference (RR 1.25, 95% CI 0.38 to 4.12; Analysis 13.2).
At 12 months, one trial, which randomised 20 teeth, assessed radiological failure (Gupta 2015). The results showed no statistically significant difference (RR 1.00, 95% CI 0.17 to 5.77).
Pain
At six months, data were extractable from two RCTs totaling 50 teeth. The pooled results showed no statistically significant difference (RR 0.56, 95% CI 0.13 to 2.34) (Analysis 13.3).
At 12 months, one trial, which randomised 20 teeth, assessed pain (Gupta 2015). The results showed no statistically significant difference (RR 1.00, 95% CI 0.17 to 5.77).
Pathological mobility
At six months, data were extractable from two RCTs totaling 50 teeth. In the two trials, there was no pathological mobility in any of the participants regardless of the intervention (Analysis 13.4).
At 12 months, one trial, which randomised 20 teeth, assessed pathological mobility (Gupta 2015). There was no pathological mobility in any of the participants regardless of the intervention.
Pathological radiolucency
At six months, data were extractable from two RCTs totaling 50 teeth. The pooled results showed no statistically significant difference (RR 0.25, 95% CI 0.03 to 2.08; Analysis 13.5).
At 12 months, one trial, which randomised 20 teeth, assessed pathological radiolucency (Gupta 2015). The results showed no statistically significant difference (RR 0.20, 95% CI 0.01 to 3.70).
Pathological root resorption
At six months, data were extractable from two RCTs totaling 50 teeth. The pooled results showed no statistically significant difference (RR 2.20, 95% CI 0.54 to 8.88; Analysis 13.5).
At 12 months, one trial, which randomised 20 teeth, assessed pathological root resorption (Gupta 2015). The results showed no statistically significant difference (RR 5.00, 95% CI 0.27 to 92.62).
Pulp canal obliteration
At six months, data were extractable from two RCTs totaling 50 teeth. In the two trials, there was no pulp canal obliteration in any of the participants regardless of the intervention (Analysis 13.6).
At 12 months, one trial, which randomised 20 teeth, assessed pulp canal obliteration (Gupta 2015). There was no pulp canal obliteration in any of the participants regardless of the intervention.
Ferric sulphate + MTA versus ferric sulphate
One trial, which randomised 135 teeth, assessed ferric sulphate + MTA versus ferric sulphate based on pain, soft tissue pathology, pathological mobility, adjacent tissue inflammation, pathological radiolucency, pathological root resorption, and pulp canal obliteration (Doyle 2010). This trial did not assess the outcomes at a fixed time point but at a mean (range) follow‐up of 22 (6 to 38) months. There were no statistically significant differences for any outcome (Table 23).
| Outcome | Time point (months) | No. of studies | Risk ratio (95% CI) |
| Pain | mean 22 | 1 | 0.25 (0.01 to 6.08) |
| Soft tissue pathology | mean 22 | 1 | 0.25 (0.01 to 6.08) |
| Pathological mobility | mean 22 | 1 | 0.15 (0.01 to 3.09) |
| Adjacent tissue inflammation | mean 22 | 1 | 0.25 (0.01 to 6.08) |
| Pathological radiolucency | mean 22 | 1 | 0.29 (0.01 to 6.92) |
| Pathological root resorption | mean 22 | 1 | 0.60 (0.31 to 1.19) |
| Pulp canal obliteration | mean 22 | 1 | 1.39 (0.78 to 2.49) |
CI: confidence interval; FS: ferric sulphate; MTA: mineral trioxide aggregate
Ferric sulphate versus Ankaferd Blood Stopper
Clinical failure
Data were extractable from two trials totaling 100 teeth. At six months, there was no clinical failure in any of the participants regardless of the intervention. At 12 months, for one trial, there was no clinical failure in any of the participants regardless of the intervention. For the remaining trial, there was no statistically significant difference (RR 1.25, 95% CI 0.37 to 4.27; Analysis 14.1). At 24 months, one trial, which randomised 30 teeth, assessed clinical failure (Ozmen 2017). There were no statistically significant differences (RR 5.00, 95% CI 0.26 to 96.13).
Radiological failure
Data were extractable from two trials totaling 100 teeth. At six months, for one trial, there was no radiological failure in any of the participants regardless of the intervention. For the remaining trial, there was no statistically significant difference (RR 1.00, 95% CI 0.16 to 6.20). At 12 months, the pooled results showed no statistically significant difference (RR 0.88, 95% CI 0.34 to 2.23; Analysis 14.2). At 24 months, one trial, which randomised 30 teeth, assessed radiological failure (Ozmen 2017). There was no statistically significant difference (RR 1.00, 95% CI 0.16 to 6.20).
Pain
Data were extractable from two trials totaling 100 teeth. At six months, there was no pain in any of the participants regardless of the intervention. At 12 months, for one trial, there was no pain in any of the participants regardless of the intervention. For the remaining trial, there was no statistically significant differences (RR 1.00, 95% CI 0.15 to 6.71; Analysis 14.3). At 24 months, one trial, which randomised 30 teeth, assessed pain (Ozmen 2017). There was no pain in any of the participants regardless of the intervention.
Soft tissue pathology
Data were extractable from two trials totaling 100 teeth. At six months, there was no soft tissue pathology in any of the participants regardless of the intervention. At 12 months, for one trial, there was no soft tissue pathology in any of the participants regardless of the intervention. For the remaining trial, there was no statistically significant differences (RR 1.50, 95% CI 0.27 to 8.43; Analysis 14.4). At 24 months, one trial, which randomised 30 teeth, assessed soft tissue pathology (Ozmen 2017). There was no soft tissue pathology in any of the participants regardless of the intervention.
Pathologic mobility
Data were extractable from two trials totaling 100 teeth. At six and 12 months, there was no pathologic mobility in any of the participants regardless of the intervention (Analysis 14.5). At 24 months, one trial, which randomised 30 teeth, assessed pathologic mobility (Ozmen 2017). There was no pathologic mobility in any of the participants regardless of the intervention.
Pathological radiolucency
Data were extractable from two trials totaling 100 teeth. At six months, there was no pathological radiolucency in any of the participants regardless of the intervention. At 12 months, for one trial, there was no pathological radiolucency in any of the participants regardless of the intervention. For the remaining trial, there was no statistically significant differences (RR 0.67, 95% CI 0.12 to 3.75; Analysis 14.6). At 24 months, one trial, which randomised 30 teeth, assessed pathological radiolucency (Ozmen 2017). There was no pathological radiolucency in any of the participants regardless of the intervention.
Pathological root resorption
Data were extractable from two trials totaling 100 teeth. At six months, for one trial, there was no pathological root resorption in any of the participants regardless of the intervention. For the remaining trial, there was no statistically significant difference (RR 5.00, 95% CI 0.26 to 96.13). At 12 months, the pooled results showed no statistically significant differences (RR 1.00, 95% CI 0.31 to 3.23; Analysis 14.7). At 24 months, one trial, which randomised 30 teeth, assessed pathological root resorption (Ozmen 2017). There was no statistically significant differences (RR 1.00, 95% CI 0.16 to 6.20).
Portland cement versus full strength formocresol
One trial, which randomised 70 teeth, assessed Portland cement versus formocresol based on clinical failure, radiological failure, overall failure, pain, soft tissue pathology, pathological mobility, pathological radiolucency and pathological root resorption (Yildirim 2016). There were no statistically significant differences for any outcomes at time point (Table 24).
| Outcome | Time point (months) | No. of studies | Risk ratio (95% CI) |
| Clinical failure | 6, 12 and 24 | 1 | 2.00 (0.19, 21.06) |
| Radiological failure | 24 | 1 | 0.80 (0.23, 2.73) |
| Overall failure | 6, 12 and 24 | 1 | 2.00 (0.19, 21.06) |
| Pain | 6, 12 and 24 | 1 | 1.00 (0.07, 15.36) |
| Soft tissue pathology | 6, 12 and 24 | 1 | 2.00 (0.19, 21.06) |
| Pathologic mobility | 6, 12 and 24 | 1 | 3.00 (0.13, 71.22) |
| Pathologic radiolucency | 24 | 1 | 1.00 (0.22, 4.62) |
| Pathologic root resorption | 24 | 1 | 0.50 (0.05, 5.27) |
Abbreviations ‐ CI: confidence interval; PC: Portland cement; FC: formocresol
Portland cement versus enamel matrix derivative (EMD)
One trial, which randomised 70 teeth, assessed MTA versus EMD based on clinical failure, radiological failure, overall failure, pain, soft tissue pathology, pathological mobility, pathological radiolucency and pathological root resorption (Yildirim 2016). There were no statistically significant differences for any outcomes at time point (Table 25).
| Outcome | Time point (months) | No. of studies | Risk ratio (95% CI) |
| Clinical failure | 6, 12 and 24 | 1 | 0.67 (0.12, 3.75) |
| Radiological failure | 24 | 1 | 0.57 (0.18, 1.78) |
| Overall failure | 6, 12 and 24 | 1 | 0.67 (0.12, 3.75) |
| Pain | 6, 12 and 24 | 1 | 1.00 (0.07, 15.36) |
| Soft tissue pathology | 6, 12 and 24 | 1 | 1.00 (0.15, 6.71) |
| Pathologic mobility | 6, 12 and 24 | 1 | 0.50 (0.05, 5.27) |
| Pathologic radiolucency | 24 | 1 | 0.60 (0.16, 2.32) |
| Pathologic root resorption | 24 | 1 | 0.50 (0.05, 5.27) |
*due to lack of events
Abbreviations ‐ CI: confidence interval; PC: Portland cement; EMD: enamel matrix derivative
Portland cement versus Portland cement + iodoform (Portland cement + CHI₃) or Portland cement + zirconium oxide (Portland cement + ZrO₂)
One trial, which randomised 30 teeth, assessed Portland cement versus Portland cement + CHI₃ or Portland cement + ZrO₂ based on clinical failure, radiological failure, pathological root resorption, pathological radiolucency, soft tissue pathology, pathological mobility (Lourenço 2015a). There were no events in any of the participants regardless of the intervention.
Glutaraldehyde + calcium hydroxide versus full strength formocresol
One trial, which randomised 44 teeth, assessed glutaraldehyde + calcium hydroxide versus ZOE based on clinical failure and radiological failure (Alaçam 1989). There were no statistically significant differences for either outcome at three months (clinical failure: RR 1.10, 95% CI 0.17 to 7.10; radiological failure: RR 1.10, 95% CI 0.31 to 3.84). No longer‐term data were reported.
Glutaraldehyde + zinc oxide and eugenol (ZOE) versus full strength formocresol
One trial, which randomised 48 teeth, assessed glutaraldehyde + ZOE versus ZOE based on clinical failure and radiological failure (Alaçam 1989). There were no statistically significant differences for either outcome at three months (clinical failure: RR 0.46 95% CI 0.04 to 4.74; radiological failure: RR 0.46, 95% CI 0.09 to 2.28). No longer‐term data were reported.
Glutaraldehyde + calcium hydroxide versus glutaraldehyde + zinc oxide and eugenol (ZOE)
One trial, which randomised 46 teeth, assessed glutaraldehyde + calcium hydroxide versus glutaraldehyde + ZOE based on clinical failure and radiological failure (Alaçam 1989). There were no statistically significant differences for either outcome at three months (clinical failure: RR 2.38, 95% CI 0.23 to 24.46; radiological failure: RR 2.38, 95% CI 0.48 to 11.74). No longer‐term data were reported.
An additional trial, which randomised 61 teeth, assessed glutaraldehyde + calcium hydroxide versus glutaraldehyde + ZOE at 12 months based on clinical failure, radiological failure, pain, pathological radiolucency and pathological root resorption (Shumayrikh 1999). There were no statistically significant differences between treatment groups for any outcome (Table 26).
| Outcome | Time point (months) | No. of studies | Risk ratio (95% CI) |
| Clinical failure | 12 | 1 | 2.90 (0.32 to 26.38) |
| Radiological failure | 12 | 1 | 1.11 (0.46 to 2.67) |
| Pain | 12 | 1 | Not estimable* |
| Pathological radiolucency | 12 | 1 | 0.97 (0.39 to 2.43) |
| Pathological root resorption | 12 | 1 | 0.97 (0.15 to 6.44) |
*due to lack of events
Abbreviations ‐ CH: calcium hydroxide; CI: confidence interval; ZOE: zinc oxide and eugenol
Electrofulguration + calcium hydroxide versus electrofulguration + zinc oxide eugenol (ZOE)
One trial, which randomised 47 teeth, assessed electrofulguration + calcium hydroxide versus electrofulguration + ZOE based on clinical failure, radiological failure, overall failure, pain, soft tissue pathology, pathological mobility, pathological radiolucency, pathological root resorption and pulp canal obliteration (Fishman 1996). There were no statistically significant differences for either outcome at six months (Table 27).
| Outcome | Time point (months) | No. of studies | Risk ratio (95% CI) |
| Clinical failure | 6 | 1 | 0.83 (0.26, 2.73) |
| Radiological failure | 6 | 1 | 0.94 (0.47, 1.88) |
| Overall failure | 6 | 1 | 0.94 (0.47, 1.88) |
| Pain | 6 | 1 | Not estimable* |
| Soft tissue pathology | 6 | 1 | 0.83 (0.26, 2.73) |
| Pathologic mobility | 6 | 1 | Not estimable* |
| Pathologic radiolucency | 6 | 1 | 1.04 (0.43, 2.51) |
| Pathologic root resorption | 6 | 1 | 0.75 (0.28, 2.02) |
| Pulp canal obliteration | 6 | 1 | 1.04 (0.16, 6.80) |
*due to lack of events
Abbreviations ‐ CI: confidence interval; CH: calcium hydroxide; ZOE: zinc oxide eugenol
Electrosurgery versus formocresol
One trial, which randomised 70 teeth, assessed electrosurgery versus 1:5 diluted formocresol at fixed time points, reporting on clinical failure, radiological failure, pain, soft tissue pathology, pathological mobility, pathological radiolucency and pathological root resorption (Bahrololoomi 2008). There was no statistically significant difference at any time point for any outcome (Table 28).
| Outcome | Time point (months) | No. of studies | Risk ratio (95% CI) |
| Clinical failure | 9 | 1 | 3.00 (0.13 to 71.22) |
| Radiological failure | 9 | 1 | 5.00 (0.62 to 40.64) |
| Pain | 6 | 1 | Not estimable* |
| Soft tissue pathology | 6 | 1 | 3.00 (0.13 to 71.22) |
| Pathological mobility | 6 | 1 | Not estimable* |
| Pathological radiolucency | 6 | 1 | 5.00 (0.25 to 100.54) |
| Pathological root resorption | 6 | 1 | 5.00 (0.25 to 100.54) |
*due to lack of events
Abbreviations ‐ CI: confidence interval; FC: formocresol
One additional trial, which randomised 50 teeth, did not assess electrosurgery versus full strength formocresol at a fixed time point but at a mean (range) follow‐up of 11.5 (5 to 25) months in one the formocresol group and 10.9 (6 to 31) in the other electrosurgery group (Dean 2002). There was no statistically significant difference for clinical failure (RR 3.00, 95% CI 0.13 to 70.30) or radiological failure (RR 2.00, 95% CI 0.40 to 9.95).
Diode laser versus electrosurgery
Clinical failure
At six months, data were extractable from two RCTs totaling 50 teeth. In one trial, there was no clinical failure in any of the participants regardless of the intervention. For the remaining trial, the results showed no statistically significant difference (RR 0.20, 95% CI 0.01 to 3.70; Analysis 15.1).
At 12 months, one trial, which randomised 20 teeth, assessed clinical failure (Gupta 2015). The results showed no statistically significant difference (RR 0.20, 95% CI 0.01 to 3.70).
Radiological failure
At six months, data were extractable from two RCTs totaling 50 teeth. The pooled results showed no statistically significant difference (RR 0.64, 95% CI 0.19 to 2.18; Analysis 15.2).
At 12 months, one trial, which randomised 20 teeth, assessed radiological failure (Gupta 2015). The results showed no statistically significant difference (RR 0.20, 95% CI 0.01 to 3.70).
Pain
At six months, data were extractable from two RCTs totaling 50 teeth. In one trial, there was no pain in any of the participants regardless of the intervention. For the remaining trial, the results showed no statistically significant difference (RR 0.20, 95% CI 0.01 to 3.70; Analysis 15.3).
At 12 months, one trial, which randomised 20 teeth, assessed pain (Gupta 2015). The results showed no statistically significant difference (RR 0.20, 95% CI 0.01 to 3.70).
Pathological mobility
At six months, data were extractable from two RCTs totaling 50 teeth. In the two trials, there was no pathological mobility in any of the participants regardless of the intervention (Analysis 15.4).
At 12 months, one trial, which randomised 20 teeth, assessed pathological mobility (Gupta 2015). There was no pathological mobility in any of the participants regardless of the intervention.
Pathological radiolucency
At six months, data were extractable from two RCTs totaling 50 teeth. In the two trials, there was no pathological radiolucency in any of the participants regardless of the intervention (Analysis 15.5).
At 12 months, one trial, which randomised 20 teeth, assessed pathological radiolucency (Gupta 2015). There was no pathological radiolucency in any of the participants regardless of the intervention.
Pathological root resorption
At six months, data were extractable from two RCTs totaling 50 teeth. The pooled results showed no statistically significant difference (RR 0.64, 95% CI 0.19 to 2.18; Analysis 15.6).
At 12 months, one trial, which randomised 20 teeth, assessed pathological root resorption (Gupta 2015). The results showed no statistically significant difference (RR 0.20, 95% CI 0.01 to 3.70).
Pulp canal obliteration
At six months, data were extractable from two RCTs totaling 50 teeth. In the two trials, there was no pulp canal obliteration in any of the participants regardless of the intervention (Analysis 15.7).
At 12 months, one trial, which randomised 20 teeth, assessed pulp canal obliteration (Gupta 2015). There was no pulp canal obliteration in any of the participants regardless of the intervention.
Electrosurgery versus calcium‐enriched mixture (CEM)
One trial, which randomised 102 teeth, assessed clinical failure, radiological failure, overall failure and pulp canal obliteration (Khorakian 2014). At six, 12 and 24 months, there was no clinical failure in any of the participants regardless of the intervention. For radiological/overall failure, there were no statistically significant differences at six (RR 0.20, 95% CI 0.01 to 4.07), 12 (RR 1.00, 95% CI 0.06 to 15.56) and 24 months (RR 0.50, 95% CI 0.10 to 2.61). For pulp canal obliteration, there were no statistically significant differences at 12 months (RR 1.22, 95% CI 0.88 to 1.70).
Biodentine versus formocresol
One trial, which randomised 112 teeth, assessed clinical failure, radiological failure, pain, soft tissue pathology, pathologic mobility, pathological radiolucency, pathological root resorption and pulp canal obliteration at six months (El Meligy 2016). There was no clinical failure, radiological failure, pain, soft tissue pathology, pathologic mobility, pathological radiolucency and pathological root resorption in any of the participants regardless of the intervention. For pulp canal obliteration, there was no statistically significant difference (RR 1.43, 95% CI 0.59 to 3.49).
Biodentine versus diode laser
One trial, which randomised 40 teeth, assessed Biodentine versus diode based on pain, soft tissue pathology, pathological mobility, pathological radiolucency, pathological root resorption, and premature tooth loss (Niranjani 2015). There was no premature tooth loss in any of the participants regardless of the intervention.There were no statistically significant differences for the other outcomes at six months (RR 2.00, 95% CI 0.20 to 20.33).
Biodentine versus Tempophore
One trial, which randomised 56 teeth, assessed Biodentine versus Tempophore based on clinical failure, radiological failure, pathological radiolucency, pathological root resorption, pulp canal obliteration and dentin bridge formation at six and 12 months (Rajasekharan 2017). There were no statistically significant differences for any outcomes at any time point (Table 29).
| Outcome | Time point (months) | No. of studies | Risk ratio (95% CI) |
| Clinical failure | 6 and 12 | 1 | 1.08 (0.07, 16.36) |
| Radiological failure | 6 and 12 | 1 | 0.54 (0.11, 2.70) |
| Pathological radiolucency | 6 | 1 | 2.16 (0.21, 22.38) |
| 12 | 1 | 0.54 (0.11, 2.70) | |
| Pathological root resorption | 6 | 1 | 0.36 (0.08, 1.62) |
| 12 | 1 | 0.31 (0.07, 1.35) | |
| Pulp canal obliteration | 6 | 1 | 1.39 (0.61, 3.17) |
| 12 | 1 | 1.08 (0.60, 1.94) | |
| Dentine bridge formation | 6 | 1 | Not estimable* |
| 12 | 1 | 11.85 (0.69, 203.86) |
*due to lack of events
Abbreviations ‐ CI: confidence interval
Biodentine versus propolis
One trial, which randomised 50 teeth, assessed Biodentine versus propolis based on clinical failure and radiological failure (Kusum 2015). There were no statistically significant differences for any outcomes at six months (clinical failure: RR 0.33, 95% CI 0.01 to 7.81; radiological failure: RR 0.43, 95% CI 0.12 to 1.47).
Sodium hypochlorite (NaOCl) versus 1:5 diluted formocresol
Clinical failure
At six and 12 months, data were extractable from two RCTs totaling 150 teeth. In the two trials, there was no clinical failure in any of the participants regardless of the intervention (Analysis 16.1).
At 24 months, one trial, which randomised 50 teeth, assessed clinical failure (Fernández 2013). The results showed no statistically significant difference (RR 3.00, 95% CI 0.13 to 70.30).
Radiological failure
At six months, data were extractable from two RCTs totaling 150 teeth. The pooled results showed no statistically significant difference (RR 1.29, 95% CI 0.33 to 5.08). Results were similar at 12 months (RR 1.86, 95% CI 0.52 to 6.59; Analysis 16.2).
At 24 months, one trial, which randomised 50 teeth, assessed radiological failure (Fernández 2013). The results showed no statistically significant difference (RR 3.00, 95% CI 0.33 to 26.92).
Overall failure
At six, 12 and 24 months, one trial, which randomised 50 teeth, assessed radiological failure (Fernández 2013). The results showed no statistically significant difference (RR 7.00, 95% CI 0.38 to 128.87).
Pain
At six and 12 months, data were extractable from two RCTs totaling 150 teeth. In the two trials, there was no pain in any of the participants regardless of the intervention (Analysis 16.3).
At 24 months, one trial, which randomised 20 teeth, assessed pain (Fernández 2013). There was no pain in any of the participants regardless of the intervention.
Soft tissue pathology
At six and 12 months, data were extractable from two RCTs totaling 150 teeth. In the two trials, there was no soft tissue pathology in any of the participants regardless of the intervention (Analysis 16.4).
At 24 months, one trial, which randomised 20 teeth, assessed soft tissue pathology (Fernández 2013). There was no soft tissue pathology in any of the participants regardless of the intervention.
Adjacent tissue inflammation
One trial, which randomised 50 teeth, assessed adjacent tissue inflammation (Fernández 2013). At six and 12 months, there was no adjacent tissue inflammation in any of the participants regardless of the intervention. At 24 months, the results showed no statistically significant difference (RR 3.00, 95% CI 0.13 to 70.30).
Pathological mobility
At six and 12 months, data were extractable from two RCTs totaling 50 teeth. In the two trials, there was no pathological mobility in any of the participants regardless of the intervention (Analysis 16.5).
At 24 months, one trial, which randomised 20 teeth, assessed soft tissue pathology (Fernández 2013). There was no pathological mobility in any of the participants regardless of the intervention.
Pathological radiolucency
At six and 12 months, data were extractable from two RCTs totaling 50 teeth. In the two trials, there was no pathological radiolucency in any of the participants regardless of the intervention (Analysis 16.6).
At 24 months, one trial, which randomised 20 teeth, assessed pathological radiolucency (Fernández 2013). There was no pathological radiolucency in any of the participants regardless of the intervention.
Pathological root resorption
At six months, data were extractable from two RCTs totaling 50 teeth. The pooled results showed no statistically significant difference (RR 1.29, 95% CI 0.33 to 5.08; Analysis 16.7). Results were similar at 12 months (RR 1.86, 95% CI 0.52 to 6.59).
At 24 months, one trial, which randomised 20 teeth, assessed pathological root resorption (Fernández 2013). The results showed no statistically significant difference (RR 3.00, 95% CI 0.33 to 26.92).
Calcium hydroxide/iodoform versus full strength formocresol
One trial, which randomised 67 teeth, assessed calcium hydroxide/iodoform versus formocresol, reporting on clinical failure, radiological failure, pain, soft tissue pathology, pathological radiolucency and pathological root resorption (Alaçam 2009). For clinical failure, the RR was 16.41 (95% CI 2.30 to 117.26) at six months and RR 9.11 (95% CI 3.04 to 27.31) at 12 months in favour of formocresol. For radiological failure, the RR was 24.06 (95% CI 3.44 to 168.43) at six months and RR 9.11 (95% CI 3.04 to 27.31) at 12 months. There was no statistically significant difference for any other outcome at either six or 12 months (Table 30).
| Outcome | Time point (months) | No. of studies | Risk ratio (95% CI) |
| Clinical failure | 6 | 1 | 16.41 (2.30 to 117.26) |
| 12 | 1 | 9.11 (3.04 to 27.31) | |
| Radiological failure | 6 | 1 | 24.06 (3.44 to 168.43) |
| 12 | 1 | 9.11 (3.04 to 27.31) | |
| Pain | 6 | 1 | 5.47 (0.67 to 44.34) |
| 12 | 1 | 5.47 (0.67 to 44.34) | |
| Soft tissue pathology | 6 | 1 | 7.64 (0.41 to 142.35) |
| 12 | 1 | 7.64 (0.41 to 142.35) | |
| Pathological radiolucency | 6 | 1 | 2.19 (0.21 to 22.99) |
| 12 | 1 | 2.19 (0.21 to 22.99) | |
| Pathological root resorption | 6 | 1 | 12.00 (0.69 to 208.77) |
| 12 | 1 | 5.47 (0.67 to 44.34) |
Abbreviations ‐ CH: calcium hydroxide; CI: confidence interval; FC: formocresol
Zinc oxide and eugenol (ZOE) versus formocresol
One trial, which randomised 50 teeth, assessed ZOE versus formocresol based on clinical failure, radiological failure, overall failure, pain, pathological radiolucency, pathological root resorption, pulp canal obliteration and physiological root resorption (Erdem 2011). At six and 12 months, there was no clinical failure in any of the participants regardless of the intervention. There was no statistically significant difference for any outcome at any time point (Table 31).
| Outcome | Time point (months) | No. of studies | Risk ratio (95% CI) |
| Clinical failure | 6 | 1 | Not estimable* |
| 12 | 1 | Not estimable* | |
| 24 | 1 | 0.83 (0.29 to 2.38) | |
| Radiological failure | 6 | 1 | 3.00 (0.13 to 70.30) |
| 12 | 1 | 5.00 (0.25 to 99.17) | |
| 24 | 1 | 1.67 (0.71 to 3.89) | |
| Overall failure | 6 | 1 | 3.00 (0.13 to 70.30) |
| 12 | 1 | 5.00 (0.25 to 99.17) | |
| 24 | 1 | 2.67 (0.80 to 8.90) | |
| Pain | 6, 12 and 24 | 1 | Not estimable* |
| Pathological radiolucency | 6, 12 and 24 | 1 | Not estimable* |
| Pathological root resorption | 6 | 1 | 3.00 (0.13 to 70.30) |
| 12 | 1 | 3.00 (0.13 to 70.30) | |
| 24 | 1 | 6.00 (0.78 to 46.29) | |
| Pulp canal obliteration | 6 | 1 | Not estimable* |
| 12 | 1 | 0.20 (0.01 to 3.97) | |
| 24 | 1 | 0.20 (0.01 to 3.97) | |
| Physiological root resorption | 6 | 1 | Not estimable* |
| 12 | 1 | Not estimable* | |
| 24 | 1 | 2.00 (0.19 to 20.67) |
*due to lack of events
Abbreviations ‐ CI: confidence interval; FC: formocresol; ZOE: zinc oxide and eugenol
Erbium:yttrium‐aluminium garnet (Er:YAG) laser versus formocresol
One trial, which randomised 97 teeth, assessed Er:YAG laser versus formocresol based on clinical failure, radiological failure, overall failure, pain, soft tissue pathology, pathological mobility, pathological radiolucency and pathological root resorption (Huth 2005). There were no statistically significant differences for any outcome at six, 12 or 24 months (Table 32).
| Outcome | Time point (months) | No. of studies | Risk ratio (95% CI) |
| Clinical failure | 6 | 1 | Not estimable* |
| 12 | 1 | 3.19 (0.13 to 76.37) | |
| 24 | 1 | 2.13 (0.20 to 22.70) | |
| Radiological failure | 6 | 1 | Not estimable* |
| 12 | 1 | 1.60 (0.28 to 9.13) | |
| 24 | 1 | 1.06 (0.28 to 4.01) | |
| Overall failure | 6 | 1 | Not estimable* |
| 12 | 1 | 1.60 (0.28 to 9.13) | |
| 24 | 1 | 1.06 (0.28 to 4.01) | |
| Pain | 6, 12 and 24 | 1 | Not estimable* |
| Soft tissue pathology | 6 | 1 | Not estimable* |
| 12 | 1 | Not estimable* | |
| 24 | 1 | 0.35 (0.01 to 8.49) | |
| Pathological mobility | 6, 12 and 24 | 1 | Not estimable* |
| Pathological radiolucency | 6 | 1 | Not estimable* |
| 12 | 1 | 0.21 (0.01 to 4.31) | |
| 24 | 1 | 1.06 (0.16 to 7.25) | |
| Pathological root resorption | 6 | 1 | Not estimable* |
| 12 | 1 | 3.19 (0.13 to 76.37) | |
| 24 | 1 | 1.06 (0.16 to 7.25) |
*due to lack of events
Abbreviations ‐ CI: confidence interval; Er:YAG: erbium:yttrium‐aluminium garnet; FC: formocresol
Diode laser versus formocresol
One trial, which randomised 80 teeth, assessed diode laser versus formocresol based on clinical failure and radiological failure (Durmus 2014). There were no statistically significant differences for any outcome at six and 12 months (Table 33).
| Outcome | Time point (months) | No. of studies | Risk ratio (95% CI) |
| Clinical failure | 6 | 1 | Not estimable* |
| 12 | 1 | 0.33 (0.01, 7.95) | |
| Radiological failure | 6 | 1 | 1.67 (0.43, 6.51) |
| 12 | 1 | 2.00 (0.75, 5.33) |
*due to lack of events
Abbreviations ‐ CI: confidence interval; FC: formocresol.
Low‐level laser therapy (LLLT) versus formocresol
One trial, which randomised 30 teeth, assessed LLLT versus formocresol based on clinical failure, radiological failure, pain, soft tissue pathology, adjacent tissue inflammation, pathologic mobility, pathologic radiolucency, pathologic root resorption, pulp canal obliteration, and dentin bridge formation at six and 12 months (Fernandes 2015). There was no clinical failure, pain, soft tissue pathology, adjacent tissue inflammation pathologic mobility, pathologic radiolucency and dentin bridge formation in any of the participants regardless of the intervention. There were no statistically significant differences for radiological failure and pathologic root resorption at six and 12 months (RR 7.00, 95% CI 0.39 to 124.83), pulp canal obliteration at six (RR 3.00, 95% CI 0.13 to 68.26) and 12 months (RR 1.67, 95% CI 0.48 to 5.76).
Low‐level laser therapy (LLLT) + calcium hydroxide versus formocresol
One trial, which randomised 30 teeth, assessed LLLT + calcium hydroxide versus formocresol based on clinical failure, radiological failure, pain, soft tissue pathology, adjacent tissue inflammation, pathologic mobility, pathologic radiolucency, pathologic root resorption, pulp canal obliteration, and dentin bridge formation at six and 12 months (Fernandes 2015). There was no clinical failure, pain, soft tissue pathology, adjacent tissue inflammation pathologic mobility and pathologic radiolucency in any of the participants regardless of the intervention. There were no statistically significant differences for radiological failure and pathologic root resorption at six (RR 5.00, 95% CI 0.26 to 96.13) and 12 months (RR 7.00, 95% CI 0.39 to 124.83), pulp canal obliteration at six (RR 3.00, 95% CI 0.13 to 68.26) and 12 months (RR 0.33, 95% CI 0.04 to 2.85), and dentin bridge formation at six and 12 months (RR 15.00, 95% CI 0.93 to 241.20).
Ankaferd Blood Stopper versus formocresol
One trial, which randomised 30 teeth, assessed Ankaferd Blood Stopper versus formocresol based on clinical failure, radiological failure, pain, soft tissue pathology, pathological mobility, pathological radiolucency and pathologic root resorption (Ozmen 2017). There were no statistically significant differences for all outcomes at any time points (Table 34).
| Outcome | Time point (months) | No. of studies | Risk ratio (95% CI) |
| Clinical failure | 6 and 12 | 1 | 0.33 (0.01, 7.58) |
| 24 | 1 | 1.00 (0.16, 6.20) | |
| Radiological failure | 6 and 12 | 1 | 1.00 (0.16, 6.20) |
| 24 | 1 | 0.67 (0.13, 3.44) | |
| Pain | 6 and 12 | 1 | 0.33 (0.01, 7.58) |
| 24 | 1 | 1.00 (0.16, 6.20) | |
| Soft tissue pathology | 6, 12 and 24 months | 1 | 0.33 (0.01, 7.58) |
| Pathologic mobility | 6, 12 and 24 months | 1 | 0.33 (0.01, 7.58) |
| Pathological radiolucency | 6 and 12 | 1 | Not estimable* |
| Pathological root resorption | 6 and 12 | 1 | 1.00 (0.16, 6.20) |
| 24 | 1 | 0.67 (0.13, 3.44) |
*due to lack of events
Abbreviation ‐ CI: confidence interval
Enamel matrix derivative (EMD) versus formocresol
Two trials assessed EMD versus formocresol: one trial assessed full strength formocresol (Yildirim 2016), and the other trial assessed 1:5 diluted formocresol (Sabbarini 2008).
Clinical failure
At six months, data were extractable from two RCTs totaling 100 teeth. The results showed no statistically significant difference (RR 0.80, 95% CI 0.23 to 2.83; Analysis 17.1).
At 12 and 24 months, one trial, which randomised 70 teeth, assessed clinical failure (Yildirim 2016). There was no statistically significant difference (RR 3.00, 95% CI 0.33 to 27.46).
Radiological failure
At six months, one trial, which randomised 30 teeth, assessed radiological failure (Sabbarini 2008). There was a statistically significant difference in favour of EMD (RR 0.46, 95% CI 0.24 to 0.88).
At 24 months, one trial, which randomised 70 teeth, assessed radiological failure (Yildirim 2016). There was no statistically significant difference (RR 1.40, 95% CI 0.49 to 3.99).
Overall failure
At six, 12 and 24 months, one trial, which randomised 70 teeth, assessed overall failure (Yildirim 2016). There was no statistically significant difference (RR 3.00, 95% CI 0.33 to 27.46).
Pain
At six months, data were extractable from two RCTs totaling 100 teeth. The results showed no statistically significant difference (RR 0.40, 95% CI 0.08 to 1.92; Analysis 17.2).
At 12 and 24 months, one trial, which randomised 70 teeth, assessed pain (Yildirim 2016). There was no statistically significant difference (RR 1.00, 95% CI 0.07 to 15.36).
Soft tissue pathology
At six months, data were extractable from two RCTs totaling 100 teeth. In one trial, there was no soft tissue pathology in any of the participants regardless of the intervention. For the remaining trial, the results showed no statistically significant difference (RR 2.00, 95% CI 0.19 to 21.06; Analysis 17.3).
At 12 and 24 months, one trial, which randomised 70 teeth, assessed clinical failure (Yildirim 2016). There was no statistically significant difference (RR 2.00, 95% CI 0.19 to 21.06).
Pathological mobility
At six months, data were extractable from two RCTs totaling 100 teeth. In one trial, there was no pathological mobility in any of the participants regardless of the intervention. For the remaining trial, the results showed no statistically significant difference (RR 5.00, 95% CI 0.26 to 96.13; Analysis 17.4).
At 12 and 24 months, one trial, which randomised 70 teeth, assessed pathological mobility (Yildirim 2016). There was no statistically significant difference (RR 5.00, 95% CI 0.25 to 100.53).
Pathological radiolucency
At 24 months, one trial, which randomised 70 teeth, assessed pathological radiolucency (Yildirim 2016). There was no statistically significant difference (RR 1.67, 95% CI 0.43 to 6.45).
Pathological root resorption
At 24 months, one trial, which randomised 70 teeth, assessed pathological root resorption (Yildirim 2016). There was no statistically significant difference (RR 1.00, 95% CI 0.15 to 6.71).
Full strength formocresol compared with 1:5 diluted formocresol
One trial, which randomised 30 teeth, assessed clinical failure, radiological failure, pain, soft tissue pathology, pathological radiolucency and pathological root resorption at six months (Goyal 2014). There was no event in any of the participants regardless of the intervention.
Full strength formocresol compared with 1:25 diluted formocresol
One trial, which randomised 30 teeth, assessed clinical failure, radiological failure, pain, soft tissue pathology, pathological radiolucency and pathological root resorption at six months (Goyal 2014). There was no event in any of the participants regardless of the intervention.
1:5 diluted formocresol compared with 1:25 diluted formocresol
One trial, which randomised 30 teeth, assessed clinical failure, radiological failure, pain, soft tissue pathology, pathological radiolucency and pathological root resorption at six months (Goyal 2014). There was no event in any of the participants regardless of the intervention.
Pulpectomy versus pulpectomy
We assessed 15 trials that compared pulpectomy using different types of medicaments. Two trials were assessed at high risk of bias, and the risk of bias was unclear for 13 trials.
Calcium hydroxide versus zinc oxide and eugenol (ZOE)
Clinical failure
Ozalp 2005, which randomised 40 teeth, assessed calcium hydroxide versus ZOE based on clinical failure at six and 12 months; there was no statistically significant difference at either time point (six months: RR 3.00, 95% CI 0.13 to 69.52; 12 months: RR 9.00, 95% CI 0.52 to 156.92).
Nadkarni 2000, which randomised 70 teeth, assessed calcium hydroxide versus ZOE based on clinical failure at nine months. There was no statistically significant difference (RR 0.25, 95% CI 0.03 to 2.13).
Radiological failure
At six months, data were extractable from two RCTs totaling 110 teeth. The pooled results showed no statistically significant difference in radiological failure between calcium hydroxide and ZOE (RR 2.50, 95% CI 0.50 to 12.50; Analysis 18.1).
Ozalp 2005 provided data on radiological failure at 12 months. There was no statistically significant difference (RR 9.00, 95% CI 0.52 to 156.92).
Overall failure
Nadkarni 2000, which randomised 70 teeth, provided data on overall failure. There was no statistically significant difference at nine months (RR 0.50, 95% CI 0.10 to 2.56). Data at other time points were unavailable.
Pain
At six months, data were extractable from two RCTs totaling 110 teeth. The pooled RR was 1.00 (95% CI 0.14 to 6.90; Analysis 18.2).
Ozalp 2005, which randomised 40 teeth, provided data on pain at 12 months. There was no statistically significant difference (RR 3.00, 95% CI 0.13 to 69.52).
Pathological mobility
At six months, data were extractable from two RCTs totaling 110 teeth. The pooled RR was 1.00 (95% CI 0.14 to 6.90; Analysis 18.3).
Ozalp 2005, which randomised 40 teeth, also provided data on pathological mobility at 12 months. There was no statistically significant difference (RR 3.00, 95% CI 0.13 to 69.52).
Pathological radiolucency
Two trials (110 teeth) provided data on pathological radiolucency at six months (Nadkarni 2000; Ozalp 2005). The pooled results showed no statistically significant difference between calcium hydroxide and ZOE (RR 1.50, 95% CI 0.26 to 8.72; Analysis 18.4).
Ozalp 2005 provided data at 12 months. There was no statistically significant difference (RR 5.00, 95% CI 0.26 to 98.00).
Pathological root resorption
Ozalp 2005 provided data on pathological root resorption. There was no pathological root resorption in any of the participants regardless of the time of assessment.
Filling material anomaly
Ozalp 2005, which randomised 40 teeth, provided data on filling material anomaly. There was no filling material anomaly in any of the participants regardless of the time of assessment.
Sealapex versus calcium hydroxide
Ozalp 2005, which randomised 40 teeth, assessed Sealapex (eugenol‐free calcium hydroxide) versus calcium hydroxide based on clinical failure, radiological failure, pain, pathological mobility, pathological radiolucency, pathological root resorption and filling material anomaly. There was no statistically significant difference for any outcome at either six or 12 months (Table 35).
| Outcome | Time point (months) | No. of studies | Risk ratio (95% CI) |
| Clinical failure | 6 | 1 | 1.00 (0.07 to 14.90) |
| 12 | 1 | 0.50 (0.10 to 2.43) | |
| Radiological failure | 6 and 12 | 1 | 0.50 (0.10 to 2.43) |
| Pain | 6 and 12 | 1 | 1.00 (0.07 to 14.90) |
| Pathological mobility | 6 and 12 | 1 | 1.00 (0.07 to 14.90) |
| Pathological radiolucency | 6 and 12 | 1 | 0.20 (0.01 to 3.92) |
| Pathological root resorption | 6 and 12 | 1 | 5.00 (0.26 to 98.00) |
| Filling material anomaly | 6 and 12 | 1 | Not estimable* |
*due to lack of events
Abbreviations ‐ CI: confidence interval; Sealapex: eugenol‐free CH; CH: calcium hydroxide.
Vitapex versus calcium hydroxide
Ozalp 2005, which randomised 40 teeth, assessed Vitapex versus calcium hydroxide based on clinical failure, radiological failure, pain, pathological mobility, pathological radiolucency, pathological root resorption and filling material anomaly. There was no statistically significant difference for any outcome at either six or 12 months (Table 36).
| Outcome | Time point (months) | No. of studies | Risk ratio (95% CI) |
| Clinical failure | 6 | 1 | 0.33 (0.01 to 7.72) |
| 12 | 1 | 0.11 (0.01 to 1.94) | |
| Radiological failure | 6 and 12 | 1 | 0.11 (0.01 to 1.94) |
| Pain | 6 and 12 | 1 | 0.33 (0.01 to 7.72) |
| Pathological mobility | 6 and 12 | 1 | 0.33 (0.01 to 7.72) |
| Pathological radiolucency | 6 and 12 | 1 | 0.20 (0.01 to 3.92) |
| Pathological root resorption | 6 and 12 | 1 | Not estimable* |
| Filling material anomaly | 6 and 12 | 1 | 3.00 (0.13 to 69.52) |
*due to lack of events
Abbreviations ‐ CI: confidence interval; Vitapex: CH/iodoform; CH: calcium hydroxide.
Metapex versus zinc oxide and eugenol (ZOE)
Clinical failure
Data were extractable from two trials, totaling 62 teeth (Al‐Ostwani 2016; Subramaniam 2011). There were no statistically significant differences at six (RR 0.60, 95% CI 0.08 to 4.29) and 12 months (RR 0.71, 95% CI 0.15 to 3.33; Analysis 19.1).
Radiological failure
At six and 12 months, data were extractable from two trials, totaling 62 teeth. There was no statistically significant difference (RR 1.00, 95% CI 0.31 to 3.27; Analysis 19.2).
Pain
At six and 12 months, one trial, which randomised 30 teeth, assessed pain (Subramaniam 2011). There was no statistically significant difference (RR 0.33, 95% CI 0.01 to 7.58).
Pathologic mobility
At six and 12 months, one trial, which randomised 30 teeth, assessed pathologic mobility (Subramaniam 2011). There was no statistically significant difference (RR 0.33, 95% CI 0.01 to 7.58).
Soft tissue pathology
At six and 12 months, one trial, which randomised 30 teeth, assessed soft tissue pathology (Subramaniam 2011). There was no soft tissue pathology in any of the participants regardless of the intervention.
Adjacent tissue inflammation
At six and 12 months, one trial, which randomised 30 teeth, assessed adjacent tissue inflammation (Subramaniam 2011). There were no adjacent tissue inflammation in any of the participants regardless of the intervention.
Pathologic radiolucency
At six and 12 months, data were extractable from two trials, totaling 62 teeth. There was no pathologic radiolucency in one trial; for the remaining trial, there was no statistically significant difference (RR 1.33, 95 CI 0.35 to 5.03) (Al‐Ostwani 2016).
Pathologic root resorption
At six and 12 months, one trial, which randomised 30 teeth, assessed adjacent tissue inflammation (Subramaniam 2011). There was no statistically significant difference (RR 0.33, 95% CI 0.01 to 7.58).
Metapex versus Endoflas
Clinical failure
At six months, data were extractable from two trials totaling 92 teeth. In one trial, there was no clinical failure in any of the participants regardless of the intervention. For the remaining trial, there was no statistically significant difference (RR 0.33, 95% CI 0.01 to 7.58; Analysis 20.1).
At 12 months, one trial, which randomised 30 teeth, assessed clinical failure (Subramaniam 2011). There was no statistically significant difference (RR 0.33, 95% CI 0.01 to 7.58).
Radiological failure
At six months, data were extractable from two trials totaling 92 teeth. There was no statistically significant difference (RR 2.02, 95% CI 0.79 to 5.15; Analysis 20.2).
At 12 months, one trial, which randomised 30 teeth, assessed radiological failure (Subramaniam 2011). There was no statistically significant difference (RR 0.35, 95% CI 0.02 to 8.39).
Pain
At six months, data were extractable from two trials totaling 92 teeth. In one trial, there was no pain in any of the participants regardless of the intervention. For the remaining trial, there was no statistically significant difference (RR 0.33, 95% CI 0.01 to 7.58; Analysis 20.3).
At 12 months, one trial, which randomised 30 teeth, assessed pain (Subramaniam 2011). There was no statistically significant difference (RR 0.35, 95% CI 0.02 to 8.39).
Soft tissue pathology
At six months, data were extractable from two trials totaling 92 teeth. In one trial, there was no soft tissue pathology in any of the participants regardless of the intervention. For the remaining trial, there was no statistically significant difference (RR 0.33, 95% CI 0.01 to 7.58; Analysis 20.4).
At 12 months, one trial, which randomised 30 teeth, assessed soft tissue pathology (Subramaniam 2011). There was no statistically significant difference (RR 0.35, 95% CI 0.02 to 8.39).
Pathological mobility
At six months, data were extractable from two trials totaling 92 teeth. In the two trials, there was no pathological mobility in any of the participants regardless of the intervention (Analysis 20.5).
At 12 months, one trial, which randomised 30 teeth, assessed pathological mobility (Subramaniam 2011). There was no pathological mobility in any of the participants regardless of the intervention.
Pathological radiolucency
At six months, data were extractable from two trials totaling 92 teeth. There was no statistically significant difference (RR 2.02, 95% CI 0.79 to 5.15; Analysis 20.6).
At 12 months, one trial, which randomised 30 teeth, assessed pathological radiolucency (Subramaniam 2011). There was no statistically significant difference (RR 0.35, 95% CI 0.02 to 8.39).
Pathological root resorption
At six months, data were extractable from two trials totaling 92 teeth. In the two trials, there was no pathological root resorption in any of the participants regardless of the intervention (Analysis 20.7).
At 12 months, one trial, which randomised 30 teeth, assessed pathological root resorption (Subramaniam 2011). There was no pathological root resorption in any of the participants regardless of the intervention.
Succedaneous tooth anomaly (radiographically)
One trial, which randomised 30 teeth, assessed Metapex versus Endoflas based on unerupted succedaneous tooth anomaly (radiographically) (Subramaniam 2011). There was no cases in any of the participants regardless of the delay.
Metapex versus RC Fill
One trial, which randomised 64 teeth, assessed Metapex versus RC Fill based on pain, pathological radiolucency, pathological root resorption and filling material anomaly (Ramar 2010). There was no statistically significant difference for any outcome at six months (pain: RR 0.38, 95% CI 0.02 to 8.91; pathological radiolucency and filling material anomaly: RR 0.10, 95% CI 0.01 to 1.78; pathological root resorption: RR 2.27, 95% CI 0.87 to 5.89).
Metapex compared with Endoflas chlorophenol free (Endoflas‐CF)
One trial, which randomised 32 teeth, assessed Metapex versus Endoflas‐CF based on clinical failure and radiologic failure (pathologic radiolucency) (Al‐Ostwani 2016). There was no statistically significant differences for clinical failure at six (RR 3.00, 95% CI 0.13 to 68.57) and 12 months (RR 1.00, 95% CI 0.16 to 6.25), and for radiological failure (pathologic radiolucency) at six and 12 months (RR 1.33, 95% CI 0.35 to 5.03).
Metapex compared with zinc oxide and propolis (ZOP)
One trial, which randomised 32 teeth, assessed Metapex versus Endoflas‐CF based on clinical failure and radiologic failure (pathologic radiolucency) (Al‐Ostwani 2016). There were no statistically significant differences for clinical failure at six (RR 3.00, 95% CI 0.13 to 68.57) and 12 months (RR 2.00, 95% CI 0.20 to 19.91), and for radiological failure (pathologic radiolucency) at six (RR 1.33, 95% CI 0.35 to 5.03) and 12 months (RR 0.80, 95% CI 0.26 to 2.45).
Sealapex versus zinc oxide and eugenol (ZOE)
One trial, which randomised 40 teeth, assessed Sealapex (eugenol‐free calcium hydroxide) versus ZOE based on clinical failure, radiological failure, pain, pathological mobility, pathological radiolucency, pathological root resorption and filling material anomaly (Ozalp 2005). There was no statistically significant difference for any outcome at either six or 12 months. For clinical failure, the RR was 3.00 (95% CI 0.13 to 69.52) at six months and 5.00 (95% CI 0.26 to 98.00) at 12 months. For radiological failure and pathological root resorption, the RR was 5.00 (95% CI 0.26 to 98.00) at six and 12 months. For pain and pathological mobility, the RR was 3.00 (95% CI 0.13 to 69.52) at six and 12 months. There was no pathological radiolucency or filling material anomaly in any of the participants.
Vitapex versus Sealapex
One trial, which randomised 40 teeth, assessed Vitapex (calcium hydroxide/iodoform) versus Sealapex (eugenol‐free calcium hydroxide) based on clinical failure, radiological failure, pain, pathological mobility, pathological radiolucency, pathological root resorption and filling material anomaly (Ozalp 2005). There was no statistically significant difference for any outcome at either six or 12 months (Table 37).
| Outcome | Time point (months) | No. of studies | Risk ratio (95% CI) |
| Clinical failure | 6 | 1 | 0.33 (0.01 to 7.72) |
| 12 | 1 | 0.20 (0.01 to 3.92) | |
| Radiological failure | 6 and 12 | 1 | 0.20 (0.01 to 3.92) |
| Pain | 6 and 12 | 1 | 0.33 (0.01 to 7.72) |
| Pathological mobility | 6 and 12 | 1 | 0.33 (0.01 to 7.72) |
| Pathological radiolucency | 6 and 12 | 1 | Not estimable* |
| Pathological root resorption | 6 and 12 | 1 | 0.20 (0.01 to 3.92) |
| Filling material anomaly | 6 and 12 | 1 | 3.00 (0.13 to 69.52) |
*due to lack of events
Abbreviations ‐ CI: confidence interval; Vitapex: CH/iodoform; CH: calcium hydroxide; Sealapex: eugenol‐free CH.
Vitapex versus zinc oxide and eugenol (ZOE)
Clinical failure
At six months, data were extractable from four RCTs totaling 287 teeth. In three of the trials, there was no clinical failure in any of the participants regardless of the intervention. From the remaining trial, the results showed no statistically significant difference in clinical failure with Vitapex compared with ZOE (RR 0.33, 95% CI 0.01 to 7.84). At 12 months, in two trials, there was no clinical failure in any of the participants regardless of the intervention. From the two remaining trials, the pooled results showed a statistically significant difference (RR 4.75, 95% CI 1.21 to 18.55) with evidence of statistical heterogeneity among included trials (I² = 78%; Analysis 21.1). Pramila 2016 (86 teeth randomised) assessed clinical failure at 30 months, and reported no failures.
Radiological failure
At six months, data were extractable from four RCTs totaling 287 teeth. In one of the trials, there was no radiological failure in any of the participants regardless of the intervention. From the three remaining trials, the pooled results showed no statistically significant difference in radiological failure with Vitapex compared with ZOE (RR 2.36, 95% CI 0.86 to 6.50). At 12 months, the pooled results showed a statistically significant difference (RR 6.56, 95% CI 2.58 to 16.67), with evidence of statistical heterogeneity among included trials (I² = 82%; Analysis 21.2). At 30 months, one trial, which randomised 86 teeth, assessed radiological failure, and there was a statistically significant difference (RR 19.00, 95% CI 1.14 to 316.52) (Pramila 2016).
Overall failure
Data were extractable from two trials totaling 140 teeth. There was no statistically significant difference at six (RR 1.89, 95% CI 0.63 to 5.66) and 12 months (RR 2.56, 95% CI 0.89 to 7.32; Analysis 21.3).
An additional trial, which randomised 58 teeth, did not assess the outcome at a fixed time point but at a mean (range) follow‐up of 12 (10 to 16) months (RR 1.01, 95% CI 0.63 to 1.64) (Mortazavi 2004).
Pain
At six and 12 months, data were extractable from three RCTs totaling 180 teeth. There was no pain in any of the participants in either trial or intervention (Analysis 21.4). At 30 months, one trial, which randomised 86 teeth, assessed pain, and there was no cases (Pramila 2016).
Mortazavi 2004, which randomised 58 teeth, did not assess the outcome at a fixed time point but at a mean (range) follow‐up of 12 (10 to 16) months. There was no pain in any of the participants regardless of the intervention.
Pathological mobility
At six and 12 months, data were extractable from three RCTs totaling 180 teeth. In two of the trials, there was no pathological mobility in any of the participants at either time point. For the remaining trial, the six‐ and 12‐month results showed no statistically significant difference in pathological mobility with Vitapex compared with ZOE (six months: RR 0.33, 95% CI 0.01 to 7.84; 12 months: RR 1.00, 95% CI 0.07 to 15.18; Analysis 21.5). At 30 months, one trial, which randomised 86 teeth, assessed pathologic mobility, and there was no cases (Pramila 2016).
One additional trial, which randomised 58 teeth, did not assess the outcome at a fixed time point but at a mean (range) follow‐up of 12 (10 to 16) months (Mortazavi 2004). The RR was 0.14 (95% CI 0.01 to 2.41).
Soft tissue pathology
Three trials, randomising 155 teeth, assessed soft tissue pathology (Mortazavi 2004; Trairatvorakul 2008; Pramila 2016). There was no soft tissue pathology in any of the participants in either trial. At 30 months, one trial, which randomised 86 teeth, assessed soft tissue pathology, and there was no cases (Pramila 2016).
Pathological radiolucency
One trial, which randomised 40 teeth, assessed pathological radiolucency (Ozalp 2005). There was no pathological radiolucency in any of the participants regardless of the intervention, at any time point.
One additional trial, which randomised 58 teeth, did not assess the outcome at a fixed time point but at a mean (range) follow‐up of 12 (10 to 16) months (RR 0.14, 95% CI 0.01 to 2.41) (Mortazavi 2004).
Pathological root resorption
One trial provided data on pathological root radiolucency at 12 months (Ozalp 2005). There were no cases in any of the participants regardless of the intervention.
Filling material anomaly
One trial, which randomised 40 teeth, assessed filling material anomaly (Ozalp 2005). There was no statistically significant difference between groups at either six months (RR 3.00, 95% CI 0.13 to 69.52) or 12 months (RR 7.00, 95% CI 0.38 to 127.33).
Unerupted succedaneous tooth anomaly (radiographically)
One trial, which randomised 86 teeth, assessed unerupted succedaneous tooth anomaly (radiographically) at six, 12 and 30 months (Pramila 2016). There was no cases in any of the participants regardless of the intervention.
Vitapex (calcium hydroxide (calcium hydroxide)/iodoform) versus 3Mix (ciprofloxacin + metronidazole + minocycline)
One trial, which randomised 50 teeth, assessed Vitapex versus 3Mix (ciprofloxacin + metronidazole + minocycline) based on clinical failure, radiological failure, pain, soft tissue pathology, pathological mobility, pathological radiolucency, pathological root resorption and pulp canal obliteration (Nakornchai 2010). At 12 months, there was a statistically significant difference in favour of Vitapex for pathological radiolucency (RR 2.75, 95% CI 1.01 to 7.48). There was no other statistically significant difference for any other outcome at either six or 12 months (Table 38).
| Outcome | Time point (months) | No. of studies | Risk ratio (95% CI) |
| Clinical failure | 6 | 1 | Not estimable* |
| 12 | 1 | 1.0 (0.07 to 15.12) | |
| Radiological failure | 6 | 1 | 1.25 (0.38 to 4.12) |
| 12 | 1 | 1.83 (0.80 to 4.19) | |
| Pain | 6 | 1 | Not estimable* |
| 12 | 1 | 3.00 (0.13 to 70.30) | |
| Soft tissue pathology | 6 | 1 | Not estimable* |
| 12 | 1 | 1.0 (0.07 to 15.12) | |
| Pathological mobility | 6 and 12 | 1 | Not estimable* |
| Pathological radiolucency | 6 | 1 | 1.50 (0.27 to 8.22) |
| 12 | 1 | 2.75 (1.01 to 7.48) | |
| Pathological root resorption | 6 and 12 | 1 | 0.20 (0.01 to 3.97) |
| Pulp canal obliteration | 6 | 1 | Not estimable* |
| 12 | 1 | 0.20 (0.01 to 3.97) |
*due to lack of events
Abbreviations ‐ CI: confidence interval; Vitapex: CH/iodoform; CH: calcium hydroxide; 3Mix: ciprofloxacin + metronidazole + minocycline.
Vitapex versus RC Fill
One trial, which randomised 86 teeth, assessed Vitapex versus RC Fill based on clinical failure, radiological failure, overall failure, pain, pathologic mobility, soft tissue pathology, and unerupted succedaneous tooth anomaly (radiographically) (Pramila 2016). At six, 12 and 30 months, there was no cases of clinical failure, pain, pathologic mobility, soft tissue pathology, and unerupted succedaneous tooth anomaly (radiographically) in any of the participants regardless of the intervention. For radiological/overall failure, there were no statistically significant differences at six (RR 1.67, 95% CI 0.42 to 6.54), 12 (RR 2.00, 95% CI 0.65 to 6.15) and 30 months (RR 1.80, 95% CI 0.66 to 4.93).
Vitapex versus ZOE + calcium hydroxide + iodoform (unnamed product)
One trial, which randomised 109 teeth, assessed Vitapex versus ZOE+calcium hydroxide+iodoform (unnamed product) based on clinical failure and radiological failure (Chen 2015). At 12 months, there was a statistically significant difference in favour of ZOE+calcium hydroxide + iodoform (unnamed product) for clinical failure and radiological failure (clinical failure: RR 21.79, 95% CI 1.32 to 360.78; radiological failure: RR 42.63, 95% CI 2.65 to 685.54). There was no other statistically significant difference at six months (Table 39).
| Outcome | Time point (months) | No. of studies | Risk ratio (95% CI) |
| Clinical failure | 6 | 1 | Not estimable* |
| 12 | 1 | 21.79 (1.32, 360.78) | |
| Radiological failure | 6 | 1 | 6.63 (0.35, 125.41) |
| 12 | 1 | 42.63 (2.65, 685.54) |
*due to lack of events
Abbreviations ‐ CI: confidence interval; Vitapex: CH/iodoform; MPRCF: ZOE (zinc oxide eugenol), calcium hydroxide, iodoform.
Endoflas versus zinc oxide and eugenol (ZOE)
Clinical failure
At six months, data were extractable from two trials, totaling 80 teeth. There was no statistically significant difference (RR 0.26, 95% CI 0.05 to 1.50; Analysis 22.1).
At 12 months, one trial, which randomised 30 teeth, assessed clinical failure (Subramaniam 2011). There was no statistically significant difference (RR 1.00, 95% CI 0.07 to 14.55).
Radiological failure
At six months, data were extractable from two trials, totaling 80 teeth. There was no statistically significant difference (RR 0.26, 95% CI 0.05 to 1.50; Analysis 22.2).
At 12 months, one trial, which randomised 30 teeth, assessed radiological failure (Subramaniam 2011). There was no statistically significant difference (RR 1.00, 95% CI 0.07 to 14.55).
Pain
At six months, data were extractable from two trials, totaling 80 teeth. There was no statistically significant differences (RR 0.26, 95% CI 0.05 to 1.50; Analysis 22.3).
At 12 months, one trial, which randomised 30 teeth, assessed pain (Subramaniam 2011). There was no statistically significant difference (RR 1.00, 95% CI 0.07 to 14.55).
Pathologic mobility
At six months, data were extractable from two trials, totaling 80 teeth. There was no statistically significant difference (RR 0.16, 95% CI 0.02 to 1.25; Analysis 22.4).
At 12 months, one trial, which randomised 30 teeth, assessed pathologic mobility (Subramaniam 2011). There was no statistically significant difference (RR 0.33, 95% CI 0.01 to 7.58).
Soft tissue pathology
At six months, data were extractable from two trials, totaling 80 teeth. There was no cases for one trial; for the remaining trial, there was no statistically significant difference (RR 3.00, 95% CI 0.13 to 68.26) (Subramaniam 2011).
At 12 months, one trial, which randomised 30 teeth, assessed soft tissue pathology (Subramaniam 2011). There was no statistically significant difference (RR 3.00, 95% CI 0.13 to 68.26).
Adjacent tissue inflammation
There were no adjacent tissue inflammation in any of the participants regardless of the intervention.
Pathologic radiolucency
At six months, data were extractable from two trials, totaling 80 teeth. There was no statistically significant difference (RR 0.64, 95% CI 0.11 to 3.63; Analysis 22.5).
At 12 months, one trial, which randomised 30 teeth, assessed soft tissue pathology (Subramaniam 2011). There was no statistically significant difference (RR 3.00, 95% CI 0.13 to 68.26).
Pathologic root resorption
At six and 12 months, one trial, which randomised 30 teeth, assessed pathologic root resorption (Subramaniam 2011). There was no statistically significant difference (RR 0.33, 95% CI 0.01 to 7.58).
Filling material anomaly
One trial, which randomised 50 teeth, assessed filling material anomaly at six months (Rewal 2014). There was no statistically significant difference (RR 0.65, 95% CI 0.29 to 1.42).
Endoflas versus RC Fill
One trial, which randomised 66 teeth, assessed Endoflas versus RC Fill based on pain, pathological radiolucency, pathological root resorption and filling material anomaly (Ramar 2010). There was no statistically significant difference for any outcome at six months. For pain, the RR was 0.35 (95% CI 0.01 to 8.38); for pathological radiolucency and filling material anomaly, the RR was 0.10 (95% CI 0.01 to 1.68); for pathological root resorption, the RR was 0.85 (95% CI 0.25 to 2.88).
Endoflas‐CF versus ZOE
One trial, which randomised 32 teeth, assessed Endoflas‐CF versus ZOE based on clinical failure and radiologic failure (pathologic radiolucency) (Al‐Ostwani 2016). There were no statistically significant differences for clinical failure at six (RR 0.33, 95% CI 0.01 to 7.92) and 12 months (RR 1.00, 95% CI 0.16 to 6.25), and for radiological failure (pathologic radiolucency) at six and 12 months (RR 1.00, 95% CI 0.24 to 4.23).
Endoflas‐CF versus zinc oxide and propolis (ZOP)
One trial, which randomised 32 teeth, assessed Endoflas‐CF versus ZOP based on clinical failure and radiologic failure (pathologic radiolucency) (Al‐Ostwani 2016). There was no clinical failure at six months; there were no statistically significant differences for clinical failure at 12 months (RR 2.00, 95% CI 0.20 to 19.91), and for radiological failure (pathologic radiolucency) at six (RR 1.00, 95% CI 0.24 to 4.23) and 12 months (RR 0.60, 95% CI 0.17 to 2.10).
ZOE versus ozonated sesame oil‐zinc oxide (ZO)
One trial, which randomised 60 teeth, assessed ZOE versus ozonated sesame oil‐ZO based on clinical failure, radiological failure, overall failure, pathologic radiolucency at 12 months (Chandra 2014). For clinical failure, there was no statistically significant difference (RR 3.00, 95% CI 0.13 to 70.83). For radiological/overall failure (pathologic radiolucency), there was a statistically significant difference (RR 4.50, 95% CI 1.03 to 19.62).
ZOE versus RC Fill
One trial, which randomised 86 teeth, assessed ZOE versus RC Fill based on clinical failure, radiological failure, overall failure, pain, pathologic mobility, soft tissue pathology, and unerupted succedaneous tooth anomaly (radiographically) (Pramila 2016). At six, 12 and 30 months, there was no cases of clinical failure, pain, pathologic mobility, soft tissue pathology, and unerupted succedaneous tooth anomaly (radiographically) in any of the participants regardless of the intervention. For radiological/overall failure, there were no statistically significant differences at six (RR 0.14, 95% CI 0.01 to 2.68), 12 (RR 0.11, 95% CI 0.01 to 2.00) and 30 months (RR 0.09, 95% CI 0.01 to 1.59).
ZOE versus zinc oxide and propolis (ZOP)
One trial, which randomised 32 teeth, assessed ZOE versus ZOP based on clinical failure and radiologic failure (pathologic radiolucency) (Al‐Ostwani 2016). There were no statistically significant differences for clinical failure at six (RR 3.00, 95% CI 0.13 to 68.57) and 12 months (RR 2.00, 95% CI 0.20 to 19.91), and for radiological failure (pathologic radiolucency) at six (RR 1.00, 95% CI 0.24 to 4.23) and 12 months (RR 0.60, 95% CI 0.17 to 2.10).
ZOE versus ZOE + calcium hydroxide + iodoform (unnamed product)
One trial, which randomised 104 teeth, provided data on clinical failure, radiological failure and filling material anomaly at six and 12 months (Chen 2015). There were no clinical or radiological failures in any of the participants regardless of the intervention. For filling material anomaly, there was no statistically significant difference at six months (RR 1.73, 95% CI 0.95 to 3.17), and a statistically significant difference at 12 months (RR 3.12, 95% CI 1.35 to 7.22).
Ciprofloxacin + metronidazole + minocycline (3Mix) versus ciprofloxacin + ornidazole + minocycline
One trial, which randomised 40 teeth, assessed 3Mix versus ciprofloxacin+ornidazole+minocycline based on clinical failure, pain, pathological mobility, soft tissue pathology and pathological radiolucency (i.e. radiological failure) (Pinky 2011). There was no clinical failure, pain, pathological mobility, soft tissue pathology in any of the participants regardless of the time point. There was no pathological radiolucency at six months in any of the participants, and there was no statistically significant difference at 12 months (RR 5.00, 95% CI 0.26 to 98.00).
MTA versus IRM
One trial, which randomised 50 teeth, assessed MTA versus IRM based on clinical failure, radiological failure, overall failure, pain, pathological mobility, soft tissue pathology (Arikan 2016). At six and 12 months, there was no clinical failure, pain, pathological mobility and soft tissue pathology. For radiological/overall failure, there was no statistically significant difference at six (RR 0.20, 95% CI 0.01 to 3.97) or 12 months (RR 0.50, 95% CI 0.10 to 2.49).
MTA versus gutta‐percha/AH‐Plus
One trial, which randomised 20 teeth, assessed MTA versus gutta‐percha/AH‐Plus based on clinical failure, radiological failure, overall failure, pain, pathologic mobility, soft tissue pathology and pathologic radiolucency (Bezgin 2016). At six months, there was no failure. At 12 and 24 months, there were no cases of pain and pathologic mobility. At 12 months, there was no statistically significant difference for clinical failure/soft tissue pathology (RR 0.20, 95 CI 0.01 to 3.70), radiological failure/pathologic radiolucency and overall failure (RR 0.25, 95 CI 0.03 to 1.86). At 24 months, there was no statistically significant difference for clinical failure/soft tissue pathology (RR 0.14, 95 CI 0.01 to 2.45); at 24 months, there was a statistically significant difference for radiological failure/pathologic radiolucency and overall failure (RR 0.14, 95 CI 0.02 to 0.96).
Pulpotomy versus pulpectomy
Four trials compared pulpotomy with pulpectomy. Two trials were at high risk of bias, and, for two other trials, the risk of bias was unclear. We judged no trials comparing pulpotomy versus pulpectomy to be at low risk of bias.
Formocresol pulpotomy versus calcium hydroxide pulpectomy
One trial, which randomised 51 teeth, assessed formocresol pulpotomy versus calcium hydroxide pulpectomy (Coser 2008). There were no data provided for any outcomes.
Ferric sulphate/zinc oxide and eugenol (ZOE) pulpotomy versus Sedanol (ZOE) pulpectomy
One trial, which randomised 291 teeth, assessed ferric sulphate pulpotomy versus Sedanol pulpectomy based on radiological failure, pain, soft tissue pathology, pathological radiolucency, pathological root resorption and pulp canal obliteration (Casas 2004). There were statistically significant differences for pathological root resorption (RR 21.04, 95% CI 1.28 to 346.39) and pulp canal obliteration (RR 27.05, 95% CI 1.66 to 441.49) at 24 months. There was no statistically significant difference for any other outcome (Table 40).
| Outcome | Time point (months) | No. of studies | Risk ratio (95% CI) |
| Pain | 24 | 1 | 1.80 (0.07 to 43.88) |
| Soft tissue pathology | 24 | 1 | 4.21 (0.22 to 80.70) |
| Pathological radiolucency | 24 | 1 | 0.60 (0.25 to 1.46) |
| Pathological root resorption | 24 | 1 | 21.04 (1.28 to 346.39) |
| Pulp canal obliteration | 24 | 1 | 27.05 (1.66 to 441.49) |
Abbreviations ‐ CI: confidence interval; FS: ferric sulphate; Sedanol=ZOE: zinc oxide and eugenol.
Ferric sulphate/MTA pulpotomy versus ZOE pulpectomy
One trial, which randomised 172 teeth, assessed ferric sulphate/MTA pulpotomy versus ZOE pulpectomy based on clinical failure and radiological failure (Nguyen 2017). There were no statistically significant differences for clinical failure at 12 (RR 3.61, 95% CI 0.18 to 74.16) and 18 months (RR 2.16, 95% CI 0.23 to 20.35), and for radiological failure at 12 (RR 0.36, 95% CI 0.09 to 1.39) and 18 months (RR 0.84, 95% CI 0.29 to 2.39).
3Mix (ciprofloxacin + metronidazole + minocycline) pulpotomy versus 3Mix pulpectomy
One trial, which randomised 60 teeth, assessed 3Mix pulpotomy versus 3Mix pulpectomy based on clinical failure, pain, pathological mobility, soft tissue pathology and pathological radiolucency (i.e. radiological failure) (Prabhakar 2008). There was a statistically significant difference at six months for pathological radiolucency (RR 23.00, 95% CI 1.42 to 373.46), that was not maintained at 12 months. There was no statistically significant difference for the other outcomes at any time point (Table 41).
| Outcome | Time point (months) | No. of studies | Risk ratio (95% CI) |
| Clinical failure | 6 | 1 | 3.00 (0.13, 70.83) |
| 12 | 1 | 5.00 (0.25, 99.95) | |
| Pain | 6 | 1 | 3.00 (0.13, 70.83) |
| 12 | 1 | 5.00 (0.25, 99.95) | |
| Soft tissue pathology | 6 | 1 | Not estimable* |
| 12 | 1 | 3.00 (0.13, 70.83) | |
| Pathologic mobility | 6 and 12 | 1 | 3.00 (0.13, 70.83) |
| Pathologic radiolucency | 6 | 1 | 23.00 (1.42, 373.46) |
| 12 | 1 | 11.00 (0.64, 190.53) |
*due to lack events
Abbreviations ‐ CI: confidence interval; 3Mix: ciprofloxacin + metronidazole + minocycline.
Direct pulp capping versus direct pulp capping
Seven trials compared direct pulp capping using different medicaments. Six trials were at unclear risk of bias and one trial was at high risk of bias.
Calcium hydroxide versus formocresol
One trial, which randomised 120 teeth, assessed calcium hydroxide versus formocresol based on clinical failure, radiological failure, pain, soft tissue pathology, pathological radiolucency and pathological root resorption (Aminabadi 2010). There was a statistically significant difference for clinical failure (RR 3.83, 95% CI 1.68 to 8.74), radiological failure (RR 3.11, 95% CI 1.61 to 6.02) and pathological radiolucency (RR 5.00, 95% CI 1.14 to 21.86) at 24 months. There was no statistically significant difference for any other outcome or time point (Table 42).
| Outcome | Time point (months) | No. of studies | Risk ratio (95% CI) |
| Clinical failure | 24 | 1 | 3.83 (1.68 to 8.74) |
| Radiological failure | 24 | 1 | 3.11 (1.61 to 6.02) |
| Pain | 6 | 1 | 7.00 (0.37 to 132.66) |
| 12 | 1 | 9.00 (0.50 to 163.59) | |
| 24 | 1 | 4.00 (0.89 to 18.06) | |
| Soft tissue pathology | 6 | 1 | 7.00 (0.37 to 132.66) |
| 12 | 1 | 2.5 (0.50 to 12.39) | |
| 24 | 1 | 1.8 (0.64 to 5.06) | |
| Pathological radiolucency | 6 | 1 | Not estimable* |
| 12 | 1 | 4.00 (0.46 to 34.75) | |
| 24 | 1 | 5.00 (1.14 to 21.86) | |
| Pathological root resorption | 6 | 1 | Not estimable* |
| 12 | 1 | 3.33 (0.96 to 11.51) | |
| 24 | 1 | 2.00 (0.87 to 4.60) |
*due to lack of events
Abbreviations ‐ CH: calcium hydroxide; CI: confidence interval; FC: formocresol.
Acetone‐based total‐etch adhesive versus calcium hydroxide
One trial, which randomised 40 teeth, assessed acetone‐based total‐etch adhesive versus calcium hydroxide based on clinical failure, radiological failure, pain, pathological radiolucency and pathological root resorption (Demir 2007). There was no clinical failure, radiological failure, pain, pathological radiolucency or pathological root resorption in any of the participants regardless of the time point.
Non‐rinse conditioner + acetone‐based total‐etch adhesive versus calcium hydroxide
One trial, which randomised 40 teeth, assessed non‐rinse conditioner + acetone‐based total‐etch adhesive versus calcium hydroxide based on clinical failure, radiological failure, pain, pathological radiolucency and pathological root resorption (Demir 2007). There was no clinical failure, pain or pathological root resorption in any of the participants regardless of the delay. There was no radiological failure or pathological radiolucency in any of the participants regardless of the intervention at six months. For radiological failure and pathological radiolucency at 12 and 24 months, the RR was 3.00 (95% CI 0.13 to 69.52).
Total‐etching with 36% phosphoric acid + acetone‐based total‐etch adhesive versus calcium hydroxide
One trial, which randomised 40 teeth, assessed total‐etching with 36% phosphoric acid + acetone‐based total‐etch adhesive versus calcium hydroxide based on clinical failure, radiological failure, pain, pathological radiolucency and pathological root resorption (Demir 2007). There was no statistically significant difference for any outcome at six, 12 or 24 months (Table 43).
| Outcome | Time point (months) | No. of studies | Risk ratio (95% CI) |
| Clinical failure | 6 | 1 | Not estimable* |
| 12 and 24 | 1 | 3.00 (0.13 to 69.52) | |
| Radiological failure | 6 | 1 | Not estimable* |
| 12 | 1 | 3.00 (0.13 to 69.52) | |
| 24 | 1 | 7.00 (0.38 to 127.33) | |
| Pain | 6 | 1 | Not estimable* |
| 12 and 24 | 1 | 3.00 (0.13 to 69.52) | |
| Pathological radiolucency | 6 | 1 | Not estimable* |
| 12 | 1 | 3.00 (0.13 to 69.52) | |
| 24 | 1 | 7.00 (0.38 to 127.33) | |
| Pathological root resorption | 6, 12 and 24 | 1 | Not estimable* |
*due to lack of events
Abbreviations ‐ CH: calcium hydroxide; CI: confidence interval
Self etch adhesive system + acetone‐based total‐etch adhesive versus calcium hydroxide
One trial, which randomised 40 teeth, assessed self etch adhesive system + acetone‐based total‐etch adhesive versus calcium hydroxide based on clinical failure, radiological failure, pain, pathological radiolucency and pathological root resorption (Demir 2007). There was no statistically significant difference for any outcome at six, 12 or 24 months (Table 44).
| Outcome | Time point (months) | No. of studies | Risk ratio (95% CI) |
| Clinical failure | 6, 12 and 24 | 1 | 3.00 (0.13 to 69.52) |
| Radiological failure | 6 | 1 | Not estimable* |
| 12 and 24 | 1 | 3.00 (0.13 to 69.52) | |
| Pain | 6 | 1 | Not estimable* |
| 12 and 24 | 1 | 3.00 (0.13 to 69.52) | |
| Pathological radiolucency | 6 | 1 | Not estimable* |
| 12 and 24 | 1 | 3.00 (0.13 to 69.52) | |
| Pathological root resorption | 6, 12 and 24 | 1 | Not estimable* |
*due to lack of events
Abbreviations ‐ CH: calcium hydroxide; CI: confidence interval
Enamel matrix derivative (EMD) versus calcium hydroxide
One trial, which randomised 90 teeth, assessed EMD versus calcium hydroxide based on overall failure, pain, soft tissue pathology, pathological mobility and pathological root resorption (Garrocho‐Rangel 2009). For overall failure, the RR was 1.00 (95% CI 0.06 to 15.50) at six and 12 months. There was no pain, soft tissue pathology, pathological mobility or pathological root resorption in any of the participants regardless of the time point.
MTA versus calcium hydroxide
One trial, which randomised 50 teeth, assessed MTA versus calcium hydroxide based on clinical failure, radiological failure and pain (Tuna 2008). There were no clinical and radiological failures or pain in any of the participants regardless of the time point.
Non‐rinse conditioner + acetone‐based total‐etch adhesive versus acetone‐based total‐etch adhesive
One trial, which randomised 40 teeth, assessed non‐rinse conditioner + acetone‐based total‐etch adhesive versus acetone‐based total‐etch adhesive based on clinical failure, radiological failure, pain, pathological radiolucency and pathological root resorption (Demir 2007). There was no clinical failure, pain or pathological root resorption in any of the participants. There was no radiological failure or pathological radiolucency in any of the participants at six months. For radiological failure and pathological radiolucency, the RR was 3.00 (95% CI 0.13 to 69.52) at 12 and 24 months.
Total‐etching with 36% phosphoric acid + acetone‐based total‐etch adhesive versus acetone‐based total‐etch adhesive
One trial, which randomised 40 teeth, assessed total‐etching with 36% phosphoric acid + acetone‐based total‐etch adhesive versus acetone‐based total‐etch adhesive based on clinical failure, radiological failure, pain, pathological radiolucency and pathological root resorption (Demir 2007). There was no statistically significant difference for any outcome at six, 12 or 24 months (Table 45).
| Outcome | Time point (months) | No. of studies | Risk ratio (95% CI) |
| Clinical failure | 6 | 1 | Not estimable* |
| 12 and 24 | 1 | 3.00 (0.13 to 69.52) | |
| Radiological failure | 6 and 12 | 1 | 3.00 (0.13 to 69.52) |
| 24 | 1 | 7.00 (0.38 to 127.33) | |
| Pain | 6 | 1 | Not estimable* |
| 12 and 24 | 1 | 3.00 (0.13 to 69.52) | |
| Pathological radiolucency | 6 | 1 | Not estimable* |
| 12 and 24 | 1 | 3.00 (0.13 to 69.52) | |
| Pathological root resorption | 6, 12 and 24 | 1 | Not estimable* |
*due to lack of events
Abbreviation ‐ CI: confidence interval.
Self‐etch adhesive system + acetone‐based total‐etch adhesive versus acetone‐based total‐etch adhesive
One trial, which randomised 40 teeth, assessed self‐etch adhesive system + acetone‐based total‐etch adhesive versus acetone‐based total‐etch adhesive based on clinical failure, radiological failure, pain, pathological radiolucency and pathological root resorption (Demir 2007). There was no statistically significant difference for any outcome at six, 12 or 24 months (Table 46).
| Outcome | Time point (months) | No. of studies | Risk ratio (95% CI) |
| Clinical failure | 6, 12 and 24 | 1 | 3.00 (0.13 to 69.52) |
| Radiological failure | 6 | 1 | Not estimable* |
| 12 and 24 | 1 | 3.00 (0.13 to 69.52) | |
| Pain | 6 | 1 | Not estimable* |
| 12 and 24 | 1 | 3.00 (0.13 to 69.52) | |
| Pathological radiolucency | 6 | 1 | Not estimable* |
| 12 and 24 | 1 | 3.00 (0.13 to 69.52) | |
| Pathological root resorption | 6, 12 and 24 | 1 | Not estimable* |
*due to lack of events
Abbreviation ‐ CI: confidence interval
Total‐etching with 36% phosphoric acid + acetone‐based total‐etch adhesive versus non‐rinse conditioner + acetone‐based total‐etch adhesive
One trial, which randomised 40 teeth, assessed total‐etching with 36% phosphoric acid + acetone‐based total‐etch adhesive versus non‐rinse conditioner + acetone‐based total‐etch adhesive based on clinical failure, radiological failure, pain, pathological radiolucency and pathological root resorption (Demir 2007). There was no statistically significant difference for any outcome at six, 12 or 24 months (Table 47).
| Outcome | Time point (months) | No. of studies | Risk ratio (95% CI) |
| Clinical failure | 6 | 1 | Not estimable* |
| 12 and 24 | 1 | 3.00 (0.13 to 69.52) | |
| Radiological failure | 6 | 1 | Not estimable* |
| 12 | 1 | 3.00 (0.13 to 69.52) | |
| 24 | 1 | 7.00 (0.38 to 127.33) | |
| Pain | 6 | 1 | Not estimable* |
| 12 and 24 | 1 | 3.00 (0.13 to 69.52) | |
| Pathological radiolucency | 6 | 1 | Not estimable* |
| 12 | 1 | 3.00 (0.13 to 69.52) | |
| 24 | 1 | 7.00 (0.38 to 127.33) | |
| Pathological root resorption | 6, 12 and 24 | 1 | Not estimable* |
*due to lack of events
Abbreviations ‐ CI: confidence interval.
Self‐etch adhesive system + acetone‐based total‐etch adhesive versus non‐rinse conditioner + acetone‐based total‐etch adhesive
One trial, which randomised 40 teeth, assessed self‐etch adhesive system + acetone‐based total‐etch adhesive versus non‐rinse conditioner + acetone‐based total‐etch adhesive based on clinical failure, radiological failure, pain, pathological radiolucency and pathological root resorption (Demir 2007). There was no statistically significant difference for any outcome at six, 12 or 24 months (Table 48).
| Outcome | Time point (months) | No. of studies | Risk ratio (95% CI) |
| Clinical failure | 6, 12 and 24 | 1 | 3.00 (0.13 to 69.52) |
| Radiological failure | 6 | 1 | Not estimable* |
| 12 and 24 | 1 | 1.00 (0.07 to 14.90) | |
| Pain | 6 | 1 | Not estimable* |
| 12 and 24 | 1 | 3.00 (0.13 to 69.52) | |
| Pathological radiolucency | 6 | 1 | Not estimable* |
| 12 and 24 | 1 | 1.00 (0.07 to 14.90) | |
| Pathological root resorption | 6, 12 and 24 | 1 | Not estimable* |
*due to lack of events
Abbreviation ‐ CI: confidence interval.
Self‐etch adhesive system + acetone‐based total‐etch adhesive versus total‐etching with 36% phosphoric acid + acetone‐based total‐etch adhesive
One trial, which randomised 40 teeth, assessed self‐etch adhesive system + acetone‐based total‐etch adhesive versus total‐etching with 36% phosphoric acid + acetone‐based total‐etch adhesive based on clinical failure, radiological failure, pain, pathological radiolucency and pathological root resorption (Demir 2007). There was no statistically significant difference for any outcome at six, 12 or 24 months (Table 49).
| Outcome | Time point (months) | No. of studies | Risk ratio (95% CI) |
| Clinical failure | 6 | 1 | 3.00 (0.13 to 69.52) |
| 12 and 24 | 1 | 1.00 (0.07 to 14.90) | |
| Radiological failure | 6 | 1 | 0.33 (0.01 to 7.72) |
| 12 | 1 | 1.00 (0.07 to 14.90) | |
| 24 | 1 | 0.33 (0.04 to 2.94) | |
| Pain | 6 | 1 | Not estimable* |
| 12 | 1 | 3.00 (0.13 to 69.52) | |
| 24 | 1 | 1.00 (0.07 to 14.90) | |
| Pathological radiolucency | 6 | 1 | Not estimable* |
| 12 | 1 | 1.00 (0.07 to 14.90) | |
| 24 | 1 | 0.33 (0.04 to 2.94) | |
| Pathological root resorption | 6, 12 and 24 | 1 | Not estimable* |
*due to lack of events
Abbreviation ‐ CI: confidence interval.
Calcium‐enriched mixture (CEM) cement versus MTA
One trial, which randomised 42 teeth, assessed CEM cement versus MTA based on clinical failure, radiological failure, pain, soft tissue pathology, pathological radiolucency and pathological root resorption at six months, and overall failure at 20 month (Fallahinejad Ghajari 2013). At six months, there was no pain, radiological failure, pathological radiolucency and pathological root resorption in any participants regardless of the intervention. There were no statistically significant differences for clinical failure and soft tissue pathology (RR 3.00, 95% CI 0.13 to 69.70). At 20 months, there was no statistically significant difference for overall failure (RR 1.00, 95% CI 0.07 to 14.95).
MTA versus 3Mix
One trial, which randomised 160 teeth, assessed MTA versus 3Mix based on clinical failure, radiological failure, overall failure, pain, soft tissue pathology, pathologic radiolucency, pathologic root resorption at 12 months (Aminabadi 2016). There was a statistically significant difference for clinical and overall failure (RR 0.17, 95% CI 0.04 to 0.70), pain and soft tissue pathology (RR 0.08, 95% CI 0.01 to 0.61). There was no radiological failure.
MTA versus 3Mixtatin
One trial, which randomised 160 teeth, assessed MTA versus 3Mixtatin based on clinical failure, radiological failure, overall failure, pain, soft tissue pathology, pathologic radiolucency, pathologic root resorption at 12 months (Aminabadi 2016). There were no statistically significant differences for clinical and overall failure (RR 0.67, 95% CI 0.12 to 3.78), pain (RR 0.33, 95% CI 0.04 to 3.07) and soft tissue pathology (RR 3.00, 95% CI 0.13 to 71.51). There was no radiological failure.
MTA versus simvastatin
One trial, which randomised 160 teeth, assessed MTA versus simvastatin based on clinical failure, radiological failure, overall failure, pain, soft tissue pathology, pathologic radiolucency, pathologic root resorption at 12 months (Aminabadi 2016). There was a statistically significant difference for clinical and overall failure (RR 0.17, 95% CI 0.04 to 0.70), pain and soft tissue pathology (RR 0.08, 95% CI 0.01 to 0.61). There was no radiological failure.
3Mix versus 3Mixtatin
One trial, which randomised 160 teeth, assessed 3Mix versus 3Mixtatin based on clinical failure, radiological failure, overall failure, pain, soft tissue pathology, pathologic radiolucency, pathologic root resorption at 12 months (Aminabadi 2016). There were statistically significant differences for clinical, overall failure, pain (RR 4.00, 95% CI 1.22 to 13.11), and soft tissue pathology (RR 25.00, 95% CI 1.53 to 408.39). There was no radiological failure.
3Mix versus simvastatin
One trial, which randomised 160 teeth, assessed 3Mix versus simvastatin based on clinical failure, radiological failure, overall failure, pain, soft tissue pathology, pathologic radiolucency, pathologic root resorption at 12 months (Aminabadi 2016). There were no statistically significant differences for clinical, overall failure, pain and soft tissue pathology (RR 1.00, 95% CI 0.51 to 1.95). There was no radiological failure.
3Mixtatin versus simvastatin
One trial, which randomised 160 teeth, assessed 3Mixtatin versus simvastatin based on clinical failure, radiological failure, overall failure, pain, soft tissue pathology, pathologic radiolucency, pathologic root resorption at 12 months (Aminabadi 2016). There was a statistically significant difference for clinical, overall failure and pain (RR 0.25, 95% CI 0.08 to 0.82), and soft tissue pathology (RR 0.04, 95% CI 0.00 to 0.65). There was no radiological failure.
Calcium hydroxide cement (Dycal) versus calcium sulphate hemihydrate (DentoGen)
One trial, which randomised 40 teeth, assessed Dycal versus DentoGen based on clinical failure, radiological failure, pain, soft tissue pathology, pathological mobility, pathological radiolucency and pathological root resorption (Ulusoy 2014a). There was no statistically significant difference for any outcome at six or 12 months (Table 50).
| Outcome | Time point (months) | No. of studies | Risk ratio (95% CI) |
| Clinical failure | 1, 3, 6 | 1 | 5.00 (0.26, 98.00) |
| 9 | 1 | 7.00 (0.38, 127.32) | |
| 12 | 1 | 4.00 (0.49, 32.72) | |
| Radiological failure | 1, 3, 6 | 1 | 5.00 (0.26, 98.00) |
| 9 | 1 | 3.00 (0.34, 26.45) | |
| 12 | 1 | 1.67 (0.46, 6.06) | |
| Pain | 1, 3, 6, 9 | 1 | Not estimable* |
| 12 | 1 | 3.00 (0.13, 69.52) | |
| Soft tissue pathology | 1, 3, 6, 9 | 1 | 5.00 (0.26, 98.00) |
| 12 | 1 | 2.00 (0.20, 20.33) | |
| Pathologic mobility | 1, 3, 6, 9 | 1 | 5.00 (0.26, 98.00) |
| 12 | 1 | 2.00 (0.20, 20.33) | |
| Pathologic radiolucency | 1, 3, 6 | 1 | 5.00 (0.26, 98.00) |
| 9 | 1 | 3.00 (0.34, 26.45) | |
| 12 | 1 | 1.33 (0.34, 5.21) | |
| Pathologic root resorption | 1, 3, 6 | 1 | 5.00 (0.26, 98.00) |
| 9 | 1 | 2.00 (0.20, 20.33) | |
| 12 | 1.33 (0.34, 5.21) |
*due to lack of events
Abbreviation ‐ CI: confidence interval.
Discussion
Summary of main results
For this systematic review of pulp interventions for treatment of extensive decay in primary teeth of children, we included 87 randomised controlled trials (RCTs). These trials examined 125 different comparisons: 75 comparisons among different medicaments for pulpotomy (reported in 53 trials), 25 comparisons among different medicaments for pulpectomy (15 trials), four comparisons between pulpotomy and pulpectomy (4 trials), and 21 comparisons among different medicaments for direct pulp capping (7 trials). The risk of bias for all individual studies was assessed as either high or unclear.
Pulpotomy
The majority of the evidence with regards to pulpotomy versus pulpotomy came from trials of mineral trioxide aggregate (MTA) compared with formocresol (FC). MTA reduced both clinical and radiological failures with a statistically significant difference at 12 months for clinical failure and at six, 12 and 24 months for radiological failure (moderate‐quality evidence). MTA also showed favourable results for all secondary outcomes, especially pathological root resorption with around four times fewer cases at 24 months than when formocresol was used (effect size 0.25); pathological radiolucency was less than half as frequent with MTA than with formocresol at 12 months (effect size 0.43). MTA induced statistically significantly more pulp canal obliteration at 24 months and dentin bridge formation at six months.
MTA also showed favourable results compared with calcium hydroxide for all outcomes measured, with statistically significant differences at six, 12 and 24 months for radiological failure, pathological radiolucency and root resorption, at 12 and 24 months for clinical failure, soft tissue pathology and pathological mobility, and at 24 months for overall failure (moderate‐ to low‐quality evidence). The largest effect sizes concerned pathological radiolucency, pathological root resorption and pathological mobility with over 10 times fewer cases when MTA was used (effect sizes at 24 months respectively 0.08, 0.08 and 0.09). MTA induced statistically significantly more pulp canal obliteration at six and 24 months (about double), but also five times more dentin bridge formation at six months (the effect size was 0.2 at 6 months and 0.8 at 12 and 24 months, which seems to indicate that there is 25% more dentin bridge formation with MTA. Dentin bridge formation was faster with MTA).
Calcium hydroxide was compared with formocresol. There was a statistically significant difference in favour of formocresol for clinical failure at six and 12 months, radiological failure at six, 12 and 24 months, overall failure at 24 months, pain and soft tissue pathology at 12 months, and pathological root resorption at six, 12 and 24 months (moderate‐quality evidence). There was a statistically significant difference in favour of calcium hydroxide for dentin bridge formation at six and 12 months.
Calcium hydroxide was also compared with ferric sulphate. There was a statistically significant difference in favour of ferric sulphate for radiological and overall failure at 24 months (low‐quality evidence).
Compared with ferric sulphate, MTA had statistically significantly fewer radiological and overall failures and pathological radiolucency and root resorption at six months. (This difference was not significant at 12 and 24 months) (low‐ to very low‐quality evidence).
For all other comparisons of medicaments used during pulpotomies, despite the statistically significant difference for seven comparisons, each including only one trial (Kalra 2017; Sabbarini 2008Table 6; Table 7; Table 15; Table 16; Table 17; Table 30), the small number of studies and the inconsistency in results limits any interpretation.
Overall, MTA pulpotomy was superior to formocresol and ferric sulphate; all three treatments may be superior to calcium hydroxide pulpotomy. Although the evidence was weak for other medicaments, MTA seemed to stand out as the best treatment option for pulpotomy in primary teeth for the moment.
A challenge is that MTA is an expensive product with a relatively short setting time. The total treatment cost is incompatible with prices set by social welfare systems in many countries. However, MTA cost is reducing rapidly in Europe. Very few trials compared MTA with Biodentine, lasers, EMD or Ankaferd Blood Stopper for pulpotomy in primary teeth. Large, long‐term, well‐designed trials comparing these therapies in terms of efficacy and cost‐effectiveness would be useful. Research should also be encouraged to find a calcium silicate or inorganic material that is as effective as MTA for primary tooth pulpotomy, but with a shorter setting time.
Formocresol is a compound consisting of 48.5% formaldehyde, 48.5% cresol and 3% glycerine. Buckley's solution, introduced in 1904, is a diluted form of formocresol containing 19% formaldehyde, 35% cresol and 17.5% glycerine. Disinfecting agents used commonly for hospital floors and surfaces include sodium hypochlorite, chlorhexidine, ethanol, formaldehyde, glutaraldehyde, hydrogen peroxide, iodoform and calcium hydroxide (Ferreira 2007; Sassone 2003). However, formaldehyde is a carcinogen (of the second category according to modified 67/548/CEE) and mutagenic agent (of the third category according to modified 67/548/CEE) (Milnes 2006). Moreover, cresols are toxic if ingested or there is cutaneous contact and can cause severe skin burns and eye lesions. Formocresol should therefore not be applied without a dental dam. Researchers started to say that formocresol should not be used at the beginning of the 1980s (Lewis 2009); the American Association of Endodontists and the American Academy of Pediatric Dentistry advocate not using formocresol. We think the use of formocresol should be banned in children, and journals should not accept any publication of a trial including formocresol treatments in children. We think MTA should now be used as the 'gold standard' medicament in primary teeth pulpotomy trials.
Although the evidence is insufficient and a proper network meta‐analysis would be needed, calcium hydroxide and calcium hydroxide iodoform may be ineffective medicaments that should not be applied after pulpotomy of a primary molar. It seems that ZOE, electrosurgery, buffered glutaraldehyde and probably ferric sulphate may have medium to low efficacy. Ferric sulphate has proved to be less effective than MTA and may be less effective than formocresol (except for pain). Ferric sulphate may also be less effective than NaOCl. If MTA, laser, Biodentine or EMD cannot be applied to the pulp stumps, applying NaOCl may be the safest and cheapest option, although the efficacy of such a treatment clearly seems to be limited.
For the time being, the evidence supports applying MTA on the pulp stumps after pulpotomy in primary teeth. Where MTA is not accessible, research is needed to confirm if Biodentine, EMD, laser treatment or Ankaferd Blood Stopper are acceptable second choices, and if, where none of these treatments can be used, application of NaOCl would be the safest option.
Pulpectomy
For comparisons of medicaments used during pulpectomies, ZOE had statistically significantly fewer clinical and radiological failures at six and 12 months than calcium hydroxide iodoform (Vitapex) (low‐quality evidence). For all other comparisons of medicaments used during pulpectomies, despite the statistically significant difference for four comparisons, each including only one trial (Bezgin 2016; Chandra 2014; Table 38; Table 39), the small number of studies and the inconsistency in results limited interpretation. ZOE‐calcium hydroxide‐I (Endoflas) and 3Mix have been insufficiently evaluated and trials comparing ZOE, ZOE‐calcium hydroxide‐I, 3Mix (and maybe Metapex) should be conducted.
Thus, until further trials compare ZOE‐calcium hydroxide‐I and 3Mix, ZOE may be the best choice for filling the root canals after pulpectomy in primary teeth. ZOE seems to be an effective medicament; it is cheap and reasonably safe (Sarrami 2002) for use in children.
Pulpotomy versus pulpectomy
The evidence comparing pulpotomy and pulpectomy was limited as the four available trials each assessed a different combinations of medicament and pulpotomy/pulpectomy. Two of the trials found in favour of the pulpectomy arm for some secondary outcomes (Table 40; Table 41); however, we think this is due to the fact that the teeth included in both these trials presented root pulp irreversible inflammation or infection; actually, inclusion criteria in both these trials concerned teeth with furcal radiolucency, spontaneous pain, tenderness to percussion, abnormal mobility or an abscess or fistula. Such teeth should not be treated by pulpotomy. Pulpectomy and extraction are the two options in such cases. Researchers and clinicians should refer to the AAPD guideline on pulp therapy when conceiving a trial or choosing the appropriate pulp treatment (Guideline Pulp Therapy 2014; Guideline Pulp Therapy 2016).
Direct pulp capping
The evidence comparing different medicaments for use in direct pulp capping was limited as there was only one trial for each comparison. Demir 2007 compared different adhesive resins with each other and against calcium hydroxide, and did not find evidence that one medicament was superior to another. Aminabadi 2010 favoured formocresol over calcium hydroxide; MTA over 3Mix or simvastatin; and 3Mixtatin over 3Mix or simvastatin (low‐quality evidence). Calcium silicates such as MTA and Biodentine seem to be promising materials; however, no failure was identified in Tuna's trial comparing calcium hydroxide and MTA (Tuna 2008). As for pulpotomy, EMD may also be an alternative medicament for direct pulp capping in primary teeth; one trial compared EMD with calcium hydroxide and identified only two failures (one from each group) from 90 teeth evaluated over 12 months (Garrocho‐Rangel 2009).
Due to the toxicity of formocresol, conducting a large long‐term, well‐designed trial comparing MTA, Biodentine, EMD and DentoGen could help practitioners choose the right medicament to apply on a pulp exposure in a primary tooth.
Overall completeness and applicability of evidence
Overall completeness
Many trials have evaluated medicaments that can be used after pulpotomy of a deciduous molar. However, few trials have evaluated direct pulp capping medicaments. Several recent studies have added to the evidence comparing medicaments that can be applied to root canals after pulpectomy, but data are still scarce.
Some studies have compared the pulpotomy and pulpectomy treatments but no study has compared dental pulp capping and pulpotomy. However, AAPD recommendations already stipulate the conditions when direct pulp capping, pulpotomy or pulpectomy should be performed; moreover, these recommendations say direct pulp capping of a carious pulp exposure in a primary tooth is not recommended (Guideline Pulp Therapy 2014; Guideline Pulp Therapy 2016). It therefore seems there is no need for new trials comparing direct pulp capping and pulpotomy or pulpotomy and pulpectomy.
Applicability of evidence
Many countries ‐ rich or poor, north or south ‐ contributed data to our review, so results should be valid in all countries and regions.
In terms of context, all included trials were conducted in dental departments of hospitals. The context of a private practice is quite different and practice‐based studies, conducted in private practices, would enhance the external validity of data on pulp treatments in primary teeth. However, operators of included studies were of different types: either paediatric dentists, general practitioners, undergraduate or postgraduate students. Our results therefore do apply to all types of practitioners.
Quality of the evidence
The major limitation of our review is inherent to shortcomings across and within primary studies. The efficacy of pulp treatment techniques may be measured in various ways, commonly by both clinical and radiological dimensions. We found substantial diversity in reported outcomes, with 78 outcomes pertaining to primary teeth (39 clinical and 39 radiological outcomes). A success or failure composite outcome was often used but was defined by various component outcomes across trials. Consensus is lacking regarding the most relevant outcomes, especially for the definition of success or failure. Most investigators used their own criteria. In our review, the median number of component outcomes defining success or failure for each trial was nine (quartile 1 to quartile 3: 5 to 10, minimum to maximum 1 to 20). Moreover, all these outcomes were frequently assessed at different times within and across trials. Because of heterogeneous selection and measurement of outcomes across trials, performing meta‐analyses may be difficult, if not impossible. However, this variety did not always result in substantial statistical heterogeneity on meta‐analysis. The number of children included in most studies was very small. Power was thus a problem both at the study level and at the review level. Until further trials are conducted, a network meta‐analysis may help unravel the efficacy hierarchy that exists among pulpotomy materials.
The overall risk of bias of included studies was either high or unclear. Trial reporting often did not allow for assessment of all risk of bias domains because many methodological elements were not mentioned. Operative treatment cannot be blinded and the risk of bias could not be low. There is no solution to this problem. However, no included study would be at low risk if this risk of bias domain was not taken into account, which means the methodology of clinical trials evaluating pulp treatments in primary teeth can still be enhanced.
We assessed the quality of evidence regarding pulp treatments for extensive decay in primary teeth as moderate to very low (according to GRADE recommendations), depending on the comparison and main outcome (clinical or radiographic). The risk of bias was high or unclear in all studies, the small size of the studies often resulted in imprecision and methodological differences sometimes resulted in substantial inconsistency. However, some comparisons had a large (RR < 0.5 or > 2) to very large (RR < 0.2 or > 5) magnitude of effect, which may compensate for the methodological shortcomings or the heterogeneity. We could not assess the potential for publication bias.
In this review, the quality of the evidence seemed slightly better for radiographic outcomes: the risk of bias was rated as low, unclear and high in 51%, 44% and 5% of the included trials, respectively, for the clinical outcomes, compared to 59%, 39% and 2%, respectively, for the radiographic outcomes.
We assessed 32% of the pulpotomy trials to be at high risk of bias, compared with 13% of the pulpectomy trials and 14% of the direct pulp capping trials. The pulpotomy evidence may be in larger quantity but of lower quality than the pulpectomy and direct pulp capping evidence. However, it is difficult to be sure as all other trials were at unclear risk of bias.
We assessed 50% of the pulpotomy versus pulpectomy trials to be at high risk of bias, which is not surprising because the methodology of these trials was poor overall (in particular, inclusion criteria do not comply with AAPD guidelines).
The heterogeneity of the results was very often low (0% to 40%) and sometimes moderate to substantial (40% to 68%) in pulpotomy trials. It was low to very substantial (up to 82%) in pulpectomy trials. Direct pulp capping comparisons all involved only one trial so heterogeneity could not be assessed.
Imprecision was a common reason for downgrading the quality of the evidence because included trials were mostly small and yielded large confidence intervals if too few trials had been conducted.
Potential biases in the review process
Our search strategy was extensive and we contacted authors to query data. However, we cannot exclude the possibility of selective reporting of trials or outcomes. The small numbers of trials in comparisons preclude the assessment of small‐study biases through funnel plots and asymmetry tests. Regarding selective outcome reporting, we did not have access to most trial protocols. However, we found important differences between outcomes defined in the methods and results sections. In all 87 reports, at least one outcome defined in the methods section was not reported in the results section or vice versa. However, the large number of cases creates support for overall conclusions.
Agreements and disagreements with other studies or reviews
Pulpotomy
A few systematic reviews have compared pulpotomy medicaments.
One systematic review compared MTA, calcium hydroxide, ferric sulphate and electrosurgery; based on 30 trials, it concluded the superiority of MTA (Stringhini 2015a). One systematic review compared MTA, formocresol, ferric sulphate and calcium hydroxide; based on 18 RCTs and 10 clinical trials; results suggested that MTA was superior to formocresol, ferric sulphate and calcium hydroxide in all time periods up to exfoliation (Ng 2008). One systematic review compared MTA and ferric sulphate; based on four trials, the 24‐month data were in favour of MTA (Asgary 2014b). One systematic review compared MTA and calcium hydroxide; based on four trials, risk ratios were in favour of MTA after six, 12 and 24 months (Shirvani 2014b). The results of these four systematic reviews are in agreement with our results.
Four systematic reviews compared MTA and formocresol. One was based on five trials (377 teeth) and did not identify any significant difference in success between medicaments (Marghalani 2014a). One was based on six trials and its results showed a clinical and a radiographic risk ratio statistically significantly in favour of MTA (Peng 2006). One was based on eight trials and concluded that overall clinical and radiographic success rates were in favour of MTA (Fallahinejad 2008).One was based on 19 trials (1585 participants) and the resulting risk ratios were 0.26, 0.37 and 0.41 after six, 12 and 24 months, respectively, always in favour of MTA (Shirvani 2014c). Our results, based on 14 trials (1048 teeth), are very much in line with the latter as the risk ratios we observed were 0.23, 0.48 and 0.50, respectively. Overall, MTA is a more effective medicament than formocresol for the pulpotomy of primary molars.
One network meta‐analysis was published (Lin 2014). The results favoured MTA, ferric sulphate and formocresol over laser and calcium hydroxide. Considering the effect estimates and funnel plot of clinical and radiographic outcomes after 18 to 24 months, the medicaments followed the mentioned order in terms of success, with MTA being the most successful medicament and calcium hydroxide being the least successful. Concerning these two medicaments, our results are in agreement with this network meta‐analysis. However, our results are not completely in agreement with this publication for ferric sulphate, formocresol and laser. Our results were based on 53 trials while this network meta‐analysis was based on 37 studies (3 of which we excluded because they did not meet our inclusion criteria), 22 of which were included in the final network meta‐analysis. Thus, our effect estimates are much larger than those found in this review. Overall, our pair‐wise effect estimates favour the same medicament as in this review. A network meta‐analysis based on our results would certainly help in confirming the relative efficacy of medicaments such as ferric sulphate, laser or NaOCl.
Furthermore, one systematic review compared formocresol and ferric sulphate; based on four RCTs, four controlled clinical trials and three retrospective studies; its results did not show any statistically significant risk ratio between medicaments (Peng 2007). Another systematic review comparing formocresol and ferric sulphate found clinical data statistically significantly in favour of ferric sulphate and radiographic data that did not statistically significantly differ between medicaments (Loh 2004). As in our review, their clinical data seemed to be in favour of ferric sulphate while their radiographic data seemed to be in favour of formocresol.
Pulpectomy
We found no other systematic review comparing the different medicaments that can be used to fill the root canals of pulpectomised primary molars.
Direct pulp capping
We found no other systematic review comparing the different medicaments that can be applied on the pulp stumps for direct pulp capping of primary molars.
Comparison of pulp treatments
A recent systematic review supported indirect pulp therapy and pulpotomy (with either MTA or formocresol) over direct pulp capping as the latter showed similar failure rates but the quality of the evidence was lower (Coll 2015; Coll 2017). Our review did not evaluate indirect pulp capping. However, we found no randomised trial comparing pulpotomy and direct pulp capping. This recent systematic review was based on some of the trials included in this review, which compare medicaments for a given pulp treatment. We think the context and methodology varies too much across trials to conclude as to the superiority of pulpotomy or direct pulp capping: trials comparing these would be useful.

Study flow diagram

Risk of bias summary: review authors' judgements about each risk of bias item for each included study

Comparison 1 Mineral trioxide aggregate (MTA) pulpotomy versus full strength or 1:5 diluted formocresol pulpotomy, Outcome 1 Clinical failure.

Comparison 1 Mineral trioxide aggregate (MTA) pulpotomy versus full strength or 1:5 diluted formocresol pulpotomy, Outcome 2 Radiological failure.
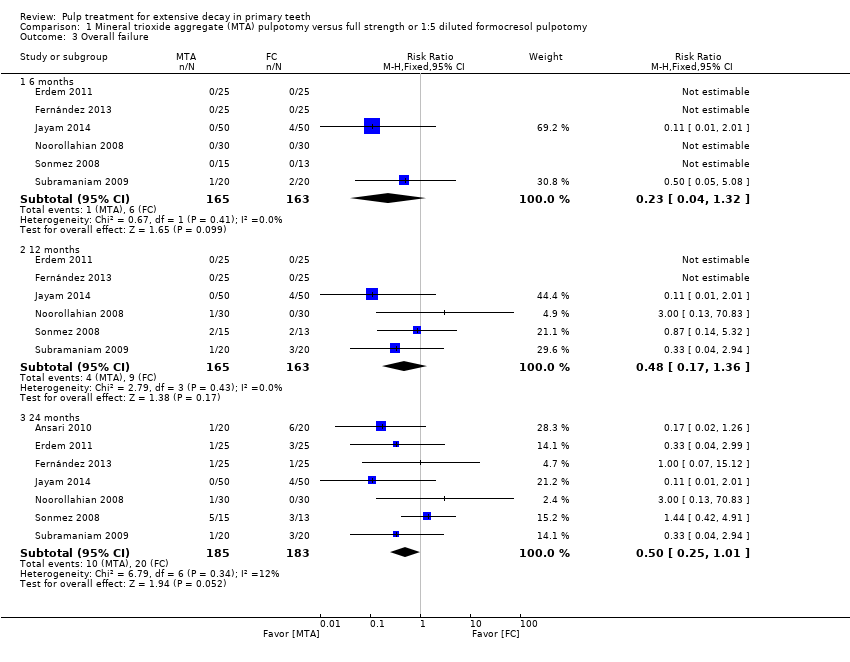
Comparison 1 Mineral trioxide aggregate (MTA) pulpotomy versus full strength or 1:5 diluted formocresol pulpotomy, Outcome 3 Overall failure.

Comparison 1 Mineral trioxide aggregate (MTA) pulpotomy versus full strength or 1:5 diluted formocresol pulpotomy, Outcome 4 Pain.
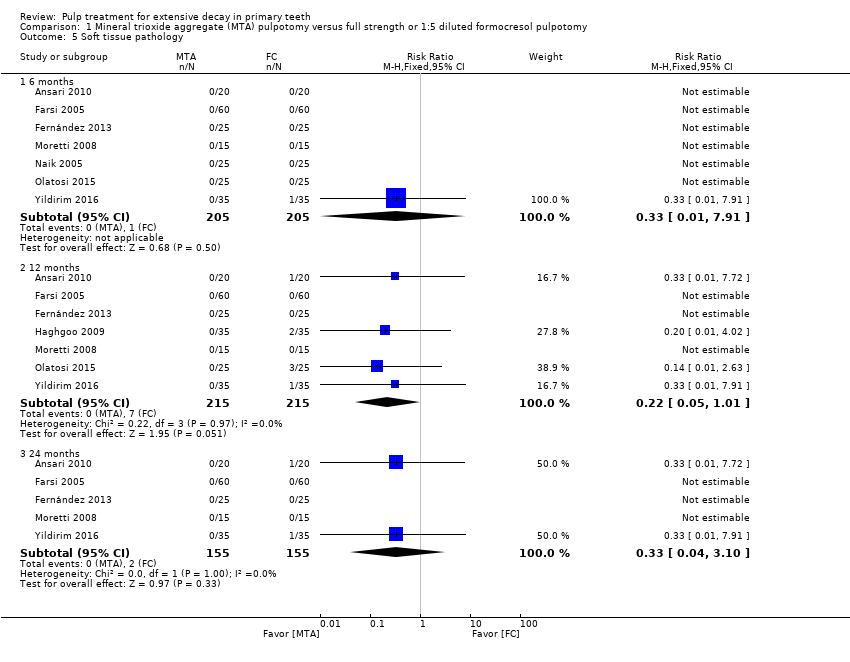
Comparison 1 Mineral trioxide aggregate (MTA) pulpotomy versus full strength or 1:5 diluted formocresol pulpotomy, Outcome 5 Soft tissue pathology.

Comparison 1 Mineral trioxide aggregate (MTA) pulpotomy versus full strength or 1:5 diluted formocresol pulpotomy, Outcome 6 Pathological mobility.

Comparison 1 Mineral trioxide aggregate (MTA) pulpotomy versus full strength or 1:5 diluted formocresol pulpotomy, Outcome 7 Pathological radiolucency.
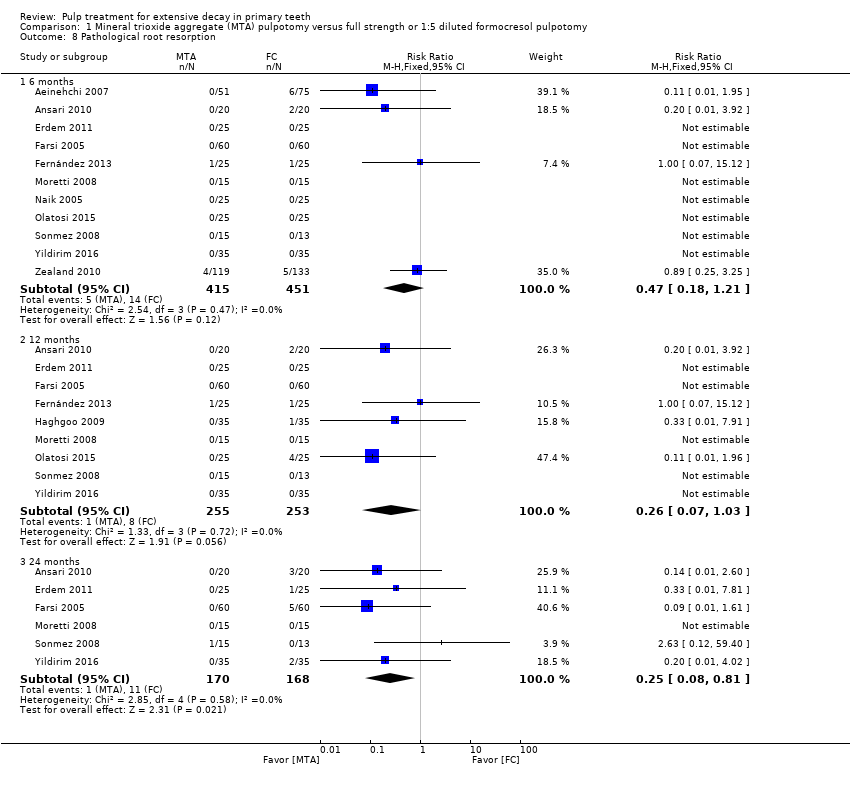
Comparison 1 Mineral trioxide aggregate (MTA) pulpotomy versus full strength or 1:5 diluted formocresol pulpotomy, Outcome 8 Pathological root resorption.

Comparison 1 Mineral trioxide aggregate (MTA) pulpotomy versus full strength or 1:5 diluted formocresol pulpotomy, Outcome 9 Pulp canal obliteration.

Comparison 1 Mineral trioxide aggregate (MTA) pulpotomy versus full strength or 1:5 diluted formocresol pulpotomy, Outcome 10 Dentin bridge formation.

Comparison 1 Mineral trioxide aggregate (MTA) pulpotomy versus full strength or 1:5 diluted formocresol pulpotomy, Outcome 11 Physiological root resorption.

Comparison 2 Mineral trioxide aggregate (MTA) pulpotomy versus full strength formocresol pulpotomy, Outcome 1 Clinical failure.

Comparison 2 Mineral trioxide aggregate (MTA) pulpotomy versus full strength formocresol pulpotomy, Outcome 2 Radiological failure.
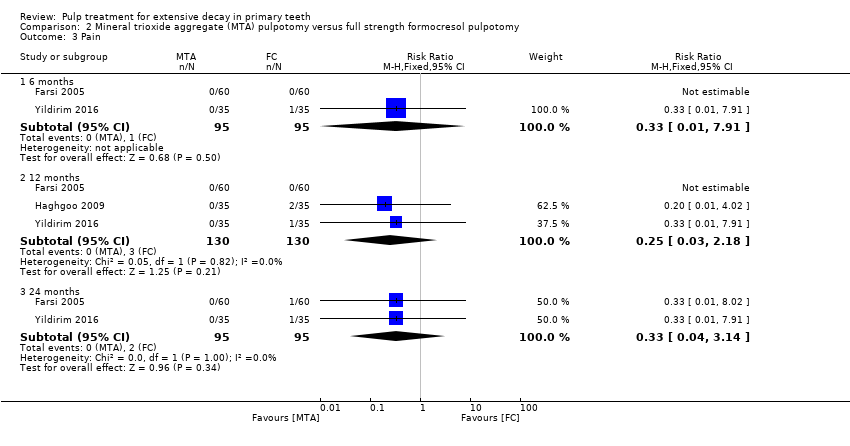
Comparison 2 Mineral trioxide aggregate (MTA) pulpotomy versus full strength formocresol pulpotomy, Outcome 3 Pain.

Comparison 2 Mineral trioxide aggregate (MTA) pulpotomy versus full strength formocresol pulpotomy, Outcome 4 Soft tissue pathology.
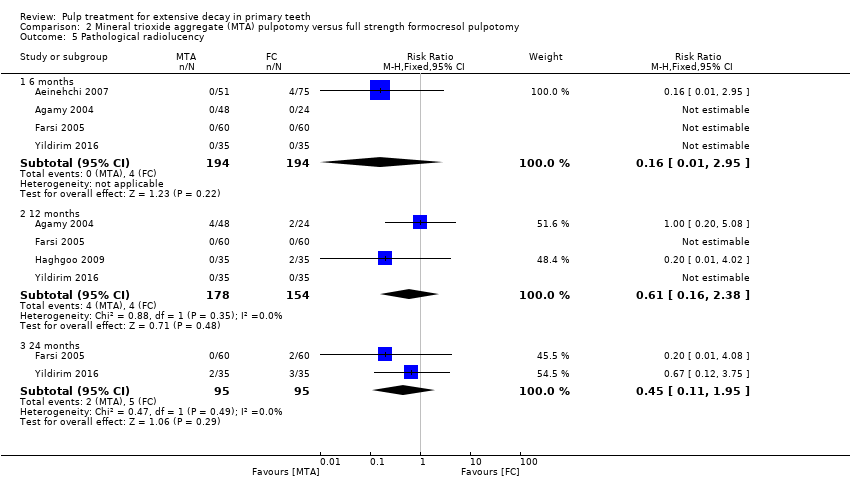
Comparison 2 Mineral trioxide aggregate (MTA) pulpotomy versus full strength formocresol pulpotomy, Outcome 5 Pathological radiolucency.

Comparison 2 Mineral trioxide aggregate (MTA) pulpotomy versus full strength formocresol pulpotomy, Outcome 6 Pathological root resorption.

Comparison 2 Mineral trioxide aggregate (MTA) pulpotomy versus full strength formocresol pulpotomy, Outcome 7 Pulp canal obliteration.

Comparison 3 Mineral trioxide aggregate (MTA) pulpotomy versus 1:5 diluted formocresol pulpotomy, Outcome 1 Clinical failure.

Comparison 3 Mineral trioxide aggregate (MTA) pulpotomy versus 1:5 diluted formocresol pulpotomy, Outcome 2 Radiological failure.

Comparison 3 Mineral trioxide aggregate (MTA) pulpotomy versus 1:5 diluted formocresol pulpotomy, Outcome 3 Pain.
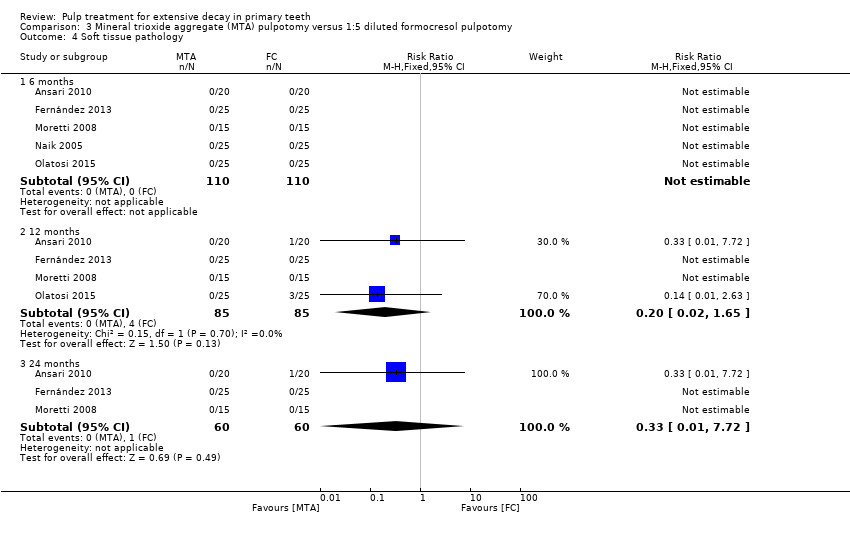
Comparison 3 Mineral trioxide aggregate (MTA) pulpotomy versus 1:5 diluted formocresol pulpotomy, Outcome 4 Soft tissue pathology.

Comparison 3 Mineral trioxide aggregate (MTA) pulpotomy versus 1:5 diluted formocresol pulpotomy, Outcome 5 Pathological mobility.

Comparison 3 Mineral trioxide aggregate (MTA) pulpotomy versus 1:5 diluted formocresol pulpotomy, Outcome 6 Pathological radiolucency.
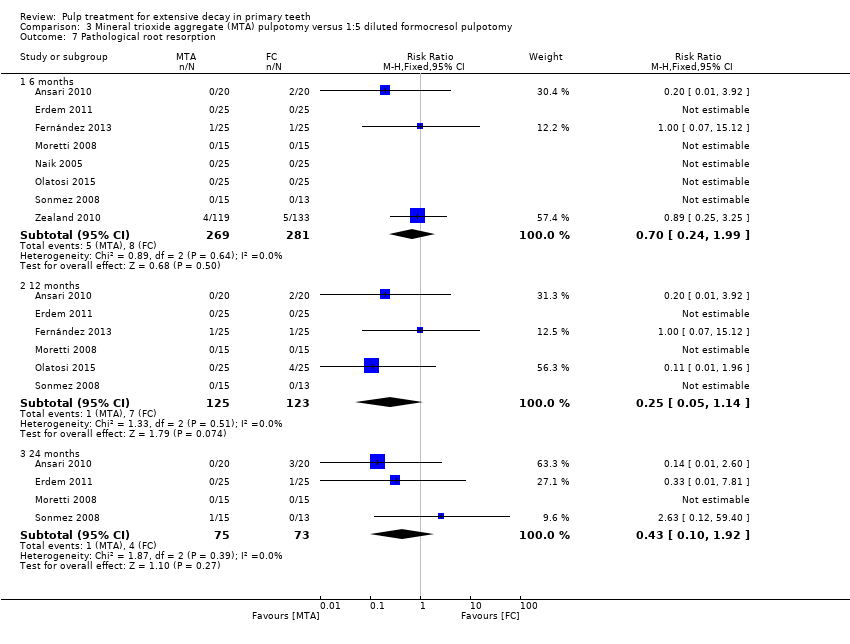
Comparison 3 Mineral trioxide aggregate (MTA) pulpotomy versus 1:5 diluted formocresol pulpotomy, Outcome 7 Pathological root resorption.
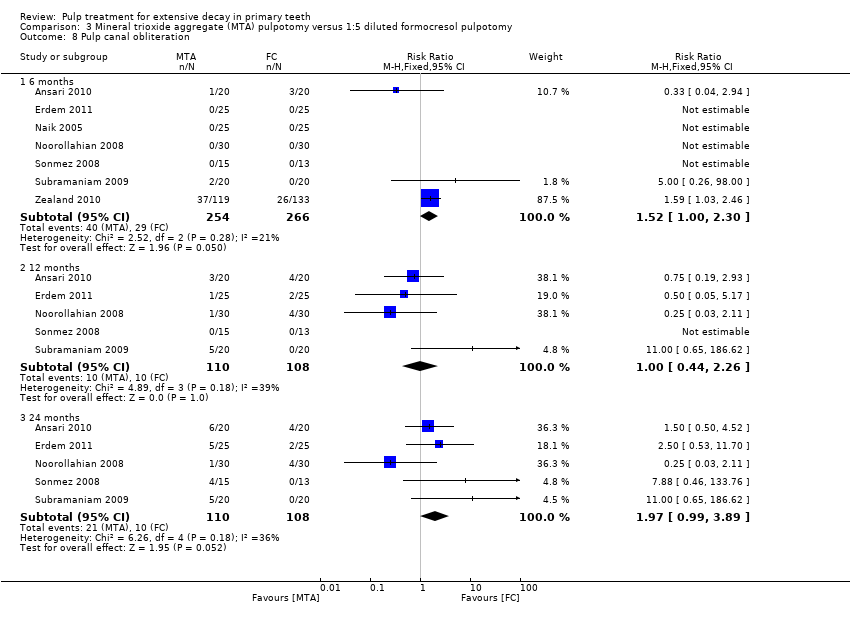
Comparison 3 Mineral trioxide aggregate (MTA) pulpotomy versus 1:5 diluted formocresol pulpotomy, Outcome 8 Pulp canal obliteration.

Comparison 4 Mineral trioxide aggregate (MTA) pulpotomy versus ferric sulphate (FS) pulpotomy, Outcome 1 Clinical failure.

Comparison 4 Mineral trioxide aggregate (MTA) pulpotomy versus ferric sulphate (FS) pulpotomy, Outcome 2 Radiological failure.

Comparison 4 Mineral trioxide aggregate (MTA) pulpotomy versus ferric sulphate (FS) pulpotomy, Outcome 3 Overall failure.
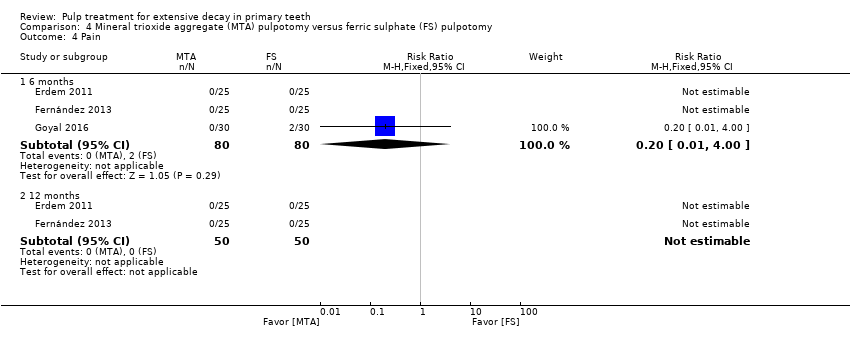
Comparison 4 Mineral trioxide aggregate (MTA) pulpotomy versus ferric sulphate (FS) pulpotomy, Outcome 4 Pain.
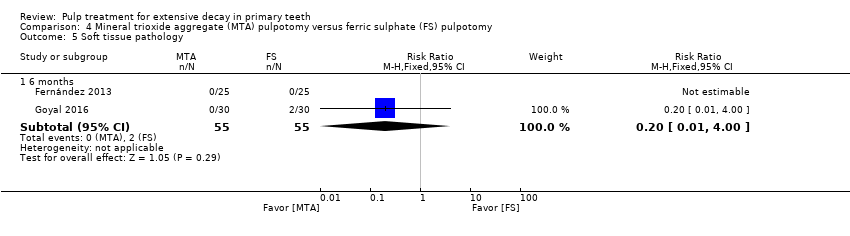
Comparison 4 Mineral trioxide aggregate (MTA) pulpotomy versus ferric sulphate (FS) pulpotomy, Outcome 5 Soft tissue pathology.
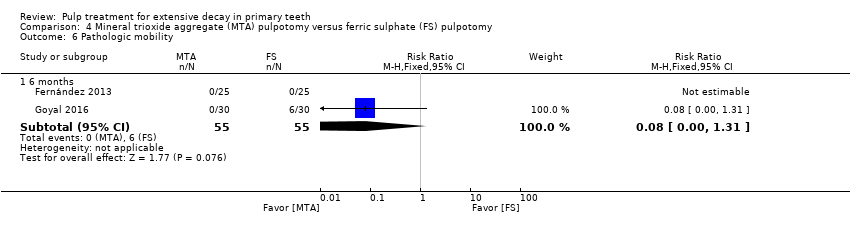
Comparison 4 Mineral trioxide aggregate (MTA) pulpotomy versus ferric sulphate (FS) pulpotomy, Outcome 6 Pathologic mobility.

Comparison 4 Mineral trioxide aggregate (MTA) pulpotomy versus ferric sulphate (FS) pulpotomy, Outcome 7 Pathologic radiolucency.
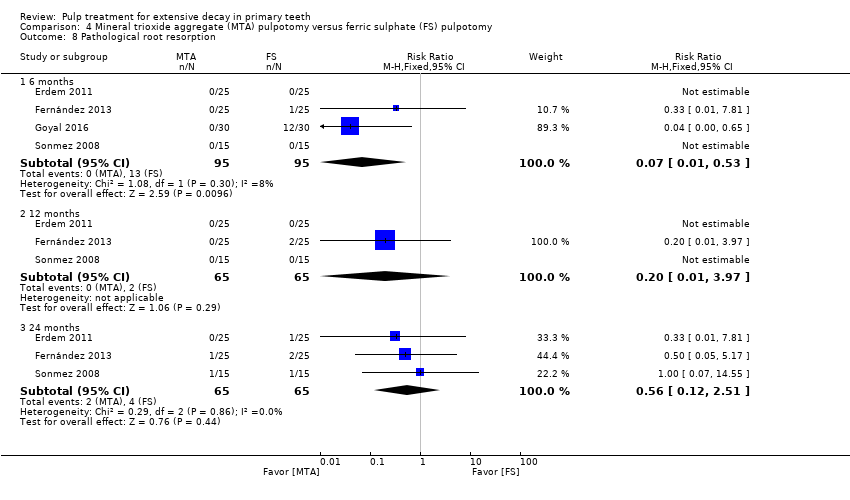
Comparison 4 Mineral trioxide aggregate (MTA) pulpotomy versus ferric sulphate (FS) pulpotomy, Outcome 8 Pathological root resorption.
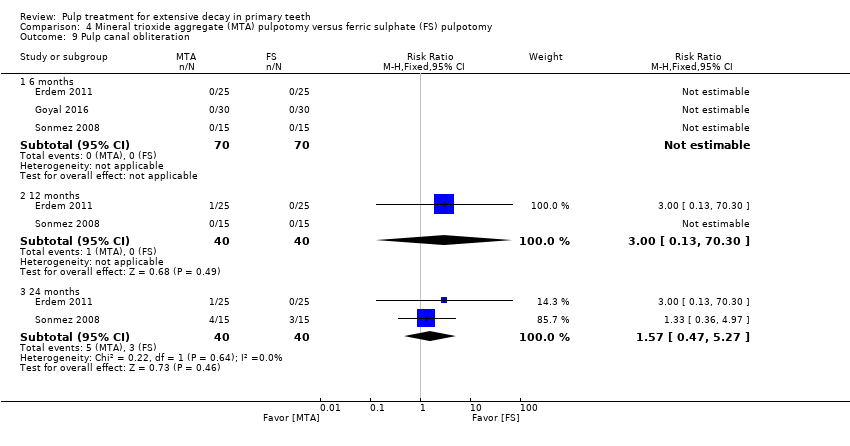
Comparison 4 Mineral trioxide aggregate (MTA) pulpotomy versus ferric sulphate (FS) pulpotomy, Outcome 9 Pulp canal obliteration.
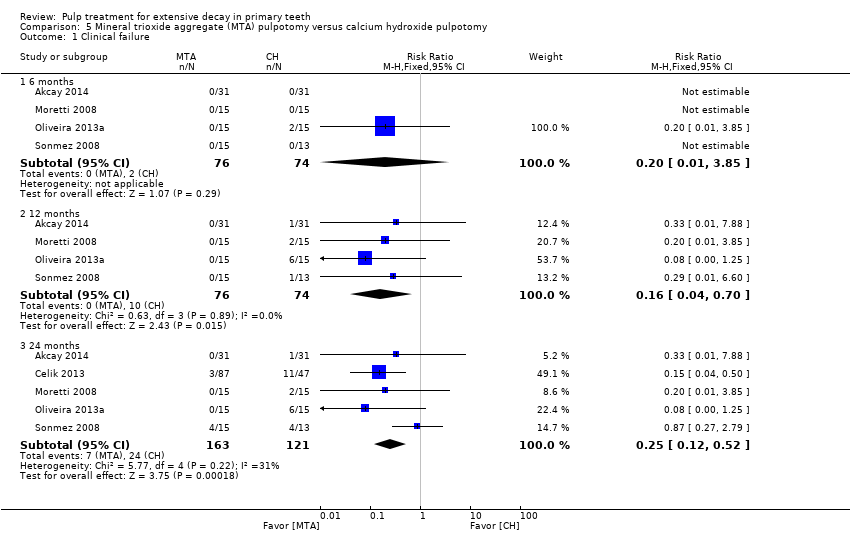
Comparison 5 Mineral trioxide aggregate (MTA) pulpotomy versus calcium hydroxide pulpotomy, Outcome 1 Clinical failure.
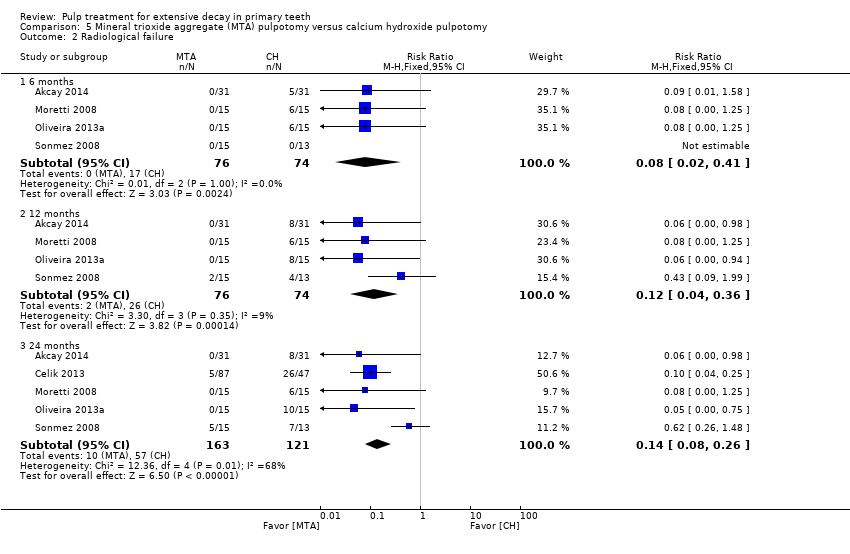
Comparison 5 Mineral trioxide aggregate (MTA) pulpotomy versus calcium hydroxide pulpotomy, Outcome 2 Radiological failure.

Comparison 5 Mineral trioxide aggregate (MTA) pulpotomy versus calcium hydroxide pulpotomy, Outcome 3 Overall failure.

Comparison 5 Mineral trioxide aggregate (MTA) pulpotomy versus calcium hydroxide pulpotomy, Outcome 4 Pain.
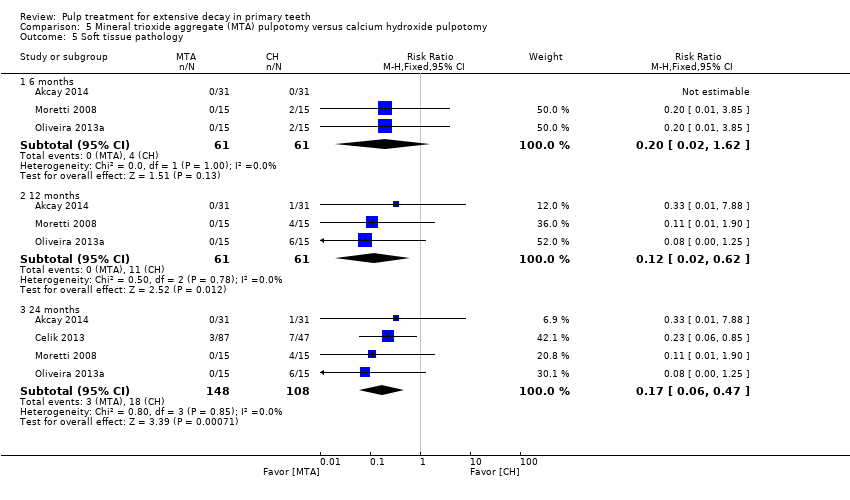
Comparison 5 Mineral trioxide aggregate (MTA) pulpotomy versus calcium hydroxide pulpotomy, Outcome 5 Soft tissue pathology.
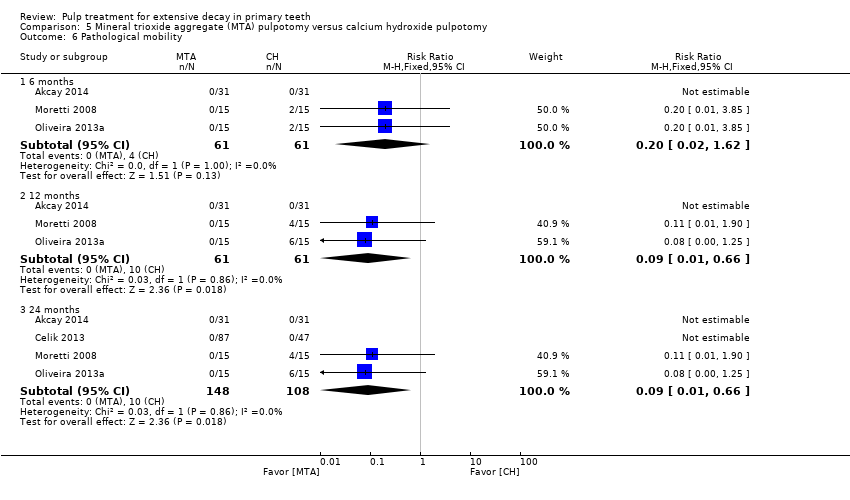
Comparison 5 Mineral trioxide aggregate (MTA) pulpotomy versus calcium hydroxide pulpotomy, Outcome 6 Pathological mobility.

Comparison 5 Mineral trioxide aggregate (MTA) pulpotomy versus calcium hydroxide pulpotomy, Outcome 7 Pathological radiolucency.

Comparison 5 Mineral trioxide aggregate (MTA) pulpotomy versus calcium hydroxide pulpotomy, Outcome 8 Pathological root resorption.
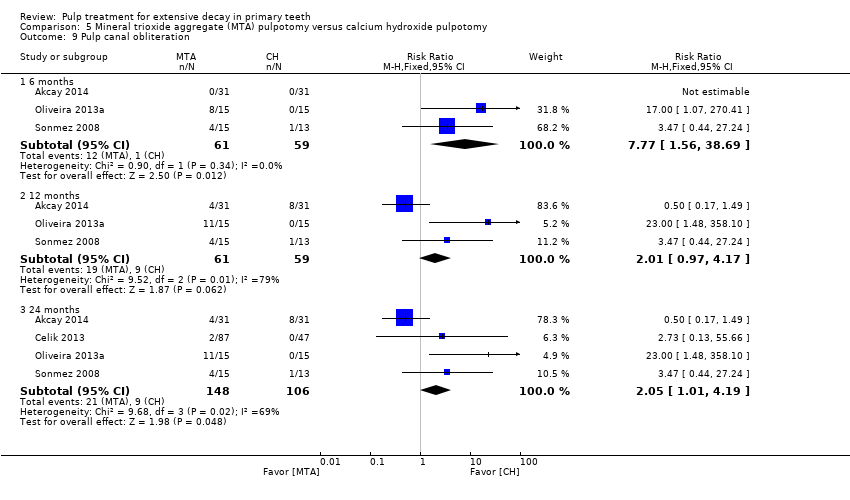
Comparison 5 Mineral trioxide aggregate (MTA) pulpotomy versus calcium hydroxide pulpotomy, Outcome 9 Pulp canal obliteration.

Comparison 5 Mineral trioxide aggregate (MTA) pulpotomy versus calcium hydroxide pulpotomy, Outcome 10 Dentin bridge formation.

Comparison 6 Mineral trioxide aggregate (MTA) pulpotomy versus Portland cement pulpotomy, Outcome 1 Clinical failure.

Comparison 6 Mineral trioxide aggregate (MTA) pulpotomy versus Portland cement pulpotomy, Outcome 2 Radiological failure.

Comparison 6 Mineral trioxide aggregate (MTA) pulpotomy versus Portland cement pulpotomy, Outcome 3 Pain.

Comparison 6 Mineral trioxide aggregate (MTA) pulpotomy versus Portland cement pulpotomy, Outcome 4 Soft tissue pathology.
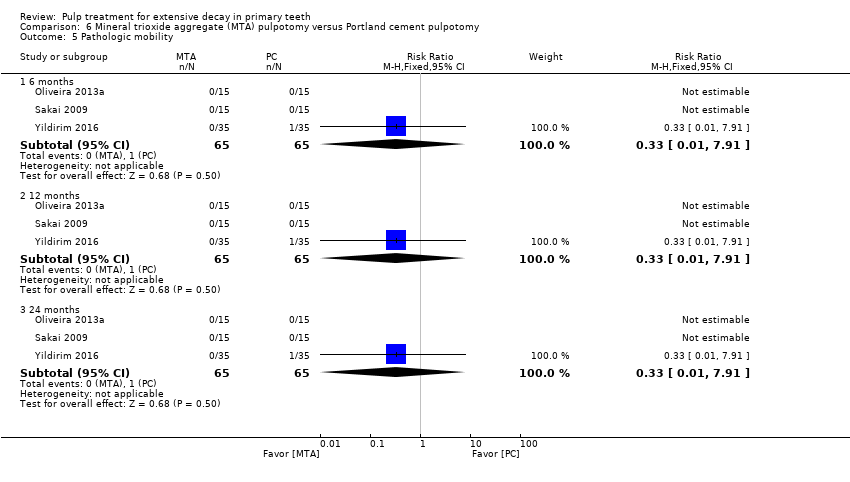
Comparison 6 Mineral trioxide aggregate (MTA) pulpotomy versus Portland cement pulpotomy, Outcome 5 Pathologic mobility.
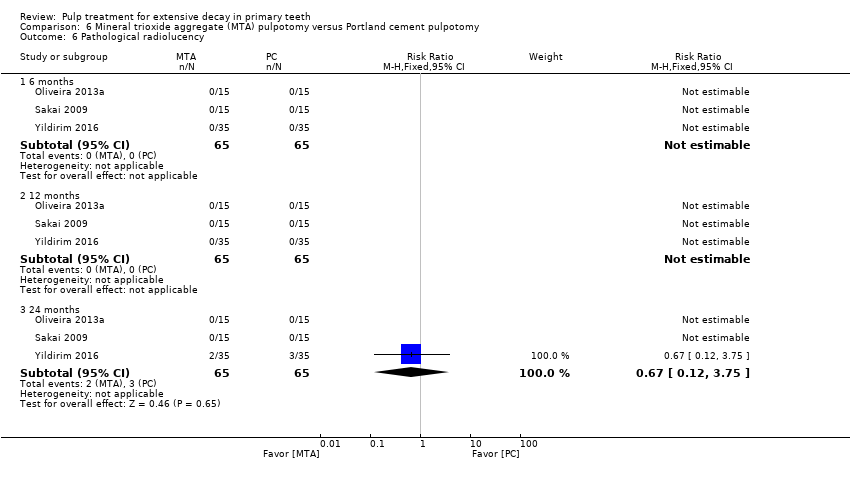
Comparison 6 Mineral trioxide aggregate (MTA) pulpotomy versus Portland cement pulpotomy, Outcome 6 Pathological radiolucency.

Comparison 6 Mineral trioxide aggregate (MTA) pulpotomy versus Portland cement pulpotomy, Outcome 7 Pathological root resorption.

Comparison 6 Mineral trioxide aggregate (MTA) pulpotomy versus Portland cement pulpotomy, Outcome 8 Pulp canal obliteration.
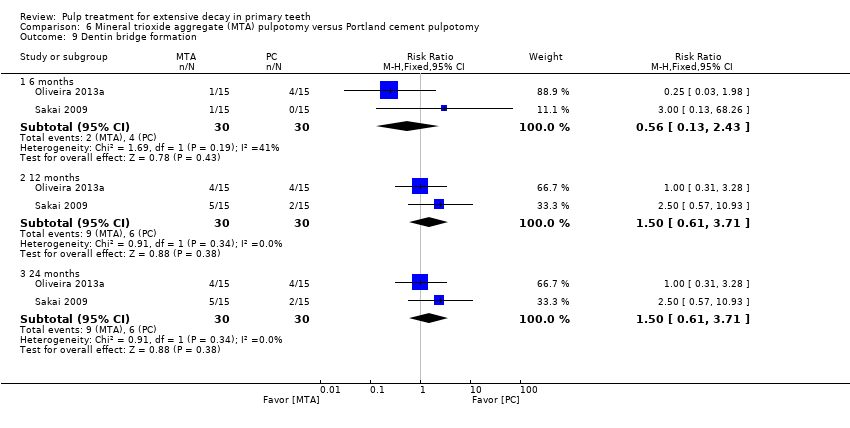
Comparison 6 Mineral trioxide aggregate (MTA) pulpotomy versus Portland cement pulpotomy, Outcome 9 Dentin bridge formation.

Comparison 7 Biodentine pulpotomy versus Mineral trioxide aggregate (MTA) pulpotomy, Outcome 1 Clinical failure.
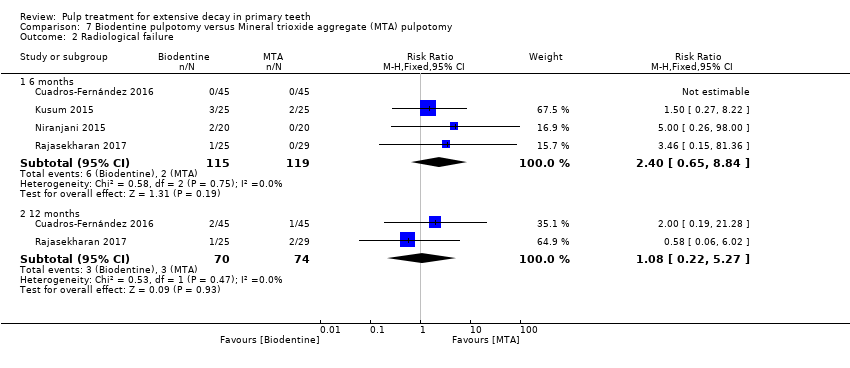
Comparison 7 Biodentine pulpotomy versus Mineral trioxide aggregate (MTA) pulpotomy, Outcome 2 Radiological failure.

Comparison 7 Biodentine pulpotomy versus Mineral trioxide aggregate (MTA) pulpotomy, Outcome 3 Pain.

Comparison 7 Biodentine pulpotomy versus Mineral trioxide aggregate (MTA) pulpotomy, Outcome 4 Soft tissue pathology.
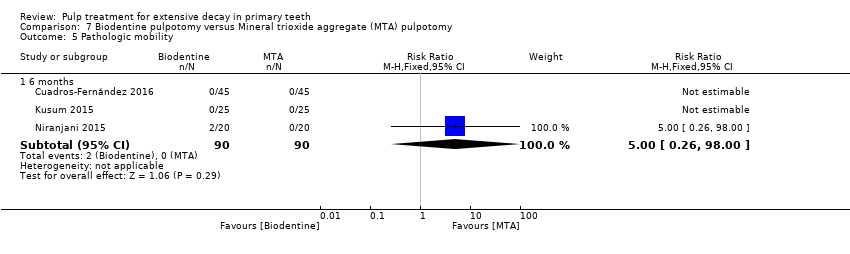
Comparison 7 Biodentine pulpotomy versus Mineral trioxide aggregate (MTA) pulpotomy, Outcome 5 Pathologic mobility.

Comparison 7 Biodentine pulpotomy versus Mineral trioxide aggregate (MTA) pulpotomy, Outcome 6 Pathological radiolucency.
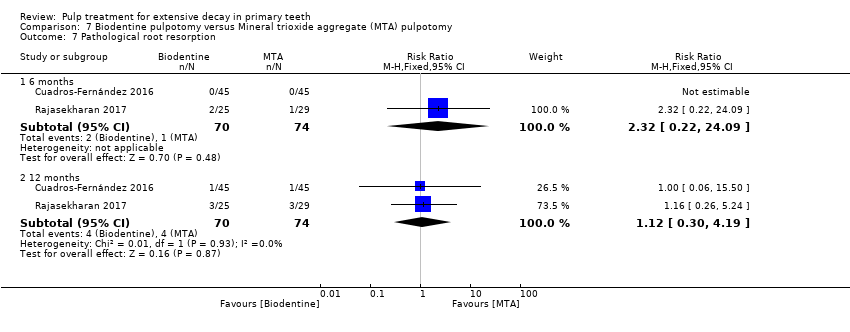
Comparison 7 Biodentine pulpotomy versus Mineral trioxide aggregate (MTA) pulpotomy, Outcome 7 Pathological root resorption.
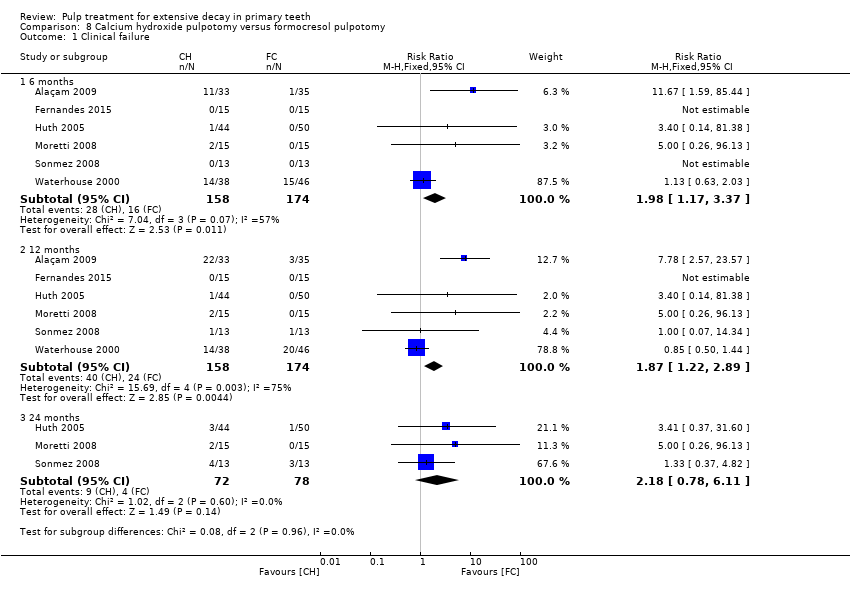
Comparison 8 Calcium hydroxide pulpotomy versus formocresol pulpotomy, Outcome 1 Clinical failure.

Comparison 8 Calcium hydroxide pulpotomy versus formocresol pulpotomy, Outcome 2 Radiological failure.

Comparison 8 Calcium hydroxide pulpotomy versus formocresol pulpotomy, Outcome 3 Overall failure.
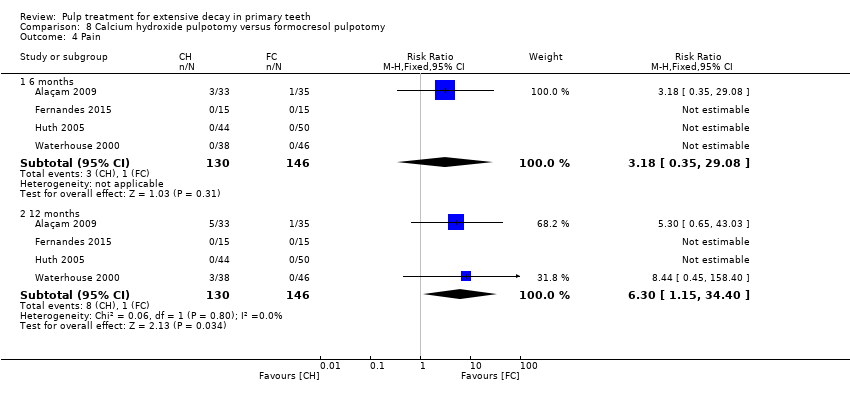
Comparison 8 Calcium hydroxide pulpotomy versus formocresol pulpotomy, Outcome 4 Pain.

Comparison 8 Calcium hydroxide pulpotomy versus formocresol pulpotomy, Outcome 5 Soft tissue pathology.

Comparison 8 Calcium hydroxide pulpotomy versus formocresol pulpotomy, Outcome 6 Pathological mobility.
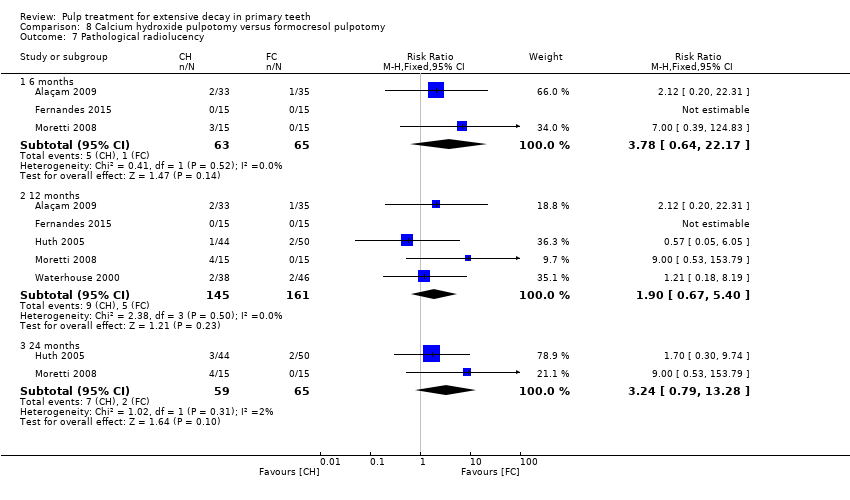
Comparison 8 Calcium hydroxide pulpotomy versus formocresol pulpotomy, Outcome 7 Pathological radiolucency.
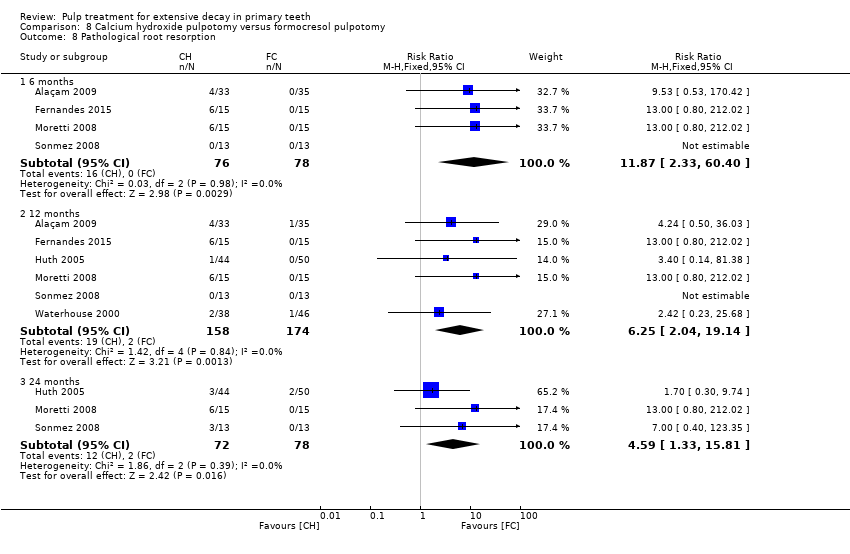
Comparison 8 Calcium hydroxide pulpotomy versus formocresol pulpotomy, Outcome 8 Pathological root resorption.
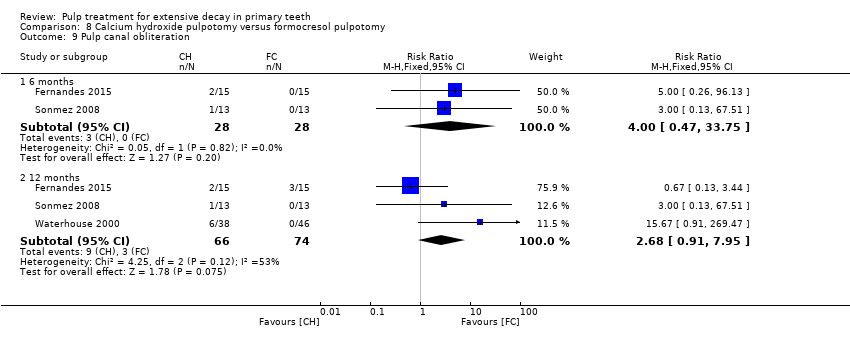
Comparison 8 Calcium hydroxide pulpotomy versus formocresol pulpotomy, Outcome 9 Pulp canal obliteration.

Comparison 8 Calcium hydroxide pulpotomy versus formocresol pulpotomy, Outcome 10 Dentin bridge formation.

Comparison 9 Calcium hydroxide pulpotomy versus ferric sulphate pulpotomy, Outcome 1 Clinical failure.

Comparison 9 Calcium hydroxide pulpotomy versus ferric sulphate pulpotomy, Outcome 2 Radiological failure.
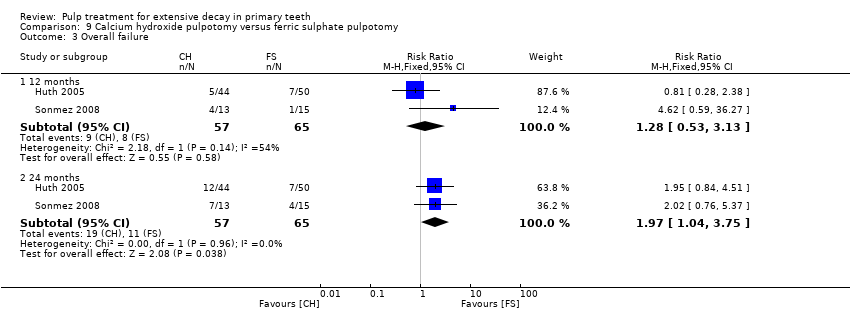
Comparison 9 Calcium hydroxide pulpotomy versus ferric sulphate pulpotomy, Outcome 3 Overall failure.
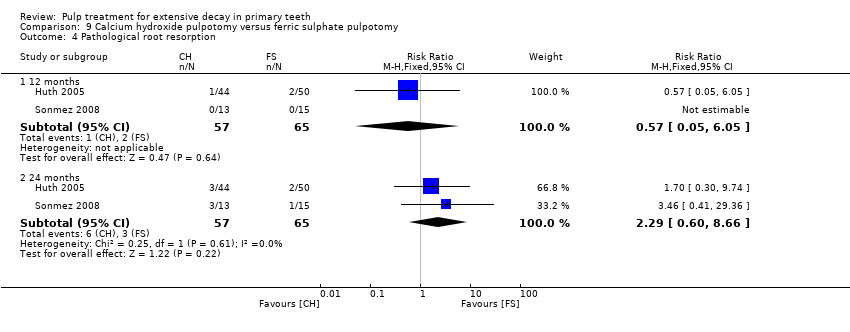
Comparison 9 Calcium hydroxide pulpotomy versus ferric sulphate pulpotomy, Outcome 4 Pathological root resorption.

Comparison 10 Ferric sulphate pulpotomy versus formocresol pulpotomy, Outcome 1 Clinical failure.
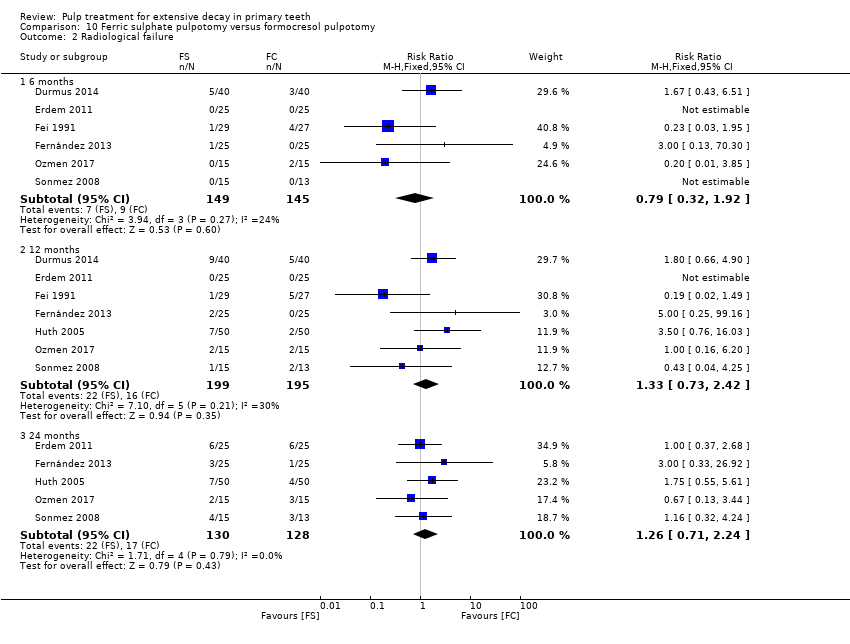
Comparison 10 Ferric sulphate pulpotomy versus formocresol pulpotomy, Outcome 2 Radiological failure.

Comparison 10 Ferric sulphate pulpotomy versus formocresol pulpotomy, Outcome 3 Overall failure.

Comparison 10 Ferric sulphate pulpotomy versus formocresol pulpotomy, Outcome 4 Pain.

Comparison 10 Ferric sulphate pulpotomy versus formocresol pulpotomy, Outcome 5 Pathological radiolucency.

Comparison 10 Ferric sulphate pulpotomy versus formocresol pulpotomy, Outcome 6 Pathological root resorption.

Comparison 10 Ferric sulphate pulpotomy versus formocresol pulpotomy, Outcome 7 Pulp canal obliteration.
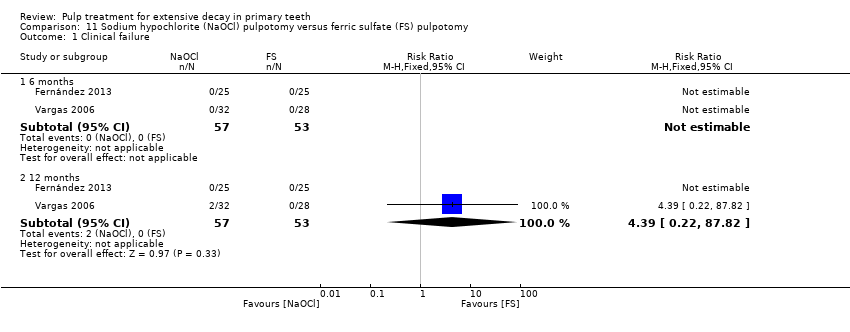
Comparison 11 Sodium hypochlorite (NaOCl) pulpotomy versus ferric sulfate (FS) pulpotomy, Outcome 1 Clinical failure.

Comparison 11 Sodium hypochlorite (NaOCl) pulpotomy versus ferric sulfate (FS) pulpotomy, Outcome 2 Radiological failure.
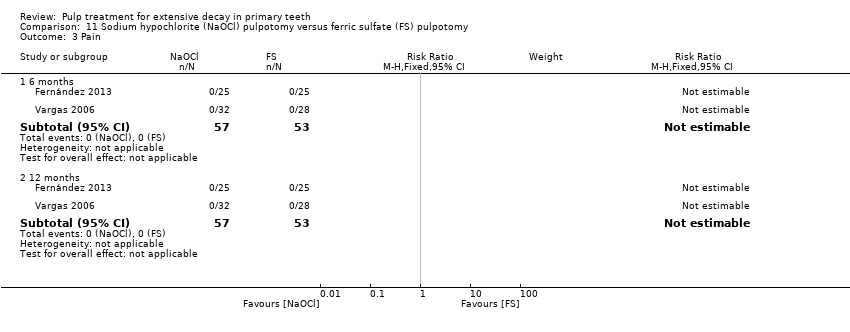
Comparison 11 Sodium hypochlorite (NaOCl) pulpotomy versus ferric sulfate (FS) pulpotomy, Outcome 3 Pain.
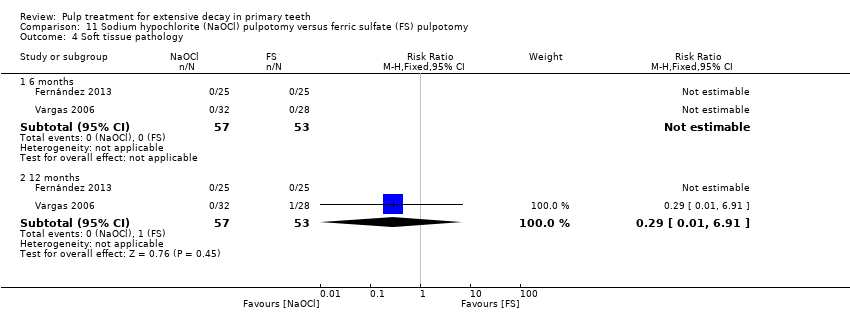
Comparison 11 Sodium hypochlorite (NaOCl) pulpotomy versus ferric sulfate (FS) pulpotomy, Outcome 4 Soft tissue pathology.
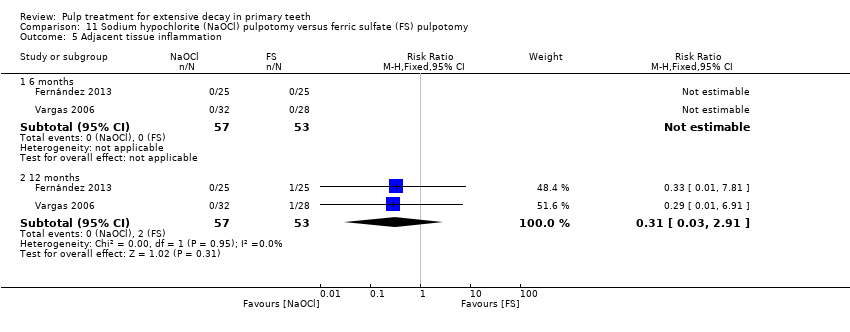
Comparison 11 Sodium hypochlorite (NaOCl) pulpotomy versus ferric sulfate (FS) pulpotomy, Outcome 5 Adjacent tissue inflammation.

Comparison 11 Sodium hypochlorite (NaOCl) pulpotomy versus ferric sulfate (FS) pulpotomy, Outcome 6 Pathologic mobility.

Comparison 11 Sodium hypochlorite (NaOCl) pulpotomy versus ferric sulfate (FS) pulpotomy, Outcome 7 Pathologic radiolucency.
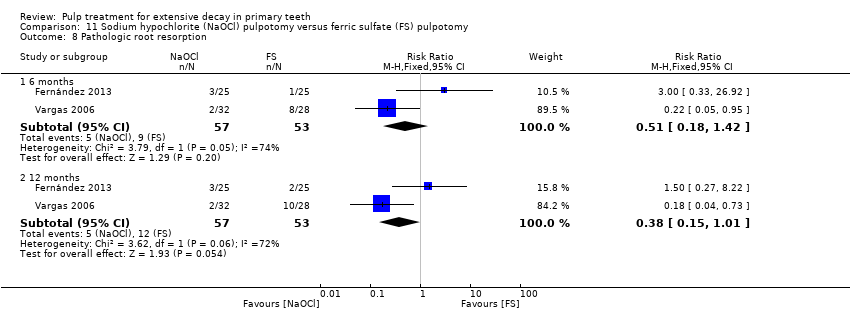
Comparison 11 Sodium hypochlorite (NaOCl) pulpotomy versus ferric sulfate (FS) pulpotomy, Outcome 8 Pathologic root resorption.

Comparison 12 Diode laser pulpotomy versus ferric sulfate (FS) pulpotomy, Outcome 1 Clinical failure.

Comparison 12 Diode laser pulpotomy versus ferric sulfate (FS) pulpotomy, Outcome 2 Radiological failure.

Comparison 12 Diode laser pulpotomy versus ferric sulfate (FS) pulpotomy, Outcome 3 Pain.

Comparison 12 Diode laser pulpotomy versus ferric sulfate (FS) pulpotomy, Outcome 4 Pathological radiolucency.
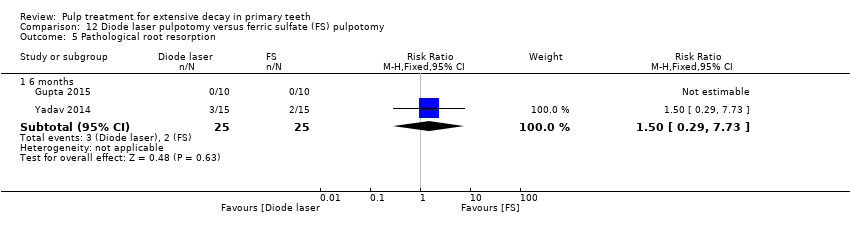
Comparison 12 Diode laser pulpotomy versus ferric sulfate (FS) pulpotomy, Outcome 5 Pathological root resorption.
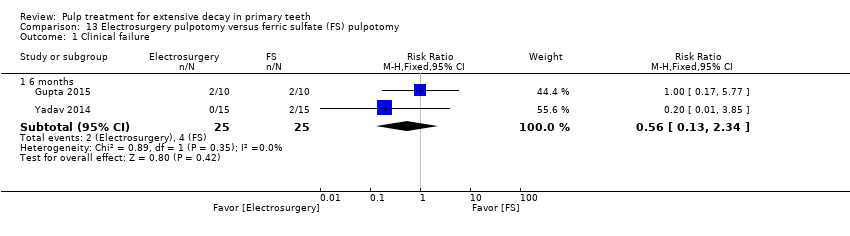
Comparison 13 Electrosurgery pulpotomy versus ferric sulfate (FS) pulpotomy, Outcome 1 Clinical failure.
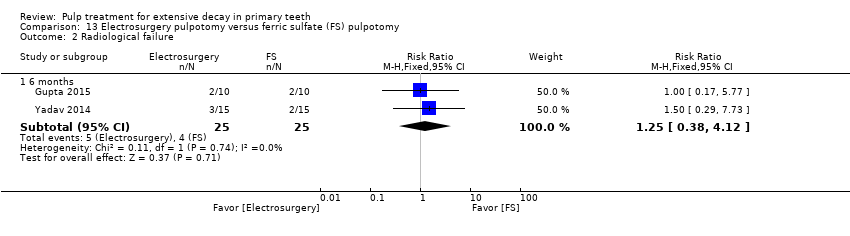
Comparison 13 Electrosurgery pulpotomy versus ferric sulfate (FS) pulpotomy, Outcome 2 Radiological failure.
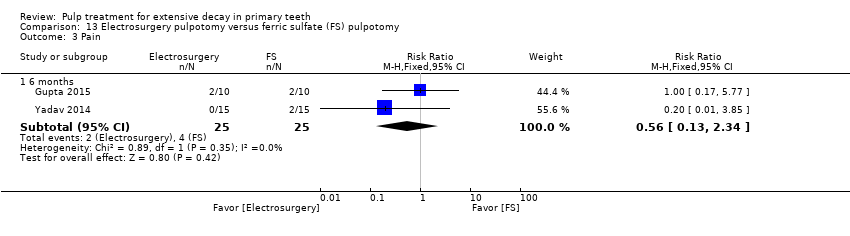
Comparison 13 Electrosurgery pulpotomy versus ferric sulfate (FS) pulpotomy, Outcome 3 Pain.

Comparison 13 Electrosurgery pulpotomy versus ferric sulfate (FS) pulpotomy, Outcome 4 Pathological mobility.

Comparison 13 Electrosurgery pulpotomy versus ferric sulfate (FS) pulpotomy, Outcome 5 Pathological root resorption.

Comparison 13 Electrosurgery pulpotomy versus ferric sulfate (FS) pulpotomy, Outcome 6 Pulp canal obliteration.

Comparison 14 Ankaferd Blood Stopper (ABS) versus Ferric Sulfate (FS) pulpotomy, Outcome 1 Clinical failure.

Comparison 14 Ankaferd Blood Stopper (ABS) versus Ferric Sulfate (FS) pulpotomy, Outcome 2 Radiological failure.

Comparison 14 Ankaferd Blood Stopper (ABS) versus Ferric Sulfate (FS) pulpotomy, Outcome 3 Pain.
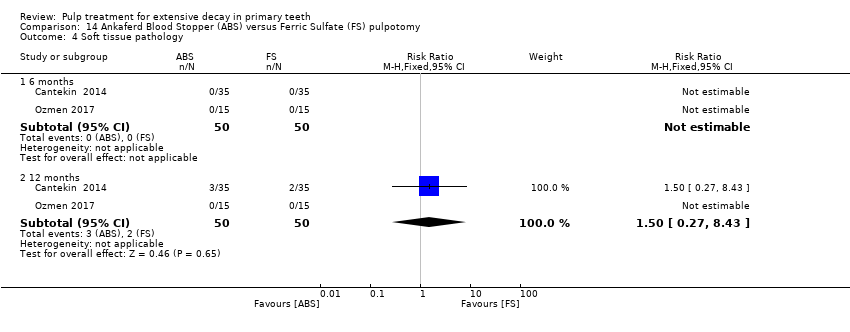
Comparison 14 Ankaferd Blood Stopper (ABS) versus Ferric Sulfate (FS) pulpotomy, Outcome 4 Soft tissue pathology.
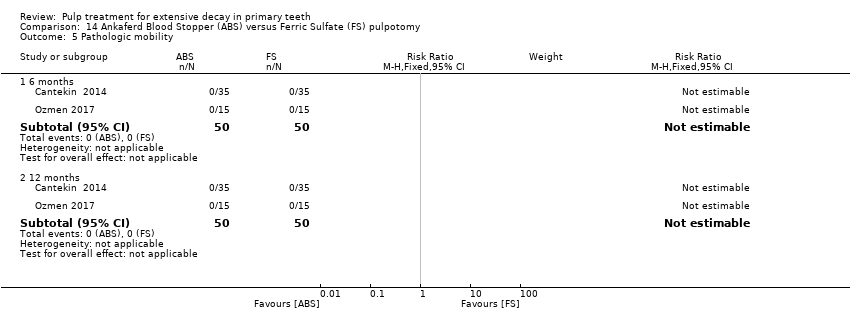
Comparison 14 Ankaferd Blood Stopper (ABS) versus Ferric Sulfate (FS) pulpotomy, Outcome 5 Pathologic mobility.

Comparison 14 Ankaferd Blood Stopper (ABS) versus Ferric Sulfate (FS) pulpotomy, Outcome 6 Pathologic radiolucency.

Comparison 14 Ankaferd Blood Stopper (ABS) versus Ferric Sulfate (FS) pulpotomy, Outcome 7 Pathologic root resorption.
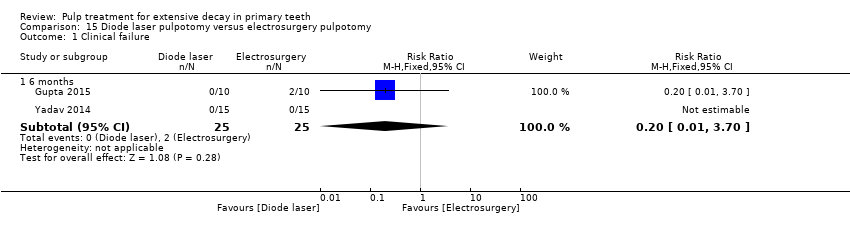
Comparison 15 Diode laser pulpotomy versus electrosurgery pulpotomy, Outcome 1 Clinical failure.

Comparison 15 Diode laser pulpotomy versus electrosurgery pulpotomy, Outcome 2 Radiological failure.

Comparison 15 Diode laser pulpotomy versus electrosurgery pulpotomy, Outcome 3 Pain.
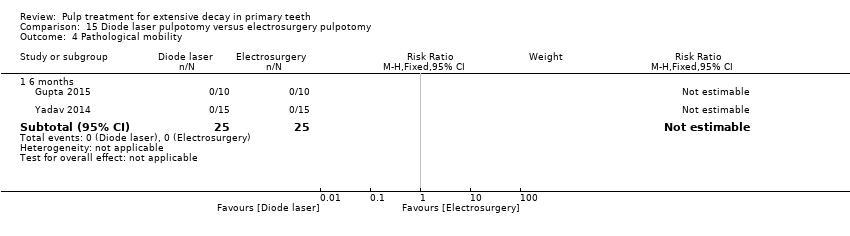
Comparison 15 Diode laser pulpotomy versus electrosurgery pulpotomy, Outcome 4 Pathological mobility.

Comparison 15 Diode laser pulpotomy versus electrosurgery pulpotomy, Outcome 5 Pathological radiolucency.
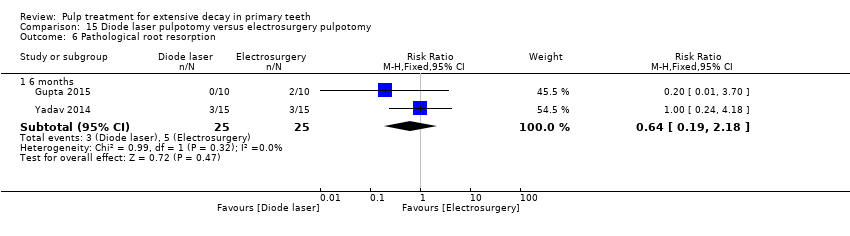
Comparison 15 Diode laser pulpotomy versus electrosurgery pulpotomy, Outcome 6 Pathological root resorption.

Comparison 15 Diode laser pulpotomy versus electrosurgery pulpotomy, Outcome 7 Pulp canal obliteration.

Comparison 16 Sodium hypochlorite (NaOCl) pulpotomy versus 1:5 diluted formocresol pulpotomy, Outcome 1 Clinical failure.

Comparison 16 Sodium hypochlorite (NaOCl) pulpotomy versus 1:5 diluted formocresol pulpotomy, Outcome 2 Radiological failure.
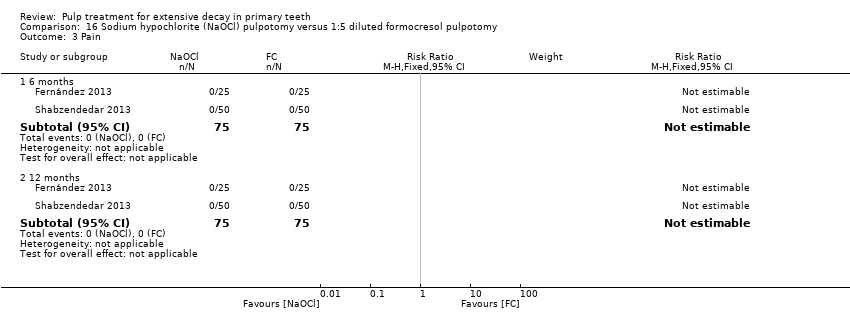
Comparison 16 Sodium hypochlorite (NaOCl) pulpotomy versus 1:5 diluted formocresol pulpotomy, Outcome 3 Pain.

Comparison 16 Sodium hypochlorite (NaOCl) pulpotomy versus 1:5 diluted formocresol pulpotomy, Outcome 4 Soft tissue pathology.

Comparison 16 Sodium hypochlorite (NaOCl) pulpotomy versus 1:5 diluted formocresol pulpotomy, Outcome 5 Pathologic mobility.

Comparison 16 Sodium hypochlorite (NaOCl) pulpotomy versus 1:5 diluted formocresol pulpotomy, Outcome 6 Pathologic radiolucency.

Comparison 16 Sodium hypochlorite (NaOCl) pulpotomy versus 1:5 diluted formocresol pulpotomy, Outcome 7 Pathologic root resorption.

Comparison 17 Enamel matrix derivative (EMD) pulpotomy versus formocresol pulpotomy, Outcome 1 Clinical failure.

Comparison 17 Enamel matrix derivative (EMD) pulpotomy versus formocresol pulpotomy, Outcome 2 Pain.

Comparison 17 Enamel matrix derivative (EMD) pulpotomy versus formocresol pulpotomy, Outcome 3 Soft tissue pathology.

Comparison 17 Enamel matrix derivative (EMD) pulpotomy versus formocresol pulpotomy, Outcome 4 Pathologic mobility.
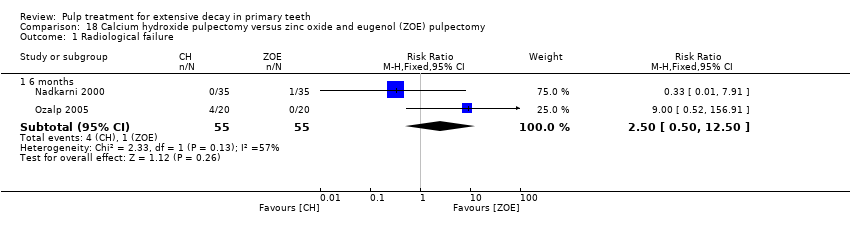
Comparison 18 Calcium hydroxide pulpectomy versus zinc oxide and eugenol (ZOE) pulpectomy, Outcome 1 Radiological failure.

Comparison 18 Calcium hydroxide pulpectomy versus zinc oxide and eugenol (ZOE) pulpectomy, Outcome 2 Pain.

Comparison 18 Calcium hydroxide pulpectomy versus zinc oxide and eugenol (ZOE) pulpectomy, Outcome 3 Pathological mobility.
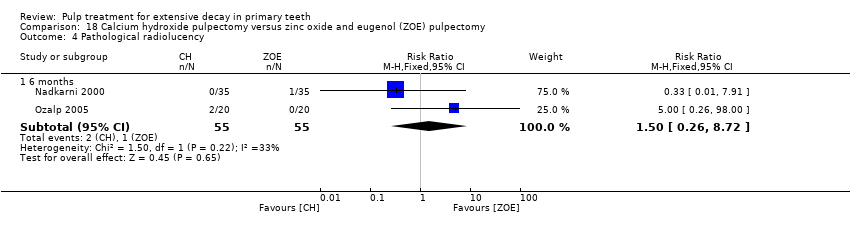
Comparison 18 Calcium hydroxide pulpectomy versus zinc oxide and eugenol (ZOE) pulpectomy, Outcome 4 Pathological radiolucency.
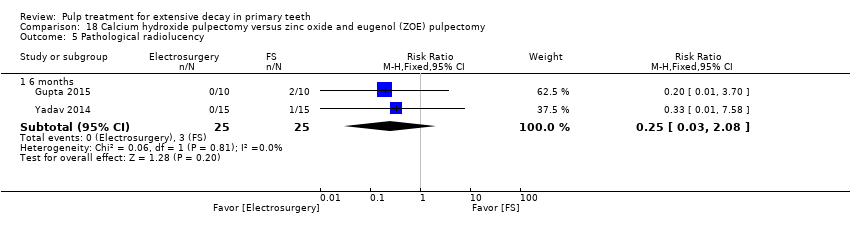
Comparison 18 Calcium hydroxide pulpectomy versus zinc oxide and eugenol (ZOE) pulpectomy, Outcome 5 Pathological radiolucency.

Comparison 19 Metapex versus zinc oxide eugenol (ZOE) pulpectomy, Outcome 1 Clinical failure.
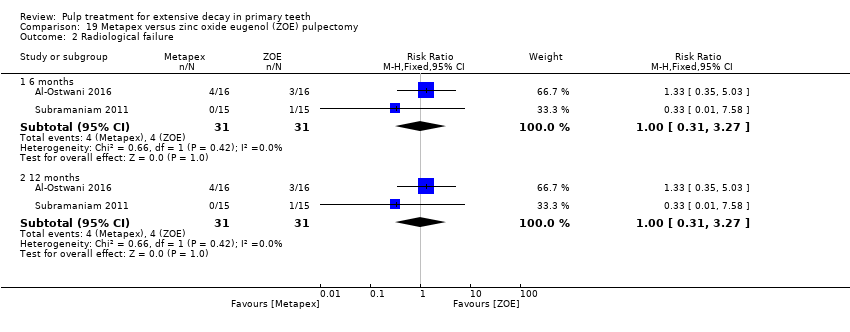
Comparison 19 Metapex versus zinc oxide eugenol (ZOE) pulpectomy, Outcome 2 Radiological failure.

Comparison 20 Metapex pulpectomy versus Endoflas pulpectomy, Outcome 1 Clincal failure.

Comparison 20 Metapex pulpectomy versus Endoflas pulpectomy, Outcome 2 Radiological failure.
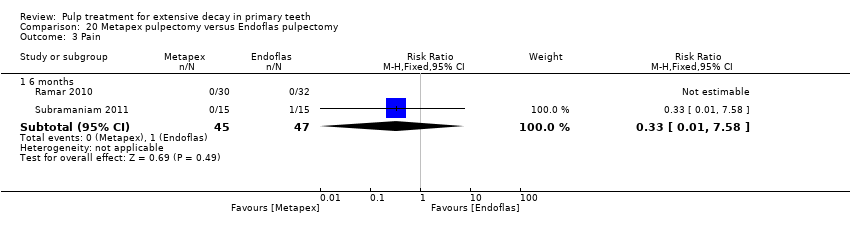
Comparison 20 Metapex pulpectomy versus Endoflas pulpectomy, Outcome 3 Pain.

Comparison 20 Metapex pulpectomy versus Endoflas pulpectomy, Outcome 4 Soft tissue pathology.

Comparison 20 Metapex pulpectomy versus Endoflas pulpectomy, Outcome 5 Pathologic mobility.

Comparison 20 Metapex pulpectomy versus Endoflas pulpectomy, Outcome 6 Pathological radiolucency.

Comparison 20 Metapex pulpectomy versus Endoflas pulpectomy, Outcome 7 Pathological root resorption.

Comparison 21 Vitapex pulpectomy versus zinc oxide and eugenol (ZOE) pulpectomy, Outcome 1 Clinical failure.
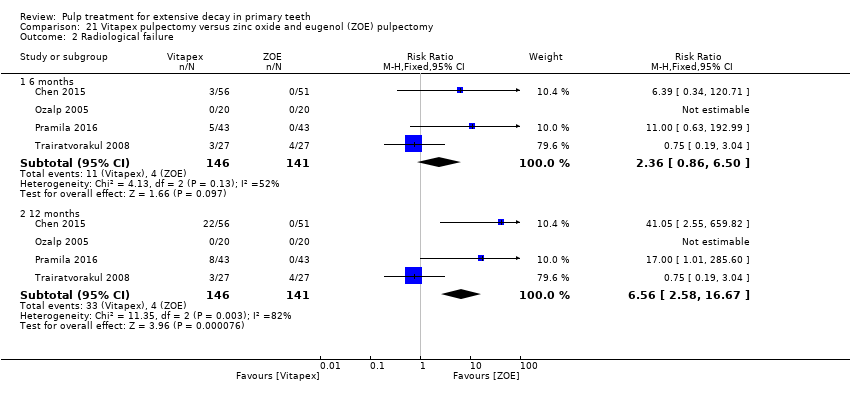
Comparison 21 Vitapex pulpectomy versus zinc oxide and eugenol (ZOE) pulpectomy, Outcome 2 Radiological failure.
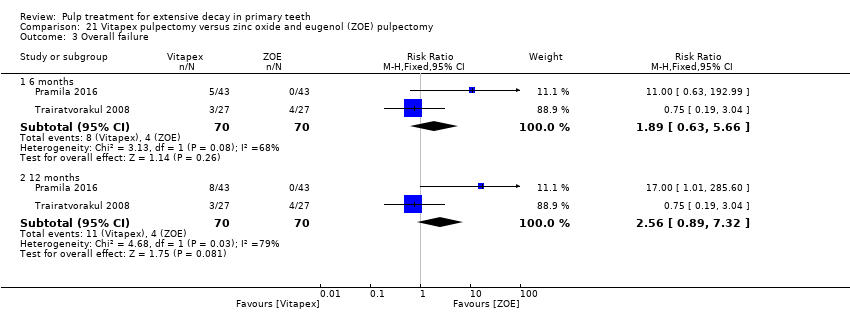
Comparison 21 Vitapex pulpectomy versus zinc oxide and eugenol (ZOE) pulpectomy, Outcome 3 Overall failure.

Comparison 21 Vitapex pulpectomy versus zinc oxide and eugenol (ZOE) pulpectomy, Outcome 4 Pain.
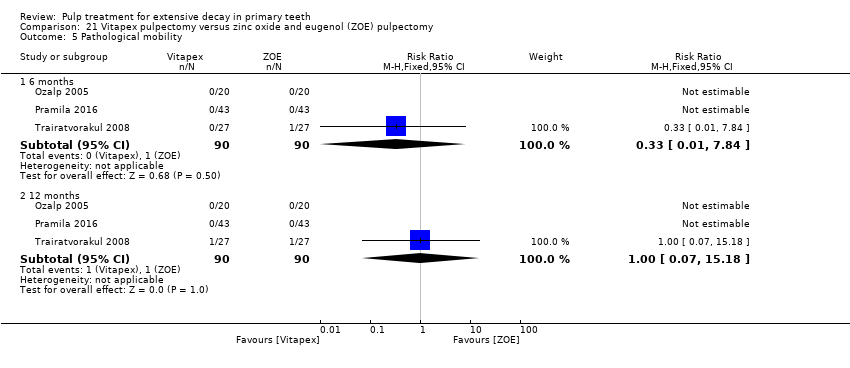
Comparison 21 Vitapex pulpectomy versus zinc oxide and eugenol (ZOE) pulpectomy, Outcome 5 Pathological mobility.

Comparison 22 Endoflas pulpectomy versus zinc oxide eugenol (ZOE) pulpectomy, Outcome 1 Clinical failure.
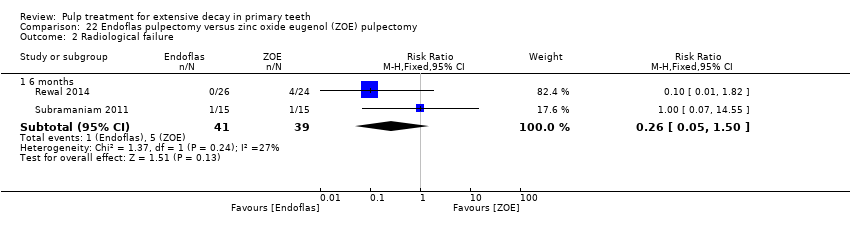
Comparison 22 Endoflas pulpectomy versus zinc oxide eugenol (ZOE) pulpectomy, Outcome 2 Radiological failure.

Comparison 22 Endoflas pulpectomy versus zinc oxide eugenol (ZOE) pulpectomy, Outcome 3 Pain.
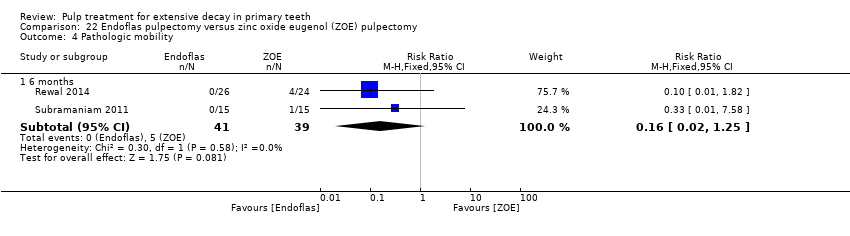
Comparison 22 Endoflas pulpectomy versus zinc oxide eugenol (ZOE) pulpectomy, Outcome 4 Pathologic mobility.

Comparison 22 Endoflas pulpectomy versus zinc oxide eugenol (ZOE) pulpectomy, Outcome 5 Pathologic radiolucency.
| Pulpotomy compared with pulpotomy using alternative medicament/technique for extensive decay in primary teeth | ||||||
| Population: children with extensive decay in primary teeth Settings: primary care Intervention: pulpotomy with one type of medicament Comparison: pulpotomy using alternative medicament or different technique | ||||||
| Outcomes | Illustrative comparative risks* (95% CI) | Relative effect | Number of participants | Quality of the evidence | Comments | |
| Assumed risk | Corresponding risk | |||||
| Control | Experimental | |||||
| MTA versus formocresol | ||||||
| Clinical failure (12 months) | 28 per 1000 | 8.6 per 1000 (2.8 per 1000 to 26.0 per 1000) | RR 0.31 (0.10 to 0.93) | 740 (12 studies) | ⊕⊕⊕⊝ | Failure rate less than 3% across both the MTA and formocresol treatment groups. Seven of the 12 studies had no failures at 12 months. No evidence of a difference in clinical failure at 6 months or 24 months |
| Radiological failure (12 months) | 50 per 1000 | 20.5 per 1000 (9.5 per 1000 to 44.5 per 1000) | RR 0.41 (0.19 to 0.89) | 740 (12 studies) | ⊕⊕⊕⊝ | Failure rate 5% across formocresol treatment groups and 2.1% across MTA treatment groups. Five of the 12 studies had no failures at 12 months. Results similar at 6 and 24 months |
| MTA versus calcium hydroxide | ||||||
| Clinical failure (12 months) | 14 per 1000 | 2.2 per 1000 (0.02 per 1000 to 9.8 per 1000) | RR 0.16 (0.04 to 0.70) | 150 (4 studies) | ⊕⊕⊕⊝ | Results similar at 24 months. No evidence of a difference in clinical failure at 6 months |
| Radiological failure (12 months) | 351 per 1000 | 42.1 per 1000 (14 per 1000 to 126.4 per 1000) | RR 0.12 (0.04 to 0.36) | 150 (4 studies) | ⊕⊕⊝⊝ | Results similar at 6 and 24 months |
| Calcium hydroxide versus formocresol | ||||||
| Clinical failure (12 months) | 115 per 1000 | 215 per 1000 (140.3 per 1000 to 332.4 per 1000) | RR 1.87 (1.22 to 2.89) | 332 (6 studies) | ⊕⊕⊕⊝ | Results similar at 6 months No evidence of a difference in clinical failure at 24 months |
| Radiological failure (12 months) | 253 per 1000 | 470.6 per 1000 (359.3 per 1000 to 617.3 per 1000) | RR 1.86 (1.42 to 2.44) | 332 (6 studies) | ⊕⊕⊕⊝ | Results similar at 6 and 24 months |
| Other comparisons assessed in more than one trial that had treatment failures | ||||||
| Clinical failure (at six, 12 and 24 months) | The quality of the evidence waslow for 4 comparisons3: laser versus ferric sulphate; Biodentine versus MTA; ferric sulphate versus formocresol; electrosurgery versus ferric sulphate; calcium hydroxide versus ferric sulphate. The quality of the evidence was very low for 5 comparisons: NaOCl versus ferric sulphate4; laser versus electrosurgery4; MTA versus ferric sulphate5; ABS versus ferric sulphate6; EMD versus formocresol7. | |||||
| Radiological failure (at six, 12 and 24 months) | The quality of the evidence waslow for 8 comparisons: NaOCl versus ferric sulphate2; MTA versus ferric sulphate3; Biodentine versus MTA3; ferric sulphate versus formocresol3; laser versus ferric sulphate3; electrosurgery versus ferric sulphate3; ABS versus ferric sulphate3; laser versus electrosurgery3; calcium hydroxide versus ferric sulphate (favouring ferric sulphate)3. | |||||
| *The basis for the assumed risk (e.g. the median control group risk across studies) is provided in footnotes. The corresponding risk (and its 95% confidence interval) is based on the assumed risk in the comparison group and the relative effect of the intervention (and its 95% CI). | ||||||
| GRADE Working Group grades of evidence | ||||||
| 1. Downgraded 1 level due to high risk of bias | ||||||
| Pulpectomy compared with pulpectomy using alternative medicament for extensive decay in primary teeth | ||||||
| Population: children with extensive decay in primary teeth Settings: primary care Intervention: pulpectomy with 1 type of medicament Comparison: pulpectomy using alternative medicament | ||||||
| Outcomes | Illustrative comparative risks* (95% CI) | Relative effect | Number of Participants | Quality of the evidence | Comments | |
| Assumed risk | Corresponding risk | |||||
| Control | Experimental | |||||
| Endoflas versus ZOE | ||||||
| Clinical failure (6 months) | 128 per 1000 | 33.3 per 1000 (6.4 per 1000 to 192 per 1000) | RR 0.26 (0.05 to 1.50) | 80 (2 studies) | ⊕⊕⊕⊝ | One trial assessed failure at 12 months: RR 1.00, 95% 0.07 to 14.55 |
| Radiological failure (6 months) | 128 per 1000 | 33.3 per 1000 (6.4 per 1000 to 192 per 1000) | RR 0.26 (0.05 to 1.50) | 80 (2 studies) | ⊕⊕⊕⊝ | |
| Metapex versus ZOE | ||||||
| Clinical failure (12 months) | 97 per 1000 | 68.9 per 1000 (14.6 per 1000 to 323 per 1000) | RR 0.71 (0.15 to 3.33) | 62 (2 studies) | ⊕⊕⊕⊝ | Results similar at 6 months |
| Radiological failure (12 months) | 129 per 1000 | 129 per 1000 (40 per 1000 to 421.8 per 1000) | RR 1.00 (0.31 to 3.27) | 62 (2 studies) | ⊕⊕⊕⊝ | Results similar at 6 months |
| Other comparisons assessed in more than one trial that had treatment failures | ||||||
| Clinical failure | The quality of the evidence was rated as low for 1 comparison: Vitapex versus ZOE (favouring ZOE)2 | |||||
| Radiological failure | The quality of the evidence was rated as low for 2 comparisons: Vitapex versus ZOE2 (favouring ZOE); calcium hydroxide versus ZOE3 | |||||
| 1. Downgraded 1 level due to imprecision | ||||||
| Direct pulp capping compared with direct pulp capping using alternative medicament for extensive decay in primary teeth | ||||||
| Population: children with extensive decay in primary teeth Settings: primary care Intervention: direct pulp capping with 1 type of medicament Comparison: direct pulp capping using alternative medicament | ||||||
| Outcomes | Illustrative comparative risks* (95% CI) | Relative effect | Number of participants | Quality of the evidence | Comments | |
| Assumed risk | Corresponding risk | |||||
| Control | Experimental | |||||
| Seven trials evaluated 22 comparisons of different medicaments for direct pulp capping. Each comparison was assessed by a single trial. There were no clinical or radiological failures in two comparisons: acetone‐based total‐etch adhesive versus calcium hydroxide; MTA versus calcium hydroxide. | ||||||
| Clinical failure (at six, 12 and 24 months) | The quality of the evidence was assessed as low for 5 comparisons1: calcium hydroxide versus formocresol (favouring formocrescol), MTA versus 3Mix and MTA versus simvastatin (favouring MTA), 3Mix versus 3Mixtatin and 3Mixtatin versus simvastatin (favouring 3Mixtatin). The quality of the evidence was rated as very low for all other comparisons.2 | |||||
| Radiological failure (at six, 12 and 24 months) | The quality of the evidence was rated as low for 1 comparison: calcium hydroxide versus formocresol1 (favouring formocresol). The quality of the evidence was rated as very low for all other comparisons.2 | |||||
| *The basis for the assumed risk (e.g. the median control group risk across studies) is provided in footnotes. The corresponding risk (and its 95% confidence interval) is based on the assumed risk in the comparison group and the relative effect of the intervention (and its 95% CI). | ||||||
| GRADE Working Group grades of evidence | ||||||
| 1. Downgraded 1 level due to risk of bias and 1 level due to imprecision | ||||||
| Outcome | Time point (months) | No. of studies | Risk ratio (95% CI) |
| Pain | mean 22 | 1 | Not estimable* |
| Soft tissue pathology | mean 22 | 1 | Not estimable* |
| Pathological mobility | mean 22 | 1 | Not estimable* |
| Pathological radiolucency | mean 22 | 1 | 3.46 (0.17 to 70.69) |
| Pathological root resorption | mean 22 | 1 | 2.75 (0.82 to 9.29) |
| Pulp canal obliteration | mean 22 | 1 | 0.83 (0.51 to 1.33) |
| *due to lack of events Abbreviations ‐ CI: confidence interval; FS: ferric sulphate; MTA: mineral trioxide aggregate | |||
| Outcome | Time point (months) | No. of studies | Risk ratio (95% CI) |
| Clinical failure | 6, 12 and 18 | 1 | Not estimable* |
| Radiological failure | 6 | 1 | Not estimable* |
| 12 | 1 | 0.33 (0.04 to 2.94) | |
| 18 | 1 | 0.33 (0.04 to 2.94) | |
| Pathological root resorption | 6 | 1 | Not estimable* |
| 12 | 1 | 0.33 (0.04 to 2.94) | |
| 18 | 1 | 0.33 (0.04 to 2.94) | |
| *due to lack of events Abbreviations ‐ CEM: calcium‐enriched mixture; CI: confidence interval; MTA: mineral trioxide aggregate | |||
| Outcome | Time point (months) | No. of studies | Risk ratio (95% CI) |
| Clinical failure | 6 and 12 | 1 | Not estimable* |
| 24 | 1 | 0.33 (0.01, 7.81) | |
| Radiological failure | 6 and 12 | 1 | 0.14 (0.01, 2.63) |
| 24 | 1 | 0.33 (0.04, 2.99) | |
| Overall failure | 24 | 1 | 0.33 (0.04, 2.99) |
| Pain | 6, 12 and 24 months | 1 | Not estimable* |
| Soft tissue pathology | 6 and 12 | 1 | Not estimable* |
| 24 | 1 | 0.33 (0.01, 7.81) | |
| Pathologic mobility | 6, 12 and 24 months | 1 | Not estimable* |
| Pathologic radiolucency | 6, 12 and 24 months | 1 | Not estimable* |
| Pathologicroot resorption | 6 and 12 | 1 | 0.14 (0.01, 2.63) |
| 24 | 1 | 0.33 (0.04, 2.99) | |
| *due to lack of events Abbreviations ‐ CI: confidence interval; MTA: mineral trioxide aggregate; NaOCl: sodium hypochlorite | |||
| Outcome | Time point (months) | No. of studies | Risk ratio (95% CI) |
| Clinical failure | 6 and 12 | 1 | Not estimable* |
| Radiological failure | 6 | 1 | Not estimable* |
| 12 | 1 | 0.09 (0.01, 1.58) | |
| Soft tissue pathology | 6 and 12 | 1 | Not estimable* |
| Pathologic mobility | 6 and 12 | 1 | Not estimable* |
| Adjacent tissue inflammation | 6 and 12 | 1 | Not estimable* |
| Pathologic radiolucency | 6 | 1 | Not estimable* |
| 12 | 1 | 0.14 (0.01, 2.66) | |
| Pathologicroot resorption | 6 | 1 | Not estimable* |
| 12 | 1 | 0.14 (0.01, 2.66) | |
| Pulp canal obliteration | 6 | 1 | Not estimable* |
| 12 | 1 | 0.44 (0.15, 1.29) | |
| *due to lack of events Abbreviations ‐ CI: confidence interval; MTA: mineral trioxide aggregate; CH: calcium hydroxyde; NaOCl; sodium hypochlorite | |||
| Outcome | Time point (months) | No. of studies | Risk ratio (95% CI) |
| Clinical failure | 6 and 12 | 1 | Not estimable* |
| Radiological failure | 6 | 1 | Not estimable* |
| 12 | 1 | 0.20 (0.02, 1.61) | |
| Soft tissue pathology | 6 and 12 | 1 | Not estimable* |
| Pathologic mobility | 6 and 12 | 1 | Not estimable* |
| Adjacent tissue inflammation | 6 and 12 | 1 | Not estimable* |
| Pathologic radiolucency | 6 | 1 | Not estimable* |
| 12 | 1 | 0.14 (0.01, 2.66) | |
| Pathologic root resorption | 6 | 1 | Not estimable* |
| 12 | 1 | 0.33 (0.04, 3.03) | |
| Pulp canal obliteration | 6 | 1 | Not estimable* |
| 12 | 1 | 0.67 (0.27, 1.65) | |
| *due to lack of events Abbreviations ‐ CI: confidence interval; MTA: mineral trioxide aggregate; NaOCl; sodium hypochlorite; CH: calcium hydroxyde. | |||
| Outcome | Time point (months) | No. of studies | Risk ratio (95% CI) |
| Pain | 6 | 1 | 0.06 (0.00, 0.98) |
| Soft tissue pathology | 6 | 1 | 0.08 (0.00, 1.31) |
| Pathologic mobility | 6 | 1 | 0.06 (0.00, 0.98) |
| Pathologic radiolucency | 6 | 1 | 0.03 (0.00, 0.55) |
| Pathologic root resorption | 6 | 1 | 0.05 (0.00, 0.78) |
| Pulp canal obliteration | 6 | 1 | 0.11 (0.01, 1.98) |
| *due to lack of events Abbreviations ‐ CI: confidence interval; MTA: mineral trioxide aggregate. | |||
| Outcome | Time point (months) | No. of studies | Risk ratio (95% CI) |
| Clinical failure | 6 | 1 | Not estimable* |
| 12 | 1 | Not estimable* | |
| 24 | 1 | 0.20 (0.03 to 1.59) | |
| Radiological failure | 6 | 1 | 0.33 (0.01 to 7.81) |
| 12 | 1 | 0.20 (0.01 to 3.97) | |
| 24 | 1 | 0.10 (0.01 to 0.72) | |
| Overall failure | 6 | 1 | 0.33 (0.01 to 7.81) |
| 12 | 1 | 0.20 (0.01 to 3.97) | |
| 24 | 1 | 0.13 (0.02 to 0.93) | |
| Pain | 6 | 1 | Not estimable* |
| 12 | 1 | Not estimable* | |
| 24 | 1 | 3.00 (0.13 to 70.30) | |
| Pathological radiolucency | 6 | 1 | Not estimable* |
| 12 | 1 | Not estimable* | |
| 24 | 1 | 3.00 (0.13 to 70.30) | |
| Pathological root resorption | 6 | 1 | 0.33 (0.01 to 7.81) |
| 12 | 1 | 0.33 (0.01 to 7.81) | |
| 24 | 1 | 0.08 (0.00 to 1.30) | |
| Pulp canal obliteration | 6 | 1 | Not estimable* |
| 12 | 1 | 3.00 (0.13 to 70.30) | |
| 24 | 1 | 11.0 (0.64 to 188.96) | |
| Physiological root resorption | 6 | 1 | Not estimable* |
| 12 | 1 | Not estimable* | |
| 24 | 1 | 0.20 (0.01 to 3.97) | |
| *due to lack of events Abbreviations ‐ CI: confidence interval; MTA: mineral trioxide aggregate; ZOE: zinc oxide and eugenol | |||
| Outcome | Time point (months) | No. of studies | Risk ratio (95% CI) |
| Clinical failure | 15.7 | 1 | Not estimable* |
| Radiological failure | 15.7 | 1 | 4.00 (0.48 to 33.42) |
| Overall failure | 15.7 | 1 | 2.00 (0.40 to 9.99) |
| Pathological radiolucency | 15.7 | 1 | 3.00 (0.33 to 26.99) |
| Pathological root resorption | 15.7 | 1 | 1.50 (0.27 to 8.25) |
| *due to lack of events Abbreviations ‐ CI: confidence interval; FC: formocresol; MTA: mineral trioxide aggregate; ZOE: zinc oxide and eugenol | |||
| Outcome | Time point (months) | No. of studies | Risk ratio (95% CI) |
| Clinical failure | 6, 12 and 24 | 1 | 0.14 (0.01, 2.67) |
| Radiological failure | 24 | 1 | 0.29 (0.06, 1.28) |
| Overall failure | 6, 12 and 24 | 1 | 0.14 (0.01, 2.67) |
| Pain | 6, 12 and 24 | 1 | 0.33 (0.01, 7.91) |
| Soft tissue pathology | 6, 12 and 24 | 1 | 0.20 (0.01, 4.02) |
| Pathologic mobility | 6, 12 and 24 | 1 | 0.20 (0.01, 4.02) |
| Pathologic radiolucency | 24 | 1 | 0.40 (0.08, 1.93) |
| Pathologic root resorption | 24 | 1 | 0.20 (0.01, 4.02) |
| Abbreviations ‐ CI: confidence interval; MTA: mineral trioxide aggregate; EMD: enamel matrix derivative | |||
| Outcome | Time point (months) | No. of studies | Risk ratio (95% CI) |
| Clinical failure | 6 and 12 | 1 | 3.21 (0.14, 75.68) |
| Radiological failure | 6 | 1 | 9.64 (0.54, 171.09) |
| 12 | 1 | 2.69 (0.57, 12.70) | |
| Pathological radiolucency | 6 | 1 | 3.21 (0.14, 75.68) |
| 12 | 1 | 2.15 (0.43, 10.79) | |
| Pathological root resorption | 6 | 1 | 6.44 (0.83, 50.11) |
| 12 | 1 | 4.30 (1.00, 18.47) | |
| Pulp canal obliteration | 6 | 1 | 3.76 (0.85, 16.54) |
| 12 | 1 | 1.61 (0.78, 3.33) | |
| Dentine bridge formation | 6 | 1 | 0.15 (0.01, 2.83) |
| 12 | 1 | 0.07 (0.00, 1.19) | |
| Abbreviation: CI: confidence interval | |||
| Outcome | Time point (months) | No. of studies | Risk ratio (95% CI) |
| Clinical failure | 6 and 12 | 1 | Not estimable* |
| Radiological failure | 6 and 12 | 1 | 0.33 (0.01, 7.88) |
| Soft tissue pathology | 6 and 12 | 1 | Not estimable* |
| Pathologic mobility | 6 and 12 | 1 | Not estimable* |
| Adjacent tissue inflammation | 6 and 12 | 1 | Not estimable* |
| Pathologic radiolucency | 6 and 12 | 1 | Not estimable* |
| Pathologic root resorption | 6 and 12 | 1 | 0.33 (0.01, 7.88) |
| Pulp canal obliteration | 6 | 1 | Not estimable* |
| 12 | 1 | 0.67 (0.21, 2.13) | |
| * due to lack of events Abbreviations ‐ CI: confidence interval; MTA: mineral trioxide aggregate; NaOCl; sodium hypochlorite. | |||
| Outcome | Time point (months) | No. of studies | Risk ratio (95% CI) |
| Clinical failure | 6 | 1 | Not estimable* |
| 12 | 1 | 0.33 (0.01, 7.98) | |
| Radiological failure | 6 | 1 | 1.00 (0.06, 15.52) |
| 12 | 1 | 0.50 (0.05, 5.33) | |
| Pain | 6 and 12 | 1 | Not estimable* |
| Soft tissue pathology | 6 | 1 | Not estimable* |
| 12 | 1 | 0.33 (0.01, 7.98) | |
| Pathologic mobility | 6 and 12 | 1 | Not estimable* |
| Pathologic radiolucency | 6 | 1 | 0.33 (0.01, 7.98) |
| 12 | 1 | 0.20 (0.01, 4.06) | |
| Pathologic root resorption | 6 | 1 | 3.00 (0.13, 71.82) |
| 12 | 1 | 1.00 (0.06, 15.52) | |
| *due to lack of events Abbreviation: CI: confidence interval. | |||
| Outcome | Time point (months) | No. of studies | Risk ratio (95% CI) |
| Clinical failure | 6 and 12 | 1 | Not estimable* |
| Radiological failure | 6 and 12 | 1 | 0.35 (0.04, 3.22) |
| Pain | 6 and 12 | 1 | Not estimable* |
| Soft tissue pathology | 6 and 12 | 1 | Not estimable* |
| Pathologic mobility | 6 and 12 | 1 | Not estimable* |
| Pathologic radiolucency | 6 and 12 | 1 | 0.35 (0.01, 8.32) |
| Pathologic root resorption | 6 and 12 | 1 | 0.35 (0.04, 3.22) |
| *due to lack of events Abbreviation: CI: confidence interval. | |||
| Outcome | Time point (months) | No. of studies | Risk ratio (95% CI) |
| Clinical failure | 6 | 1 | Not estimable* |
| 12 | 1 | 3.13 (0.13, 74.85) | |
| Radiological failure | 6 | 1 | 0.35 (0.04, 3.22) |
| 12 | 1 | 0.70 (0.12, 3.98) | |
| Pain | 6 and 12 | 1 | Not estimable* |
| Soft tissue pathology | 6 | 1 | Not estimable* |
| 12 | 1 | 3.13 (0.13, 74.85) | |
| Pathologic mobility | 6 and 12 | 1 | Not estimable* |
| Pathologic radiolucency | 6 | 1 | 1.04 (0.07, 16.19) |
| 12 | 1 | 2.09 (0.20, 22.24) | |
| Pathologic root resorption | 6 | 1 | 0.15 (0.01, 2.81) |
| 12 | 1 | 0.35 (0.04, 3.22) | |
| *due to lack of events Abbreviation: CI: confidence interval. | |||
| Outcome | Time point (months) | No. of studies | Risk ratio (95% CI) |
| Clinical failure | 6 | 1 | 5.00 (0.26, 96.13) |
| 12 and 24 | 1 | 13.00 (0.80, 212.02) | |
| Radiological failure | 6 | 1 | 13.00 (0.80, 212.02) |
| 12 | 1 | 17.00 (1.07 to 270.41) | |
| 24 | 1 | 21.00 (1.34 to 328.86) | |
| Soft tissue pathology | 6 | 1 | 5.00 (0.26, 96.13) |
| 12 and 24 | 1 | 13.00 (0.80, 212.02) | |
| Pathologic mobility | 6 | 1 | 5.00 (0.26, 96.13) |
| 12 and 24 | 1 | 13.00 (0.80, 212.02) | |
| Adjacent tissue inflammation | 6, 12 and 24 | 1 | Not estimable * |
| Pathologic radiolucency | 6 | 1 | 13.00 (0.80, 212.02) |
| 12 | 1 | 17.00 (1.07 to 270.41) | |
| 24 | 1 | 21.00 (1.34 to 328.86) | |
| Pathologic root resorption | 6 | 1 | 13.00 (0.80, 212.02) |
| 12 | 1 | 17.00 (1.07 to 270.41) | |
| 24 | 1 | 21.00 (1.34 to 328.86) | |
| Dentine bridge formation | 6, 12 and 24 | 1 | 0.50 (0.11 to 2.33) |
| *due to lack of events Abbreviations ‐ CI: confidence interval; CH: calcium hydroxide; PC: Portland cement. | |||
| Outcome | Time point (months) | No. of studies | Risk ratio (95% CI) |
| Clinical failure | 6 | 1 | Not estimable* |
| 12 | 1 | 3.00 (0.13, 70.92) | |
| Radiological failure | 6 | 1 | 5.00 (0.62, 40.36) |
| 12 | 1 | 8.00 (1.06, 60.21) | |
| Soft tissue pathology | 6 | 1 | Not estimable* |
| 12 | 1 | 3.00 (0.13, 70.92) | |
| Pathologic mobility | 6 and 12 | 1 | Not estimable* |
| Adjacent tissue inflammation | 6 and 12 | 1 | Not estimable* |
| Pathologic radiolucency | 6 | 1 | Not estimable* |
| 12 | 1 | 15.00 (0.89, 251.77) | |
| Pathologic root resorption | 6 | 1 | Not estimable* |
| 12 | 17.00 (1.02, 282.30) | ||
| Pulp canal obliteration | 6 | 1 | Not estimable* |
| 12 | 1 | 1.33 (0.52, 3.39) | |
| *due to lack of events Abbreviations ‐ CI: confidence interval; CH: calcium hydroxyde; MTA: mineral trioxide aggregate; NaOCl; sodium hypochlorite. | |||
| Outcome | Time point (months) | No. of studies | Risk ratio (95% CI) |
| Clinical failure | 6 | 1 | 0.31 (0.01 to 7.48) |
| 12 | 1 | 0.94 (0.60 to 14.52) | |
| 24 | 1 | 0.62 (0.11 to 3.56) | |
| Radiological failure | 12 | 1 | 0.56 (0.14 to 2.21) |
| 24 | 1 | 0.31 (0.11 to 0.90) | |
| Overall failure | 12 | 1 | 0.56 (0.14 to 2.21) |
| 24 | 1 | 0.31 (0.11 to 0.90) | |
| Pain | 6, 12 and 24 | 1 | Not estimable* |
| Soft tissue pathology | 6, 12 and 24 | 1 | Not estimable* |
| Pathological mobility | 6, 12 and 24 | 1 | Not estimable* |
| Pathological radiolucency | 12 | 1 | 0.31 (0.01 to 7.48) |
| 24 | 1 | 0.62 (0.11 to 3.56) | |
| Pathological root resorption | 12 | 1 | 0.94 (0.60 to 14.52) |
| 24 | 1 | 0.62 (0.11 to 3.56) | |
| *due to lack of events Abbreviations ‐ CI: confidence interval; Er:YAG: erbium:yttrium‐aluminium garnet; CH: calcium hydroxide. | |||
| Outcome | Time point (months) | No. of studies | Risk ratio (95% CI) |
| Clinical failure | 6 | 1 | 1.41 (0.77 to 2.58) |
| 12 | 1 | 1.13 (0.82 to 1.54) | |
| Radiological failure | 6 | 1 | 1.33 (0.89 to 2.00) |
| 12 | 1 | 1.17 (0.87 to 1.59) | |
| Pain | 6 | 1 | 1.72 (0.45 to 6.61) |
| 12 | 1 | 1.03 (0.33 to 3.23) | |
| Soft tissue pathology | 6 | 1 | 1.55 (0.28 to 8.65) |
| 12 | 1 | 1.03 (0.22 to 4.74) | |
| Pathological radiolucency | 6 and 12 | 1 | 5.15 (0.26 to 103.31) |
| Pathological root resorption | 6 | 1 | 1.72 (0.45 to 6.61) |
| 12 | 1 | 1.29 (0.38 to 4.37) | |
| CI: confidence interval; CH: calcium hydroxide. | |||
| Outcome | Time point (months) | No. of studies | Risk ratio (95% CI) |
| Clinical failure | 6 | 1 | Not estimable* |
| 12 | 1 | 0.33 (0.01, 7.88) | |
| Radiological failure | 6 | 1 | 0.09 (0.01, 1.58) |
| 12 | 1 | 0.63 (0.23, 1.70) | |
| Soft tissue pathology | 6 | 1 | Not estimable* |
| 12 | 1 | 0.33 (0.01, 7.88) | |
| Pathologic mobility | 6 and 12 | 1 | Not estimable* |
| Adjacent tissue inflammation | 6 and 12 | 1 | Not estimable* |
| Pathologic radiolucency | 6 | 1 | Not estimable* |
| 12 | 1 | 0.43 (0.12, 1.51) | |
| Pathologic root resorption | 6 | 1 | Not estimable* |
| 12 | 0.38 (0.11, 1.28) | ||
| Pulp canal obliteration | 6 | 1 | Not estimable* |
| 12 | 1 | 1.13 (0.50, 2.53) | |
| *due to lack of events Abbreviations ‐ CI: confidence interval; CH: calcium hydroxide; NaOCl: sodium hypochlorite. | |||
| Outcome | Time point (months) | No. of studies | Risk ratio (95% CI) |
| Pain | 6 | 1 | 0.25 (0.06, 1.08) |
| Soft tissue pathology | 6 | 1 | 0.33 (0.07, 1.52) |
| Pathologic mobility | 6 | 1 | 0.75 (0.30, 1.90) |
| Pathologic radiolucency | 6 | 1 | 1.14 (0.69, 1.90) |
| Pathologic root resorption | 6 | 1 | 1.20 (0.61, 2.34) |
| Pulp canal obliteration | 6 | 1 | 0.11 (0.01, 1.98) |
| *due to lack of events Abbreviations ‐ CI: confidence interval; FS: ferric sulfate. | |||
| Outcome | Time point (months) | No. of studies | Risk ratio (95% CI) |
| Clinical failure | 6 and 12 | 1 | Not estimable* |
| 24 | 1 | 1.20 (0.42 to 3.43) | |
| Radiological failure | 6 | 1 | 0.33 (0.01 to 7.81) |
| 12 | 1 | 0.20 (0.01 to 3.97) | |
| 24 | 1 | 0.60 (0.26 to 1.40) | |
| Overall failure | 6 | 1 | 0.33 (0.01 to 7.81) |
| 12 | 1 | 0.20 (0.01 to 3.97) | |
| 24 | 1 | 0.38 (0.11 to 1.25) | |
| Pain | 6, 12 and 24 | 1 | Not estimable* |
| Pathological radiolucency | 6, 12 and 24 | 1 | Not estimable* |
| Pathological root resorption | 6 | 1 | 0.33 (0.01 to 7.81) |
| 12 | 1 | 0.33 (0.01 to 7.81) | |
| 24 | 1 | 0.17 (0.02 to 1.29) | |
| Physiological root resorption | 6 and 12 | 1 | Not estimable* |
| 24 | 1 | 1.50 (0.27 to 8.22) | |
| Pulp canal obliteration | 6, 12 and 24 | 1 | Not estimable* |
| *due to lack of events Abbreviations ‐ CI: confidence interval; FS: ferric sulphate; ZOE: zinc oxide and eugenol | |||
| Outcome | Time point (months) | No. of studies | Risk ratio (95% CI) |
| Clinical failure | 6 | 1 | Not estimable* |
| 12 | 1 | 3.19 (0.13 to 76.37) | |
| 24 | 1 | 5.31 (0.26 to 107.86) | |
| Radiological failure | 12 | 1 | 0.46 (0.13 to 1.66) |
| 24 | 1 | 0.61 (0.19 to 1.94) | |
| Overall failure | 12 | 1 | 0.46 (0.13 to 1.66) |
| 24 | 1 | 0.61 (0.19 to 1.94) | |
| Pain | 6, 12 and 24 | 1 | Not estimable* |
| Soft tissue pathology | 6, 12 and 24 | 1 | Not estimable* |
| Pathological mobility | 6, 12 and 24 | 1 | Not estimable* |
| Pathological radiolucency | 12 | 1 | 0.15 (0.01 to 2.86) |
| 24 | 1 | 0.71 (0.12 to 4.06) | |
| Pathological root resorption | 12 | 1 | 0.53 (0.05 to 5.67) |
| 24 | 1 | 1.06 (0.16 to 7.25) | |
| *due to lack of events Abbreviations ‐ CI: confidence interval; Er:YAG: erbium:yttrium‐aluminium garnet; FS: ferric sulphate | |||
| Outcome | Time point (months) | No. of studies | Risk ratio (95% CI) |
| Pain | mean 22 | 1 | 0.25 (0.01 to 6.08) |
| Soft tissue pathology | mean 22 | 1 | 0.25 (0.01 to 6.08) |
| Pathological mobility | mean 22 | 1 | 0.15 (0.01 to 3.09) |
| Adjacent tissue inflammation | mean 22 | 1 | 0.25 (0.01 to 6.08) |
| Pathological radiolucency | mean 22 | 1 | 0.29 (0.01 to 6.92) |
| Pathological root resorption | mean 22 | 1 | 0.60 (0.31 to 1.19) |
| Pulp canal obliteration | mean 22 | 1 | 1.39 (0.78 to 2.49) |
| CI: confidence interval; FS: ferric sulphate; MTA: mineral trioxide aggregate | |||
| Outcome | Time point (months) | No. of studies | Risk ratio (95% CI) |
| Clinical failure | 6, 12 and 24 | 1 | 2.00 (0.19, 21.06) |
| Radiological failure | 24 | 1 | 0.80 (0.23, 2.73) |
| Overall failure | 6, 12 and 24 | 1 | 2.00 (0.19, 21.06) |
| Pain | 6, 12 and 24 | 1 | 1.00 (0.07, 15.36) |
| Soft tissue pathology | 6, 12 and 24 | 1 | 2.00 (0.19, 21.06) |
| Pathologic mobility | 6, 12 and 24 | 1 | 3.00 (0.13, 71.22) |
| Pathologic radiolucency | 24 | 1 | 1.00 (0.22, 4.62) |
| Pathologic root resorption | 24 | 1 | 0.50 (0.05, 5.27) |
| Abbreviations ‐ CI: confidence interval; PC: Portland cement; FC: formocresol | |||
| Outcome | Time point (months) | No. of studies | Risk ratio (95% CI) |
| Clinical failure | 6, 12 and 24 | 1 | 0.67 (0.12, 3.75) |
| Radiological failure | 24 | 1 | 0.57 (0.18, 1.78) |
| Overall failure | 6, 12 and 24 | 1 | 0.67 (0.12, 3.75) |
| Pain | 6, 12 and 24 | 1 | 1.00 (0.07, 15.36) |
| Soft tissue pathology | 6, 12 and 24 | 1 | 1.00 (0.15, 6.71) |
| Pathologic mobility | 6, 12 and 24 | 1 | 0.50 (0.05, 5.27) |
| Pathologic radiolucency | 24 | 1 | 0.60 (0.16, 2.32) |
| Pathologic root resorption | 24 | 1 | 0.50 (0.05, 5.27) |
| *due to lack of events Abbreviations ‐ CI: confidence interval; PC: Portland cement; EMD: enamel matrix derivative | |||
| Outcome | Time point (months) | No. of studies | Risk ratio (95% CI) |
| Clinical failure | 12 | 1 | 2.90 (0.32 to 26.38) |
| Radiological failure | 12 | 1 | 1.11 (0.46 to 2.67) |
| Pain | 12 | 1 | Not estimable* |
| Pathological radiolucency | 12 | 1 | 0.97 (0.39 to 2.43) |
| Pathological root resorption | 12 | 1 | 0.97 (0.15 to 6.44) |
| *due to lack of events Abbreviations ‐ CH: calcium hydroxide; CI: confidence interval; ZOE: zinc oxide and eugenol | |||
| Outcome | Time point (months) | No. of studies | Risk ratio (95% CI) |
| Clinical failure | 6 | 1 | 0.83 (0.26, 2.73) |
| Radiological failure | 6 | 1 | 0.94 (0.47, 1.88) |
| Overall failure | 6 | 1 | 0.94 (0.47, 1.88) |
| Pain | 6 | 1 | Not estimable* |
| Soft tissue pathology | 6 | 1 | 0.83 (0.26, 2.73) |
| Pathologic mobility | 6 | 1 | Not estimable* |
| Pathologic radiolucency | 6 | 1 | 1.04 (0.43, 2.51) |
| Pathologic root resorption | 6 | 1 | 0.75 (0.28, 2.02) |
| Pulp canal obliteration | 6 | 1 | 1.04 (0.16, 6.80) |
| *due to lack of events Abbreviations ‐ CI: confidence interval; CH: calcium hydroxide; ZOE: zinc oxide eugenol | |||
| Outcome | Time point (months) | No. of studies | Risk ratio (95% CI) |
| Clinical failure | 9 | 1 | 3.00 (0.13 to 71.22) |
| Radiological failure | 9 | 1 | 5.00 (0.62 to 40.64) |
| Pain | 6 | 1 | Not estimable* |
| Soft tissue pathology | 6 | 1 | 3.00 (0.13 to 71.22) |
| Pathological mobility | 6 | 1 | Not estimable* |
| Pathological radiolucency | 6 | 1 | 5.00 (0.25 to 100.54) |
| Pathological root resorption | 6 | 1 | 5.00 (0.25 to 100.54) |
| *due to lack of events Abbreviations ‐ CI: confidence interval; FC: formocresol | |||
| Outcome | Time point (months) | No. of studies | Risk ratio (95% CI) |
| Clinical failure | 6 and 12 | 1 | 1.08 (0.07, 16.36) |
| Radiological failure | 6 and 12 | 1 | 0.54 (0.11, 2.70) |
| Pathological radiolucency | 6 | 1 | 2.16 (0.21, 22.38) |
| 12 | 1 | 0.54 (0.11, 2.70) | |
| Pathological root resorption | 6 | 1 | 0.36 (0.08, 1.62) |
| 12 | 1 | 0.31 (0.07, 1.35) | |
| Pulp canal obliteration | 6 | 1 | 1.39 (0.61, 3.17) |
| 12 | 1 | 1.08 (0.60, 1.94) | |
| Dentine bridge formation | 6 | 1 | Not estimable* |
| 12 | 1 | 11.85 (0.69, 203.86) | |
| *due to lack of events Abbreviations ‐ CI: confidence interval | |||
| Outcome | Time point (months) | No. of studies | Risk ratio (95% CI) |
| Clinical failure | 6 | 1 | 16.41 (2.30 to 117.26) |
| 12 | 1 | 9.11 (3.04 to 27.31) | |
| Radiological failure | 6 | 1 | 24.06 (3.44 to 168.43) |
| 12 | 1 | 9.11 (3.04 to 27.31) | |
| Pain | 6 | 1 | 5.47 (0.67 to 44.34) |
| 12 | 1 | 5.47 (0.67 to 44.34) | |
| Soft tissue pathology | 6 | 1 | 7.64 (0.41 to 142.35) |
| 12 | 1 | 7.64 (0.41 to 142.35) | |
| Pathological radiolucency | 6 | 1 | 2.19 (0.21 to 22.99) |
| 12 | 1 | 2.19 (0.21 to 22.99) | |
| Pathological root resorption | 6 | 1 | 12.00 (0.69 to 208.77) |
| 12 | 1 | 5.47 (0.67 to 44.34) | |
| Abbreviations ‐ CH: calcium hydroxide; CI: confidence interval; FC: formocresol | |||
| Outcome | Time point (months) | No. of studies | Risk ratio (95% CI) |
| Clinical failure | 6 | 1 | Not estimable* |
| 12 | 1 | Not estimable* | |
| 24 | 1 | 0.83 (0.29 to 2.38) | |
| Radiological failure | 6 | 1 | 3.00 (0.13 to 70.30) |
| 12 | 1 | 5.00 (0.25 to 99.17) | |
| 24 | 1 | 1.67 (0.71 to 3.89) | |
| Overall failure | 6 | 1 | 3.00 (0.13 to 70.30) |
| 12 | 1 | 5.00 (0.25 to 99.17) | |
| 24 | 1 | 2.67 (0.80 to 8.90) | |
| Pain | 6, 12 and 24 | 1 | Not estimable* |
| Pathological radiolucency | 6, 12 and 24 | 1 | Not estimable* |
| Pathological root resorption | 6 | 1 | 3.00 (0.13 to 70.30) |
| 12 | 1 | 3.00 (0.13 to 70.30) | |
| 24 | 1 | 6.00 (0.78 to 46.29) | |
| Pulp canal obliteration | 6 | 1 | Not estimable* |
| 12 | 1 | 0.20 (0.01 to 3.97) | |
| 24 | 1 | 0.20 (0.01 to 3.97) | |
| Physiological root resorption | 6 | 1 | Not estimable* |
| 12 | 1 | Not estimable* | |
| 24 | 1 | 2.00 (0.19 to 20.67) | |
| *due to lack of events Abbreviations ‐ CI: confidence interval; FC: formocresol; ZOE: zinc oxide and eugenol | |||
| Outcome | Time point (months) | No. of studies | Risk ratio (95% CI) |
| Clinical failure | 6 | 1 | Not estimable* |
| 12 | 1 | 3.19 (0.13 to 76.37) | |
| 24 | 1 | 2.13 (0.20 to 22.70) | |
| Radiological failure | 6 | 1 | Not estimable* |
| 12 | 1 | 1.60 (0.28 to 9.13) | |
| 24 | 1 | 1.06 (0.28 to 4.01) | |
| Overall failure | 6 | 1 | Not estimable* |
| 12 | 1 | 1.60 (0.28 to 9.13) | |
| 24 | 1 | 1.06 (0.28 to 4.01) | |
| Pain | 6, 12 and 24 | 1 | Not estimable* |
| Soft tissue pathology | 6 | 1 | Not estimable* |
| 12 | 1 | Not estimable* | |
| 24 | 1 | 0.35 (0.01 to 8.49) | |
| Pathological mobility | 6, 12 and 24 | 1 | Not estimable* |
| Pathological radiolucency | 6 | 1 | Not estimable* |
| 12 | 1 | 0.21 (0.01 to 4.31) | |
| 24 | 1 | 1.06 (0.16 to 7.25) | |
| Pathological root resorption | 6 | 1 | Not estimable* |
| 12 | 1 | 3.19 (0.13 to 76.37) | |
| 24 | 1 | 1.06 (0.16 to 7.25) | |
| *due to lack of events Abbreviations ‐ CI: confidence interval; Er:YAG: erbium:yttrium‐aluminium garnet; FC: formocresol | |||
| Outcome | Time point (months) | No. of studies | Risk ratio (95% CI) |
| Clinical failure | 6 | 1 | Not estimable* |
| 12 | 1 | 0.33 (0.01, 7.95) | |
| Radiological failure | 6 | 1 | 1.67 (0.43, 6.51) |
| 12 | 1 | 2.00 (0.75, 5.33) | |
| *due to lack of events Abbreviations ‐ CI: confidence interval; FC: formocresol. | |||
| Outcome | Time point (months) | No. of studies | Risk ratio (95% CI) |
| Clinical failure | 6 and 12 | 1 | 0.33 (0.01, 7.58) |
| 24 | 1 | 1.00 (0.16, 6.20) | |
| Radiological failure | 6 and 12 | 1 | 1.00 (0.16, 6.20) |
| 24 | 1 | 0.67 (0.13, 3.44) | |
| Pain | 6 and 12 | 1 | 0.33 (0.01, 7.58) |
| 24 | 1 | 1.00 (0.16, 6.20) | |
| Soft tissue pathology | 6, 12 and 24 months | 1 | 0.33 (0.01, 7.58) |
| Pathologic mobility | 6, 12 and 24 months | 1 | 0.33 (0.01, 7.58) |
| Pathological radiolucency | 6 and 12 | 1 | Not estimable* |
| Pathological root resorption | 6 and 12 | 1 | 1.00 (0.16, 6.20) |
| 24 | 1 | 0.67 (0.13, 3.44) | |
| *due to lack of events Abbreviation ‐ CI: confidence interval | |||
| Outcome | Time point (months) | No. of studies | Risk ratio (95% CI) |
| Clinical failure | 6 | 1 | 1.00 (0.07 to 14.90) |
| 12 | 1 | 0.50 (0.10 to 2.43) | |
| Radiological failure | 6 and 12 | 1 | 0.50 (0.10 to 2.43) |
| Pain | 6 and 12 | 1 | 1.00 (0.07 to 14.90) |
| Pathological mobility | 6 and 12 | 1 | 1.00 (0.07 to 14.90) |
| Pathological radiolucency | 6 and 12 | 1 | 0.20 (0.01 to 3.92) |
| Pathological root resorption | 6 and 12 | 1 | 5.00 (0.26 to 98.00) |
| Filling material anomaly | 6 and 12 | 1 | Not estimable* |
| *due to lack of events Abbreviations ‐ CI: confidence interval; Sealapex: eugenol‐free CH; CH: calcium hydroxide. | |||
| Outcome | Time point (months) | No. of studies | Risk ratio (95% CI) |
| Clinical failure | 6 | 1 | 0.33 (0.01 to 7.72) |
| 12 | 1 | 0.11 (0.01 to 1.94) | |
| Radiological failure | 6 and 12 | 1 | 0.11 (0.01 to 1.94) |
| Pain | 6 and 12 | 1 | 0.33 (0.01 to 7.72) |
| Pathological mobility | 6 and 12 | 1 | 0.33 (0.01 to 7.72) |
| Pathological radiolucency | 6 and 12 | 1 | 0.20 (0.01 to 3.92) |
| Pathological root resorption | 6 and 12 | 1 | Not estimable* |
| Filling material anomaly | 6 and 12 | 1 | 3.00 (0.13 to 69.52) |
| *due to lack of events Abbreviations ‐ CI: confidence interval; Vitapex: CH/iodoform; CH: calcium hydroxide. | |||
| Outcome | Time point (months) | No. of studies | Risk ratio (95% CI) |
| Clinical failure | 6 | 1 | 0.33 (0.01 to 7.72) |
| 12 | 1 | 0.20 (0.01 to 3.92) | |
| Radiological failure | 6 and 12 | 1 | 0.20 (0.01 to 3.92) |
| Pain | 6 and 12 | 1 | 0.33 (0.01 to 7.72) |
| Pathological mobility | 6 and 12 | 1 | 0.33 (0.01 to 7.72) |
| Pathological radiolucency | 6 and 12 | 1 | Not estimable* |
| Pathological root resorption | 6 and 12 | 1 | 0.20 (0.01 to 3.92) |
| Filling material anomaly | 6 and 12 | 1 | 3.00 (0.13 to 69.52) |
| *due to lack of events Abbreviations ‐ CI: confidence interval; Vitapex: CH/iodoform; CH: calcium hydroxide; Sealapex: eugenol‐free CH. | |||
| Outcome | Time point (months) | No. of studies | Risk ratio (95% CI) |
| Clinical failure | 6 | 1 | Not estimable* |
| 12 | 1 | 1.0 (0.07 to 15.12) | |
| Radiological failure | 6 | 1 | 1.25 (0.38 to 4.12) |
| 12 | 1 | 1.83 (0.80 to 4.19) | |
| Pain | 6 | 1 | Not estimable* |
| 12 | 1 | 3.00 (0.13 to 70.30) | |
| Soft tissue pathology | 6 | 1 | Not estimable* |
| 12 | 1 | 1.0 (0.07 to 15.12) | |
| Pathological mobility | 6 and 12 | 1 | Not estimable* |
| Pathological radiolucency | 6 | 1 | 1.50 (0.27 to 8.22) |
| 12 | 1 | 2.75 (1.01 to 7.48) | |
| Pathological root resorption | 6 and 12 | 1 | 0.20 (0.01 to 3.97) |
| Pulp canal obliteration | 6 | 1 | Not estimable* |
| 12 | 1 | 0.20 (0.01 to 3.97) | |
| *due to lack of events Abbreviations ‐ CI: confidence interval; Vitapex: CH/iodoform; CH: calcium hydroxide; 3Mix: ciprofloxacin + metronidazole + minocycline. | |||
| Outcome | Time point (months) | No. of studies | Risk ratio (95% CI) |
| Clinical failure | 6 | 1 | Not estimable* |
| 12 | 1 | 21.79 (1.32, 360.78) | |
| Radiological failure | 6 | 1 | 6.63 (0.35, 125.41) |
| 12 | 1 | 42.63 (2.65, 685.54) | |
| *due to lack of events Abbreviations ‐ CI: confidence interval; Vitapex: CH/iodoform; MPRCF: ZOE (zinc oxide eugenol), calcium hydroxide, iodoform. | |||
| Outcome | Time point (months) | No. of studies | Risk ratio (95% CI) |
| Pain | 24 | 1 | 1.80 (0.07 to 43.88) |
| Soft tissue pathology | 24 | 1 | 4.21 (0.22 to 80.70) |
| Pathological radiolucency | 24 | 1 | 0.60 (0.25 to 1.46) |
| Pathological root resorption | 24 | 1 | 21.04 (1.28 to 346.39) |
| Pulp canal obliteration | 24 | 1 | 27.05 (1.66 to 441.49) |
| Abbreviations ‐ CI: confidence interval; FS: ferric sulphate; Sedanol=ZOE: zinc oxide and eugenol. | |||
| Outcome | Time point (months) | No. of studies | Risk ratio (95% CI) |
| Clinical failure | 6 | 1 | 3.00 (0.13, 70.83) |
| 12 | 1 | 5.00 (0.25, 99.95) | |
| Pain | 6 | 1 | 3.00 (0.13, 70.83) |
| 12 | 1 | 5.00 (0.25, 99.95) | |
| Soft tissue pathology | 6 | 1 | Not estimable* |
| 12 | 1 | 3.00 (0.13, 70.83) | |
| Pathologic mobility | 6 and 12 | 1 | 3.00 (0.13, 70.83) |
| Pathologic radiolucency | 6 | 1 | 23.00 (1.42, 373.46) |
| 12 | 1 | 11.00 (0.64, 190.53) | |
| *due to lack events Abbreviations ‐ CI: confidence interval; 3Mix: ciprofloxacin + metronidazole + minocycline. | |||
| Outcome | Time point (months) | No. of studies | Risk ratio (95% CI) |
| Clinical failure | 24 | 1 | 3.83 (1.68 to 8.74) |
| Radiological failure | 24 | 1 | 3.11 (1.61 to 6.02) |
| Pain | 6 | 1 | 7.00 (0.37 to 132.66) |
| 12 | 1 | 9.00 (0.50 to 163.59) | |
| 24 | 1 | 4.00 (0.89 to 18.06) | |
| Soft tissue pathology | 6 | 1 | 7.00 (0.37 to 132.66) |
| 12 | 1 | 2.5 (0.50 to 12.39) | |
| 24 | 1 | 1.8 (0.64 to 5.06) | |
| Pathological radiolucency | 6 | 1 | Not estimable* |
| 12 | 1 | 4.00 (0.46 to 34.75) | |
| 24 | 1 | 5.00 (1.14 to 21.86) | |
| Pathological root resorption | 6 | 1 | Not estimable* |
| 12 | 1 | 3.33 (0.96 to 11.51) | |
| 24 | 1 | 2.00 (0.87 to 4.60) | |
| *due to lack of events Abbreviations ‐ CH: calcium hydroxide; CI: confidence interval; FC: formocresol. | |||
| Outcome | Time point (months) | No. of studies | Risk ratio (95% CI) |
| Clinical failure | 6 | 1 | Not estimable* |
| 12 and 24 | 1 | 3.00 (0.13 to 69.52) | |
| Radiological failure | 6 | 1 | Not estimable* |
| 12 | 1 | 3.00 (0.13 to 69.52) | |
| 24 | 1 | 7.00 (0.38 to 127.33) | |
| Pain | 6 | 1 | Not estimable* |
| 12 and 24 | 1 | 3.00 (0.13 to 69.52) | |
| Pathological radiolucency | 6 | 1 | Not estimable* |
| 12 | 1 | 3.00 (0.13 to 69.52) | |
| 24 | 1 | 7.00 (0.38 to 127.33) | |
| Pathological root resorption | 6, 12 and 24 | 1 | Not estimable* |
| *due to lack of events Abbreviations ‐ CH: calcium hydroxide; CI: confidence interval | |||
| Outcome | Time point (months) | No. of studies | Risk ratio (95% CI) |
| Clinical failure | 6, 12 and 24 | 1 | 3.00 (0.13 to 69.52) |
| Radiological failure | 6 | 1 | Not estimable* |
| 12 and 24 | 1 | 3.00 (0.13 to 69.52) | |
| Pain | 6 | 1 | Not estimable* |
| 12 and 24 | 1 | 3.00 (0.13 to 69.52) | |
| Pathological radiolucency | 6 | 1 | Not estimable* |
| 12 and 24 | 1 | 3.00 (0.13 to 69.52) | |
| Pathological root resorption | 6, 12 and 24 | 1 | Not estimable* |
| *due to lack of events Abbreviations ‐ CH: calcium hydroxide; CI: confidence interval | |||
| Outcome | Time point (months) | No. of studies | Risk ratio (95% CI) |
| Clinical failure | 6 | 1 | Not estimable* |
| 12 and 24 | 1 | 3.00 (0.13 to 69.52) | |
| Radiological failure | 6 and 12 | 1 | 3.00 (0.13 to 69.52) |
| 24 | 1 | 7.00 (0.38 to 127.33) | |
| Pain | 6 | 1 | Not estimable* |
| 12 and 24 | 1 | 3.00 (0.13 to 69.52) | |
| Pathological radiolucency | 6 | 1 | Not estimable* |
| 12 and 24 | 1 | 3.00 (0.13 to 69.52) | |
| Pathological root resorption | 6, 12 and 24 | 1 | Not estimable* |
| *due to lack of events Abbreviation ‐ CI: confidence interval. | |||
| Outcome | Time point (months) | No. of studies | Risk ratio (95% CI) |
| Clinical failure | 6, 12 and 24 | 1 | 3.00 (0.13 to 69.52) |
| Radiological failure | 6 | 1 | Not estimable* |
| 12 and 24 | 1 | 3.00 (0.13 to 69.52) | |
| Pain | 6 | 1 | Not estimable* |
| 12 and 24 | 1 | 3.00 (0.13 to 69.52) | |
| Pathological radiolucency | 6 | 1 | Not estimable* |
| 12 and 24 | 1 | 3.00 (0.13 to 69.52) | |
| Pathological root resorption | 6, 12 and 24 | 1 | Not estimable* |
| *due to lack of events Abbreviation ‐ CI: confidence interval | |||
| Outcome | Time point (months) | No. of studies | Risk ratio (95% CI) |
| Clinical failure | 6 | 1 | Not estimable* |
| 12 and 24 | 1 | 3.00 (0.13 to 69.52) | |
| Radiological failure | 6 | 1 | Not estimable* |
| 12 | 1 | 3.00 (0.13 to 69.52) | |
| 24 | 1 | 7.00 (0.38 to 127.33) | |
| Pain | 6 | 1 | Not estimable* |
| 12 and 24 | 1 | 3.00 (0.13 to 69.52) | |
| Pathological radiolucency | 6 | 1 | Not estimable* |
| 12 | 1 | 3.00 (0.13 to 69.52) | |
| 24 | 1 | 7.00 (0.38 to 127.33) | |
| Pathological root resorption | 6, 12 and 24 | 1 | Not estimable* |
| *due to lack of events Abbreviations ‐ CI: confidence interval. | |||
| Outcome | Time point (months) | No. of studies | Risk ratio (95% CI) |
| Clinical failure | 6, 12 and 24 | 1 | 3.00 (0.13 to 69.52) |
| Radiological failure | 6 | 1 | Not estimable* |
| 12 and 24 | 1 | 1.00 (0.07 to 14.90) | |
| Pain | 6 | 1 | Not estimable* |
| 12 and 24 | 1 | 3.00 (0.13 to 69.52) | |
| Pathological radiolucency | 6 | 1 | Not estimable* |
| 12 and 24 | 1 | 1.00 (0.07 to 14.90) | |
| Pathological root resorption | 6, 12 and 24 | 1 | Not estimable* |
| *due to lack of events Abbreviation ‐ CI: confidence interval. | |||
| Outcome | Time point (months) | No. of studies | Risk ratio (95% CI) |
| Clinical failure | 6 | 1 | 3.00 (0.13 to 69.52) |
| 12 and 24 | 1 | 1.00 (0.07 to 14.90) | |
| Radiological failure | 6 | 1 | 0.33 (0.01 to 7.72) |
| 12 | 1 | 1.00 (0.07 to 14.90) | |
| 24 | 1 | 0.33 (0.04 to 2.94) | |
| Pain | 6 | 1 | Not estimable* |
| 12 | 1 | 3.00 (0.13 to 69.52) | |
| 24 | 1 | 1.00 (0.07 to 14.90) | |
| Pathological radiolucency | 6 | 1 | Not estimable* |
| 12 | 1 | 1.00 (0.07 to 14.90) | |
| 24 | 1 | 0.33 (0.04 to 2.94) | |
| Pathological root resorption | 6, 12 and 24 | 1 | Not estimable* |
| *due to lack of events Abbreviation ‐ CI: confidence interval. | |||
| Outcome | Time point (months) | No. of studies | Risk ratio (95% CI) |
| Clinical failure | 1, 3, 6 | 1 | 5.00 (0.26, 98.00) |
| 9 | 1 | 7.00 (0.38, 127.32) | |
| 12 | 1 | 4.00 (0.49, 32.72) | |
| Radiological failure | 1, 3, 6 | 1 | 5.00 (0.26, 98.00) |
| 9 | 1 | 3.00 (0.34, 26.45) | |
| 12 | 1 | 1.67 (0.46, 6.06) | |
| Pain | 1, 3, 6, 9 | 1 | Not estimable* |
| 12 | 1 | 3.00 (0.13, 69.52) | |
| Soft tissue pathology | 1, 3, 6, 9 | 1 | 5.00 (0.26, 98.00) |
| 12 | 1 | 2.00 (0.20, 20.33) | |
| Pathologic mobility | 1, 3, 6, 9 | 1 | 5.00 (0.26, 98.00) |
| 12 | 1 | 2.00 (0.20, 20.33) | |
| Pathologic radiolucency | 1, 3, 6 | 1 | 5.00 (0.26, 98.00) |
| 9 | 1 | 3.00 (0.34, 26.45) | |
| 12 | 1 | 1.33 (0.34, 5.21) | |
| Pathologic root resorption | 1, 3, 6 | 1 | 5.00 (0.26, 98.00) |
| 9 | 1 | 2.00 (0.20, 20.33) | |
| 12 | 1.33 (0.34, 5.21) | ||
| *due to lack of events Abbreviation ‐ CI: confidence interval. | |||
| Outcome or subgroup title | No. of studies | No. of participants | Statistical method | Effect size |
| 1 Clinical failure Show forest plot | 14 | Risk Ratio (M‐H, Fixed, 95% CI) | Subtotals only | |
| 1.1 6 months | 13 | 1048 | Risk Ratio (M‐H, Fixed, 95% CI) | 0.37 [0.07, 1.89] |
| 1.2 12 months | 12 | 740 | Risk Ratio (M‐H, Fixed, 95% CI) | 0.31 [0.10, 0.93] |
| 1.3 24 months | 9 | 548 | Risk Ratio (M‐H, Fixed, 95% CI) | 0.47 [0.18, 1.19] |
| 2 Radiological failure Show forest plot | 13 | Risk Ratio (M‐H, Fixed, 95% CI) | Subtotals only | |
| 2.1 6 months | 12 | 922 | Risk Ratio (M‐H, Fixed, 95% CI) | 0.38 [0.17, 0.86] |
| 2.2 12 months | 12 | 740 | Risk Ratio (M‐H, Fixed, 95% CI) | 0.41 [0.19, 0.89] |
| 2.3 24 months | 9 | 548 | Risk Ratio (M‐H, Fixed, 95% CI) | 0.42 [0.22, 0.80] |
| 3 Overall failure Show forest plot | 7 | Risk Ratio (M‐H, Fixed, 95% CI) | Subtotals only | |
| 3.1 6 months | 6 | 328 | Risk Ratio (M‐H, Fixed, 95% CI) | 0.23 [0.04, 1.32] |
| 3.2 12 months | 6 | 328 | Risk Ratio (M‐H, Fixed, 95% CI) | 0.48 [0.17, 1.36] |
| 3.3 24 months | 7 | 368 | Risk Ratio (M‐H, Fixed, 95% CI) | 0.50 [0.25, 1.01] |
| 4 Pain Show forest plot | 7 | Risk Ratio (M‐H, Fixed, 95% CI) | Subtotals only | |
| 4.1 6 months | 6 | 390 | Risk Ratio (M‐H, Fixed, 95% CI) | 0.33 [0.01, 7.91] |
| 4.2 12 months | 6 | 410 | Risk Ratio (M‐H, Fixed, 95% CI) | 0.25 [0.03, 2.18] |
| 4.3 24 months | 4 | 290 | Risk Ratio (M‐H, Fixed, 95% CI) | 0.71 [0.14, 3.56] |
| 5 Soft tissue pathology Show forest plot | 8 | Risk Ratio (M‐H, Fixed, 95% CI) | Subtotals only | |
| 5.1 6 months | 7 | 410 | Risk Ratio (M‐H, Fixed, 95% CI) | 0.33 [0.01, 7.91] |
| 5.2 12 months | 7 | 430 | Risk Ratio (M‐H, Fixed, 95% CI) | 0.22 [0.05, 1.01] |
| 5.3 24 months | 5 | 310 | Risk Ratio (M‐H, Fixed, 95% CI) | 0.33 [0.04, 3.10] |
| 6 Pathological mobility Show forest plot | 5 | Risk Ratio (M‐H, Fixed, 95% CI) | Subtotals only | |
| 6.1 6 months | 5 | 250 | Risk Ratio (M‐H, Fixed, 95% CI) | 0.0 [0.0, 0.0] |
| 6.2 12 months | 4 | 200 | Risk Ratio (M‐H, Fixed, 95% CI) | 0.2 [0.01, 3.97] |
| 6.3 24 months | 3 | 150 | Risk Ratio (M‐H, Fixed, 95% CI) | 0.0 [0.0, 0.0] |
| 7 Pathological radiolucency Show forest plot | 14 | Risk Ratio (M‐H, Fixed, 95% CI) | Subtotals only | |
| 7.1 6 months | 13 | 1010 | Risk Ratio (M‐H, Fixed, 95% CI) | 0.54 [0.27, 1.08] |
| 7.2 12 months | 11 | 652 | Risk Ratio (M‐H, Fixed, 95% CI) | 0.43 [0.19, 0.98] |
| 7.3 24 months | 8 | 460 | Risk Ratio (M‐H, Fixed, 95% CI) | 0.55 [0.25, 1.22] |
| 8 Pathological root resorption Show forest plot | 12 | Risk Ratio (M‐H, Fixed, 95% CI) | Subtotals only | |
| 8.1 6 months | 11 | 866 | Risk Ratio (M‐H, Fixed, 95% CI) | 0.47 [0.18, 1.21] |
| 8.2 12 months | 9 | 508 | Risk Ratio (M‐H, Fixed, 95% CI) | 0.26 [0.07, 1.03] |
| 8.3 24 months | 6 | 338 | Risk Ratio (M‐H, Fixed, 95% CI) | 0.25 [0.08, 0.81] |
| 9 Pulp canal obliteration Show forest plot | 9 | Risk Ratio (M‐H, Fixed, 95% CI) | Subtotals only | |
| 9.1 6 months | 9 | 712 | Risk Ratio (M‐H, Fixed, 95% CI) | 1.52 [1.00, 2.30] |
| 9.2 12 months | 7 | 410 | Risk Ratio (M‐H, Fixed, 95% CI) | 1.70 [0.81, 3.57] |
| 9.3 24 months | 6 | 338 | Risk Ratio (M‐H, Fixed, 95% CI) | 2.05 [1.07, 3.94] |
| 10 Dentin bridge formation Show forest plot | 3 | Risk Ratio (M‐H, Fixed, 95% CI) | Subtotals only | |
| 10.1 6 months | 3 | 322 | Risk Ratio (M‐H, Fixed, 95% CI) | 18.16 [3.63, 90.91] |
| 10.2 12 months | 2 | 70 | Risk Ratio (M‐H, Fixed, 95% CI) | 6.0 [0.76, 47.22] |
| 10.3 24 months | 2 | 70 | Risk Ratio (M‐H, Fixed, 95% CI) | 6.0 [0.76, 47.22] |
| 11 Physiological root resorption Show forest plot | 2 | Risk Ratio (M‐H, Fixed, 95% CI) | Subtotals only | |
| 11.1 6 months | 2 | 170 | Risk Ratio (M‐H, Fixed, 95% CI) | 0.0 [0.0, 0.0] |
| 11.2 12 months | 2 | 170 | Risk Ratio (M‐H, Fixed, 95% CI) | 0.0 [0.0, 0.0] |
| 11.3 24 months | 2 | 170 | Risk Ratio (M‐H, Fixed, 95% CI) | 0.33 [0.01, 7.81] |
| Outcome or subgroup title | No. of studies | No. of participants | Statistical method | Effect size |
| 1 Clinical failure Show forest plot | 7 | Risk Ratio (M‐H, Fixed, 95% CI) | Subtotals only | |
| 1.1 6 months | 6 | 538 | Risk Ratio (M‐H, Fixed, 95% CI) | 0.70 [0.09, 5.64] |
| 1.2 12 months | 5 | 432 | Risk Ratio (M‐H, Fixed, 95% CI) | 0.45 [0.12, 1.68] |
| 1.3 24 months | 3 | 290 | Risk Ratio (M‐H, Fixed, 95% CI) | 0.33 [0.04, 3.14] |
| 2 Radiological failure Show forest plot | 5 | Risk Ratio (M‐H, Fixed, 95% CI) | Subtotals only | |
| 2.1 6 months | 4 | 362 | Risk Ratio (M‐H, Fixed, 95% CI) | 0.29 [0.05, 1.79] |
| 2.2 12 months | 5 | 432 | Risk Ratio (M‐H, Fixed, 95% CI) | 0.28 [0.08, 0.98] |
| 2.3 24 months | 3 | 290 | Risk Ratio (M‐H, Fixed, 95% CI) | 0.2 [0.06, 0.67] |
| 3 Pain Show forest plot | 3 | Risk Ratio (M‐H, Fixed, 95% CI) | Subtotals only | |
| 3.1 6 months | 2 | 190 | Risk Ratio (M‐H, Fixed, 95% CI) | 0.33 [0.01, 7.91] |
| 3.2 12 months | 3 | 260 | Risk Ratio (M‐H, Fixed, 95% CI) | 0.25 [0.03, 2.18] |
| 3.3 24 months | 2 | 190 | Risk Ratio (M‐H, Fixed, 95% CI) | 0.33 [0.04, 3.14] |
| 4 Soft tissue pathology Show forest plot | 3 | Risk Ratio (M‐H, Fixed, 95% CI) | Subtotals only | |
| 4.1 6 months | 2 | 190 | Risk Ratio (M‐H, Fixed, 95% CI) | 0.33 [0.01, 7.91] |
| 4.2 12 months | 3 | 260 | Risk Ratio (M‐H, Fixed, 95% CI) | 0.25 [0.03, 2.18] |
| 4.3 24 months | 2 | 190 | Risk Ratio (M‐H, Fixed, 95% CI) | 0.33 [0.01, 7.91] |
| 5 Pathological radiolucency Show forest plot | 5 | Risk Ratio (M‐H, Fixed, 95% CI) | Subtotals only | |
| 5.1 6 months | 4 | 388 | Risk Ratio (M‐H, Fixed, 95% CI) | 0.16 [0.01, 2.95] |
| 5.2 12 months | 4 | 332 | Risk Ratio (M‐H, Fixed, 95% CI) | 0.61 [0.16, 2.38] |
| 5.3 24 months | 2 | 190 | Risk Ratio (M‐H, Fixed, 95% CI) | 0.45 [0.11, 1.95] |
| 6 Pathological root resorption Show forest plot | 4 | Risk Ratio (M‐H, Fixed, 95% CI) | Subtotals only | |
| 6.1 6 months | 3 | 316 | Risk Ratio (M‐H, Fixed, 95% CI) | 0.11 [0.01, 1.95] |
| 6.2 12 months | 3 | 260 | Risk Ratio (M‐H, Fixed, 95% CI) | 0.33 [0.01, 7.91] |
| 6.3 24 months | 2 | 190 | Risk Ratio (M‐H, Fixed, 95% CI) | 0.13 [0.02, 0.98] |
| 7 Pulp canal obliteration Show forest plot | 2 | Risk Ratio (M‐H, Fixed, 95% CI) | Subtotals only | |
| 7.1 6 months | 2 | 192 | Risk Ratio (M‐H, Fixed, 95% CI) | 0.0 [0.0, 0.0] |
| 7.2 12 months | 2 | 192 | Risk Ratio (M‐H, Fixed, 95% CI) | 12.76 [0.79, 206.70] |
| Outcome or subgroup title | No. of studies | No. of participants | Statistical method | Effect size |
| 1 Clinical failure Show forest plot | 8 | Risk Ratio (M‐H, Fixed, 95% CI) | Subtotals only | |
| 1.1 6 months | 8 | 560 | Risk Ratio (M‐H, Fixed, 95% CI) | 0.16 [0.01, 3.06] |
| 1.2 12 months | 7 | 308 | Risk Ratio (M‐H, Fixed, 95% CI) | 0.16 [0.02, 1.28] |
| 1.3 24 months | 6 | 258 | Risk Ratio (M‐H, Fixed, 95% CI) | 0.51 [0.18, 1.42] |
| 2 Radiological failure Show forest plot | 8 | Risk Ratio (M‐H, Fixed, 95% CI) | Subtotals only | |
| 2.1 6 months | 8 | 560 | Risk Ratio (M‐H, Fixed, 95% CI) | 0.41 [0.17, 1.03] |
| 2.2 12 months | 7 | 308 | Risk Ratio (M‐H, Fixed, 95% CI) | 0.56 [0.20, 1.53] |
| 2.3 24 months | 6 | 258 | Risk Ratio (M‐H, Fixed, 95% CI) | 0.67 [0.31, 1.46] |
| 3 Pain Show forest plot | 4 | Risk Ratio (M‐H, Fixed, 95% CI) | Subtotals only | |
| 3.1 6 months | 4 | 200 | Risk Ratio (M‐H, Fixed, 95% CI) | 0.0 [0.0, 0.0] |
| 3.2 12 months | 3 | 150 | Risk Ratio (M‐H, Fixed, 95% CI) | 0.0 [0.0, 0.0] |
| 3.3 24 months | 2 | 100 | Risk Ratio (M‐H, Fixed, 95% CI) | 3.0 [0.13, 70.30] |
| 4 Soft tissue pathology Show forest plot | 5 | Risk Ratio (M‐H, Fixed, 95% CI) | Subtotals only | |
| 4.1 6 months | 5 | 220 | Risk Ratio (M‐H, Fixed, 95% CI) | 0.0 [0.0, 0.0] |
| 4.2 12 months | 4 | 170 | Risk Ratio (M‐H, Fixed, 95% CI) | 0.2 [0.02, 1.65] |
| 4.3 24 months | 3 | 120 | Risk Ratio (M‐H, Fixed, 95% CI) | 0.33 [0.01, 7.72] |
| 5 Pathological mobility Show forest plot | 4 | Risk Ratio (M‐H, Fixed, 95% CI) | Subtotals only | |
| 5.1 6 months | 4 | 180 | Risk Ratio (M‐H, Fixed, 95% CI) | 0.0 [0.0, 0.0] |
| 5.2 12 months | 3 | 130 | Risk Ratio (M‐H, Fixed, 95% CI) | 0.2 [0.01, 3.97] |
| 5.3 24 months | 2 | 80 | Risk Ratio (M‐H, Fixed, 95% CI) | 0.0 [0.0, 0.0] |
| 6 Pathological radiolucency Show forest plot | 9 | Risk Ratio (M‐H, Fixed, 95% CI) | Subtotals only | |
| 6.1 6 months | 9 | 622 | Risk Ratio (M‐H, Fixed, 95% CI) | 0.61 [0.30, 1.27] |
| 6.2 12 months | 7 | 320 | Risk Ratio (M‐H, Fixed, 95% CI) | 0.36 [0.13, 1.02] |
| 6.3 24 months | 6 | 270 | Risk Ratio (M‐H, Fixed, 95% CI) | 0.6 [0.23, 1.57] |
| 7 Pathological root resorption Show forest plot | 8 | Risk Ratio (M‐H, Fixed, 95% CI) | Subtotals only | |
| 7.1 6 months | 8 | 550 | Risk Ratio (M‐H, Fixed, 95% CI) | 0.70 [0.24, 1.99] |
| 7.2 12 months | 6 | 248 | Risk Ratio (M‐H, Fixed, 95% CI) | 0.25 [0.05, 1.14] |
| 7.3 24 months | 4 | 148 | Risk Ratio (M‐H, Fixed, 95% CI) | 0.43 [0.10, 1.92] |
| 8 Pulp canal obliteration Show forest plot | 7 | Risk Ratio (M‐H, Fixed, 95% CI) | Subtotals only | |
| 8.1 6 months | 7 | 520 | Risk Ratio (M‐H, Fixed, 95% CI) | 1.52 [1.00, 2.30] |
| 8.2 12 months | 5 | 218 | Risk Ratio (M‐H, Fixed, 95% CI) | 1.0 [0.44, 2.26] |
| 8.3 24 months | 5 | 218 | Risk Ratio (M‐H, Fixed, 95% CI) | 1.97 [0.99, 3.89] |
| Outcome or subgroup title | No. of studies | No. of participants | Statistical method | Effect size |
| 1 Clinical failure Show forest plot | 4 | Risk Ratio (M‐H, Fixed, 95% CI) | Subtotals only | |
| 1.1 6 months | 4 | 190 | Risk Ratio (M‐H, Fixed, 95% CI) | 0.08 [0.00, 1.31] |
| 1.2 12 months | 3 | 130 | Risk Ratio (M‐H, Fixed, 95% CI) | 0.2 [0.01, 3.97] |
| 1.3 24 months | 3 | 130 | Risk Ratio (M‐H, Fixed, 95% CI) | 0.52 [0.20, 1.39] |
| 2 Radiological failure Show forest plot | 4 | Risk Ratio (M‐H, Fixed, 95% CI) | Subtotals only | |
| 2.1 6 months | 4 | 190 | Risk Ratio (M‐H, Fixed, 95% CI) | 0.06 [0.01, 0.40] |
| 2.2 12 months | 3 | 130 | Risk Ratio (M‐H, Fixed, 95% CI) | 0.71 [0.15, 3.44] |
| 2.3 24 months | 3 | 130 | Risk Ratio (M‐H, Fixed, 95% CI) | 0.58 [0.25, 1.36] |
| 3 Overall failure Show forest plot | 4 | Risk Ratio (M‐H, Fixed, 95% CI) | Subtotals only | |
| 3.1 6 months | 4 | 190 | Risk Ratio (M‐H, Fixed, 95% CI) | 0.06 [0.01, 0.40] |
| 3.2 12 months | 3 | 130 | Risk Ratio (M‐H, Fixed, 95% CI) | 0.71 [0.15, 3.44] |
| 3.3 24 months | 3 | 130 | Risk Ratio (M‐H, Fixed, 95% CI) | 0.78 [0.32, 1.89] |
| 4 Pain Show forest plot | 3 | Risk Ratio (M‐H, Fixed, 95% CI) | Subtotals only | |
| 4.1 6 months | 3 | 160 | Risk Ratio (M‐H, Fixed, 95% CI) | 0.2 [0.01, 4.00] |
| 4.2 12 months | 2 | 100 | Risk Ratio (M‐H, Fixed, 95% CI) | 0.0 [0.0, 0.0] |
| 5 Soft tissue pathology Show forest plot | 2 | Risk Ratio (M‐H, Fixed, 95% CI) | Subtotals only | |
| 5.1 6 months | 2 | 110 | Risk Ratio (M‐H, Fixed, 95% CI) | 0.2 [0.01, 4.00] |
| 6 Pathologic mobility Show forest plot | 2 | Risk Ratio (M‐H, Fixed, 95% CI) | Subtotals only | |
| 6.1 6 months | 2 | 110 | Risk Ratio (M‐H, Fixed, 95% CI) | 0.08 [0.00, 1.31] |
| 7 Pathologic radiolucency Show forest plot | 3 | Risk Ratio (M‐H, Fixed, 95% CI) | Subtotals only | |
| 7.1 6 months | 3 | 160 | Risk Ratio (M‐H, Fixed, 95% CI) | 0.03 [0.00, 0.48] |
| 7.2 12 months | 2 | 100 | Risk Ratio (M‐H, Fixed, 95% CI) | 0.33 [0.01, 7.81] |
| 7.3 24 months | 2 | 100 | Risk Ratio (M‐H, Fixed, 95% CI) | 0.2 [0.01, 3.97] |
| 8 Pathological root resorption Show forest plot | 4 | Risk Ratio (M‐H, Fixed, 95% CI) | Subtotals only | |
| 8.1 6 months | 4 | 190 | Risk Ratio (M‐H, Fixed, 95% CI) | 0.07 [0.01, 0.53] |
| 8.2 12 months | 3 | 130 | Risk Ratio (M‐H, Fixed, 95% CI) | 0.2 [0.01, 3.97] |
| 8.3 24 months | 3 | 130 | Risk Ratio (M‐H, Fixed, 95% CI) | 0.56 [0.12, 2.51] |
| 9 Pulp canal obliteration Show forest plot | 3 | Risk Ratio (M‐H, Fixed, 95% CI) | Subtotals only | |
| 9.1 6 months | 3 | 140 | Risk Ratio (M‐H, Fixed, 95% CI) | 0.0 [0.0, 0.0] |
| 9.2 12 months | 2 | 80 | Risk Ratio (M‐H, Fixed, 95% CI) | 3.0 [0.13, 70.30] |
| 9.3 24 months | 2 | 80 | Risk Ratio (M‐H, Fixed, 95% CI) | 1.57 [0.47, 5.27] |
| Outcome or subgroup title | No. of studies | No. of participants | Statistical method | Effect size |
| 1 Clinical failure Show forest plot | 5 | Risk Ratio (M‐H, Fixed, 95% CI) | Subtotals only | |
| 1.1 6 months | 4 | 150 | Risk Ratio (M‐H, Fixed, 95% CI) | 0.2 [0.01, 3.85] |
| 1.2 12 months | 4 | 150 | Risk Ratio (M‐H, Fixed, 95% CI) | 0.16 [0.04, 0.70] |
| 1.3 24 months | 5 | 284 | Risk Ratio (M‐H, Fixed, 95% CI) | 0.25 [0.12, 0.52] |
| 2 Radiological failure Show forest plot | 5 | Risk Ratio (M‐H, Fixed, 95% CI) | Subtotals only | |
| 2.1 6 months | 4 | 150 | Risk Ratio (M‐H, Fixed, 95% CI) | 0.08 [0.02, 0.41] |
| 2.2 12 months | 4 | 150 | Risk Ratio (M‐H, Fixed, 95% CI) | 0.12 [0.04, 0.36] |
| 2.3 24 months | 5 | 284 | Risk Ratio (M‐H, Fixed, 95% CI) | 0.14 [0.08, 0.26] |
| 3 Overall failure Show forest plot | 2 | Risk Ratio (M‐H, Fixed, 95% CI) | Subtotals only | |
| 3.1 6 months | 2 | 68 | Risk Ratio (M‐H, Fixed, 95% CI) | 0.2 [0.01, 3.92] |
| 3.2 12 months | 2 | 68 | Risk Ratio (M‐H, Fixed, 95% CI) | 0.34 [0.10, 1.19] |
| 3.3 24 months | 2 | 68 | Risk Ratio (M‐H, Fixed, 95% CI) | 0.42 [0.18, 0.95] |
| 4 Pain Show forest plot | 2 | Risk Ratio (M‐H, Fixed, 95% CI) | Subtotals only | |
| 4.1 24 months | 2 | 196 | Risk Ratio (M‐H, Fixed, 95% CI) | 0.41 [0.09, 1.73] |
| 5 Soft tissue pathology Show forest plot | 4 | Risk Ratio (M‐H, Fixed, 95% CI) | Subtotals only | |
| 5.1 6 months | 3 | 122 | Risk Ratio (M‐H, Fixed, 95% CI) | 0.2 [0.02, 1.62] |
| 5.2 12 months | 3 | 122 | Risk Ratio (M‐H, Fixed, 95% CI) | 0.12 [0.02, 0.62] |
| 5.3 24 months | 4 | 256 | Risk Ratio (M‐H, Fixed, 95% CI) | 0.17 [0.06, 0.47] |
| 6 Pathological mobility Show forest plot | 4 | Risk Ratio (M‐H, Fixed, 95% CI) | Subtotals only | |
| 6.1 6 months | 3 | 122 | Risk Ratio (M‐H, Fixed, 95% CI) | 0.2 [0.02, 1.62] |
| 6.2 12 months | 3 | 122 | Risk Ratio (M‐H, Fixed, 95% CI) | 0.09 [0.01, 0.66] |
| 6.3 24 months | 4 | 256 | Risk Ratio (M‐H, Fixed, 95% CI) | 0.09 [0.01, 0.66] |
| 7 Pathological radiolucency Show forest plot | 5 | Risk Ratio (M‐H, Fixed, 95% CI) | Subtotals only | |
| 7.1 6 months | 4 | 162 | Risk Ratio (M‐H, Fixed, 95% CI) | 0.10 [0.02, 0.50] |
| 7.2 12 months | 4 | 162 | Risk Ratio (M‐H, Fixed, 95% CI) | 0.14 [0.04, 0.47] |
| 7.3 24 months | 5 | 296 | Risk Ratio (M‐H, Fixed, 95% CI) | 0.08 [0.03, 0.22] |
| 8 Pathological root resorption Show forest plot | 6 | Risk Ratio (M‐H, Fixed, 95% CI) | Subtotals only | |
| 8.1 6 months | 5 | 190 | Risk Ratio (M‐H, Fixed, 95% CI) | 0.10 [0.02, 0.39] |
| 8.2 12 months | 5 | 190 | Risk Ratio (M‐H, Fixed, 95% CI) | 0.07 [0.02, 0.29] |
| 8.3 24 months | 6 | 324 | Risk Ratio (M‐H, Fixed, 95% CI) | 0.08 [0.03, 0.18] |
| 9 Pulp canal obliteration Show forest plot | 4 | Risk Ratio (M‐H, Fixed, 95% CI) | Subtotals only | |
| 9.1 6 months | 3 | 120 | Risk Ratio (M‐H, Fixed, 95% CI) | 7.77 [1.56, 38.69] |
| 9.2 12 months | 3 | 120 | Risk Ratio (M‐H, Fixed, 95% CI) | 2.01 [0.97, 4.17] |
| 9.3 24 months | 4 | 254 | Risk Ratio (M‐H, Fixed, 95% CI) | 2.05 [1.01, 4.19] |
| 10 Dentin bridge formation Show forest plot | 2 | Risk Ratio (M‐H, Fixed, 95% CI) | Subtotals only | |
| 10.1 6 months | 2 | 60 | Risk Ratio (M‐H, Fixed, 95% CI) | 0.2 [0.05, 0.84] |
| 10.2 12 months | 2 | 60 | Risk Ratio (M‐H, Fixed, 95% CI) | 0.8 [0.37, 1.74] |
| 10.3 24 months | 2 | 60 | Risk Ratio (M‐H, Fixed, 95% CI) | 0.8 [0.37, 1.74] |
| Outcome or subgroup title | No. of studies | No. of participants | Statistical method | Effect size |
| 1 Clinical failure Show forest plot | 3 | Risk Ratio (M‐H, Fixed, 95% CI) | Subtotals only | |
| 1.1 6 months | 3 | 130 | Risk Ratio (M‐H, Fixed, 95% CI) | 0.2 [0.01, 4.02] |
| 1.2 12 months | 3 | 130 | Risk Ratio (M‐H, Fixed, 95% CI) | 0.2 [0.01, 4.02] |
| 1.3 24 months | 3 | 130 | Risk Ratio (M‐H, Fixed, 95% CI) | 0.2 [0.01, 4.02] |
| 2 Radiological failure Show forest plot | 3 | Risk Ratio (M‐H, Fixed, 95% CI) | Subtotals only | |
| 2.1 6 months | 3 | 130 | Risk Ratio (M‐H, Fixed, 95% CI) | 0.0 [0.0, 0.0] |
| 2.2 12 months | 3 | 130 | Risk Ratio (M‐H, Fixed, 95% CI) | 0.0 [0.0, 0.0] |
| 2.3 24 months | 3 | 130 | Risk Ratio (M‐H, Fixed, 95% CI) | 0.5 [0.10, 2.56] |
| 3 Pain Show forest plot | 3 | Risk Ratio (M‐H, Fixed, 95% CI) | Subtotals only | |
| 3.1 6 months | 3 | 130 | Risk Ratio (M‐H, Fixed, 95% CI) | 0.33 [0.01, 7.91] |
| 3.2 12 months | 3 | 130 | Risk Ratio (M‐H, Fixed, 95% CI) | 0.33 [0.01, 7.91] |
| 3.3 24 months | 3 | 130 | Risk Ratio (M‐H, Fixed, 95% CI) | 0.33 [0.01, 7.91] |
| 4 Soft tissue pathology Show forest plot | 3 | Risk Ratio (M‐H, Fixed, 95% CI) | Subtotals only | |
| 4.1 6 months | 3 | 130 | Risk Ratio (M‐H, Fixed, 95% CI) | 0.2 [0.01, 4.02] |
| 4.2 12 months | 3 | 130 | Risk Ratio (M‐H, Fixed, 95% CI) | 0.2 [0.01, 4.02] |
| 4.3 24 months | 3 | 130 | Risk Ratio (M‐H, Fixed, 95% CI) | 0.2 [0.01, 4.02] |
| 5 Pathologic mobility Show forest plot | 3 | Risk Ratio (M‐H, Fixed, 95% CI) | Subtotals only | |
| 5.1 6 months | 3 | 130 | Risk Ratio (M‐H, Fixed, 95% CI) | 0.33 [0.01, 7.91] |
| 5.2 12 months | 3 | 130 | Risk Ratio (M‐H, Fixed, 95% CI) | 0.33 [0.01, 7.91] |
| 5.3 24 months | 3 | 130 | Risk Ratio (M‐H, Fixed, 95% CI) | 0.33 [0.01, 7.91] |
| 6 Pathological radiolucency Show forest plot | 3 | Risk Ratio (M‐H, Fixed, 95% CI) | Subtotals only | |
| 6.1 6 months | 3 | 130 | Risk Ratio (M‐H, Fixed, 95% CI) | 0.0 [0.0, 0.0] |
| 6.2 12 months | 3 | 130 | Risk Ratio (M‐H, Fixed, 95% CI) | 0.0 [0.0, 0.0] |
| 6.3 24 months | 3 | 130 | Risk Ratio (M‐H, Fixed, 95% CI) | 0.67 [0.12, 3.75] |
| 7 Pathological root resorption Show forest plot | 3 | Risk Ratio (M‐H, Fixed, 95% CI) | Subtotals only | |
| 7.1 6 months | 3 | 130 | Risk Ratio (M‐H, Fixed, 95% CI) | 0.0 [0.0, 0.0] |
| 7.2 12 months | 3 | 130 | Risk Ratio (M‐H, Fixed, 95% CI) | 0.0 [0.0, 0.0] |
| 7.3 24 months | 3 | 130 | Risk Ratio (M‐H, Fixed, 95% CI) | 0.33 [0.01, 7.91] |
| 8 Pulp canal obliteration Show forest plot | 2 | Risk Ratio (M‐H, Fixed, 95% CI) | Subtotals only | |
| 8.1 6 months | 2 | 60 | Risk Ratio (M‐H, Fixed, 95% CI) | 0.73 [0.49, 1.08] |
| 8.2 12 months | 2 | 60 | Risk Ratio (M‐H, Fixed, 95% CI) | 0.83 [0.60, 1.14] |
| 8.3 24 months | 2 | 60 | Risk Ratio (M‐H, Fixed, 95% CI) | 0.96 [0.71, 1.29] |
| 9 Dentin bridge formation Show forest plot | 2 | Risk Ratio (M‐H, Fixed, 95% CI) | Subtotals only | |
| 9.1 6 months | 2 | 60 | Risk Ratio (M‐H, Fixed, 95% CI) | 0.56 [0.13, 2.43] |
| 9.2 12 months | 2 | 60 | Risk Ratio (M‐H, Fixed, 95% CI) | 1.5 [0.61, 3.71] |
| 9.3 24 months | 2 | 60 | Risk Ratio (M‐H, Fixed, 95% CI) | 1.5 [0.61, 3.71] |
| Outcome or subgroup title | No. of studies | No. of participants | Statistical method | Effect size |
| 1 Clinical failure Show forest plot | 4 | Risk Ratio (M‐H, Fixed, 95% CI) | Subtotals only | |
| 1.1 6 months | 4 | 234 | Risk Ratio (M‐H, Fixed, 95% CI) | 1.72 [0.42, 6.99] |
| 1.2 12 months | 2 | 144 | Risk Ratio (M‐H, Fixed, 95% CI) | 0.75 [0.16, 3.62] |
| 2 Radiological failure Show forest plot | 4 | Risk Ratio (M‐H, Fixed, 95% CI) | Subtotals only | |
| 2.1 6 months | 4 | 234 | Risk Ratio (M‐H, Fixed, 95% CI) | 2.40 [0.65, 8.84] |
| 2.2 12 months | 2 | 144 | Risk Ratio (M‐H, Fixed, 95% CI) | 1.08 [0.22, 5.27] |
| 3 Pain Show forest plot | 3 | Risk Ratio (M‐H, Fixed, 95% CI) | Subtotals only | |
| 3.1 6 months | 3 | 180 | Risk Ratio (M‐H, Fixed, 95% CI) | 5.0 [0.26, 98.00] |
| 4 Soft tissue pathology Show forest plot | 3 | Risk Ratio (M‐H, Fixed, 95% CI) | Subtotals only | |
| 4.1 6 months | 3 | 180 | Risk Ratio (M‐H, Fixed, 95% CI) | 5.0 [0.26, 98.00] |
| 5 Pathologic mobility Show forest plot | 3 | Risk Ratio (M‐H, Fixed, 95% CI) | Subtotals only | |
| 5.1 6 months | 3 | 180 | Risk Ratio (M‐H, Fixed, 95% CI) | 5.0 [0.26, 98.00] |
| 6 Pathological radiolucency Show forest plot | 2 | Risk Ratio (M‐H, Fixed, 95% CI) | Subtotals only | |
| 6.1 6 months | 2 | 144 | Risk Ratio (M‐H, Fixed, 95% CI) | 3.46 [0.15, 81.36] |
| 6.2 12 months | 2 | 144 | Risk Ratio (M‐H, Fixed, 95% CI) | 1.09 [0.19, 6.27] |
| 7 Pathological root resorption Show forest plot | 2 | Risk Ratio (M‐H, Fixed, 95% CI) | Subtotals only | |
| 7.1 6 months | 2 | 144 | Risk Ratio (M‐H, Fixed, 95% CI) | 2.32 [0.22, 24.09] |
| 7.2 12 months | 2 | 144 | Risk Ratio (M‐H, Fixed, 95% CI) | 1.12 [0.30, 4.19] |
| Outcome or subgroup title | No. of studies | No. of participants | Statistical method | Effect size |
| 1 Clinical failure Show forest plot | 6 | Risk Ratio (M‐H, Fixed, 95% CI) | Subtotals only | |
| 1.1 6 months | 6 | 332 | Risk Ratio (M‐H, Fixed, 95% CI) | 1.98 [1.17, 3.37] |
| 1.2 12 months | 6 | 332 | Risk Ratio (M‐H, Fixed, 95% CI) | 1.87 [1.22, 2.89] |
| 1.3 24 months | 3 | 150 | Risk Ratio (M‐H, Fixed, 95% CI) | 2.18 [0.78, 6.11] |
| 2 Radiological failure Show forest plot | 6 | Risk Ratio (M‐H, Fixed, 95% CI) | Subtotals only | |
| 2.1 6 months | 4 | 154 | Risk Ratio (M‐H, Fixed, 95% CI) | 15.48 [3.86, 62.06] |
| 2.2 12 months | 6 | 332 | Risk Ratio (M‐H, Fixed, 95% CI) | 1.86 [1.42, 2.44] |
| 2.3 24 months | 3 | 150 | Risk Ratio (M‐H, Fixed, 95% CI) | 3.63 [1.73, 7.61] |
| 3 Overall failure Show forest plot | 2 | Risk Ratio (M‐H, Fixed, 95% CI) | Subtotals only | |
| 3.1 12 months | 2 | 120 | Risk Ratio (M‐H, Fixed, 95% CI) | 2.41 [0.80, 7.21] |
| 3.2 24 months | 2 | 120 | Risk Ratio (M‐H, Fixed, 95% CI) | 2.93 [1.35, 6.34] |
| 4 Pain Show forest plot | 4 | Risk Ratio (M‐H, Fixed, 95% CI) | Subtotals only | |
| 4.1 6 months | 4 | 276 | Risk Ratio (M‐H, Fixed, 95% CI) | 3.18 [0.35, 29.08] |
| 4.2 12 months | 4 | 276 | Risk Ratio (M‐H, Fixed, 95% CI) | 6.30 [1.15, 34.40] |
| 5 Soft tissue pathology Show forest plot | 5 | Risk Ratio (M‐H, Fixed, 95% CI) | Subtotals only | |
| 5.1 6 months | 5 | 306 | Risk Ratio (M‐H, Fixed, 95% CI) | 5.14 [0.63, 42.25] |
| 5.2 12 months | 5 | 306 | Risk Ratio (M‐H, Fixed, 95% CI) | 6.77 [1.23, 37.10] |
| 5.3 24 months | 2 | 124 | Risk Ratio (M‐H, Fixed, 95% CI) | 2.64 [0.51, 13.55] |
| 6 Pathological mobility Show forest plot | 4 | Risk Ratio (M‐H, Fixed, 95% CI) | Subtotals only | |
| 6.1 6 months | 4 | 238 | Risk Ratio (M‐H, Fixed, 95% CI) | 1.21 [0.18, 8.19] |
| 6.2 12 months | 4 | 238 | Risk Ratio (M‐H, Fixed, 95% CI) | 1.14 [0.40, 3.31] |
| 6.3 24 months | 2 | 124 | Risk Ratio (M‐H, Fixed, 95% CI) | 9.0 [0.53, 153.79] |
| 7 Pathological radiolucency Show forest plot | 5 | Risk Ratio (M‐H, Fixed, 95% CI) | Subtotals only | |
| 7.1 6 months | 3 | 128 | Risk Ratio (M‐H, Fixed, 95% CI) | 3.78 [0.64, 22.17] |
| 7.2 12 months | 5 | 306 | Risk Ratio (M‐H, Fixed, 95% CI) | 1.90 [0.67, 5.40] |
| 7.3 24 months | 2 | 124 | Risk Ratio (M‐H, Fixed, 95% CI) | 3.24 [0.79, 13.28] |
| 8 Pathological root resorption Show forest plot | 6 | Risk Ratio (M‐H, Fixed, 95% CI) | Subtotals only | |
| 8.1 6 months | 4 | 154 | Risk Ratio (M‐H, Fixed, 95% CI) | 11.87 [2.33, 60.40] |
| 8.2 12 months | 6 | 332 | Risk Ratio (M‐H, Fixed, 95% CI) | 6.25 [2.04, 19.14] |
| 8.3 24 months | 3 | 150 | Risk Ratio (M‐H, Fixed, 95% CI) | 4.59 [1.33, 15.81] |
| 9 Pulp canal obliteration Show forest plot | 3 | Risk Ratio (M‐H, Fixed, 95% CI) | Subtotals only | |
| 9.1 6 months | 2 | 56 | Risk Ratio (M‐H, Fixed, 95% CI) | 4.0 [0.47, 33.75] |
| 9.2 12 months | 3 | 140 | Risk Ratio (M‐H, Fixed, 95% CI) | 2.68 [0.91, 7.95] |
| 10 Dentin bridge formation Show forest plot | 2 | Risk Ratio (M‐H, Fixed, 95% CI) | Subtotals only | |
| 10.1 6 months | 2 | 60 | Risk Ratio (M‐H, Fixed, 95% CI) | 13.0 [1.81, 93.60] |
| 10.2 12 months | 2 | 60 | Risk Ratio (M‐H, Fixed, 95% CI) | 14.0 [1.95, 100.26] |
| Outcome or subgroup title | No. of studies | No. of participants | Statistical method | Effect size |
| 1 Clinical failure Show forest plot | 2 | Risk Ratio (M‐H, Fixed, 95% CI) | Subtotals only | |
| 1.1 6 months | 2 | 122 | Risk Ratio (M‐H, Fixed, 95% CI) | 3.4 [0.14, 81.38] |
| 1.2 12 months | 2 | 122 | Risk Ratio (M‐H, Fixed, 95% CI) | 3.41 [0.37, 31.61] |
| 1.3 24 months | 2 | 122 | Risk Ratio (M‐H, Fixed, 95% CI) | 3.44 [0.90, 13.18] |
| 2 Radiological failure Show forest plot | 2 | Risk Ratio (M‐H, Fixed, 95% CI) | Subtotals only | |
| 2.1 12 months | 2 | 122 | Risk Ratio (M‐H, Fixed, 95% CI) | 1.28 [0.53, 3.13] |
| 2.2 24 months | 2 | 122 | Risk Ratio (M‐H, Fixed, 95% CI) | 1.97 [1.04, 3.75] |
| 3 Overall failure Show forest plot | 2 | Risk Ratio (M‐H, Fixed, 95% CI) | Subtotals only | |
| 3.1 12 months | 2 | 122 | Risk Ratio (M‐H, Fixed, 95% CI) | 1.28 [0.53, 3.13] |
| 3.2 24 months | 2 | 122 | Risk Ratio (M‐H, Fixed, 95% CI) | 1.97 [1.04, 3.75] |
| 4 Pathological root resorption Show forest plot | 2 | Risk Ratio (M‐H, Fixed, 95% CI) | Subtotals only | |
| 4.1 12 months | 2 | 122 | Risk Ratio (M‐H, Fixed, 95% CI) | 0.57 [0.05, 6.05] |
| 4.2 24 months | 2 | 122 | Risk Ratio (M‐H, Fixed, 95% CI) | 2.29 [0.60, 8.66] |
| Outcome or subgroup title | No. of studies | No. of participants | Statistical method | Effect size |
| 1 Clinical failure Show forest plot | 7 | Risk Ratio (M‐H, Fixed, 95% CI) | Subtotals only | |
| 1.1 6 months | 7 | 394 | Risk Ratio (M‐H, Fixed, 95% CI) | 1.0 [0.15, 6.87] |
| 1.2 12 months | 7 | 394 | Risk Ratio (M‐H, Fixed, 95% CI) | 1.38 [0.45, 4.27] |
| 1.3 24 months | 5 | 258 | Risk Ratio (M‐H, Fixed, 95% CI) | 0.83 [0.40, 1.70] |
| 2 Radiological failure Show forest plot | 7 | Risk Ratio (M‐H, Fixed, 95% CI) | Subtotals only | |
| 2.1 6 months | 6 | 294 | Risk Ratio (M‐H, Fixed, 95% CI) | 0.79 [0.32, 1.92] |
| 2.2 12 months | 7 | 394 | Risk Ratio (M‐H, Fixed, 95% CI) | 1.33 [0.73, 2.42] |
| 2.3 24 months | 5 | 258 | Risk Ratio (M‐H, Fixed, 95% CI) | 1.26 [0.71, 2.24] |
| 3 Overall failure Show forest plot | 5 | Risk Ratio (M‐H, Fixed, 95% CI) | Subtotals only | |
| 3.1 6 months | 4 | 184 | Risk Ratio (M‐H, Fixed, 95% CI) | 0.53 [0.12, 2.37] |
| 3.2 12 months | 5 | 284 | Risk Ratio (M‐H, Fixed, 95% CI) | 1.16 [0.51, 2.64] |
| 3.3 24 months | 4 | 228 | Risk Ratio (M‐H, Fixed, 95% CI) | 1.49 [0.74, 3.01] |
| 4 Pain Show forest plot | 4 | Risk Ratio (M‐H, Fixed, 95% CI) | Subtotals only | |
| 4.1 6 months | 4 | 230 | Risk Ratio (M‐H, Fixed, 95% CI) | 0.33 [0.01, 7.58] |
| 4.2 12 months | 4 | 230 | Risk Ratio (M‐H, Fixed, 95% CI) | 0.33 [0.01, 7.58] |
| 4.3 24 months | 4 | 230 | Risk Ratio (M‐H, Fixed, 95% CI) | 0.2 [0.01, 3.85] |
| 5 Pathological radiolucency Show forest plot | 4 | Risk Ratio (M‐H, Fixed, 95% CI) | Subtotals only | |
| 5.1 12 months | 4 | 230 | Risk Ratio (M‐H, Fixed, 95% CI) | 1.8 [0.40, 8.17] |
| 5.2 24 months | 4 | 230 | Risk Ratio (M‐H, Fixed, 95% CI) | 2.2 [0.51, 9.50] |
| 6 Pathological root resorption Show forest plot | 6 | Risk Ratio (M‐H, Fixed, 95% CI) | Subtotals only | |
| 6.1 6 months | 5 | 214 | Risk Ratio (M‐H, Fixed, 95% CI) | 0.67 [0.12, 3.84] |
| 6.2 12 months | 6 | 314 | Risk Ratio (M‐H, Fixed, 95% CI) | 1.64 [0.53, 5.08] |
| 6.3 24 months | 5 | 258 | Risk Ratio (M‐H, Fixed, 95% CI) | 1.21 [0.50, 2.96] |
| 7 Pulp canal obliteration Show forest plot | 3 | Risk Ratio (M‐H, Fixed, 95% CI) | Subtotals only | |
| 7.1 6 months | 3 | 134 | Risk Ratio (M‐H, Fixed, 95% CI) | 0.0 [0.0, 0.0] |
| 7.2 12 months | 3 | 134 | Risk Ratio (M‐H, Fixed, 95% CI) | 0.94 [0.54, 1.64] |
| 7.3 24 months | 2 | 78 | Risk Ratio (M‐H, Fixed, 95% CI) | 1.24 [0.28, 5.54] |
| Outcome or subgroup title | No. of studies | No. of participants | Statistical method | Effect size |
| 1 Clinical failure Show forest plot | 2 | Risk Ratio (M‐H, Fixed, 95% CI) | Subtotals only | |
| 1.1 6 months | 2 | 110 | Risk Ratio (M‐H, Fixed, 95% CI) | 0.0 [0.0, 0.0] |
| 1.2 12 months | 2 | 110 | Risk Ratio (M‐H, Fixed, 95% CI) | 4.39 [0.22, 87.82] |
| 2 Radiological failure Show forest plot | 2 | Risk Ratio (M‐H, Fixed, 95% CI) | Subtotals only | |
| 2.1 6 months | 2 | 110 | Risk Ratio (M‐H, Fixed, 95% CI) | 0.55 [0.22, 1.39] |
| 2.2 12 months | 2 | 110 | Risk Ratio (M‐H, Fixed, 95% CI) | 0.42 [0.17, 1.02] |
| 3 Pain Show forest plot | 2 | Risk Ratio (M‐H, Fixed, 95% CI) | Subtotals only | |
| 3.1 6 months | 2 | 110 | Risk Ratio (M‐H, Fixed, 95% CI) | 0.0 [0.0, 0.0] |
| 3.2 12 months | 2 | 110 | Risk Ratio (M‐H, Fixed, 95% CI) | 0.0 [0.0, 0.0] |
| 4 Soft tissue pathology Show forest plot | 2 | Risk Ratio (M‐H, Fixed, 95% CI) | Subtotals only | |
| 4.1 6 months | 2 | 110 | Risk Ratio (M‐H, Fixed, 95% CI) | 0.0 [0.0, 0.0] |
| 4.2 12 months | 2 | 110 | Risk Ratio (M‐H, Fixed, 95% CI) | 0.29 [0.01, 6.91] |
| 5 Adjacent tissue inflammation Show forest plot | 2 | Risk Ratio (M‐H, Fixed, 95% CI) | Subtotals only | |
| 5.1 6 months | 2 | 110 | Risk Ratio (M‐H, Fixed, 95% CI) | 0.0 [0.0, 0.0] |
| 5.2 12 months | 2 | 110 | Risk Ratio (M‐H, Fixed, 95% CI) | 0.31 [0.03, 2.91] |
| 6 Pathologic mobility Show forest plot | 2 | Risk Ratio (M‐H, Fixed, 95% CI) | Subtotals only | |
| 6.1 6 months | 2 | 110 | Risk Ratio (M‐H, Fixed, 95% CI) | 0.0 [0.0, 0.0] |
| 6.2 12 months | 2 | 110 | Risk Ratio (M‐H, Fixed, 95% CI) | 0.0 [0.0, 0.0] |
| 7 Pathologic radiolucency Show forest plot | 2 | Risk Ratio (M‐H, Fixed, 95% CI) | Subtotals only | |
| 7.1 6 months | 2 | 110 | Risk Ratio (M‐H, Fixed, 95% CI) | 0.88 [0.06, 13.35] |
| 7.2 12 months | 2 | 110 | Risk Ratio (M‐H, Fixed, 95% CI) | 0.56 [0.07, 4.17] |
| 8 Pathologic root resorption Show forest plot | 2 | Risk Ratio (M‐H, Fixed, 95% CI) | Subtotals only | |
| 8.1 6 months | 2 | 110 | Risk Ratio (M‐H, Fixed, 95% CI) | 0.51 [0.18, 1.42] |
| 8.2 12 months | 2 | 110 | Risk Ratio (M‐H, Fixed, 95% CI) | 0.38 [0.15, 1.01] |
| Outcome or subgroup title | No. of studies | No. of participants | Statistical method | Effect size |
| 1 Clinical failure Show forest plot | 3 | Risk Ratio (M‐H, Fixed, 95% CI) | Subtotals only | |
| 1.1 6 months | 3 | 130 | Risk Ratio (M‐H, Fixed, 95% CI) | 0.23 [0.04, 1.30] |
| 1.2 12 months | 2 | 100 | Risk Ratio (M‐H, Fixed, 95% CI) | 0.2 [0.02, 1.62] |
| 2 Radiological failure Show forest plot | 3 | Risk Ratio (M‐H, Fixed, 95% CI) | Subtotals only | |
| 2.1 6 months | 3 | 130 | Risk Ratio (M‐H, Fixed, 95% CI) | 0.89 [0.38, 2.12] |
| 2.2 12 months | 2 | 100 | Risk Ratio (M‐H, Fixed, 95% CI) | 0.91 [0.44, 1.92] |
| 3 Pain Show forest plot | 2 | Risk Ratio (M‐H, Fixed, 95% CI) | Subtotals only | |
| 3.1 6 months | 2 | 50 | Risk Ratio (M‐H, Fixed, 95% CI) | 0.2 [0.03, 1.60] |
| 4 Pathological radiolucency Show forest plot | 2 | Risk Ratio (M‐H, Fixed, 95% CI) | Subtotals only | |
| 4.1 6 months | 2 | 50 | Risk Ratio (M‐H, Fixed, 95% CI) | 0.25 [0.03, 2.08] |
| 5 Pathological root resorption Show forest plot | 2 | Risk Ratio (M‐H, Fixed, 95% CI) | Subtotals only | |
| 5.1 6 months | 2 | 50 | Risk Ratio (M‐H, Fixed, 95% CI) | 1.5 [0.29, 7.73] |
| Outcome or subgroup title | No. of studies | No. of participants | Statistical method | Effect size |
| 1 Clinical failure Show forest plot | 2 | Risk Ratio (M‐H, Fixed, 95% CI) | Subtotals only | |
| 1.1 6 months | 2 | 50 | Risk Ratio (M‐H, Fixed, 95% CI) | 0.56 [0.13, 2.34] |
| 2 Radiological failure Show forest plot | 2 | Risk Ratio (M‐H, Fixed, 95% CI) | Subtotals only | |
| 2.1 6 months | 2 | 50 | Risk Ratio (M‐H, Fixed, 95% CI) | 1.25 [0.38, 4.12] |
| 3 Pain Show forest plot | 2 | Risk Ratio (M‐H, Fixed, 95% CI) | Subtotals only | |
| 3.1 6 months | 2 | 50 | Risk Ratio (M‐H, Fixed, 95% CI) | 0.56 [0.13, 2.34] |
| 4 Pathological mobility Show forest plot | 2 | Risk Ratio (M‐H, Fixed, 95% CI) | Subtotals only | |
| 4.1 6 months | 2 | 50 | Risk Ratio (M‐H, Fixed, 95% CI) | 0.0 [0.0, 0.0] |
| 5 Pathological root resorption Show forest plot | 2 | Risk Ratio (M‐H, Fixed, 95% CI) | Subtotals only | |
| 5.1 6 months | 2 | 50 | Risk Ratio (M‐H, Fixed, 95% CI) | 2.2 [0.54, 8.88] |
| 6 Pulp canal obliteration Show forest plot | 2 | Risk Ratio (M‐H, Fixed, 95% CI) | Subtotals only | |
| 6.1 6 months | 2 | 50 | Risk Ratio (M‐H, Fixed, 95% CI) | 0.0 [0.0, 0.0] |
| Outcome or subgroup title | No. of studies | No. of participants | Statistical method | Effect size |
| 1 Clinical failure Show forest plot | 2 | Risk Ratio (M‐H, Fixed, 95% CI) | Subtotals only | |
| 1.1 6 months | 2 | 100 | Risk Ratio (M‐H, Fixed, 95% CI) | 0.0 [0.0, 0.0] |
| 1.2 12 months | 2 | 100 | Risk Ratio (M‐H, Fixed, 95% CI) | 1.25 [0.37, 4.27] |
| 2 Radiological failure Show forest plot | 2 | Risk Ratio (M‐H, Fixed, 95% CI) | Subtotals only | |
| 2.1 6 months | 2 | 100 | Risk Ratio (M‐H, Fixed, 95% CI) | 1.0 [0.16, 6.20] |
| 2.2 12 months | 2 | 100 | Risk Ratio (M‐H, Fixed, 95% CI) | 0.88 [0.34, 2.23] |
| 3 Pain Show forest plot | 2 | Risk Ratio (M‐H, Fixed, 95% CI) | Subtotals only | |
| 3.1 6 months | 2 | 100 | Risk Ratio (M‐H, Fixed, 95% CI) | 0.0 [0.0, 0.0] |
| 3.2 12 months | 2 | 100 | Risk Ratio (M‐H, Fixed, 95% CI) | 1.0 [0.15, 6.71] |
| 4 Soft tissue pathology Show forest plot | 2 | Risk Ratio (M‐H, Fixed, 95% CI) | Subtotals only | |
| 4.1 6 months | 2 | 100 | Risk Ratio (M‐H, Fixed, 95% CI) | 0.0 [0.0, 0.0] |
| 4.2 12 months | 2 | 100 | Risk Ratio (M‐H, Fixed, 95% CI) | 1.5 [0.27, 8.43] |
| 5 Pathologic mobility Show forest plot | 2 | Risk Ratio (M‐H, Fixed, 95% CI) | Subtotals only | |
| 5.1 6 months | 2 | 100 | Risk Ratio (M‐H, Fixed, 95% CI) | 0.0 [0.0, 0.0] |
| 5.2 12 months | 2 | 100 | Risk Ratio (M‐H, Fixed, 95% CI) | 0.0 [0.0, 0.0] |
| 6 Pathologic radiolucency Show forest plot | 2 | Risk Ratio (M‐H, Fixed, 95% CI) | Subtotals only | |
| 6.1 6 months | 2 | 100 | Risk Ratio (M‐H, Fixed, 95% CI) | 0.0 [0.0, 0.0] |
| 6.2 12 months | 2 | 100 | Risk Ratio (M‐H, Fixed, 95% CI) | 0.67 [0.12, 3.75] |
| 7 Pathologic root resorption Show forest plot | 2 | Risk Ratio (M‐H, Fixed, 95% CI) | Subtotals only | |
| 7.1 6 months | 2 | 100 | Risk Ratio (M‐H, Fixed, 95% CI) | 5.0 [0.26, 96.13] |
| 7.2 12 months | 2 | 100 | Risk Ratio (M‐H, Fixed, 95% CI) | 1.0 [0.31, 3.23] |
| Outcome or subgroup title | No. of studies | No. of participants | Statistical method | Effect size |
| 1 Clinical failure Show forest plot | 2 | Risk Ratio (M‐H, Fixed, 95% CI) | Subtotals only | |
| 1.1 6 months | 2 | 50 | Risk Ratio (M‐H, Fixed, 95% CI) | 0.2 [0.01, 3.70] |
| 2 Radiological failure Show forest plot | 2 | Risk Ratio (M‐H, Fixed, 95% CI) | Subtotals only | |
| 2.1 6 months | 2 | 50 | Risk Ratio (M‐H, Fixed, 95% CI) | 0.64 [0.19, 2.18] |
| 3 Pain Show forest plot | 2 | Risk Ratio (M‐H, Fixed, 95% CI) | Subtotals only | |
| 3.1 6 months | 2 | 50 | Risk Ratio (M‐H, Fixed, 95% CI) | 0.2 [0.01, 3.70] |
| 4 Pathological mobility Show forest plot | 2 | Risk Ratio (M‐H, Fixed, 95% CI) | Subtotals only | |
| 4.1 6 months | 2 | 50 | Risk Ratio (M‐H, Fixed, 95% CI) | 0.0 [0.0, 0.0] |
| 5 Pathological radiolucency Show forest plot | 2 | Risk Ratio (M‐H, Fixed, 95% CI) | Subtotals only | |
| 5.1 6 months | 2 | 50 | Risk Ratio (M‐H, Fixed, 95% CI) | 0.0 [0.0, 0.0] |
| 6 Pathological root resorption Show forest plot | 2 | Risk Ratio (M‐H, Fixed, 95% CI) | Subtotals only | |
| 6.1 6 months | 2 | 50 | Risk Ratio (M‐H, Fixed, 95% CI) | 0.64 [0.19, 2.18] |
| 7 Pulp canal obliteration Show forest plot | 2 | Risk Ratio (M‐H, Fixed, 95% CI) | Subtotals only | |
| 7.1 6 months | 2 | 50 | Risk Ratio (M‐H, Fixed, 95% CI) | 0.0 [0.0, 0.0] |
| Outcome or subgroup title | No. of studies | No. of participants | Statistical method | Effect size |
| 1 Clinical failure Show forest plot | 2 | Risk Ratio (M‐H, Fixed, 95% CI) | Subtotals only | |
| 1.1 6 months | 2 | 150 | Risk Ratio (M‐H, Fixed, 95% CI) | 0.0 [0.0, 0.0] |
| 1.2 12 months | 2 | 150 | Risk Ratio (M‐H, Fixed, 95% CI) | 0.0 [0.0, 0.0] |
| 2 Radiological failure Show forest plot | 2 | Risk Ratio (M‐H, Fixed, 95% CI) | Subtotals only | |
| 2.1 6 months | 2 | 150 | Risk Ratio (M‐H, Fixed, 95% CI) | 1.29 [0.33, 5.08] |
| 2.2 12 months | 2 | 150 | Risk Ratio (M‐H, Fixed, 95% CI) | 1.86 [0.52, 6.59] |
| 3 Pain Show forest plot | 2 | Risk Ratio (M‐H, Fixed, 95% CI) | Subtotals only | |
| 3.1 6 months | 2 | 150 | Risk Ratio (M‐H, Fixed, 95% CI) | 0.0 [0.0, 0.0] |
| 3.2 12 months | 2 | 150 | Risk Ratio (M‐H, Fixed, 95% CI) | 0.0 [0.0, 0.0] |
| 4 Soft tissue pathology Show forest plot | 2 | Risk Ratio (M‐H, Fixed, 95% CI) | Subtotals only | |
| 4.1 6 months | 2 | 150 | Risk Ratio (M‐H, Fixed, 95% CI) | 0.0 [0.0, 0.0] |
| 4.2 12 months | 2 | 150 | Risk Ratio (M‐H, Fixed, 95% CI) | 0.0 [0.0, 0.0] |
| 5 Pathologic mobility Show forest plot | 2 | Risk Ratio (M‐H, Fixed, 95% CI) | Subtotals only | |
| 5.1 6 months | 2 | 150 | Risk Ratio (M‐H, Fixed, 95% CI) | 0.0 [0.0, 0.0] |
| 5.2 12 months | 2 | 150 | Risk Ratio (M‐H, Fixed, 95% CI) | 0.0 [0.0, 0.0] |
| 6 Pathologic radiolucency Show forest plot | 2 | Risk Ratio (M‐H, Fixed, 95% CI) | Subtotals only | |
| 6.1 6 months | 2 | 150 | Risk Ratio (M‐H, Fixed, 95% CI) | 0.0 [0.0, 0.0] |
| 6.2 12 months | 2 | 150 | Risk Ratio (M‐H, Fixed, 95% CI) | 0.0 [0.0, 0.0] |
| 7 Pathologic root resorption Show forest plot | 2 | Risk Ratio (M‐H, Fixed, 95% CI) | Subtotals only | |
| 7.1 6 months | 2 | 150 | Risk Ratio (M‐H, Fixed, 95% CI) | 1.29 [0.33, 5.08] |
| 7.2 12 months | 2 | 150 | Risk Ratio (M‐H, Fixed, 95% CI) | 1.86 [0.52, 6.59] |
| Outcome or subgroup title | No. of studies | No. of participants | Statistical method | Effect size |
| 1 Clinical failure Show forest plot | 2 | Risk Ratio (M‐H, Fixed, 95% CI) | Subtotals only | |
| 1.1 6 months | 2 | 100 | Risk Ratio (M‐H, Fixed, 95% CI) | 0.8 [0.23, 2.83] |
| 2 Pain Show forest plot | 2 | Risk Ratio (M‐H, Fixed, 95% CI) | Subtotals only | |
| 2.1 6 months | 2 | 100 | Risk Ratio (M‐H, Fixed, 95% CI) | 0.4 [0.08, 1.92] |
| 3 Soft tissue pathology Show forest plot | 2 | Risk Ratio (M‐H, Fixed, 95% CI) | Subtotals only | |
| 3.1 6 months | 2 | 100 | Risk Ratio (M‐H, Fixed, 95% CI) | 2.0 [0.19, 21.06] |
| 4 Pathologic mobility Show forest plot | 2 | Risk Ratio (M‐H, Fixed, 95% CI) | Subtotals only | |
| 4.1 6 months | 2 | 100 | Risk Ratio (M‐H, Fixed, 95% CI) | 5.0 [0.26, 96.13] |
| Outcome or subgroup title | No. of studies | No. of participants | Statistical method | Effect size |
| 1 Radiological failure Show forest plot | 2 | Risk Ratio (M‐H, Fixed, 95% CI) | Subtotals only | |
| 1.1 6 months | 2 | 110 | Risk Ratio (M‐H, Fixed, 95% CI) | 2.5 [0.50, 12.50] |
| 2 Pain Show forest plot | 2 | Risk Ratio (M‐H, Fixed, 95% CI) | Subtotals only | |
| 2.1 6 months | 2 | 110 | Risk Ratio (M‐H, Fixed, 95% CI) | 1.0 [0.14, 6.90] |
| 3 Pathological mobility Show forest plot | 2 | Risk Ratio (M‐H, Fixed, 95% CI) | Subtotals only | |
| 3.1 6 months | 2 | 110 | Risk Ratio (M‐H, Fixed, 95% CI) | 1.0 [0.14, 6.90] |
| 4 Pathological radiolucency Show forest plot | 2 | Risk Ratio (M‐H, Fixed, 95% CI) | Subtotals only | |
| 4.1 6 months | 2 | 110 | Risk Ratio (M‐H, Fixed, 95% CI) | 1.5 [0.26, 8.72] |
| 5 Pathological radiolucency Show forest plot | 2 | Risk Ratio (M‐H, Fixed, 95% CI) | Subtotals only | |
| 5.1 6 months | 2 | 50 | Risk Ratio (M‐H, Fixed, 95% CI) | 0.25 [0.03, 2.08] |
| Outcome or subgroup title | No. of studies | No. of participants | Statistical method | Effect size |
| 1 Clinical failure Show forest plot | 2 | Risk Ratio (M‐H, Fixed, 95% CI) | Subtotals only | |
| 1.1 6 months | 2 | 62 | Risk Ratio (M‐H, Fixed, 95% CI) | 0.6 [0.08, 4.29] |
| 1.2 12 months | 2 | 62 | Risk Ratio (M‐H, Fixed, 95% CI) | 0.71 [0.15, 3.33] |
| 2 Radiological failure Show forest plot | 2 | Risk Ratio (M‐H, Fixed, 95% CI) | Subtotals only | |
| 2.1 6 months | 2 | 62 | Risk Ratio (M‐H, Fixed, 95% CI) | 1.0 [0.31, 3.27] |
| 2.2 12 months | 2 | 62 | Risk Ratio (M‐H, Fixed, 95% CI) | 1.0 [0.31, 3.27] |
| Outcome or subgroup title | No. of studies | No. of participants | Statistical method | Effect size |
| 1 Clincal failure Show forest plot | 2 | Risk Ratio (M‐H, Fixed, 95% CI) | Subtotals only | |
| 1.1 6 months | 2 | 92 | Risk Ratio (M‐H, Fixed, 95% CI) | 0.33 [0.01, 7.58] |
| 2 Radiological failure Show forest plot | 2 | Risk Ratio (M‐H, Fixed, 95% CI) | Subtotals only | |
| 2.1 6 months | 2 | 92 | Risk Ratio (M‐H, Fixed, 95% CI) | 2.02 [0.79, 5.15] |
| 3 Pain Show forest plot | 2 | Risk Ratio (M‐H, Fixed, 95% CI) | Subtotals only | |
| 3.1 6 months | 2 | 92 | Risk Ratio (M‐H, Fixed, 95% CI) | 0.33 [0.01, 7.58] |
| 4 Soft tissue pathology Show forest plot | 2 | Risk Ratio (M‐H, Fixed, 95% CI) | Subtotals only | |
| 4.1 6 months | 2 | 92 | Risk Ratio (M‐H, Fixed, 95% CI) | 0.33 [0.01, 7.58] |
| 5 Pathologic mobility Show forest plot | 2 | Risk Ratio (M‐H, Fixed, 95% CI) | Subtotals only | |
| 5.1 6 months | 2 | 92 | Risk Ratio (M‐H, Fixed, 95% CI) | 0.0 [0.0, 0.0] |
| 6 Pathological radiolucency Show forest plot | 2 | Risk Ratio (M‐H, Fixed, 95% CI) | Subtotals only | |
| 6.1 6 months | 2 | 92 | Risk Ratio (M‐H, Fixed, 95% CI) | 2.02 [0.79, 5.15] |
| 7 Pathological root resorption Show forest plot | 2 | Risk Ratio (M‐H, Fixed, 95% CI) | Subtotals only | |
| 7.1 6 months | 2 | 92 | Risk Ratio (M‐H, Fixed, 95% CI) | 0.0 [0.0, 0.0] |
| Outcome or subgroup title | No. of studies | No. of participants | Statistical method | Effect size |
| 1 Clinical failure Show forest plot | 4 | Risk Ratio (M‐H, Fixed, 95% CI) | Subtotals only | |
| 1.1 6 months | 4 | 287 | Risk Ratio (M‐H, Fixed, 95% CI) | 0.33 [0.01, 7.84] |
| 1.2 12 months | 4 | 287 | Risk Ratio (M‐H, Fixed, 95% CI) | 4.75 [1.21, 18.55] |
| 2 Radiological failure Show forest plot | 4 | Risk Ratio (M‐H, Fixed, 95% CI) | Subtotals only | |
| 2.1 6 months | 4 | 287 | Risk Ratio (M‐H, Fixed, 95% CI) | 2.36 [0.86, 6.50] |
| 2.2 12 months | 4 | 287 | Risk Ratio (M‐H, Fixed, 95% CI) | 6.56 [2.58, 16.67] |
| 3 Overall failure Show forest plot | 2 | Risk Ratio (M‐H, Fixed, 95% CI) | Subtotals only | |
| 3.1 6 months | 2 | 140 | Risk Ratio (M‐H, Fixed, 95% CI) | 1.89 [0.63, 5.66] |
| 3.2 12 months | 2 | 140 | Risk Ratio (M‐H, Fixed, 95% CI) | 2.56 [0.89, 7.32] |
| 4 Pain Show forest plot | 3 | Risk Ratio (M‐H, Fixed, 95% CI) | Subtotals only | |
| 4.1 6 months | 3 | 180 | Risk Ratio (M‐H, Fixed, 95% CI) | 0.0 [0.0, 0.0] |
| 4.2 12 months | 3 | 180 | Risk Ratio (M‐H, Fixed, 95% CI) | 0.0 [0.0, 0.0] |
| 5 Pathological mobility Show forest plot | 3 | Risk Ratio (M‐H, Fixed, 95% CI) | Subtotals only | |
| 5.1 6 months | 3 | 180 | Risk Ratio (M‐H, Fixed, 95% CI) | 0.33 [0.01, 7.84] |
| 5.2 12 months | 3 | 180 | Risk Ratio (M‐H, Fixed, 95% CI) | 1.0 [0.07, 15.18] |
| Outcome or subgroup title | No. of studies | No. of participants | Statistical method | Effect size |
| 1 Clinical failure Show forest plot | 2 | Risk Ratio (M‐H, Fixed, 95% CI) | Subtotals only | |
| 1.1 6 months | 2 | 80 | Risk Ratio (M‐H, Fixed, 95% CI) | 0.26 [0.05, 1.50] |
| 2 Radiological failure Show forest plot | 2 | Risk Ratio (M‐H, Fixed, 95% CI) | Subtotals only | |
| 2.1 6 months | 2 | 80 | Risk Ratio (M‐H, Fixed, 95% CI) | 0.26 [0.05, 1.50] |
| 3 Pain Show forest plot | 2 | Risk Ratio (M‐H, Fixed, 95% CI) | Subtotals only | |
| 3.1 6 months | 2 | 80 | Risk Ratio (M‐H, Fixed, 95% CI) | 0.26 [0.05, 1.50] |
| 4 Pathologic mobility Show forest plot | 2 | Risk Ratio (M‐H, Fixed, 95% CI) | Subtotals only | |
| 4.1 6 months | 2 | 80 | Risk Ratio (M‐H, Fixed, 95% CI) | 0.16 [0.02, 1.25] |
| 5 Pathologic radiolucency Show forest plot | 2 | Risk Ratio (M‐H, Fixed, 95% CI) | Subtotals only | |
| 5.1 6 months | 2 | 80 | Risk Ratio (M‐H, Fixed, 95% CI) | 0.64 [0.11, 3.63] |