مقایسه تهویه با فشار مثبت متناوب از راه بینی (NIPPV) در برابر تهویه با فشار مثبت مداوم راه هوایی از راه بینی (NCPAP) برای نوزادان نارس پس از اکستوباسیون
Referencias
منابع مطالعات واردشده در این مرور
منابع مطالعات خارجشده از این مرور
منابع مطالعات در انتظار ارزیابی
منابع مطالعات در حال انجام
منابع اضافی
منابع دیگر نسخههای منتشرشده این مرور
Characteristics of studies
Characteristics of included studies [ordered by study ID]
| Methods | Randomised controlled trial comparing effects of synchronised NIPPV vs NCPAP in preterm infants after extubation | |
| Participants | Infants with birth weight < 1250 grams (mean 831 ± 193 grams), < 6 weeks of age (mean 7.6 ± 9.7 days), requiring < 35% O2 and < 18 breaths/min on SIMV. All infants were loaded with aminophylline before extubation. | |
| Interventions | Experimental group: synchronised NIPPV = nSIMV; ventilator rate 12 breaths/min and PIP 16 cmH2O, PEEP 6 cmH2O, PIP increased to achieve measured pressure ≥ 12 cmH2O. Graseby capsule, Infant Star ventilator and Hudson nasal prongs were used. | |
| Outcomes | Primary: failure of extubation by 72 hours because pCO2 > 70 mmHg, oxygen requirement > 70% or apnoea was severe or recurrent (defined) | |
| Notes | Power calculation performed | |
| Risk of bias | ||
| Bias | Authors' judgement | Support for judgement |
| Random sequence generation (selection bias) | Low risk | Table of random numbers |
| Allocation concealment (selection bias) | Low risk | Adequate: sequentially numbered sealed opaque envelopes |
| Blinding of participants and personnel (performance bias) | High risk | Unblinded |
| Blinding of outcome assessment (detection bias) | High risk | Unblinded |
| Incomplete outcome data (attrition bias) | Low risk | All participants accounted for |
| Selective reporting (reporting bias) | Unclear risk | Secondary outcomes not listed |
| Methods | Randomised controlled trial comparing effects of synchronised NIPPV vs NCPAP in preterm infants after extubation | |
| Participants | Infants with birth weight 500 to 1500 grams (mean 963 ± 57 grams in experimental group and 944 ± 43 grams in control group) considered ready for extubation (SIMV rate < 12 breaths/min, peak pressure < 23 cmH2O, end expiratory pressure < 6 cmH2O, oxygen requirement < 40%. Aminophylline not mandated but given to about 85% of infants. Extubated at 26.3 ± 6.1 days of life in experimental group and at 19.9 ± 3.8 days of life in control group | |
| Interventions | Experimental group: nasopharyngeal 3‐Fr gauge tube, Infant Star ventilator, synchronised NIPPV = nSIMV with rate of 10 breaths/min, PIP = that before extubation, PEEP 4‐6 cmH2O, IT 0.6 seconds | |
| Outcomes | Primary: failure of extubation by 48 hours because pH < 7.25, pCO2 increased by 25%, oxygen requirement > 60%, SIMV rate > 20 (in NIPPV group), PIP > 26 cmH2O or PEEP > 8 cmH2O in NIPPV group, or apnoea requiring bag and mask ventilation | |
| Notes | Power calculation performed. Study was closed early after interim analysis (stopping rule not specified). | |
| Risk of bias | ||
| Bias | Authors' judgement | Support for judgement |
| Random sequence generation (selection bias) | Unclear risk | Unspecified |
| Allocation concealment (selection bias) | Low risk | Adequate: sealed randomisation cards |
| Blinding of participants and personnel (performance bias) | High risk | Unblinded |
| Blinding of outcome assessment (detection bias) | High risk | Unblinded |
| Incomplete outcome data (attrition bias) | Low risk | All accounted for |
| Selective reporting (reporting bias) | Unclear risk | No outcomes listed, only objectives for the study |
| Methods | Randomised controlled trial comparing effects of synchronised NIPPV vs NCPAP in preterm infants after extubation | |
| Participants | Infants at gestational age < 36 weeks (mean 32.3 ± 1.6 weeks in experimental group and 32.6 ± 1.4 weeks in control group) with birth weight < 2000 grams (mean 1264 ± 153 grams in experimental group and 1246 ± 161 grams in control group) with RDS after surfactant Excluded were infants with severe abnormalities, not specified. | |
| Interventions | Experimental group: synchronised NIPPV via different devices (NEWPORT 150 and 200; Teama; Stephan; Millennium). Rate 40 breaths/min, PIP 20 cmH2O, PEEP 5 cmH2O Control group: NCPAP via Infant Flow Driver (EME); CPAP 4 to 8 cmH2O | |
| Outcomes | Failed extubation, defined as pCO2 > 70 mmHg or FiO2 > 0.6 to maintain SaO2 > 88% or mean pressure > 8 cmH2O (in NIPPV group) or severe apnoea (in NCPAP group), defined as > 6 episodes in 24 hours or > 2 episodes requiring PPV. Air leak, hypercapnia, hypoxia | |
| Notes | ||
| Risk of bias | ||
| Bias | Authors' judgement | Support for judgement |
| Random sequence generation (selection bias) | Unclear risk | Not specified |
| Allocation concealment (selection bias) | Unclear risk | No study flow diagram; unclear if exclusions; English translation imprecise and unclear |
| Blinding of participants and personnel (performance bias) | High risk | Unblinded intervention |
| Blinding of outcome assessment (detection bias) | High risk | Unblinded intervention |
| Incomplete outcome data (attrition bias) | Unclear risk | No flow diagram |
| Selective reporting (reporting bias) | Unclear risk | No outcomes listed |
| Methods | Randomised controlled trial comparing effects of non‐synchronised NIPPV vs NCPAP in preterm infants after extubation | |
| Participants | Preterm infants ≤ 1500 grams at birth (mean 1187 grams at 30.8 weeks in the intervention group; mean 1153 grams at 30.6 weeks in the control group) Excluded were infants with suspected upper airway obstruction, airway anomaly, major cardiopulmonary malformation. | |
| Interventions | Experimental group: NIPPV provided by Bear Cub ventilator, non‐synchronised. Rate same as pre‐extubation, PIP 4 over pre‐extubation settings, PEEP ≤ 5 Control group: CPAP 5 to 6 cmH2O via Bear Cub or Viasys Infant Flow CPAP | |
| Outcomes | Failed extubation within 72 hours, defined as meeting 1 or more of the following: pH < 7.26 and pCO2 > 59 mmHg; recurrent apnoea (> 2 episodes per hour); 1 apnoea needing PPV or paO2 < 51 mmHg with FiO2 > .59 Secondary outcomes: duration of non‐invasive ventilation, total duration of ventilation, days on oxygen, air leaks, BPD, PDA, IVH grade 3‐4, NEC, ROP ≥ grade 3, length of stay, mortality, GI perforation | |
| Notes | ||
| Risk of bias | ||
| Bias | Authors' judgement | Support for judgement |
| Random sequence generation (selection bias) | Low risk | Randomisation software |
| Allocation concealment (selection bias) | Low risk | Opaque sealed envelopes |
| Blinding of participants and personnel (performance bias) | High risk | Intervention could not be blinded. |
| Blinding of outcome assessment (detection bias) | High risk | Despite criteria to define extubation failure, intervention was not blinded. |
| Incomplete outcome data (attrition bias) | Low risk | All participants accounted for |
| Selective reporting (reporting bias) | Low risk | |
| Methods | Randomised controlled trial comparing effects of non‐synchronised nasal intermittent positive pressure ventilation vs continuous positive airway pressure in preterm infants after extubation | |
| Participants | A total of 67 premature infants at < 35 weeks' gestation with birth weight < 2000 grams receiving mechanical ventilation because of respiratory distress syndrome (RDS) | |
| Interventions | Intervention group: non‐synchronised nasal NIPPV with shortened endotracheal tube via Babylog 8000. Rate 25, PIP 2 cmH2O above pre‐extubation setting, PEEP 6 cmH2O. Control group: NCPAP 6 cmH2O with binasal prongs via Sindi driver | |
| Outcomes | Extubation failure at 48 hours, defined as pH < 7.25 and pCO2 > 60 or severe or frequent apnoea, or FiO2 > 60% to keep SaO2 88% to 93% or frequent desaturations not responding to increasing settings Secondary outcomes: air leak, death, NEC, IVH, severe IVH, ROP, sepsis, nasal injury, BPD | |
| Notes | Outcomes not specified in the Methods section. No sample size calculation | |
| Risk of bias | ||
| Bias | Authors' judgement | Support for judgement |
| Random sequence generation (selection bias) | Unclear risk | Not specified in the text |
| Allocation concealment (selection bias) | Low risk | Sealed envelopes |
| Blinding of participants and personnel (performance bias) | High risk | Unblinded intervention |
| Blinding of outcome assessment (detection bias) | High risk | Unblinded intervention |
| Incomplete outcome data (attrition bias) | High risk | No flow diagram. No sample size calculation |
| Selective reporting (reporting bias) | Unclear risk | No outcomes specified in the Methods section |
| Methods | Randomised controlled trial comparing effects of synchronised NIPPV vs NCPAP in preterm infants after extubation | |
| Participants | Infants at gestational age < 34 weeks with RDS ventilated by endotracheal tube. Mean birth weight 1088 grams in experimental group and 1032 grams in control group with mean gestational age 28 weeks. Ventilator settings PIP ≤ 16 cmH2O, PEEP ≤ 5 cmH2O, ventilator rate 15 to 25 breaths/min and O2 < 35%. All had a therapeutic blood level of aminophylline and hematocrit > 40%. | |
| Interventions | Experimental group: synchronised NIPPV via Argyle prongs, Infant Star ventilator at PEEP ≤ 5 cmH2O, with ventilator rate 15 to 25 breaths/min and PIP set at 2 to 4 cmH2O above that used pre‐extubation. Gas flow set at 8 to 10 L/min in both groups | |
| Outcomes | Primary: failure of extubation by 72 hours because pH < 7.25 or pCO2 > 60 mmHg, single episode of severe apnoea requiring bag and mask ventilation or frequent apnoea or desaturations (defined) | |
| Notes | Power calculation was performed. 64 infants were enrolled: 34 in NIPPV group and 30 in NCPAP group. | |
| Risk of bias | ||
| Bias | Authors' judgement | Support for judgement |
| Random sequence generation (selection bias) | Unclear risk | Not specified |
| Allocation concealment (selection bias) | Low risk | Adequate: sealed randomisation cards |
| Blinding of participants and personnel (performance bias) | High risk | Unblinded intervention |
| Blinding of outcome assessment (detection bias) | High risk | Unblinded intervention |
| Incomplete outcome data (attrition bias) | Low risk | All participants accounted for |
| Selective reporting (reporting bias) | Unclear risk | No outcomes stated besides objectives |
| Methods | Randomised controlled trial comparing effects of non‐synchronised NIPPV vs NCPAP in preterm infants after extubation | |
| Participants | Infants ≤ 34 weeks (mean 28 ± 2.6 weeks and 29 ± 2.1 weeks) or birth weight ≤ 1500 grams (mean 984 ± 218 grams and 1185 ± 219 grams) considered ready for extubation (SIMV rate ≤ 15 breaths/min, peak pressure ≤ 15 cmH2O, end expiratory pressure < 6 cmH2O, O2 requirement < 41%. Aminophylline pre‐extubation. Extubated at 12.9 ± 9.9 days of life in experimental group and at 6.9 ± 6.0 days of life in control group | |
| Interventions | Experimental group: non‐synchronised NIPPV via bi‐nasopharyngeal prongs on Bear 750 ventilator; same settings as pre‐extubation on the ventilator Control group: NCPAP delivered by bi‐nasopharyngeal prongs from a Bear 750 ventilator; CPAP level same as pre‐extubation level Aminophylline load before extubation | |
| Outcomes | Primary: re‐intubation or failure of extubation within 1 week because of:
Secondary: respiratory failure, death, abdominal distension, NEC, gastrointestinal perforation, apnoea, atelectasis and sepsis | |
| Notes | Imbalance between groups at randomisation (NIPPV group: lower birth weight, fewer boys, higher antenatal steroids) | |
| Risk of bias | ||
| Bias | Authors' judgement | Support for judgement |
| Random sequence generation (selection bias) | Unclear risk | Not specified |
| Allocation concealment (selection bias) | Unclear risk | Method of allocation concealment not specified |
| Blinding of participants and personnel (performance bias) | High risk | Unblinded intervention |
| Blinding of outcome assessment (detection bias) | High risk | Unblinded intervention |
| Incomplete outcome data (attrition bias) | Low risk | All participants accounted for |
| Selective reporting (reporting bias) | Low risk | All specified secondary outcomes were reported. |
| Methods | Randomised multi‐centre controlled trial comparing effects of NIPPV vs NCPAP in preterm infants after extubation | |
| Participants | Infants with birth weight < 1000 grams at < 30 weeks 2 subgroups: intubated for > 24 hours and < 28 days at extubation; intubated < 24 hours or never intubated. Infants never intubated were not included in this review. Criteria for extubation and for re‐intubation were provided. | |
| Interventions | NIPPV (any device) vs NCPAP; guidelines provided for both | |
| Outcomes | Death or moderate to severe BPD according to physiological definition | |
| Notes | 2 subgroups of infants; only subgroup intubated for at least 24 hours and extubated before 28 days included in this review | |
| Risk of bias | ||
| Bias | Authors' judgement | Support for judgement |
| Random sequence generation (selection bias) | Low risk | Web‐based randomisation |
| Allocation concealment (selection bias) | Low risk | Randomisation immediately pre‐extubation |
| Blinding of participants and personnel (performance bias) | High risk | Unblinded intervention |
| Blinding of outcome assessment (detection bias) | High risk | Unblinded intervention |
| Incomplete outcome data (attrition bias) | Low risk | Flow diagram in full study |
| Selective reporting (reporting bias) | Low risk | |
| Methods | Randomised controlled trial comparing effects of synchronised NIPPV vs NCPAP in preterm infants after extubation | |
| Participants | Infants with birth weight < 1251 grams (mean 908 ± 192 grams in experimental group and 957 ± 213 grams in control group) with RDS requiring ventilation within first 48 hours of life and who met criteria for extubation by day 14 of life. Criteria for extubation: stable or improving clinical condition; receiving assist/control or proportional assist ventilation; low ventilatory setting (FiO2 ≤ 0.35, PIP ≤ 15 cmH2O and ventilator rate ≤ 15 breaths/min or elastance < 1 to maintain pCO2 ≤ 60 mmHg); no clinical or haematological sign of infection; haemoglobin ≥ 10.0 grams/dL Extubated at a median of 4 days (range 1 to 14) and 6 days (range 1 to 14) | |
| Interventions | Experimental group: synchronised NIPPV via short nasal prongs on Giulia ventilator; same settings as pre‐extubation on the ventilator. PEEP 3 to 5 cmH2O, PIP titrated according to infant from 10 to 20 cmH2O, flow rate 6 to 10 L/min Caffeine load before extubation | |
| Outcomes | Primary: need for re‐intubation within 72 hours because of:
Secondary: number of days on endotracheal mechanical ventilation, number of days on O2, CLD (O2 at 36 weeks with abnormal chest x‐ray), duration of hospital stay, air leaks, ROP, sepsis, feeding intolerance (presence of 4‐hour gastric aspirate > 25% of feed volume or containing bile) | |
| Notes | ||
| Risk of bias | ||
| Bias | Authors' judgement | Support for judgement |
| Random sequence generation (selection bias) | Unclear risk | Not specified |
| Allocation concealment (selection bias) | Low risk | Sealed opaque envelopes to conceal allocation |
| Blinding of participants and personnel (performance bias) | High risk | Unblinded intervention |
| Blinding of outcome assessment (detection bias) | High risk | Unblinded intervention |
| Incomplete outcome data (attrition bias) | Low risk | No flow diagram |
| Selective reporting (reporting bias) | Low risk | All outcomes accounted for |
| Methods | Randomised controlled trial comparing effects of non‐synchronised NIPPV delivered by a bilevel device vs NCPAP in preterm infants after extubation | |
| Participants | Infants with birth weight < 1251 grams (mean 901 ̃± 200 grams in experimental group and 896 ± 156 grams in control group) who were intubated at birth for RDS (some were prophylactically intubated to received surfactant) and who met criteria for extubation (no time limit) Criteria for extubation: ventilator rate < 20 breaths/min, PIP ≥ 16 cmH2O and FiO2 ≥ .35. If on high‐frequency oscillatory ventilation: frequency of 9 to 13 Hz, amplitude < 20%, MAP ≤ 8 and FiO2 ≤ 35%. Extubated at a median of 3 days (range 1 to 67) in experimental group and 3 days (range 1 to 62) in control group. All received caffeine during first week of life. Unclear if load pre‐extubation | |
| Interventions | Experimental group: NIPPV with SiPAP bilevel device, non‐synchronised. Ventilator rate 20 breaths/min, IT 1.0 second. Predefined upper and lower CPAP based on FiO2: 8 over 5 for FiO2 < 30%; 9 over 6 for FiO2 30% to 50%; and 10 over 7 for FiO2 > 50% Control group: CPAP with SiPAP. Level of CPAP predefined on the basis of FiO2: 5 cmH2O if FiO2 < .30; 6 mH2O if FiO2 .30 to .50; and 7 mH2O if FiO2 > .50 | |
| Outcomes | Primary: sustained extubation for 7 days. Re‐intubation criteria: severe apnoea (needing PPV), ≥ 4 apnoeic episodes per hour needing moderate stimulation, O2 > 60%, uncompensated respiratory acidosis (pH < 7.25). Re‐intubation also allowed at clinician discretion for other reasons (concerns regarding sepsis) Secondary: adverse events (nasal septal injury or erythema, eyelid oedema, abdominal distension, feeding intolerance, pneumothorax). Feeding intolerance = aspirates ≥ 30% of a feed. Abdominal distension ≥ 10% increase in girth. Also: BPD, PDA treated, NEC, IVH 3 to 4, periventricular leukomalacia, ROP | |
| Notes | Study authors overestimated successful extubations in their control group. Recruitment was stopped at half the sample size, as clinical practice had changed and babies were no longer being intubated prophylactically. | |
| Risk of bias | ||
| Bias | Authors' judgement | Support for judgement |
| Random sequence generation (selection bias) | Low risk | Computer‐generated random list |
| Allocation concealment (selection bias) | Low risk | Sealed opaque envelopes |
| Blinding of participants and personnel (performance bias) | High risk | Unblinded intervention |
| Blinding of outcome assessment (detection bias) | High risk | Unblinded intervention |
| Incomplete outcome data (attrition bias) | Low risk | Flow diagram attached |
| Selective reporting (reporting bias) | Low risk | All outcomes accounted for and reported |
BPD: bronchopulmonary dysplasia; CLD: chronic lung disease; CPAP: continuous positive airway pressure; FiO2: fraction of inspired oxygen; IT: inspiratory time; IVH: intraventricular haemorrhage; NCPAP: nasal continuous positive airway pressure; NEC: necrotising enterocolitis; NIPPV: nasal intermittent positive pressure ventilation; nSIMV: nasal synchronised intermittent mechanical ventilation; pO2: partial pressure of oxygen; pCO2: partial pressure of carbon dioxide; PDA: patent ductus arteriosus; PEEP: positive end expiratory pressure; PIP: peak inspiratory pressure; PPV: positive pressure ventilation; RDS: respiratory distress syndrome; ROP: retinopathy of prematurity; SaO2: oxygen saturation measured by blood analysis; SIMV: synchronised intermittent mechanical ventilation; SiPAP: synchronised inspiratory positive airway pressure.
Characteristics of excluded studies [ordered by study ID]
| Study | Reason for exclusion |
| Study compared a form of NIPPV (non‐invasive pressure support ventilation) vs NCPAP in a randomised cross‐over study. Investigators compared short‐term physiological outcomes (tidal volume, breathing effort, etc.). We excluded this study because investigators reported none of the clinical outcomes listed in the inclusion criteria for this review. | |
| Randomised trial of NIPPV vs conventional ventilation for management of RDS (i.e. different groups compared for a different indication). Timing of extubation was different between groups. | |
| Randomised trial of NIPPV vs NCPAP for moderate RDS (i.e. different inclusion criteria) | |
| Extubation criteria were different for NIPPV and NCPAP groups, whereas infants randomised to NIPPV were extubated from higher ventilator settings. | |
| Infants were enrolled early during acute respiratory illness. Intervention was aimed at treating RDS, not upon extubation. | |
| Infants were enrolled early during acute respiratory illness. Intervention was aimed at treating RDS, not upon extubation. | |
| RCT evaluating the role of unsynchronised NIPPV vs head box oxygen for prevention of extubation failure in mechanically ventilated preterm neonates weighing less than 2000 grams | |
| Infants enrolled had apnoea of prematurity; NIPPV or NCPAP was used for treatment. | |
| Infants were enrolled early during acute respiratory illness. Intervention was aimed at treating RDS, not upon extubation. | |
| Randomised cross‐over trial | |
| Infants enrolled had apnoea of prematurity; NIPPV or NCPAP was used for treatment. | |
| Infants were randomised after INSURE procedure and extubation was planned within 2 hours of life. We included this study in the review: early NIPPV vs NCPAP for RDS | |
| Infants enrolled had apnoea of prematurity; NIPPV or NCPAP was used for treatment. | |
| RCT comparing NIPPV vs NCPAP. Not all enrolled infants were premature; mean birth weight of enrolled infants was 2380 grams (experimental group) vs 2416 grams (control group). Unclear if intervention was provided to treat RDS, or if RDS occurred after extubation |
INSURE: intubation, surfactant, extubation; NCPAP: nasal continuous positive airway pressure; NIPPV: nasal intermittent positive pressure ventilation; RCT: randomised controlled trial; RDS: respiratory distress syndrome.
Characteristics of studies awaiting assessment [ordered by study ID]
| Methods | Randomised, prospective, clinical trial |
| Participants | 80 newborns (gestational age < 37 weeks, birth weight < 2500 grams). Infants could be randomised early (for initial management of respiratory distress syndrome (RDS)) or later, after extubation (mean of day 3). |
| Interventions | 40 infants were treated with nasal continuous positive airway pressure (CPAP) and 40 with nasal intermittent positive‐pressure ventilation (NIPPV) |
| Outcomes | Occurrence of apnoea, progression of respiratory distress, nose bleeding and agitation were defined as ventilation failure. The need for intubation and re‐intubation after failure was observed. |
| Notes | A portion of the study population may be eligible for inclusion in this review. Communication with a study investigator is ongoing. |
Characteristics of ongoing studies [ordered by study ID]
| Trial name or title | Nasal Continuous Airway Pressure (n‐CPAP) vs Nasal Bilevel Positive Airway Pressure (n‐BiPAP) for RDS |
| Methods | Randomised controlled trial |
| Participants | Inclusion criteria:
Exclusion criteria:
|
| Interventions | Bilevel positive airway pressure and NCPAP |
| Outcomes | Primary: failure of extubation during the first 48 hours post extubation, defined as uncompensated respiratory acidosis defined as pH < 7.2 and PaCO2 > 60 mmHg (or) major apnoea requiring mask ventilation |
| Starting date | January 2013 |
| Contact information | Rania A. El‐Farrash, MD |
| Notes |
| Trial name or title | Non‐Invasive Ventilation vs Continuous Positive Airway Pressure After Extubation in Very Low Birth Weight Infants |
| Methods | Randomised controlled trial |
| Participants | Infants < 1500 grams and < 34 weeks with RDS and ready for extubation (> 2 hours but < 14 days) Exclusion criteria: major congenital anomalies, presence of cardiovascular instability, intubation < 2 hours, mechanical ventilation > 14 days, using muscle relaxant, airway anomalies, consent not provided or refused |
| Interventions | Non‐synchronised NIPPV and NCPAP |
| Outcomes | Primary: assessment of the need for re‐intubation within the first 72 hours after extubation in the 2 groups Criteria for failure were met by at least 1 of the following: pH < 7.25 and pCO2 > 65 mmHg; more than 2 episodes of recurrent apnoea per hour associated with bradycardia during 4‐hour continuous; 2 episodes of apnoea that required bag and mask ventilation any time during the study; PaO2 < 50 mmHg with FiO2 > 0.6 Secondary: concerning respiratory support: total duration on endotracheal tube ventilation; total duration on NCPAP; total duration on supplemental O2, incidence of pneumothorax, BPD and death. Other outcomes included incidence of patent ductus arteriosus, necrotising enterocolitis, intraventricular haemorrhage grades 3 and 4, retinopathy of prematurity stage 3, time to full feeds and length of hospital stay |
| Starting date | December 2011 |
| Contact information | Alberto Estay, MD |
| Notes | Expected completion date: June 2013 |
| Trial name or title | Successful Extubation and Non‐invasive Ventilation in Preterm ≤ 1500 grams |
| Methods | Randomised controlled trial |
| Participants | Infants 26 to 34 weeks, 500 to 1500 grams, with diagnosis of RDS and first elective extubation |
| Interventions | NIPPV (unspecified device) vs bubble CPAP |
| Outcomes | Success rate of extubation, total duration of oxygen use, mechanical ventilation and bronchopulmonary dysplasia (BPD), days of oxygen use, mechanical ventilation |
| Starting date | August 2012 |
| Contact information | Cintia Johnston |
| Notes | Completed. No publication identified |
| Trial name or title | Nasal Intermittent Positive Pressure Ventilation in Newborn Infants With Respiratory Distress Syndrome |
| Methods | Randomised controlled trial |
| Participants | Inclusion criteria:
Exclusion criteria:
|
| Interventions | NIPPV via Bird ventilator or NCPAP (after extubation or as a primary mode of respiratory support) |
| Outcomes | Primary: incidence of mechanical ventilation via endotracheal tube after non‐invasive respiratory support within 7 days Secondary: overall clinical outcomes at 7 days', 28 days' and 36 weeks' postmenstrual age |
| Starting date | January 2008 |
| Contact information | Yuan Shi, MD |
| Notes | Expected completion date: December 2011; information last updated on Clinicaltrials.gov 17 December 2012. Part of the study population could be included in an updated version of this review. |
| Trial name or title | A Randomised Controlled Trial of Nasal Biphasic Positive Airway Pressure vs Nasal Continuous Positive Airway Pressure Following Extubation in Infants Less Than 30 Weeks’ Gestation: Study Protocol for a Randomised Controlled Trial |
| Methods | Unblinded multi‐centre randomised trial |
| Participants | Infants born before 30 weeks’ gestation and less than 2 weeks old. Infants with congenital abnormalities and severe intraventricular haemorrhage will be excluded. 540 infants admitted to neonatal centres in England will be randomised at the time of first extubation attempt. |
| Interventions | Unblinded multi‐centre randomised trial comparing NCPAP vs n‐BiPAP |
| Outcomes | Primary aim of this study is to compare rate of extubation failure within 48 hours after first attempt at extubation. Secondary aims are to compare effects of n‐BiPAP and n‐CPAP on the following outcomes. |
| Starting date | |
| Contact information | 1 Ward 68, 2nd Floor, St Mary’s Hospital for Women and Children, Manchester, UK M13 9WL |
| Notes | Trial registration number: ISRCTN: ISRCTN18921778 http://www.trialsjournal.com/content/12/1/257 TRIALS |
BPD: bronchopulmonary dysplasia; CPAP: continuous positive airway pressure; FiO2: fraction of inspired oxygen; n‐BiPAP: noninvasive cycled respiratory support mechanism; n‐CPAP/NCPAP: nasal continuous positive airway pressure; NIPPV: nasal intermittent positive pressure ventilation; PaCO2: partial pressure of carbon dioxide in arterial blood; pCO2: partial pressure of carbon dioxide; RDS: respiratory distress syndrome.
Data and analyses
| Outcome or subgroup title | No. of studies | No. of participants | Statistical method | Effect size |
| 1 Respiratory failure post extubation Show forest plot | 10 | 1431 | Risk Ratio (M‐H, Fixed, 95% CI) | 0.70 [0.60, 0.80] |
| Analysis 1.1 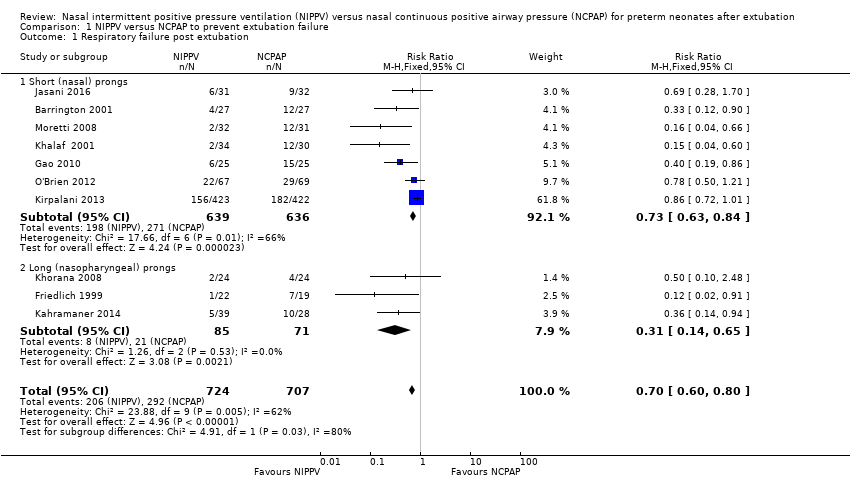 Comparison 1 NIPPV versus NCPAP to prevent extubation failure, Outcome 1 Respiratory failure post extubation. | ||||
| 1.1 Short (nasal) prongs | 7 | 1275 | Risk Ratio (M‐H, Fixed, 95% CI) | 0.73 [0.63, 0.84] |
| 1.2 Long (nasopharyngeal) prongs | 3 | 156 | Risk Ratio (M‐H, Fixed, 95% CI) | 0.31 [0.14, 0.65] |
| 2 Endotracheal re‐intubation Show forest plot | 8 | 1301 | Risk Ratio (M‐H, Fixed, 95% CI) | 0.76 [0.65, 0.88] |
| Analysis 1.2  Comparison 1 NIPPV versus NCPAP to prevent extubation failure, Outcome 2 Endotracheal re‐intubation. | ||||
| 3 Post hoc analysis (high‐quality studies): respiratory failure post extubation Show forest plot | 7 | 1266 | Risk Ratio (M‐H, Fixed, 95% CI) | 0.73 [0.63, 0.85] |
| Analysis 1.3  Comparison 1 NIPPV versus NCPAP to prevent extubation failure, Outcome 3 Post hoc analysis (high‐quality studies): respiratory failure post extubation. | ||||
| Outcome or subgroup title | No. of studies | No. of participants | Statistical method | Effect size |
| 1 Abdominal distension leading to cessation of feeds Show forest plot | 4 | 199 | Risk Ratio (M‐H, Fixed, 95% CI) | 1.27 [0.64, 2.53] |
| Analysis 2.1  Comparison 2 NIPPV versus NCPAP and gastrointestinal complications, Outcome 1 Abdominal distension leading to cessation of feeds. | ||||
| 2 Gastrointestinal perforation Show forest plot | 5 | 1066 | Risk Ratio (M‐H, Fixed, 95% CI) | 0.94 [0.60, 1.48] |
| Analysis 2.2  Comparison 2 NIPPV versus NCPAP and gastrointestinal complications, Outcome 2 Gastrointestinal perforation. | ||||
| 3 Necrotising enterocolitis Show forest plot | 6 | 1214 | Risk Ratio (M‐H, Fixed, 95% CI) | 0.87 [0.64, 1.19] |
| Analysis 2.3  Comparison 2 NIPPV versus NCPAP and gastrointestinal complications, Outcome 3 Necrotising enterocolitis. | ||||
| Outcome or subgroup title | No. of studies | No. of participants | Statistical method | Effect size |
| 1 Chronic lung disease (oxygen supplementation at 36 weeks) Show forest plot | 6 | 1140 | Risk Ratio (M‐H, Fixed, 95% CI) | 0.94 [0.80, 1.10] |
| Analysis 3.1  Comparison 3 NIPPV versus NCPAP to improve pulmonary outcomes, Outcome 1 Chronic lung disease (oxygen supplementation at 36 weeks). | ||||
| 2 Air leaks Show forest plot | 6 | 1229 | Risk Ratio (M‐H, Fixed, 95% CI) | 0.48 [0.28, 0.82] |
| Analysis 3.2  Comparison 3 NIPPV versus NCPAP to improve pulmonary outcomes, Outcome 2 Air leaks. | ||||
| Outcome or subgroup title | No. of studies | No. of participants | Statistical method | Effect size |
| 1 Death before discharge Show forest plot | 6 | 1237 | Risk Ratio (M‐H, Fixed, 95% CI) | 0.69 [0.48, 0.99] |
| Analysis 4.1  Comparison 4 NIPPV versus NCPAP and mortality, Outcome 1 Death before discharge. | ||||
| Outcome or subgroup title | No. of studies | No. of participants | Statistical method | Effect size |
| 1 Duration of hospital admission (days) Show forest plot | 4 | 238 | Mean Difference (IV, Fixed, 95% CI) | 2.77 [0.04, 5.51] |
| Analysis 5.1  Comparison 5 NIPPV versus NCPAP and duration of hospital admission, Outcome 1 Duration of hospital admission (days). | ||||
| Outcome or subgroup title | No. of studies | No. of participants | Statistical method | Effect size |
| 1 Rates of apnoea (episodes/24 h) Show forest plot | 1 | 54 | Mean Difference (IV, Fixed, 95% CI) | ‐3.10 [‐7.92, 1.72] |
| Analysis 6.1  Comparison 6 NIPPV versus NCPAP and apnoea, Outcome 1 Rates of apnoea (episodes/24 h). | ||||
| Outcome or subgroup title | No. of studies | No. of participants | Statistical method | Effect size |
| 1 Respiratory failure post extubation Show forest plot | 10 | 1431 | Risk Ratio (M‐H, Fixed, 95% CI) | 0.70 [0.60, 0.80] |
| Analysis 7.1  Comparison 7 NIPPV versus NCPAP (synchronised vs non‐synchronised), Outcome 1 Respiratory failure post extubation. | ||||
| 1.1 Synchronised NIPPV | 5 | 272 | Risk Ratio (M‐H, Fixed, 95% CI) | 0.25 [0.15, 0.41] |
| 1.2 Non‐synchronised NIPPV | 4 | 314 | Risk Ratio (M‐H, Fixed, 95% CI) | 0.65 [0.46, 0.93] |
| 1.3 Mixed NIPPV devices | 1 | 845 | Risk Ratio (M‐H, Fixed, 95% CI) | 0.86 [0.72, 1.01] |
| 2 Endotracheal re‐intubation during the week post extubation Show forest plot | 10 | 1431 | Risk Ratio (M‐H, Fixed, 95% CI) | 0.74 [0.64, 0.85] |
| Analysis 7.2  Comparison 7 NIPPV versus NCPAP (synchronised vs non‐synchronised), Outcome 2 Endotracheal re‐intubation during the week post extubation. | ||||
| 2.1 Synchronised NIPPV | 5 | 272 | Risk Ratio (M‐H, Fixed, 95% CI) | 0.33 [0.19, 0.57] |
| 2.2 Non‐synchronised NIPPV | 4 | 314 | Risk Ratio (M‐H, Fixed, 95% CI) | 0.65 [0.46, 0.93] |
| 2.3 Mixed NIPPV devices | 1 | 845 | Risk Ratio (M‐H, Fixed, 95% CI) | 0.86 [0.72, 1.01] |
| 3 Abdominal distension requiring cessation of feeds Show forest plot | 3 | 136 | Risk Ratio (M‐H, Fixed, 95% CI) | 1.76 [0.77, 4.05] |
| Analysis 7.3 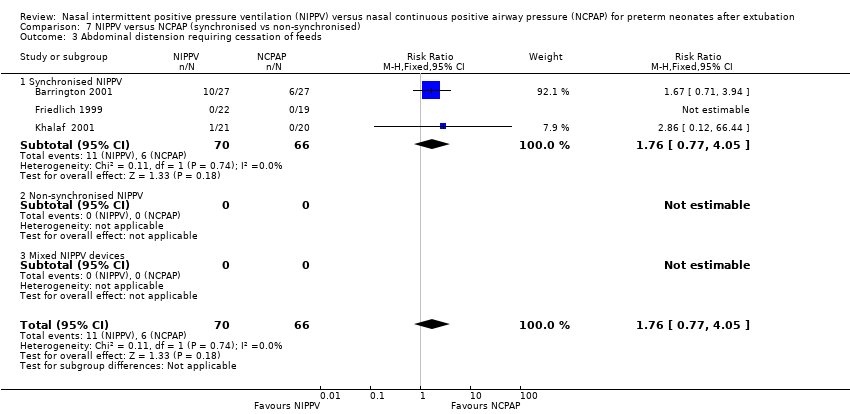 Comparison 7 NIPPV versus NCPAP (synchronised vs non‐synchronised), Outcome 3 Abdominal distension requiring cessation of feeds. | ||||
| 3.1 Synchronised NIPPV | 3 | 136 | Risk Ratio (M‐H, Fixed, 95% CI) | 1.76 [0.77, 4.05] |
| 3.2 Non‐synchronised NIPPV | 0 | 0 | Risk Ratio (M‐H, Fixed, 95% CI) | 0.0 [0.0, 0.0] |
| 3.3 Mixed NIPPV devices | 0 | 0 | Risk Ratio (M‐H, Fixed, 95% CI) | 0.0 [0.0, 0.0] |
| 4 Gastrointestinal perforation Show forest plot | 5 | 1052 | Risk Ratio (M‐H, Fixed, 95% CI) | 0.86 [0.72, 1.01] |
| Analysis 7.4  Comparison 7 NIPPV versus NCPAP (synchronised vs non‐synchronised), Outcome 4 Gastrointestinal perforation. | ||||
| 4.1 Synchronised NIPPV | 3 | 159 | Risk Ratio (M‐H, Fixed, 95% CI) | 0.0 [0.0, 0.0] |
| 4.2 Non‐synchronised NIPPV | 1 | 48 | Risk Ratio (M‐H, Fixed, 95% CI) | 0.0 [0.0, 0.0] |
| 4.3 Mixed NIPPV devices | 1 | 845 | Risk Ratio (M‐H, Fixed, 95% CI) | 0.86 [0.72, 1.01] |
| 5 Necrotising enterocolitis Show forest plot | 6 | 1214 | Risk Ratio (M‐H, Fixed, 95% CI) | 0.87 [0.64, 1.19] |
| Analysis 7.5  Comparison 7 NIPPV versus NCPAP (synchronised vs non‐synchronised), Outcome 5 Necrotising enterocolitis. | ||||
| 5.1 Synchronised NIPPV | 5 | 1147 | Risk Ratio (M‐H, Fixed, 95% CI) | 0.88 [0.64, 1.20] |
| 5.2 Non‐synchronised NIPPV | 1 | 67 | Risk Ratio (M‐H, Fixed, 95% CI) | 0.72 [0.11, 4.79] |
| 5.3 Mixed NIPPV devices | 0 | 0 | Risk Ratio (M‐H, Fixed, 95% CI) | 0.0 [0.0, 0.0] |
| 6 Chronic lung disease (oxygen supplementation at 36 weeks) Show forest plot | 6 | 1108 | Risk Ratio (M‐H, Fixed, 95% CI) | 0.93 [0.79, 1.10] |
| Analysis 7.6 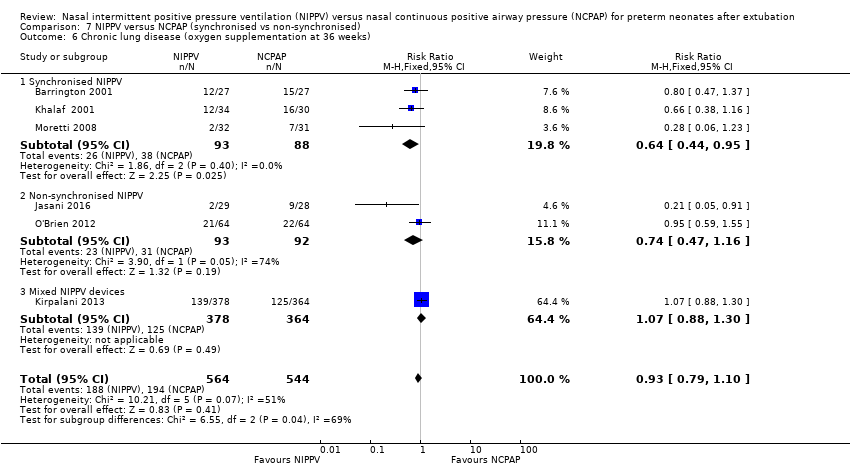 Comparison 7 NIPPV versus NCPAP (synchronised vs non‐synchronised), Outcome 6 Chronic lung disease (oxygen supplementation at 36 weeks). | ||||
| 6.1 Synchronised NIPPV | 3 | 181 | Risk Ratio (M‐H, Fixed, 95% CI) | 0.64 [0.44, 0.95] |
| 6.2 Non‐synchronised NIPPV | 2 | 185 | Risk Ratio (M‐H, Fixed, 95% CI) | 0.74 [0.47, 1.16] |
| 6.3 Mixed NIPPV devices | 1 | 742 | Risk Ratio (M‐H, Fixed, 95% CI) | 1.07 [0.88, 1.30] |
| 7 Pulmonary air leak Show forest plot | 6 | 1222 | Risk Ratio (M‐H, Fixed, 95% CI) | 0.67 [0.44, 1.02] |
| Analysis 7.7  Comparison 7 NIPPV versus NCPAP (synchronised vs non‐synchronised), Outcome 7 Pulmonary air leak. | ||||
| 7.1 Synchronised NIPPV | 2 | 113 | Risk Ratio (M‐H, Fixed, 95% CI) | 0.35 [0.14, 0.90] |
| 7.2 Non‐synchronised NIPPV | 3 | 259 | Risk Ratio (M‐H, Fixed, 95% CI) | 1.10 [0.58, 2.08] |
| 7.3 Mixed NIPPV devices | 1 | 850 | Risk Ratio (M‐H, Fixed, 95% CI) | 0.61 [0.29, 1.28] |
| 8 Rates of apnoea (episodes/24 h) Show forest plot | 1 | 54 | Mean Difference (IV, Fixed, 95% CI) | ‐3.10 [‐7.92, 1.72] |
| Analysis 7.8  Comparison 7 NIPPV versus NCPAP (synchronised vs non‐synchronised), Outcome 8 Rates of apnoea (episodes/24 h). | ||||
| 8.1 Synchronised NIPPV | 1 | 54 | Mean Difference (IV, Fixed, 95% CI) | ‐3.10 [‐7.92, 1.72] |
| 8.2 Non‐synchronised NIPPV | 0 | 0 | Mean Difference (IV, Fixed, 95% CI) | 0.0 [0.0, 0.0] |
| 8.3 Mixed NIPPV devices | 0 | 0 | Mean Difference (IV, Fixed, 95% CI) | 0.0 [0.0, 0.0] |
| 9 Duration of hospitalisation (days) Show forest plot | 4 | 244 | Mean Difference (IV, Fixed, 95% CI) | 2.72 [‐0.01, 5.44] |
| Analysis 7.9  Comparison 7 NIPPV versus NCPAP (synchronised vs non‐synchronised), Outcome 9 Duration of hospitalisation (days). | ||||
| 9.1 Synchronised NIPPV | 3 | 181 | Mean Difference (IV, Fixed, 95% CI) | 3.39 [0.52, 6.25] |
| 9.2 Non‐synchronised NIPPV | 1 | 63 | Mean Difference (IV, Fixed, 95% CI) | ‐3.48 [‐12.20, 5.24] |
| 9.3 Mixed NIPPV devices | 0 | 0 | Mean Difference (IV, Fixed, 95% CI) | 0.0 [0.0, 0.0] |
| 10 Death before discharge Show forest plot | 6 | 1237 | Risk Ratio (M‐H, Fixed, 95% CI) | 0.69 [0.48, 0.99] |
| Analysis 7.10  Comparison 7 NIPPV versus NCPAP (synchronised vs non‐synchronised), Outcome 10 Death before discharge. | ||||
| 10.1 Synchronised NIPPV | 2 | 111 | Risk Ratio (M‐H, Fixed, 95% CI) | 0.97 [0.21, 4.44] |
| 10.2 Non‐synchronised NIPPV | 3 | 266 | Risk Ratio (M‐H, Fixed, 95% CI) | 0.35 [0.16, 0.75] |
| 10.3 Mixed NIPPV devices | 1 | 860 | Risk Ratio (M‐H, Fixed, 95% CI) | 0.85 [0.55, 1.31] |
| Outcome or subgroup title | No. of studies | No. of participants | Statistical method | Effect size |
| 1 Respiratory failure post extubation Show forest plot | 10 | 1431 | Risk Ratio (M‐H, Fixed, 95% CI) | 0.70 [0.60, 0.80] |
| Analysis 8.1 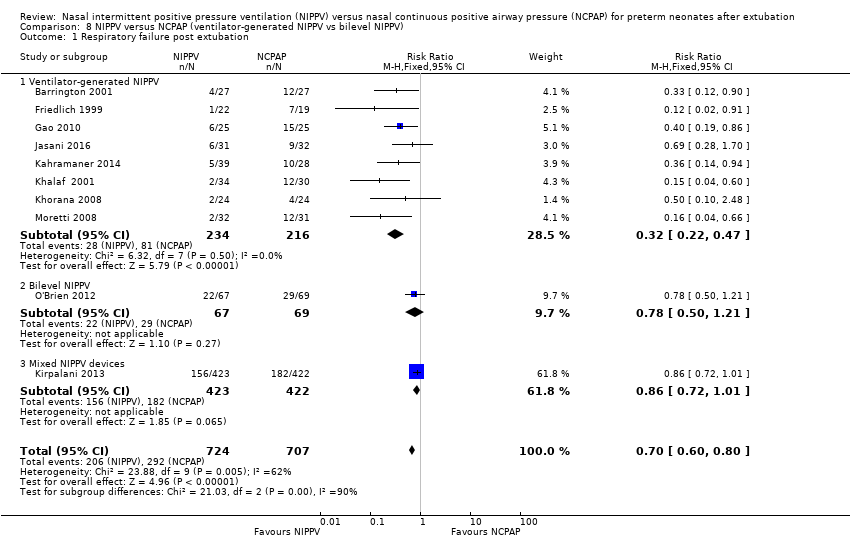 Comparison 8 NIPPV versus NCPAP (ventilator‐generated NIPPV vs bilevel NIPPV), Outcome 1 Respiratory failure post extubation. | ||||
| 1.1 Ventilator‐generated NIPPV | 8 | 450 | Risk Ratio (M‐H, Fixed, 95% CI) | 0.32 [0.22, 0.47] |
| 1.2 Bilevel NIPPV | 1 | 136 | Risk Ratio (M‐H, Fixed, 95% CI) | 0.78 [0.50, 1.21] |
| 1.3 Mixed NIPPV devices | 1 | 845 | Risk Ratio (M‐H, Fixed, 95% CI) | 0.86 [0.72, 1.01] |
| 2 Endotracheal re‐intubation during the week post extubation Show forest plot | 10 | 1431 | Risk Ratio (M‐H, Fixed, 95% CI) | 0.74 [0.64, 0.85] |
| Analysis 8.2  Comparison 8 NIPPV versus NCPAP (ventilator‐generated NIPPV vs bilevel NIPPV), Outcome 2 Endotracheal re‐intubation during the week post extubation. | ||||
| 2.1 Ventilator‐generated NIPPV | 8 | 450 | Risk Ratio (M‐H, Fixed, 95% CI) | 0.39 [0.26, 0.59] |
| 2.2 Bilevel NIPPV | 1 | 136 | Risk Ratio (M‐H, Fixed, 95% CI) | 0.78 [0.50, 1.21] |
| 2.3 Mixed NIPPV devices | 1 | 845 | Risk Ratio (M‐H, Fixed, 95% CI) | 0.86 [0.72, 1.01] |
| 3 Abdominal distension requiring cessation of feeds Show forest plot | 3 | 136 | Risk Ratio (M‐H, Fixed, 95% CI) | 1.76 [0.77, 4.05] |
| Analysis 8.3  Comparison 8 NIPPV versus NCPAP (ventilator‐generated NIPPV vs bilevel NIPPV), Outcome 3 Abdominal distension requiring cessation of feeds. | ||||
| 3.1 Ventilator‐generated NIPPV | 3 | 136 | Risk Ratio (M‐H, Fixed, 95% CI) | 1.76 [0.77, 4.05] |
| 3.2 Bilevel NIPPV | 0 | 0 | Risk Ratio (M‐H, Fixed, 95% CI) | 0.0 [0.0, 0.0] |
| 3.3 Mixed NIPPV devices | 0 | 0 | Risk Ratio (M‐H, Fixed, 95% CI) | 0.0 [0.0, 0.0] |
| 4 Gastrointestinal perforation Show forest plot | 6 | 1133 | Risk Ratio (M‐H, Fixed, 95% CI) | 0.94 [0.60, 1.48] |
| Analysis 8.4 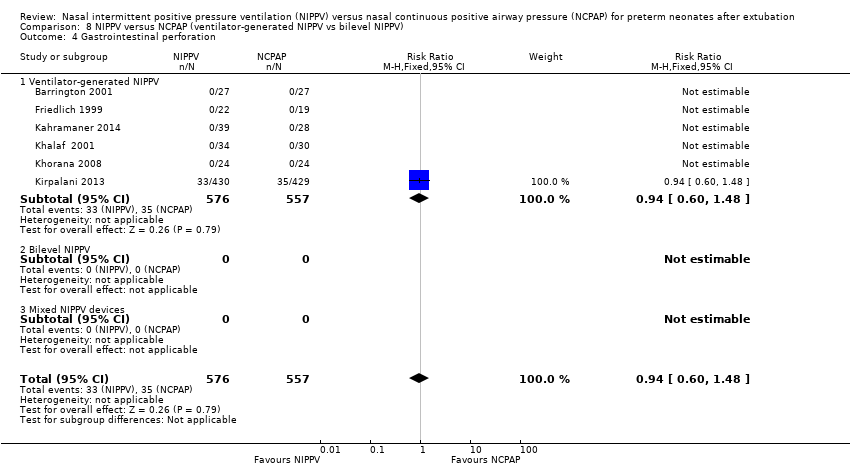 Comparison 8 NIPPV versus NCPAP (ventilator‐generated NIPPV vs bilevel NIPPV), Outcome 4 Gastrointestinal perforation. | ||||
| 4.1 Ventilator‐generated NIPPV | 6 | 1133 | Risk Ratio (M‐H, Fixed, 95% CI) | 0.94 [0.60, 1.48] |
| 4.2 Bilevel NIPPV | 0 | 0 | Risk Ratio (M‐H, Fixed, 95% CI) | 0.0 [0.0, 0.0] |
| 4.3 Mixed NIPPV devices | 0 | 0 | Risk Ratio (M‐H, Fixed, 95% CI) | 0.0 [0.0, 0.0] |
| 5 Necrotising enterocolitis Show forest plot | 6 | 1214 | Risk Ratio (M‐H, Fixed, 95% CI) | 0.87 [0.64, 1.19] |
| Analysis 8.5  Comparison 8 NIPPV versus NCPAP (ventilator‐generated NIPPV vs bilevel NIPPV), Outcome 5 Necrotising enterocolitis. | ||||
| 5.1 Ventilator‐generated NIPPV | 4 | 219 | Risk Ratio (M‐H, Fixed, 95% CI) | 0.63 [0.21, 1.93] |
| 5.2 Bilevel NIPPV | 1 | 136 | Risk Ratio (M‐H, Fixed, 95% CI) | 1.03 [0.38, 2.78] |
| 5.3 Mixed NIPPV devices | 1 | 859 | Risk Ratio (M‐H, Fixed, 95% CI) | 0.89 [0.63, 1.24] |
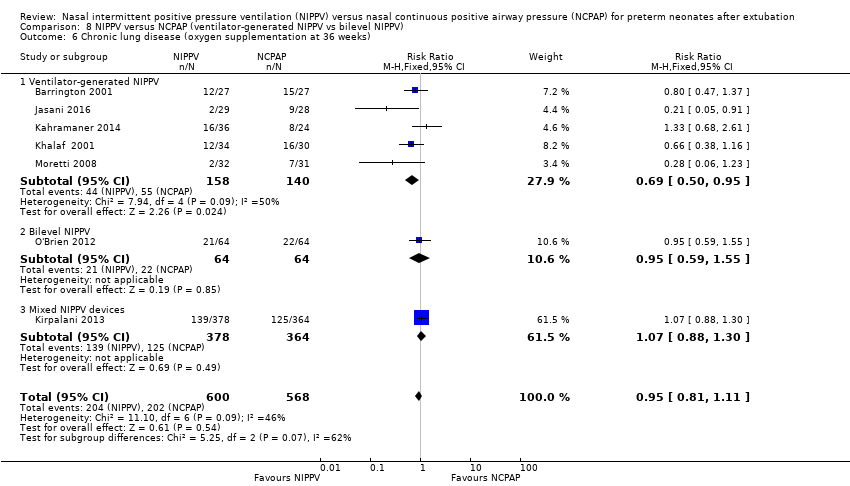
| 6 Chronic lung disease (oxygen supplementation at 36 weeks) Show forest plot | 7 | 1168 | Risk Ratio (M‐H, Fixed, 95% CI) | 0.95 [0.81, 1.11] |
| Analysis 8.6  Comparison 8 NIPPV versus NCPAP (ventilator‐generated NIPPV vs bilevel NIPPV), Outcome 6 Chronic lung disease (oxygen supplementation at 36 weeks). | ||||
| 6.1 Ventilator‐generated NIPPV | 5 | 298 | Risk Ratio (M‐H, Fixed, 95% CI) | 0.69 [0.50, 0.95] |
| 6.2 Bilevel NIPPV | 1 | 128 | Risk Ratio (M‐H, Fixed, 95% CI) | 0.95 [0.59, 1.55] |
| 6.3 Mixed NIPPV devices | 1 | 742 | Risk Ratio (M‐H, Fixed, 95% CI) | 1.07 [0.88, 1.30] |
| 7 Pulmonary air leak Show forest plot | 6 | 1229 | Risk Ratio (M‐H, Fixed, 95% CI) | 0.48 [0.28, 0.82] |
| Analysis 8.7 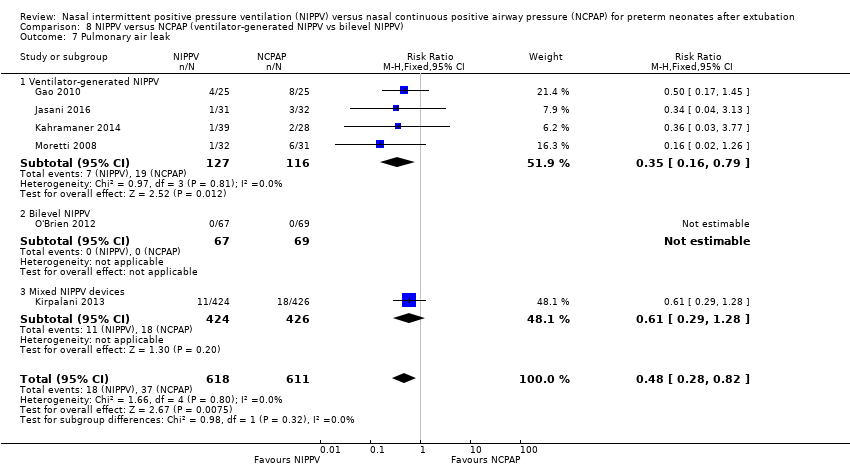 Comparison 8 NIPPV versus NCPAP (ventilator‐generated NIPPV vs bilevel NIPPV), Outcome 7 Pulmonary air leak. | ||||
| 7.1 Ventilator‐generated NIPPV | 4 | 243 | Risk Ratio (M‐H, Fixed, 95% CI) | 0.35 [0.16, 0.79] |
| 7.2 Bilevel NIPPV | 1 | 136 | Risk Ratio (M‐H, Fixed, 95% CI) | 0.0 [0.0, 0.0] |
| 7.3 Mixed NIPPV devices | 1 | 850 | Risk Ratio (M‐H, Fixed, 95% CI) | 0.61 [0.29, 1.28] |
| 8 Rates of apnoea (episodes/24 h) Show forest plot | 1 | 54 | Mean Difference (IV, Fixed, 95% CI) | ‐3.10 [‐7.92, 1.72] |
| Analysis 8.8 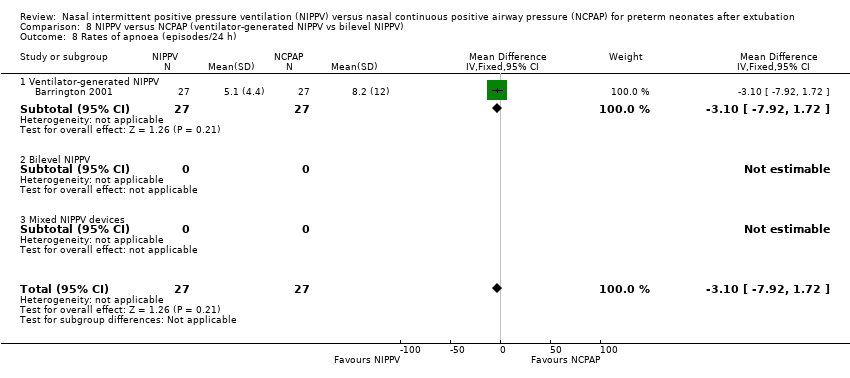 Comparison 8 NIPPV versus NCPAP (ventilator‐generated NIPPV vs bilevel NIPPV), Outcome 8 Rates of apnoea (episodes/24 h). | ||||
| 8.1 Ventilator‐generated NIPPV | 1 | 54 | Mean Difference (IV, Fixed, 95% CI) | ‐3.10 [‐7.92, 1.72] |
| 8.2 Bilevel NIPPV | 0 | 0 | Mean Difference (IV, Fixed, 95% CI) | 0.0 [0.0, 0.0] |
| 8.3 Mixed NIPPV devices | 0 | 0 | Mean Difference (IV, Fixed, 95% CI) | 0.0 [0.0, 0.0] |
| 9 Duration of hospitalisation (days) Show forest plot | 4 | 244 | Mean Difference (IV, Fixed, 95% CI) | 2.72 [‐0.01, 5.44] |
| Analysis 8.9  Comparison 8 NIPPV versus NCPAP (ventilator‐generated NIPPV vs bilevel NIPPV), Outcome 9 Duration of hospitalisation (days). | ||||
| 9.1 Ventilator‐generated NIPPV | 4 | 244 | Mean Difference (IV, Fixed, 95% CI) | 2.72 [‐0.01, 5.44] |
| 9.2 Bilevel NIPPV | 0 | 0 | Mean Difference (IV, Fixed, 95% CI) | 0.0 [0.0, 0.0] |
| 9.3 Mixed NIPPV devices | 0 | 0 | Mean Difference (IV, Fixed, 95% CI) | 0.0 [0.0, 0.0] |
| 10 Death before discharge Show forest plot | 6 | 1237 | Risk Ratio (M‐H, Fixed, 95% CI) | 0.69 [0.48, 0.99] |
| Analysis 8.10 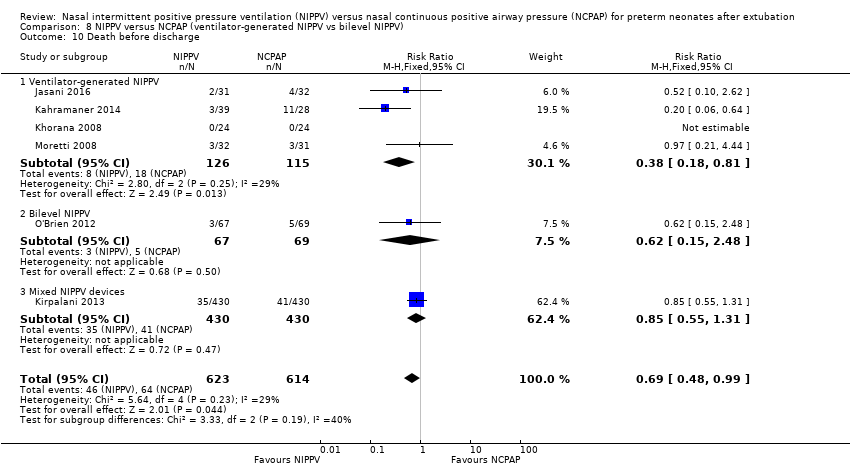 Comparison 8 NIPPV versus NCPAP (ventilator‐generated NIPPV vs bilevel NIPPV), Outcome 10 Death before discharge. | ||||
| 10.1 Ventilator‐generated NIPPV | 4 | 241 | Risk Ratio (M‐H, Fixed, 95% CI) | 0.38 [0.18, 0.81] |
| 10.2 Bilevel NIPPV | 1 | 136 | Risk Ratio (M‐H, Fixed, 95% CI) | 0.62 [0.15, 2.48] |
| 10.3 Mixed NIPPV devices | 1 | 860 | Risk Ratio (M‐H, Fixed, 95% CI) | 0.85 [0.55, 1.31] |

Study flow diagram: review update.
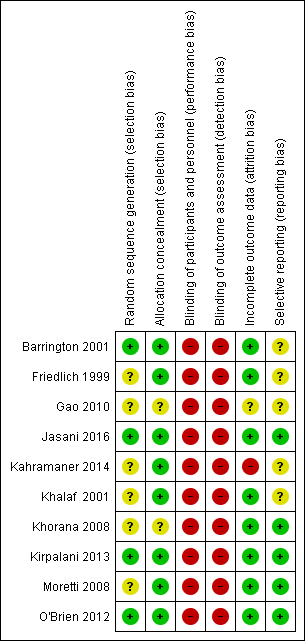
Risk of bias summary: review authors' judgements about each risk of bias item for each included study.

Comparison 1 NIPPV versus NCPAP to prevent extubation failure, Outcome 1 Respiratory failure post extubation.
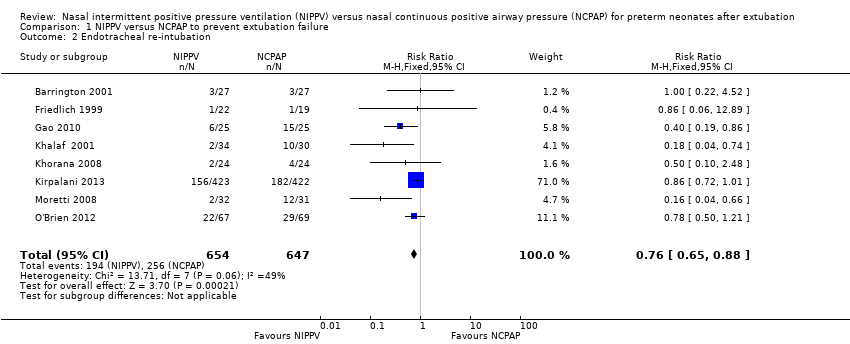
Comparison 1 NIPPV versus NCPAP to prevent extubation failure, Outcome 2 Endotracheal re‐intubation.
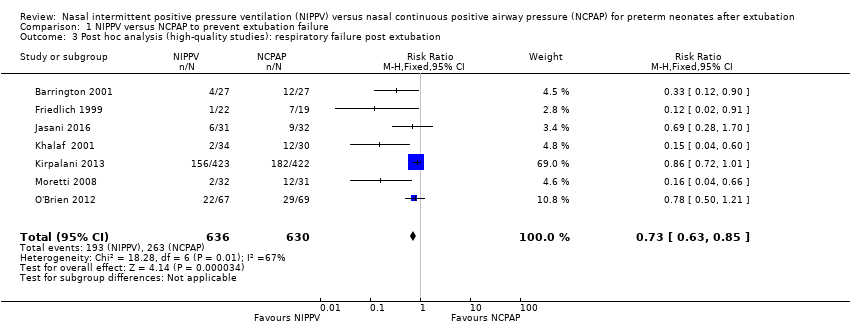
Comparison 1 NIPPV versus NCPAP to prevent extubation failure, Outcome 3 Post hoc analysis (high‐quality studies): respiratory failure post extubation.
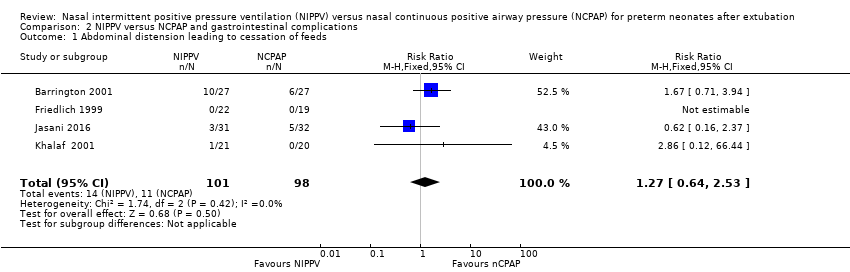
Comparison 2 NIPPV versus NCPAP and gastrointestinal complications, Outcome 1 Abdominal distension leading to cessation of feeds.
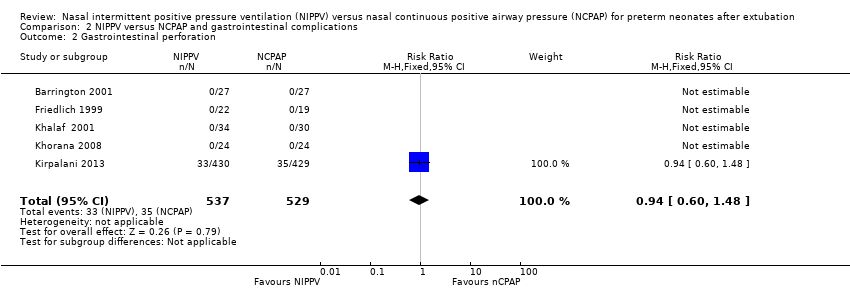
Comparison 2 NIPPV versus NCPAP and gastrointestinal complications, Outcome 2 Gastrointestinal perforation.

Comparison 2 NIPPV versus NCPAP and gastrointestinal complications, Outcome 3 Necrotising enterocolitis.

Comparison 3 NIPPV versus NCPAP to improve pulmonary outcomes, Outcome 1 Chronic lung disease (oxygen supplementation at 36 weeks).
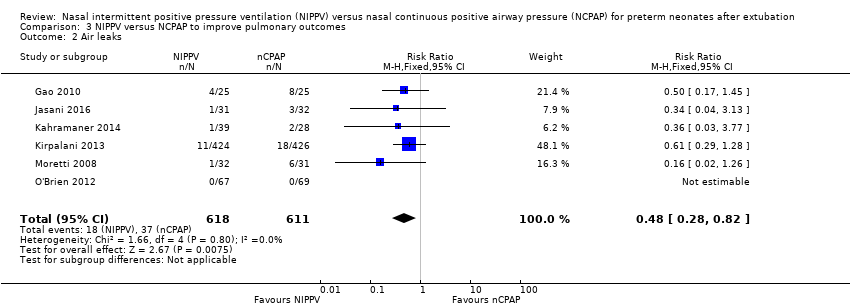
Comparison 3 NIPPV versus NCPAP to improve pulmonary outcomes, Outcome 2 Air leaks.

Comparison 4 NIPPV versus NCPAP and mortality, Outcome 1 Death before discharge.
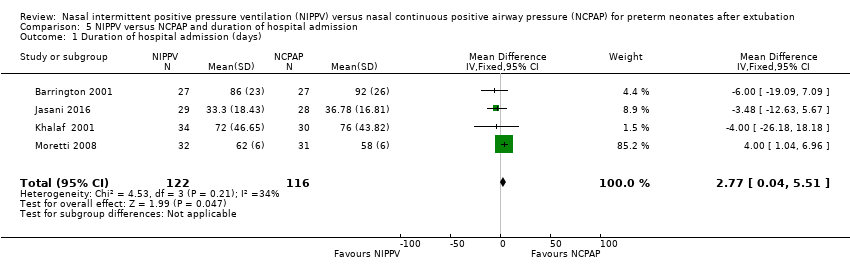
Comparison 5 NIPPV versus NCPAP and duration of hospital admission, Outcome 1 Duration of hospital admission (days).

Comparison 6 NIPPV versus NCPAP and apnoea, Outcome 1 Rates of apnoea (episodes/24 h).

Comparison 7 NIPPV versus NCPAP (synchronised vs non‐synchronised), Outcome 1 Respiratory failure post extubation.

Comparison 7 NIPPV versus NCPAP (synchronised vs non‐synchronised), Outcome 2 Endotracheal re‐intubation during the week post extubation.

Comparison 7 NIPPV versus NCPAP (synchronised vs non‐synchronised), Outcome 3 Abdominal distension requiring cessation of feeds.

Comparison 7 NIPPV versus NCPAP (synchronised vs non‐synchronised), Outcome 4 Gastrointestinal perforation.

Comparison 7 NIPPV versus NCPAP (synchronised vs non‐synchronised), Outcome 5 Necrotising enterocolitis.

Comparison 7 NIPPV versus NCPAP (synchronised vs non‐synchronised), Outcome 6 Chronic lung disease (oxygen supplementation at 36 weeks).

Comparison 7 NIPPV versus NCPAP (synchronised vs non‐synchronised), Outcome 7 Pulmonary air leak.

Comparison 7 NIPPV versus NCPAP (synchronised vs non‐synchronised), Outcome 8 Rates of apnoea (episodes/24 h).
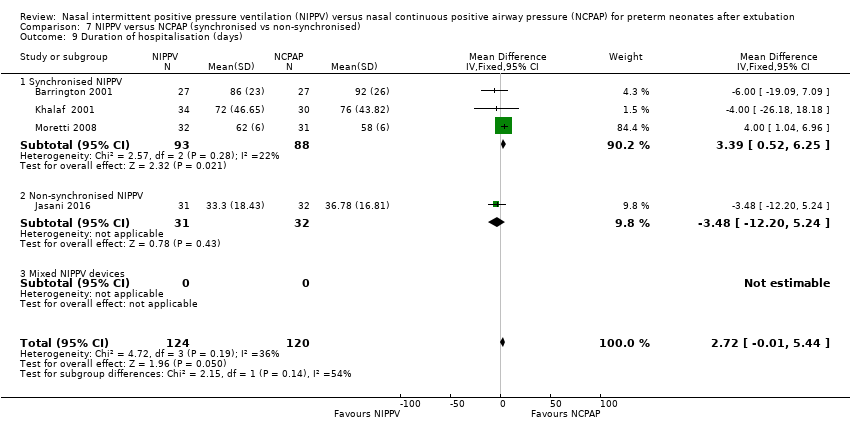
Comparison 7 NIPPV versus NCPAP (synchronised vs non‐synchronised), Outcome 9 Duration of hospitalisation (days).

Comparison 7 NIPPV versus NCPAP (synchronised vs non‐synchronised), Outcome 10 Death before discharge.

Comparison 8 NIPPV versus NCPAP (ventilator‐generated NIPPV vs bilevel NIPPV), Outcome 1 Respiratory failure post extubation.

Comparison 8 NIPPV versus NCPAP (ventilator‐generated NIPPV vs bilevel NIPPV), Outcome 2 Endotracheal re‐intubation during the week post extubation.

Comparison 8 NIPPV versus NCPAP (ventilator‐generated NIPPV vs bilevel NIPPV), Outcome 3 Abdominal distension requiring cessation of feeds.

Comparison 8 NIPPV versus NCPAP (ventilator‐generated NIPPV vs bilevel NIPPV), Outcome 4 Gastrointestinal perforation.

Comparison 8 NIPPV versus NCPAP (ventilator‐generated NIPPV vs bilevel NIPPV), Outcome 5 Necrotising enterocolitis.
Comparison 8 NIPPV versus NCPAP (ventilator‐generated NIPPV vs bilevel NIPPV), Outcome 6 Chronic lung disease (oxygen supplementation at 36 weeks).

Comparison 8 NIPPV versus NCPAP (ventilator‐generated NIPPV vs bilevel NIPPV), Outcome 7 Pulmonary air leak.

Comparison 8 NIPPV versus NCPAP (ventilator‐generated NIPPV vs bilevel NIPPV), Outcome 8 Rates of apnoea (episodes/24 h).

Comparison 8 NIPPV versus NCPAP (ventilator‐generated NIPPV vs bilevel NIPPV), Outcome 9 Duration of hospitalisation (days).

Comparison 8 NIPPV versus NCPAP (ventilator‐generated NIPPV vs bilevel NIPPV), Outcome 10 Death before discharge.
| NIPPV versus NCPAP | ||||||
| Patient or population: preterm neonates after extubation | ||||||
| Outcomes | Anticipated absolute effects* (95% CI) | Relative effect | Number of participants | Quality of the evidence | Comments | |
| Risk with NCPAP | Risk with NIPPV | |||||
| Respiratory failure post extubation | Study population | RR 0.70 | 1431 | Moderatea | Risk of bias: intervention unblinded OIS 554 | |
| 413 per 1000 | 289 per 1000 | |||||
| Endotracheal re‐intubation during the week post extubation | Study population | RR 0.76 | 1301 (8 studies) | Moderatea | Risk of bias: intervention unblinded OIS 724 | |
| 396 per 1000 | 301 per 1000 | |||||
| Abdominal distension requiring cessation of feeds | Study population | RR 1.27 | 199 (4 studies) | Lowa,b | Risk of bias: intervention unblinded Imprecision: wide confidence intervals | |
| 112 per 1000 | 143 per 1000 | |||||
| Gastrointestinal perforation | Study population | RR 0.94 | 1066 (5 studies) | Moderatea | Risk of bias: intervention unblinded | |
| 66 per 1000 | 62 per 1000 | |||||
| Necrotising enterocolitis | Study population | RR 0.87 | 1214 | Moderatea | Risk of bias: intervention unblinded | |
| 127 per 1000 | 110 per 1000 | |||||
| Chronic lung disease (oxygen supplementation at 36 weeks) | Study population | RR 0.94 | 1140 (6 studies) | Moderatea | Risk of bias: intervention unblinded | |
| 355 per 1000 | 334 per 1000 | |||||
| Pulmonary air leak | Study population | RR 0.48 | 1229 | Moderatea | Risk of bias: intervention unblinded OIS 749 | |
| 61 per 1000 | 29 per 1000 | |||||
| Duration of hospitalisation (days) | Mean duration of hospitalisation (days) was 0 | Mean duration of hospitalisation (days) in the intervention group was 2.77 higher (0.04 to 5.51 higher) | 238 | Lowa,b | Risk of bias: intervention unblinded Imprecision: wide confidence intervals | |
| Death before discharge | Study population | RR 0.69 | 1237 | Moderatea | Risk of bias: intervention unblinded Imprecision OIS 1844 | |
| 104 per 1000 | 72 per 1000 | |||||
| *The risk in the intervention group (and its 95% confidence interval) is based on assumed risk in the comparison group and the relative effect of the intervention (and its 95% CI). | ||||||
| GRADE Working Group grades of evidence. | ||||||
| aIntervention unblinded. bImprecise estimate (wide confidence intervals). | ||||||
| Outcome or subgroup title | No. of studies | No. of participants | Statistical method | Effect size |
| 1 Respiratory failure post extubation Show forest plot | 10 | 1431 | Risk Ratio (M‐H, Fixed, 95% CI) | 0.70 [0.60, 0.80] |
| 1.1 Short (nasal) prongs | 7 | 1275 | Risk Ratio (M‐H, Fixed, 95% CI) | 0.73 [0.63, 0.84] |
| 1.2 Long (nasopharyngeal) prongs | 3 | 156 | Risk Ratio (M‐H, Fixed, 95% CI) | 0.31 [0.14, 0.65] |
| 2 Endotracheal re‐intubation Show forest plot | 8 | 1301 | Risk Ratio (M‐H, Fixed, 95% CI) | 0.76 [0.65, 0.88] |
| 3 Post hoc analysis (high‐quality studies): respiratory failure post extubation Show forest plot | 7 | 1266 | Risk Ratio (M‐H, Fixed, 95% CI) | 0.73 [0.63, 0.85] |
| Outcome or subgroup title | No. of studies | No. of participants | Statistical method | Effect size |
| 1 Abdominal distension leading to cessation of feeds Show forest plot | 4 | 199 | Risk Ratio (M‐H, Fixed, 95% CI) | 1.27 [0.64, 2.53] |
| 2 Gastrointestinal perforation Show forest plot | 5 | 1066 | Risk Ratio (M‐H, Fixed, 95% CI) | 0.94 [0.60, 1.48] |
| 3 Necrotising enterocolitis Show forest plot | 6 | 1214 | Risk Ratio (M‐H, Fixed, 95% CI) | 0.87 [0.64, 1.19] |
| Outcome or subgroup title | No. of studies | No. of participants | Statistical method | Effect size |
| 1 Chronic lung disease (oxygen supplementation at 36 weeks) Show forest plot | 6 | 1140 | Risk Ratio (M‐H, Fixed, 95% CI) | 0.94 [0.80, 1.10] |
| 2 Air leaks Show forest plot | 6 | 1229 | Risk Ratio (M‐H, Fixed, 95% CI) | 0.48 [0.28, 0.82] |
| Outcome or subgroup title | No. of studies | No. of participants | Statistical method | Effect size |
| 1 Death before discharge Show forest plot | 6 | 1237 | Risk Ratio (M‐H, Fixed, 95% CI) | 0.69 [0.48, 0.99] |
| Outcome or subgroup title | No. of studies | No. of participants | Statistical method | Effect size |
| 1 Duration of hospital admission (days) Show forest plot | 4 | 238 | Mean Difference (IV, Fixed, 95% CI) | 2.77 [0.04, 5.51] |
| Outcome or subgroup title | No. of studies | No. of participants | Statistical method | Effect size |
| 1 Rates of apnoea (episodes/24 h) Show forest plot | 1 | 54 | Mean Difference (IV, Fixed, 95% CI) | ‐3.10 [‐7.92, 1.72] |
| Outcome or subgroup title | No. of studies | No. of participants | Statistical method | Effect size |
| 1 Respiratory failure post extubation Show forest plot | 10 | 1431 | Risk Ratio (M‐H, Fixed, 95% CI) | 0.70 [0.60, 0.80] |
| 1.1 Synchronised NIPPV | 5 | 272 | Risk Ratio (M‐H, Fixed, 95% CI) | 0.25 [0.15, 0.41] |
| 1.2 Non‐synchronised NIPPV | 4 | 314 | Risk Ratio (M‐H, Fixed, 95% CI) | 0.65 [0.46, 0.93] |
| 1.3 Mixed NIPPV devices | 1 | 845 | Risk Ratio (M‐H, Fixed, 95% CI) | 0.86 [0.72, 1.01] |
| 2 Endotracheal re‐intubation during the week post extubation Show forest plot | 10 | 1431 | Risk Ratio (M‐H, Fixed, 95% CI) | 0.74 [0.64, 0.85] |
| 2.1 Synchronised NIPPV | 5 | 272 | Risk Ratio (M‐H, Fixed, 95% CI) | 0.33 [0.19, 0.57] |
| 2.2 Non‐synchronised NIPPV | 4 | 314 | Risk Ratio (M‐H, Fixed, 95% CI) | 0.65 [0.46, 0.93] |
| 2.3 Mixed NIPPV devices | 1 | 845 | Risk Ratio (M‐H, Fixed, 95% CI) | 0.86 [0.72, 1.01] |
| 3 Abdominal distension requiring cessation of feeds Show forest plot | 3 | 136 | Risk Ratio (M‐H, Fixed, 95% CI) | 1.76 [0.77, 4.05] |
| 3.1 Synchronised NIPPV | 3 | 136 | Risk Ratio (M‐H, Fixed, 95% CI) | 1.76 [0.77, 4.05] |
| 3.2 Non‐synchronised NIPPV | 0 | 0 | Risk Ratio (M‐H, Fixed, 95% CI) | 0.0 [0.0, 0.0] |
| 3.3 Mixed NIPPV devices | 0 | 0 | Risk Ratio (M‐H, Fixed, 95% CI) | 0.0 [0.0, 0.0] |
| 4 Gastrointestinal perforation Show forest plot | 5 | 1052 | Risk Ratio (M‐H, Fixed, 95% CI) | 0.86 [0.72, 1.01] |
| 4.1 Synchronised NIPPV | 3 | 159 | Risk Ratio (M‐H, Fixed, 95% CI) | 0.0 [0.0, 0.0] |
| 4.2 Non‐synchronised NIPPV | 1 | 48 | Risk Ratio (M‐H, Fixed, 95% CI) | 0.0 [0.0, 0.0] |
| 4.3 Mixed NIPPV devices | 1 | 845 | Risk Ratio (M‐H, Fixed, 95% CI) | 0.86 [0.72, 1.01] |
| 5 Necrotising enterocolitis Show forest plot | 6 | 1214 | Risk Ratio (M‐H, Fixed, 95% CI) | 0.87 [0.64, 1.19] |
| 5.1 Synchronised NIPPV | 5 | 1147 | Risk Ratio (M‐H, Fixed, 95% CI) | 0.88 [0.64, 1.20] |
| 5.2 Non‐synchronised NIPPV | 1 | 67 | Risk Ratio (M‐H, Fixed, 95% CI) | 0.72 [0.11, 4.79] |
| 5.3 Mixed NIPPV devices | 0 | 0 | Risk Ratio (M‐H, Fixed, 95% CI) | 0.0 [0.0, 0.0] |
| 6 Chronic lung disease (oxygen supplementation at 36 weeks) Show forest plot | 6 | 1108 | Risk Ratio (M‐H, Fixed, 95% CI) | 0.93 [0.79, 1.10] |
| 6.1 Synchronised NIPPV | 3 | 181 | Risk Ratio (M‐H, Fixed, 95% CI) | 0.64 [0.44, 0.95] |
| 6.2 Non‐synchronised NIPPV | 2 | 185 | Risk Ratio (M‐H, Fixed, 95% CI) | 0.74 [0.47, 1.16] |
| 6.3 Mixed NIPPV devices | 1 | 742 | Risk Ratio (M‐H, Fixed, 95% CI) | 1.07 [0.88, 1.30] |
| 7 Pulmonary air leak Show forest plot | 6 | 1222 | Risk Ratio (M‐H, Fixed, 95% CI) | 0.67 [0.44, 1.02] |
| 7.1 Synchronised NIPPV | 2 | 113 | Risk Ratio (M‐H, Fixed, 95% CI) | 0.35 [0.14, 0.90] |
| 7.2 Non‐synchronised NIPPV | 3 | 259 | Risk Ratio (M‐H, Fixed, 95% CI) | 1.10 [0.58, 2.08] |
| 7.3 Mixed NIPPV devices | 1 | 850 | Risk Ratio (M‐H, Fixed, 95% CI) | 0.61 [0.29, 1.28] |
| 8 Rates of apnoea (episodes/24 h) Show forest plot | 1 | 54 | Mean Difference (IV, Fixed, 95% CI) | ‐3.10 [‐7.92, 1.72] |
| 8.1 Synchronised NIPPV | 1 | 54 | Mean Difference (IV, Fixed, 95% CI) | ‐3.10 [‐7.92, 1.72] |
| 8.2 Non‐synchronised NIPPV | 0 | 0 | Mean Difference (IV, Fixed, 95% CI) | 0.0 [0.0, 0.0] |
| 8.3 Mixed NIPPV devices | 0 | 0 | Mean Difference (IV, Fixed, 95% CI) | 0.0 [0.0, 0.0] |
| 9 Duration of hospitalisation (days) Show forest plot | 4 | 244 | Mean Difference (IV, Fixed, 95% CI) | 2.72 [‐0.01, 5.44] |
| 9.1 Synchronised NIPPV | 3 | 181 | Mean Difference (IV, Fixed, 95% CI) | 3.39 [0.52, 6.25] |
| 9.2 Non‐synchronised NIPPV | 1 | 63 | Mean Difference (IV, Fixed, 95% CI) | ‐3.48 [‐12.20, 5.24] |
| 9.3 Mixed NIPPV devices | 0 | 0 | Mean Difference (IV, Fixed, 95% CI) | 0.0 [0.0, 0.0] |
| 10 Death before discharge Show forest plot | 6 | 1237 | Risk Ratio (M‐H, Fixed, 95% CI) | 0.69 [0.48, 0.99] |
| 10.1 Synchronised NIPPV | 2 | 111 | Risk Ratio (M‐H, Fixed, 95% CI) | 0.97 [0.21, 4.44] |
| 10.2 Non‐synchronised NIPPV | 3 | 266 | Risk Ratio (M‐H, Fixed, 95% CI) | 0.35 [0.16, 0.75] |
| 10.3 Mixed NIPPV devices | 1 | 860 | Risk Ratio (M‐H, Fixed, 95% CI) | 0.85 [0.55, 1.31] |
| Outcome or subgroup title | No. of studies | No. of participants | Statistical method | Effect size |
| 1 Respiratory failure post extubation Show forest plot | 10 | 1431 | Risk Ratio (M‐H, Fixed, 95% CI) | 0.70 [0.60, 0.80] |
| 1.1 Ventilator‐generated NIPPV | 8 | 450 | Risk Ratio (M‐H, Fixed, 95% CI) | 0.32 [0.22, 0.47] |
| 1.2 Bilevel NIPPV | 1 | 136 | Risk Ratio (M‐H, Fixed, 95% CI) | 0.78 [0.50, 1.21] |
| 1.3 Mixed NIPPV devices | 1 | 845 | Risk Ratio (M‐H, Fixed, 95% CI) | 0.86 [0.72, 1.01] |
| 2 Endotracheal re‐intubation during the week post extubation Show forest plot | 10 | 1431 | Risk Ratio (M‐H, Fixed, 95% CI) | 0.74 [0.64, 0.85] |
| 2.1 Ventilator‐generated NIPPV | 8 | 450 | Risk Ratio (M‐H, Fixed, 95% CI) | 0.39 [0.26, 0.59] |
| 2.2 Bilevel NIPPV | 1 | 136 | Risk Ratio (M‐H, Fixed, 95% CI) | 0.78 [0.50, 1.21] |
| 2.3 Mixed NIPPV devices | 1 | 845 | Risk Ratio (M‐H, Fixed, 95% CI) | 0.86 [0.72, 1.01] |
| 3 Abdominal distension requiring cessation of feeds Show forest plot | 3 | 136 | Risk Ratio (M‐H, Fixed, 95% CI) | 1.76 [0.77, 4.05] |
| 3.1 Ventilator‐generated NIPPV | 3 | 136 | Risk Ratio (M‐H, Fixed, 95% CI) | 1.76 [0.77, 4.05] |
| 3.2 Bilevel NIPPV | 0 | 0 | Risk Ratio (M‐H, Fixed, 95% CI) | 0.0 [0.0, 0.0] |
| 3.3 Mixed NIPPV devices | 0 | 0 | Risk Ratio (M‐H, Fixed, 95% CI) | 0.0 [0.0, 0.0] |
| 4 Gastrointestinal perforation Show forest plot | 6 | 1133 | Risk Ratio (M‐H, Fixed, 95% CI) | 0.94 [0.60, 1.48] |
| 4.1 Ventilator‐generated NIPPV | 6 | 1133 | Risk Ratio (M‐H, Fixed, 95% CI) | 0.94 [0.60, 1.48] |
| 4.2 Bilevel NIPPV | 0 | 0 | Risk Ratio (M‐H, Fixed, 95% CI) | 0.0 [0.0, 0.0] |
| 4.3 Mixed NIPPV devices | 0 | 0 | Risk Ratio (M‐H, Fixed, 95% CI) | 0.0 [0.0, 0.0] |
| 5 Necrotising enterocolitis Show forest plot | 6 | 1214 | Risk Ratio (M‐H, Fixed, 95% CI) | 0.87 [0.64, 1.19] |
| 5.1 Ventilator‐generated NIPPV | 4 | 219 | Risk Ratio (M‐H, Fixed, 95% CI) | 0.63 [0.21, 1.93] |
| 5.2 Bilevel NIPPV | 1 | 136 | Risk Ratio (M‐H, Fixed, 95% CI) | 1.03 [0.38, 2.78] |
| 5.3 Mixed NIPPV devices | 1 | 859 | Risk Ratio (M‐H, Fixed, 95% CI) | 0.89 [0.63, 1.24] |
| 6 Chronic lung disease (oxygen supplementation at 36 weeks) Show forest plot | 7 | 1168 | Risk Ratio (M‐H, Fixed, 95% CI) | 0.95 [0.81, 1.11] |
| 6.1 Ventilator‐generated NIPPV | 5 | 298 | Risk Ratio (M‐H, Fixed, 95% CI) | 0.69 [0.50, 0.95] |
| 6.2 Bilevel NIPPV | 1 | 128 | Risk Ratio (M‐H, Fixed, 95% CI) | 0.95 [0.59, 1.55] |
| 6.3 Mixed NIPPV devices | 1 | 742 | Risk Ratio (M‐H, Fixed, 95% CI) | 1.07 [0.88, 1.30] |
| 7 Pulmonary air leak Show forest plot | 6 | 1229 | Risk Ratio (M‐H, Fixed, 95% CI) | 0.48 [0.28, 0.82] |
| 7.1 Ventilator‐generated NIPPV | 4 | 243 | Risk Ratio (M‐H, Fixed, 95% CI) | 0.35 [0.16, 0.79] |
| 7.2 Bilevel NIPPV | 1 | 136 | Risk Ratio (M‐H, Fixed, 95% CI) | 0.0 [0.0, 0.0] |
| 7.3 Mixed NIPPV devices | 1 | 850 | Risk Ratio (M‐H, Fixed, 95% CI) | 0.61 [0.29, 1.28] |
| 8 Rates of apnoea (episodes/24 h) Show forest plot | 1 | 54 | Mean Difference (IV, Fixed, 95% CI) | ‐3.10 [‐7.92, 1.72] |
| 8.1 Ventilator‐generated NIPPV | 1 | 54 | Mean Difference (IV, Fixed, 95% CI) | ‐3.10 [‐7.92, 1.72] |
| 8.2 Bilevel NIPPV | 0 | 0 | Mean Difference (IV, Fixed, 95% CI) | 0.0 [0.0, 0.0] |
| 8.3 Mixed NIPPV devices | 0 | 0 | Mean Difference (IV, Fixed, 95% CI) | 0.0 [0.0, 0.0] |
| 9 Duration of hospitalisation (days) Show forest plot | 4 | 244 | Mean Difference (IV, Fixed, 95% CI) | 2.72 [‐0.01, 5.44] |
| 9.1 Ventilator‐generated NIPPV | 4 | 244 | Mean Difference (IV, Fixed, 95% CI) | 2.72 [‐0.01, 5.44] |
| 9.2 Bilevel NIPPV | 0 | 0 | Mean Difference (IV, Fixed, 95% CI) | 0.0 [0.0, 0.0] |
| 9.3 Mixed NIPPV devices | 0 | 0 | Mean Difference (IV, Fixed, 95% CI) | 0.0 [0.0, 0.0] |
| 10 Death before discharge Show forest plot | 6 | 1237 | Risk Ratio (M‐H, Fixed, 95% CI) | 0.69 [0.48, 0.99] |
| 10.1 Ventilator‐generated NIPPV | 4 | 241 | Risk Ratio (M‐H, Fixed, 95% CI) | 0.38 [0.18, 0.81] |
| 10.2 Bilevel NIPPV | 1 | 136 | Risk Ratio (M‐H, Fixed, 95% CI) | 0.62 [0.15, 2.48] |
| 10.3 Mixed NIPPV devices | 1 | 860 | Risk Ratio (M‐H, Fixed, 95% CI) | 0.85 [0.55, 1.31] |