食物增稠剂治疗6个月龄及以下胃食管反流婴儿
Appendices
Appendix 1. Standard search methodology
Review specific terms: ("Gastroesophageal Reflux"[Mesh] OR Gastroesophageal Reflux OR gastro‐oesophageal reflux) AND (thick* OR diet OR antiregurg* OR conserv* OR non‐pharmaco* OR nonpharmaco*)
AND
Database specific terms:
PubMed: ((infant, newborn[MeSH] OR newborn OR neonate OR neonatal OR premature OR low birth weight OR VLBW OR LBW or infan* or neonat*) AND (randomized controlled trial [pt] OR controlled clinical trial [pt] OR Clinical Trial[ptyp] OR randomized [tiab] OR placebo [tiab] OR clinical trials as topic [mesh: noexp] OR randomly [tiab] OR trial [ti]) NOT (animals [mh] NOT humans [mh]))
Embase: (infant, newborn or newborn or neonate or neonatal or premature or very low birth weight or low birth weight or VLBW or LBW or Newborn or infan* or neonat*) AND (human not animal) AND (randomized controlled trial or controlled clinical trial or randomized or placebo or clinical trials as topic or randomly or trial or clinical trial)
CINAHL: (infant, newborn OR newborn OR neonate OR neonatal OR premature OR low birth weight OR VLBW OR LBW or Newborn or infan* or neonat*) AND (randomized controlled trial OR controlled clinical trial OR randomized OR placebo OR clinical trials as topic OR randomly OR trial OR PT clinical trial)
Cochrane Library: (infant or newborn or neonate or neonatal or premature or very low birth weight or low birth weight or VLBW or LBW)
Appendix 2. 'Risk of bias' tool
We used the standard methods of Cochrane and Cochrane Neonatal to assess the methodological quality (to meet the validity criteria) of the trials. For each trial, we sought information regarding the method of randomisation and the blinding and reporting of all outcomes of all infants enrolled in the trial. We assessed each criterion as low, high, or unclear risk. Two review authors independently assessed each study. Any disagreements were resolved by discussion. We added this information to the Characteristics of included studies table. We evaluated the following issues and entered the findings into the 'Risk of bias' table.
1. Sequence generation (checking for possible selection bias). Was the allocation sequence adequately generated?
For each included study, we categorised the method used to generate the allocation sequence as:
a. low risk (any truly random process, e.g. random number table, computer random number generator);
b. high risk (any non‐random process, e.g. odd or even date of birth, hospital or clinic record number);
c. unclear risk.
2. Allocation concealment (checking for possible selection bias). Was allocation adequately concealed?
For each included study, we categorised the method used to conceal the allocation sequence as:
a. low risk (e.g. telephone or central randomisation; consecutively numbered, sealed, opaque envelopes);
b. high risk (open random allocation; unsealed or non‐opaque envelopes, alternation; date of birth);
c. unclear risk.
3. Blinding of participants and personnel (checking for possible performance bias). Was knowledge of the allocated intervention adequately prevented during the study?
For each included study, we categorised the methods used to blind study participants and personnel from knowledge of which intervention a participant received. Blinding was assessed separately for different outcomes or class of outcomes. We categorised the methods as:
a. low risk, high risk, or unclear risk for participants;
b. low risk, high risk, or unclear risk for personnel.
4. Blinding of outcome assessment (checking for possible detection bias). Was knowledge of the allocated intervention adequately prevented at the time of outcome assessment?
For each included study, we categorised the methods used to blind outcome assessment. Blinding was assessed separately for different outcomes or class of outcomes. We categorised the methods as:
a. low risk for outcome assessors;
b. high risk for outcome assessors;
c. unclear risk for outcome assessors.
5. Incomplete outcome data (checking for possible attrition bias through withdrawals, dropouts, protocol deviations). Were incomplete outcome data adequately addressed?
For each included study and for each outcome, we described the completeness of the data, including attrition and exclusions from the analysis. We noted whether attrition and exclusions were reported, the numbers included in the analysis at each stage (compared with the total randomised participants), reasons for attrition or exclusion where reported, and whether missing data were balanced across groups or were related to outcomes. Where sufficient information was reported or supplied by the trial authors, we re‐included missing data in the analyses. We categorised the methods as:
a. low risk (< 20% missing data);
b. high risk (≥ 20% missing data);
c. unclear risk.
6. Selective reporting bias. Are reports of the study free of the suggestion of selective outcome reporting?
For each included study, we described how we investigated the possibility of selective outcome reporting bias and what we found. We assessed the methods as:
a. low risk (where it is clear that all of the study's prespecified outcomes and all expected outcomes of interest to the review have been reported);
b. high risk (where not all of the study's prespecified outcomes have been reported; one or more reported primary outcomes were not prespecified outcomes of interest and are reported incompletely and so cannot be used; study fails to include results of a key outcome that would have been expected to have been reported);
c. unclear risk.
7. Other sources of bias. Did the study appear to be free of other problems that could put it at high risk of bias?
For each included study, we described any important concerns we had about other possible sources of bias (e.g. whether there was a potential source of bias related to the specific study design or whether the trial was stopped early due to some data‐dependent process). We assessed whether each study was free of other problems that could put it at risk of bias as:
a. low risk;
b. high risk;
c. unclear risk.
If needed, we explored the impact of the level of bias by undertaking sensitivity analyses.
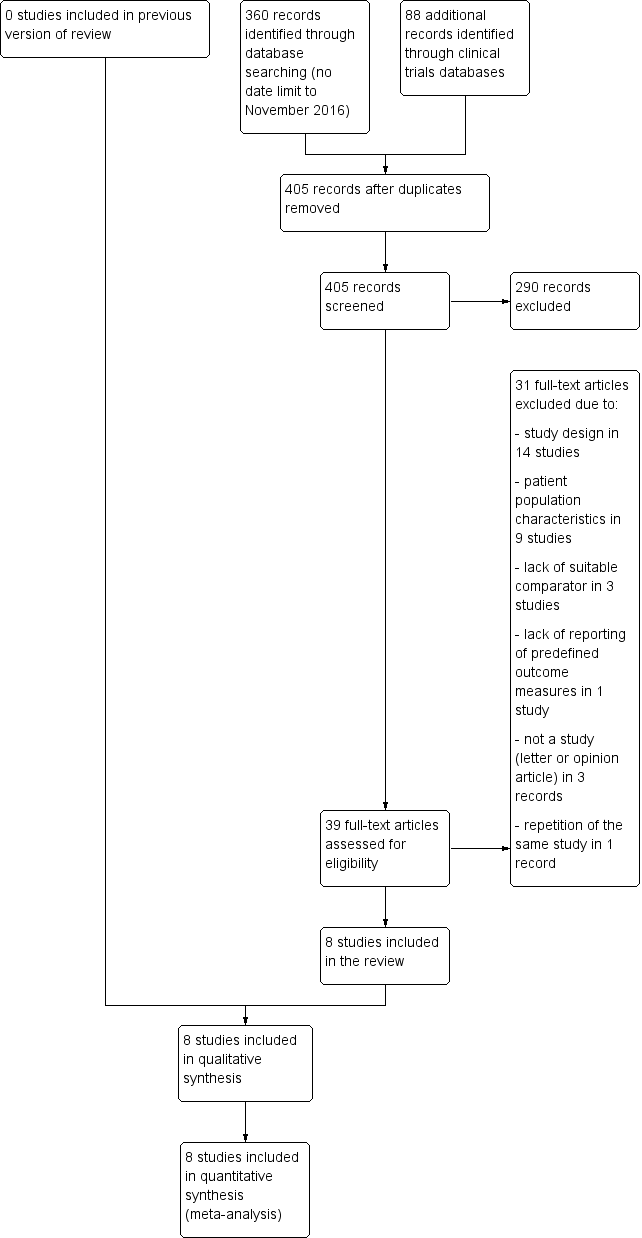
Study flow diagram.
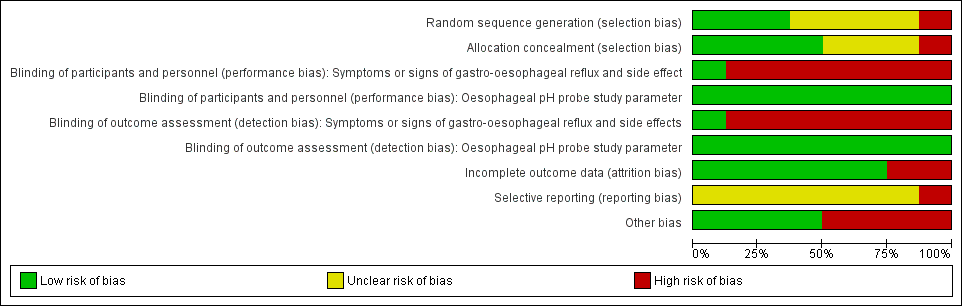
Risk of bias graph: review authors' judgements about each risk of bias item presented as percentages across all included studies.

Forest plot of comparison: 1 Regurgitation, posseting, or vomiting, outcome: 1.1 Number of episodes per day.
Assumptions
1. There was insufficient information in Chao 2007 to report the change of baseline value, hence we used the endpoint data instead. Change from baseline value was used for the remaining five studies, where P value was used to determine the standard deviation for the change from baseline value.
2. Frequency of regurgitation rather than vomiting was used for the Xinias 2005 study.
3. In Miller 1999, median number of episodes of regurgitation was reported rather than the mean value. As the sample size was more than 25, it was assumed that median and mean were similar (Hozo 2005), and the standard deviation for the mean difference was obtained using the reported P value (Higgins 2011).
4. We halved control groups for Hegar 2008 and Moya 1999, as these were three‐arm trials involving one control and two intervention arms.
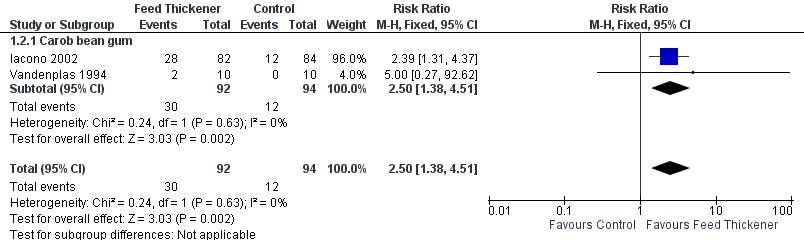
Forest plot of comparison: 1 Regurgitation, posseting, or vomiting, outcome: 1.2 Proportion of asymptomatic infants.

Forest plot of comparison: 2 Oesophageal pH probe study parameters, outcome: 2.1 Reflux index (percentage of time pH < 4).
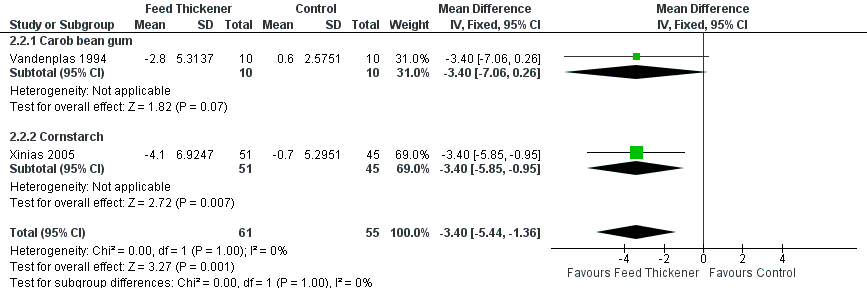
Forest plot of comparison: 2 Oesophageal pH probe study parameters, outcome: 2.2 Number of reflux episodes lasting > 5 minutes.
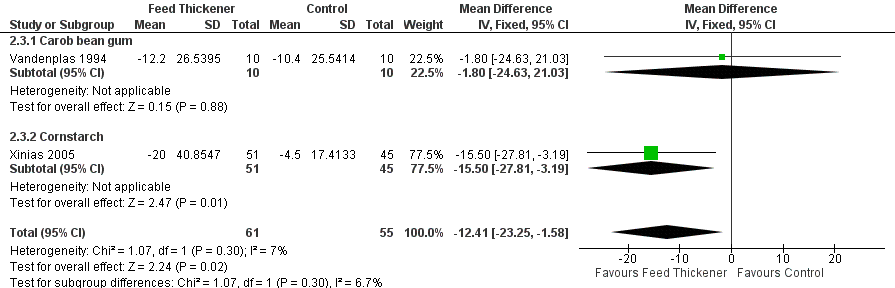
Forest plot of comparison: 2 Oesophageal pH probe study parameters, outcome: 2.3 Duration of longest reflux episode (minutes).
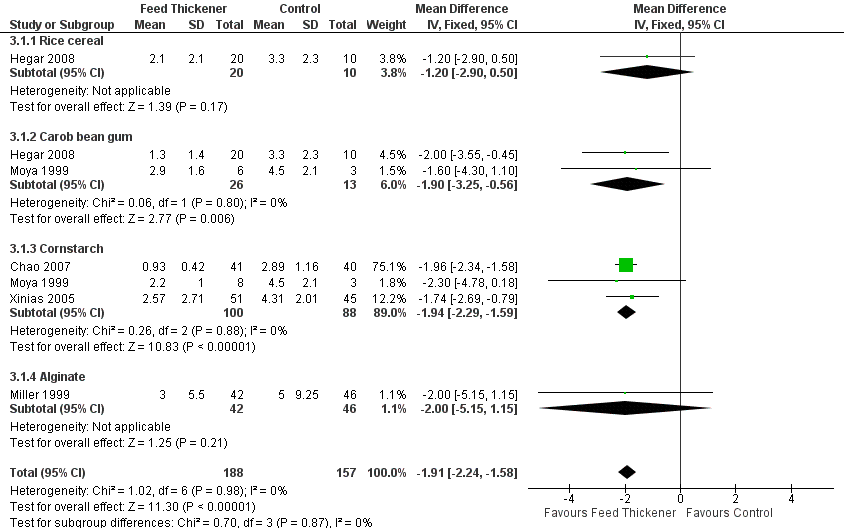
Forest plot of comparison: 3 Sensitivity analysis, outcome: 3.1 Endpoint value ‐ number of episodes of regurgitation, posseting, or vomiting per day.

Comparison 1 Regurgitation, posseting, or vomiting, Outcome 1 Number of episodes per day.

Comparison 1 Regurgitation, posseting, or vomiting, Outcome 2 Proportion of asymptomatic infants.

Comparison 2 Oesophageal pH probe study parameters, Outcome 1 Reflux Index (percentage of time pH < 4).

Comparison 2 Oesophageal pH probe study parameters, Outcome 2 Number of reflux episodes lasting > 5 minutes.
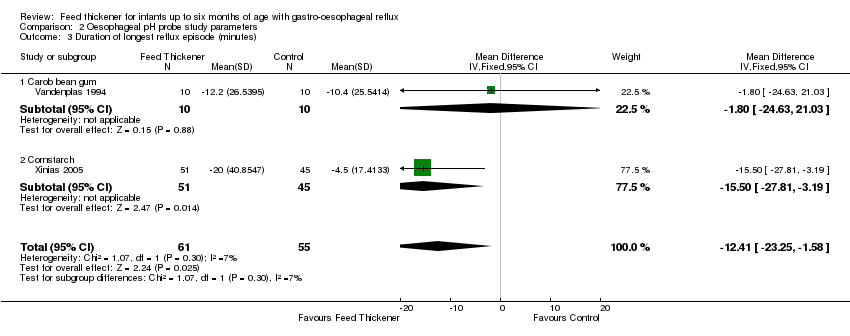
Comparison 2 Oesophageal pH probe study parameters, Outcome 3 Duration of longest reflux episode (minutes).

Comparison 3 Sensitivity analysis, Outcome 1 Endpoint value ‐ number of episodes of regurgitation, posseting, or vomiting per day.
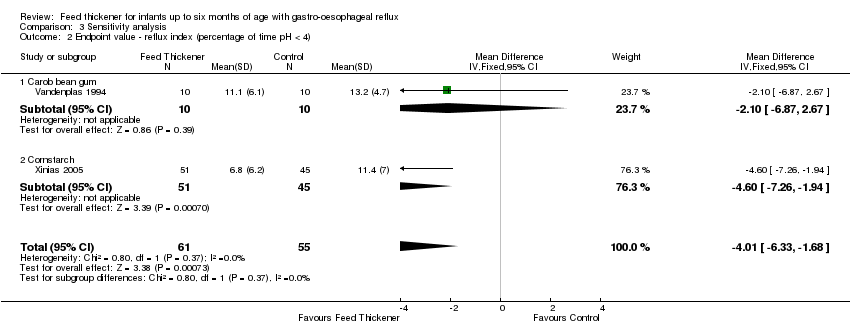
Comparison 3 Sensitivity analysis, Outcome 2 Endpoint value ‐ reflux index (percentage of time pH < 4).
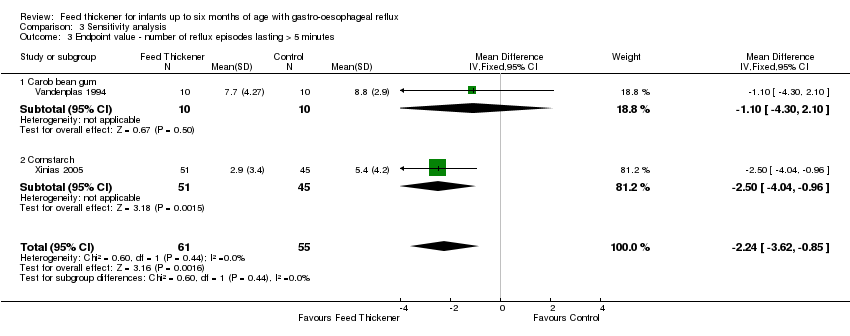
Comparison 3 Sensitivity analysis, Outcome 3 Endpoint value ‐ number of reflux episodes lasting > 5 minutes.
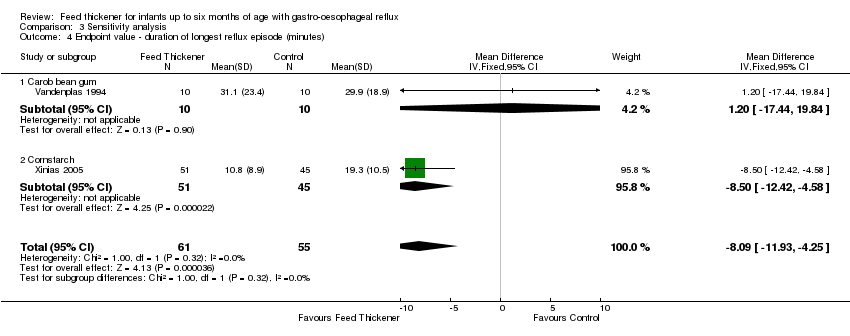
Comparison 3 Sensitivity analysis, Outcome 4 Endpoint value ‐ duration of longest reflux episode (minutes).
| Feed thickener compared to control for infants up to 6 months of age with gastro‐oesophageal reflux | ||||||
| Patient or population: Formula‐fed healthy term infants up to 6 months of age with gastro‐oesophageal reflux | ||||||
| Outcomes | Anticipated absolute effects* (95% CI) | Relative effect | № of participants | Quality of the evidence | Comments | |
| Risk with control | Risk with feed thickener | |||||
| Number of episodes of regurgitation or vomiting per day | The mean number of episodes of regurgitation or vomiting per day was 3 episodes per day. | MD 1.97 episodes per day lower | ‐ | 442 | ⊕⊕⊕⊝ | Change from baseline value was used for 5 studies. Endpoint value was used for the remaining study due to insufficient data (Chao 2007). Frequency of regurgitation value was used in preference to frequency of vomiting in 1 study (Xinias 2005). |
| Proportion of infants without regurgitation or vomiting at the end of intervention period (asymptomatic infants) | Study population | RR 2.50 | 186 | ⊕⊕⊝⊝ | ||
| 128 per 1000 | 319 per 1000 | |||||
| Reflux index (percentage of time pH < 4) assessed with oesophageal pH probe study | The mean reflux index was 12%. | MD 5.08% lower | ‐ | 116 | ⊕⊕⊝⊝ | Higher reflux index indicates higher percentage of total time that oesophageal pH is less than 4. |
| Number of reflux episodes lasting > 5 minutes assessed with oesophageal pH probe study | The mean number of reflux episodes lasting > 5 minutes was 6 episodes. | MD 3.4 episodes lower | ‐ | 116 | ⊕⊕⊝⊝ | |
| Duration of longest reflux episode | The mean duration of longest reflux episode was 20 minutes. | MD 12.41 minutes lower | ‐ | 116 | ⊕⊕⊝⊝ | |
| Diarrhoea | ‐ | ‐ | 511 | ⊕⊕⊝⊝ | Insufficient data to perform analysis. No difference in diarrhoea incidence or stooling frequency in 4 studies. 17% of infants in the intervention group in Iacono 2002 and 10% of total infants in Hegar 2008 withdrew due to diarrhoea. | |
| *The risk in the intervention group (and its 95% CI) is based on the assumed risk in the comparison group and the relative effect of the intervention (and its 95% CI). | ||||||
| GRADE Working Group grades of evidence | ||||||
| 1Downgraded one level for serious study limitation. There was unclear risk of bias for allocation concealment and high risk of bias for blinding, as frequency of regurgitation was dependent on parental report, who were likely to note the higher viscosity of the thickened formula. | ||||||
| Outcome or subgroup title | No. of studies | No. of participants | Statistical method | Effect size |
| 1 Number of episodes per day Show forest plot | 6 | 442 | Mean Difference (IV, Fixed, 95% CI) | ‐1.97 [‐2.32, ‐1.61] |
| 1.1 Rice cereal | 2 | 127 | Mean Difference (IV, Fixed, 95% CI) | ‐1.43 [‐3.36, 0.49] |
| 1.2 Carob bean gum | 2 | 39 | Mean Difference (IV, Fixed, 95% CI) | ‐1.47 [‐3.13, 0.19] |
| 1.3 Cornstarch | 3 | 188 | Mean Difference (IV, Fixed, 95% CI) | ‐1.98 [‐2.35, ‐1.61] |
| 1.4 Alginate | 1 | 88 | Mean Difference (IV, Fixed, 95% CI) | ‐3.5 [‐6.07, ‐0.93] |
| 2 Proportion of asymptomatic infants Show forest plot | 2 | 186 | Risk Ratio (M‐H, Fixed, 95% CI) | 2.50 [1.38, 4.51] |
| 2.1 Carob bean gum | 2 | 186 | Risk Ratio (M‐H, Fixed, 95% CI) | 2.50 [1.38, 4.51] |
| Outcome or subgroup title | No. of studies | No. of participants | Statistical method | Effect size |
| 1 Reflux Index (percentage of time pH < 4) Show forest plot | 2 | 116 | Mean Difference (IV, Fixed, 95% CI) | ‐5.08 [‐8.89, ‐1.28] |
| 1.1 Carob bean gum | 1 | 20 | Mean Difference (IV, Fixed, 95% CI) | ‐3.90 [‐9.36, 1.56] |
| 1.2 Cornstarch | 1 | 96 | Mean Difference (IV, Fixed, 95% CI) | ‐6.20 [‐11.50, ‐0.90] |
| 2 Number of reflux episodes lasting > 5 minutes Show forest plot | 2 | 116 | Mean Difference (IV, Fixed, 95% CI) | ‐3.40 [‐5.44, ‐1.36] |
| 2.1 Carob bean gum | 1 | 20 | Mean Difference (IV, Fixed, 95% CI) | ‐3.4 [‐7.06, 0.26] |
| 2.2 Cornstarch | 1 | 96 | Mean Difference (IV, Fixed, 95% CI) | ‐3.40 [‐5.85, ‐0.95] |
| 3 Duration of longest reflux episode (minutes) Show forest plot | 2 | 116 | Mean Difference (IV, Fixed, 95% CI) | ‐12.41 [‐23.25, ‐1.58] |
| 3.1 Carob bean gum | 1 | 20 | Mean Difference (IV, Fixed, 95% CI) | ‐1.80 [‐24.63, 21.03] |
| 3.2 Cornstarch | 1 | 96 | Mean Difference (IV, Fixed, 95% CI) | ‐15.5 [‐27.81, ‐3.19] |
| Outcome or subgroup title | No. of studies | No. of participants | Statistical method | Effect size |
| 1 Endpoint value ‐ number of episodes of regurgitation, posseting, or vomiting per day Show forest plot | 5 | 345 | Mean Difference (IV, Fixed, 95% CI) | ‐1.91 [‐2.24, ‐1.58] |
| 1.1 Rice cereal | 1 | 30 | Mean Difference (IV, Fixed, 95% CI) | ‐1.20 [‐2.90, 0.50] |
| 1.2 Carob bean gum | 2 | 39 | Mean Difference (IV, Fixed, 95% CI) | ‐1.90 [‐3.25, ‐0.56] |
| 1.3 Cornstarch | 3 | 188 | Mean Difference (IV, Fixed, 95% CI) | ‐1.94 [‐2.29, ‐1.59] |
| 1.4 Alginate | 1 | 88 | Mean Difference (IV, Fixed, 95% CI) | ‐2.0 [‐5.15, 1.15] |
| 2 Endpoint value ‐ reflux index (percentage of time pH < 4) Show forest plot | 2 | 116 | Mean Difference (IV, Fixed, 95% CI) | ‐4.01 [‐6.33, ‐1.68] |
| 2.1 Carob bean gum | 1 | 20 | Mean Difference (IV, Fixed, 95% CI) | ‐2.10 [‐6.87, 2.67] |
| 2.2 Cornstarch | 1 | 96 | Mean Difference (IV, Fixed, 95% CI) | ‐4.60 [‐7.26, ‐1.94] |
| 3 Endpoint value ‐ number of reflux episodes lasting > 5 minutes Show forest plot | 2 | 116 | Mean Difference (IV, Fixed, 95% CI) | ‐2.24 [‐3.62, ‐0.85] |
| 3.1 Carob bean gum | 1 | 20 | Mean Difference (IV, Fixed, 95% CI) | ‐1.10 [‐4.30, 2.10] |
| 3.2 Cornstarch | 1 | 96 | Mean Difference (IV, Fixed, 95% CI) | ‐2.50 [‐4.04, ‐0.96] |
| 4 Endpoint value ‐ duration of longest reflux episode (minutes) Show forest plot | 2 | 116 | Mean Difference (IV, Fixed, 95% CI) | ‐8.09 [‐11.93, ‐4.25] |
| 4.1 Carob bean gum | 1 | 20 | Mean Difference (IV, Fixed, 95% CI) | 1.20 [‐17.44, 19.84] |
| 4.2 Cornstarch | 1 | 96 | Mean Difference (IV, Fixed, 95% CI) | ‐8.5 [‐12.42, ‐4.58] |