| 1 Numbers not cured at follow up after treatment (objective) Show forest plot | 1 | | Risk Ratio (M‐H, Fixed, 95% CI) | Totals not selected |
|
| 1.1 Anticholinergic and behavioural modification therapy vs. Anticholinergic | 1 | | Risk Ratio (M‐H, Fixed, 95% CI) | 0.0 [0.0, 0.0] |
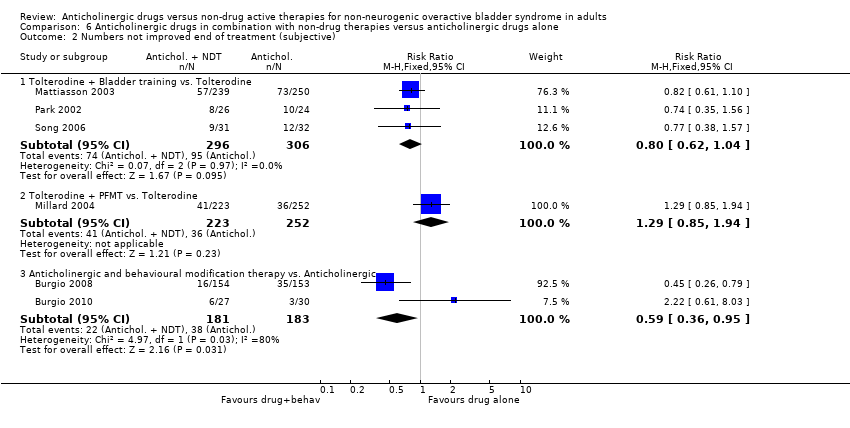
| 2 Numbers not improved end of treatment (subjective) Show forest plot | 6 | | Risk Ratio (M‐H, Fixed, 95% CI) | Subtotals only |
|
| 2.1 Tolterodine + Bladder training vs. Tolterodine | 3 | 602 | Risk Ratio (M‐H, Fixed, 95% CI) | 0.80 [0.62, 1.04] |
| 2.2 Tolterodine + PFMT vs. Tolterodine | 1 | 475 | Risk Ratio (M‐H, Fixed, 95% CI) | 1.29 [0.85, 1.94] |
| 2.3 Anticholinergic and behavioural modification therapy vs. Anticholinergic | 2 | 364 | Risk Ratio (M‐H, Fixed, 95% CI) | 0.59 [0.36, 0.95] |
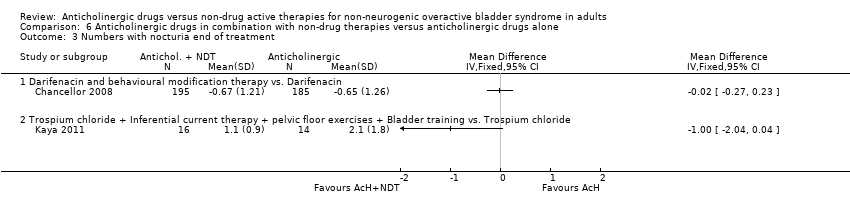
| 3 Numbers with nocturia end of treatment Show forest plot | 2 | | Mean Difference (IV, Fixed, 95% CI) | Totals not selected |
|
| 3.1 Darifenacin and behavioural modification therapy vs. Darifenacin | 1 | | Mean Difference (IV, Fixed, 95% CI) | 0.0 [0.0, 0.0] |
| 3.2 Trospium chloride + Inferential current therapy + pelvic floor exercises + Bladder training vs. Trospium chloride | 1 | | Mean Difference (IV, Fixed, 95% CI) | 0.0 [0.0, 0.0] |
| 4 Number of micturitions per 24 hours Show forest plot | 6 | | Mean Difference (IV, Random, 95% CI) | Subtotals only |
|
| 4.1 Solifenacin + Bladder training vs. Solifenacin | 1 | 602 | Mean Difference (IV, Random, 95% CI) | ‐0.69 [‐1.11, ‐0.27] |
| 4.2 Tolterodine + PFMT vs. Tolterodine | 1 | 475 | Mean Difference (IV, Random, 95% CI) | 0.05 [‐0.87, 0.97] |
| 4.3 Anticholinergic and behavioural modification therapy vs. Anticholinergic | 3 | 705 | Mean Difference (IV, Random, 95% CI) | ‐0.24 [‐0.98, 0.50] |
| 4.4 Anticholinergic and Inferential current therapy + pelvic floor exercises + Bladder training vs.Anticholinergic . | 1 | 30 | Mean Difference (IV, Random, 95% CI) | ‐2.0 [‐3.88, ‐0.12] |
| 5 Frequency of sensation of urgency Show forest plot | 3 | | Mean Difference (IV, Fixed, 95% CI) | Totals not selected |
|
| 5.1 Anticholinergic + Bladder training vs. Anticholinergic | 1 | | Mean Difference (IV, Fixed, 95% CI) | 0.0 [0.0, 0.0] |
| 5.2 Tolterodine 4mg + PFMT vs tolterodine alone | 1 | | Mean Difference (IV, Fixed, 95% CI) | 0.0 [0.0, 0.0] |
| 5.3 Anticholinergic and behavioural modification therapy vs. Anticholinergic | 1 | | Mean Difference (IV, Fixed, 95% CI) | 0.0 [0.0, 0.0] |
| 6 Number of pad changes per day Show forest plot | 2 | | Mean Difference (IV, Fixed, 95% CI) | Totals not selected |
|
| 6.1 Anticholinergic + Bladder training vs. Anticholinergic | 1 | | Mean Difference (IV, Fixed, 95% CI) | 0.0 [0.0, 0.0] |
| 6.2 Anticholinergic and behavioural modification therapy vs. Anticholinergic | 1 | | Mean Difference (IV, Fixed, 95% CI) | 0.0 [0.0, 0.0] |
| 7 Number of incontinence episodes per 24 hours Show forest plot | 5 | | Mean Difference (IV, Fixed, 95% CI) | Subtotals only |
|
| 7.1 Anticholinergic + Bladder training vs. Anticholinergic | 1 | 602 | Mean Difference (IV, Fixed, 95% CI) | ‐0.15 [‐0.42, 0.12] |
| 7.2 Anticholinergic + PFMT vs. Anticholinergic | 1 | 475 | Mean Difference (IV, Fixed, 95% CI) | 0.30 [‐0.12, 0.72] |
| 7.3 Anticholinergic vs.Anticholinergic and Behavioural modification therapy | 2 | 438 | Mean Difference (IV, Fixed, 95% CI) | ‐0.06 [‐0.47, 0.35] |
| 7.4 Anticholinergic and Inferential current therapy + pelvic floor exercises + Bladder training vs.Anticholinergic . | 1 | 30 | Mean Difference (IV, Fixed, 95% CI) | ‐1.0 [‐2.12, 0.12] |
| 8 Numbers experiencing adverse events Show forest plot | 4 | | Risk Ratio (M‐H, Fixed, 95% CI) | Subtotals only |
|
| 8.1 Anticholinergic + Bladder training vs. Anticholinergic | 4 | 1257 | Risk Ratio (M‐H, Fixed, 95% CI) | 0.97 [0.88, 1.07] |
| 9 Numbers withdrawing from treatment Show forest plot | 3 | | Risk Ratio (M‐H, Random, 95% CI) | Subtotals only |
|
| 9.1 Anticholinergic + Bladder training vs. Anticholinergic | 2 | 706 | Risk Ratio (M‐H, Random, 95% CI) | 0.82 [0.44, 1.53] |
| 9.2 Anticholinergic and behavioural modification therapy vs. Anticholinergic | 1 | 395 | Risk Ratio (M‐H, Random, 95% CI) | 1.64 [0.93, 2.87] |
| 10 Numbers changing dose of treatment Show forest plot | 1 | | Risk Ratio (M‐H, Fixed, 95% CI) | Totals not selected |
|
| 10.1 Anticholinergic + Bladder training vs. Anticholinergic | 1 | | Risk Ratio (M‐H, Fixed, 95% CI) | 0.0 [0.0, 0.0] |
| 11 Number of incontinence episodes per day Show forest plot | | | Other data | No numeric data |
|
| 11.1 Percentage change from baseline | | | Other data | No numeric data |
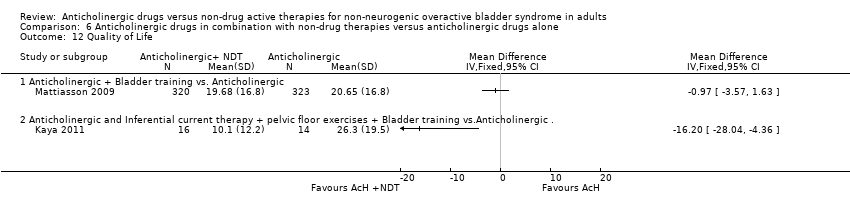
| 12 Quality of Life Show forest plot | 2 | | Mean Difference (IV, Fixed, 95% CI) | Totals not selected |
|
| 12.1 Anticholinergic + Bladder training vs. Anticholinergic | 1 | | Mean Difference (IV, Fixed, 95% CI) | 0.0 [0.0, 0.0] |
| 12.2 Anticholinergic and Inferential current therapy + pelvic floor exercises + Bladder training vs.Anticholinergic . | 1 | | Mean Difference (IV, Fixed, 95% CI) | 0.0 [0.0, 0.0] |