Bifosfonatos para el mieloma múltiple: un metanálisis en red actualizado
Información
- DOI:
- https://doi.org/10.1002/14651858.CD003188.pub4Copiar DOI

- Base de datos:
-
- Cochrane Database of Systematic Reviews
- Versión publicada:
-
- 18 diciembre 2017see what's new
- Tipo:
-
- Intervention
- Etapa:
-
- Review
- Grupo Editorial Cochrane:
-
Grupo Cochrane de Hematología
- Copyright:
-
- Copyright © 2017 The Cochrane Collaboration. Published by John Wiley & Sons, Ltd.
Cifras del artículo
Altmetric:
Citado por:
Autores
Contributions of authors
For this update:
RM handsearched journals and references, extracted and analyzed data, wrote the initial and final drafts and participated in all phases of the project.
BD oversaw and co‐ordinated the group activity, maintained contact with Cochrane, provided vital content and methodological inputs, and edited the review.
AK extracted data, contacted a researcher regarding unpublished data, and maintained contact with Cochrane.
BM conducted the indirect comparisons using Bayesian methods.
BD, RM and AK discussed methodological problems.
All co‐authors interpreted data, provided constructive critiques and agreed on the final version of the paper.
Sources of support
Internal sources
-
Center for Evidence‐based Medicine,The University of South Florida, USA.
-
Department of Internal Medicine, University of Bonn, Germany.
External sources
-
Leukämie‐Initiative Bonn e.v., Germany.
-
Cochrane Haematological Malignancies Group (CHMG), Germany.
Declarations of interest
RM: None known.
AK: None known.
BM: None known.
BD: None known.
Acknowledgements
We want to thank Dr Terpos and Dr McCloskey for verification of extracted data from their papers, as well as Dr Ruiz‐Erenchun, Hoffmann‐La Roche Ltd, Basel, Switzerland, who provided additional data from the ibandronate trial. Dr Poglód provided additional information on the trials of his group. We also want to thank the Cochrane peer‐reviewers and editors for critical reading of our review and helpful feedback. We thank Dr Thomas A. Trikalinos for his suggestions regarding meta‐regression. We also thank the Cochrane Hematological Malignancies Group for their assistance in identifying the RCT by Garcia‐Sanz and colleagues.
Version history
| Published | Title | Stage | Authors | Version |
| 2017 Dec 18 | Bisphosphonates in multiple myeloma: an updated network meta‐analysis | Review | Rahul Mhaskar, Ambuj Kumar, Branko Miladinovic, Benjamin Djulbegovic | |
| 2012 May 16 | Bisphosphonates in multiple myeloma: a network meta‐analysis | Review | Rahul Mhaskar, Jasmina Redzepovic, Keith Wheatley, Otavio Augusto Camara Clark, Branko Miladinovic, Axel Glasmacher, Ambuj Kumar, Benjamin Djulbegovic | |
| 2010 Mar 17 | Bisphosphonates in multiple myeloma | Review | Rahul Mhaskar, Jasmina Redzepovic, Keith Wheatley, Otavio Augusto Camara Clark, Branko Miladinovic, Axel Glasmacher, Ambuj Kumar, Benjamin Djulbegovic | |
| 2002 Oct 21 | Bisphosphonates in multiple myeloma | Review | Benjamin Djulbegovic, Keith Wheatley, Hamish Ross, Otavio Augusto Camara Clark, Gerard Bos, Hartmut Goldschmidt, Friedrich Cremer, Melissa Alsina, Axel Glasmacher | |
Differences between protocol and review
Compared with the last version of this systematic review, we employed only the Bayesian method for the network meta‐analysis. That is, we have not used the frequentist method for performing adjusted indirect comparisons as described by Bucher, Glenny and Caldwell and colleagues. According to the revised guidelines for network meta analysis; we used the Bayesian methods under random‐effects multiple treatment comparisons (MTC) for indirect comparisons/network meta analysis (Higgins 1996; Lu 2004). Also, as per the peer reviewer's suggestions; we conducted additional sensitivity analyses based on the route of administration (oral versus intravenous) for gastrointestinal toxicity outcome (Analysis 3.8), which was not part of the protocol.
We also identified observational studies and case reports regarding bisphosphonate‐related ONJ in the MEDLINE database
Keywords
MeSH
Medical Subject Headings (MeSH) Keywords
- Antineoplastic Agents [*therapeutic use];
- Bone Density Conservation Agents [*therapeutic use];
- Bone Diseases [*drug therapy, mortality];
- Clodronic Acid [therapeutic use];
- Diphosphonates [*therapeutic use];
- Disease‐Free Survival;
- Etidronic Acid [therapeutic use];
- Fractures, Bone [epidemiology, prevention & control];
- Imidazoles [therapeutic use];
- Multiple Myeloma [complications, *drug therapy, mortality];
- Pamidronate;
- Randomized Controlled Trials as Topic;
- Spinal Fractures [epidemiology, prevention & control];
- Zoledronic Acid;
Medical Subject Headings Check Words
Humans;
PICO
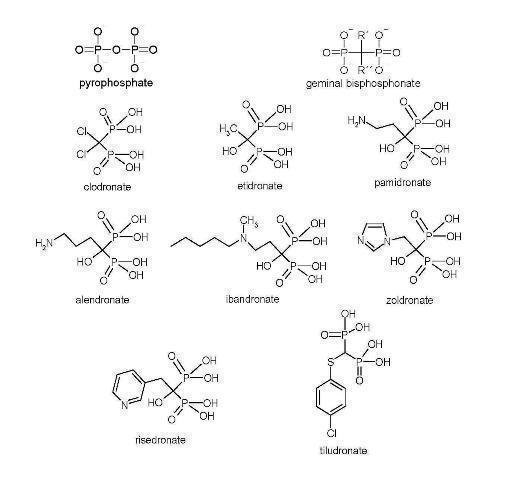
Bisphosphonate chemical structures

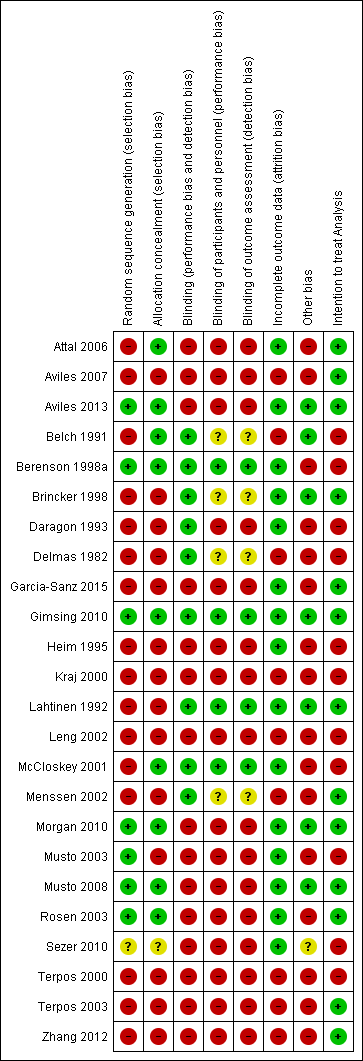
Methodological quality summary: review authors' judgements about each methodological quality item for each included study.
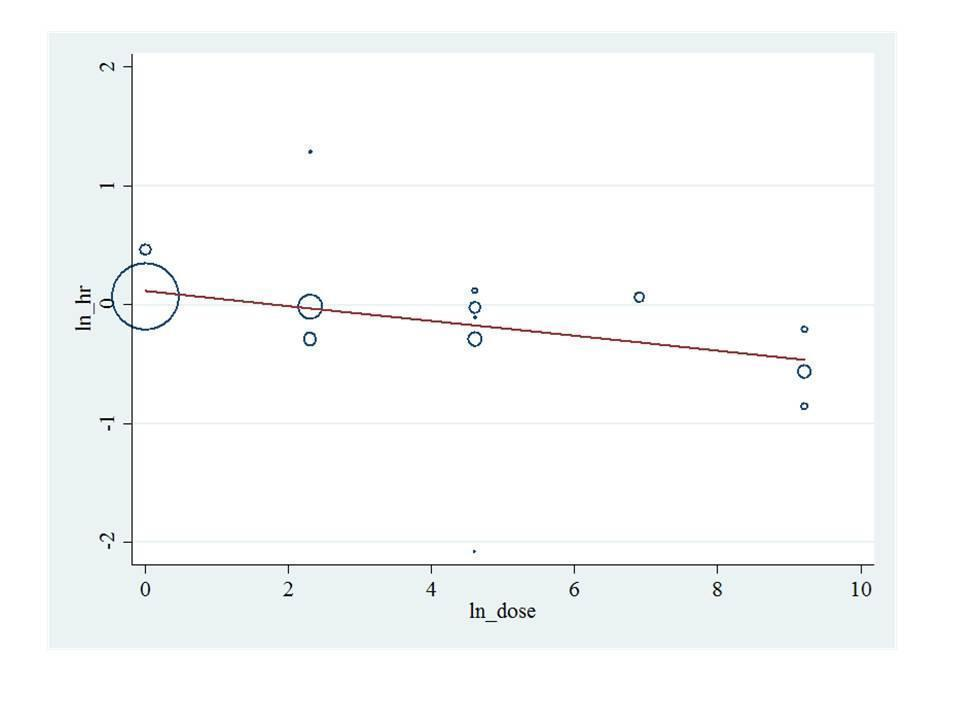
Bisphosphonate potency metaregression for overall survival. HR: Hazard ratio.
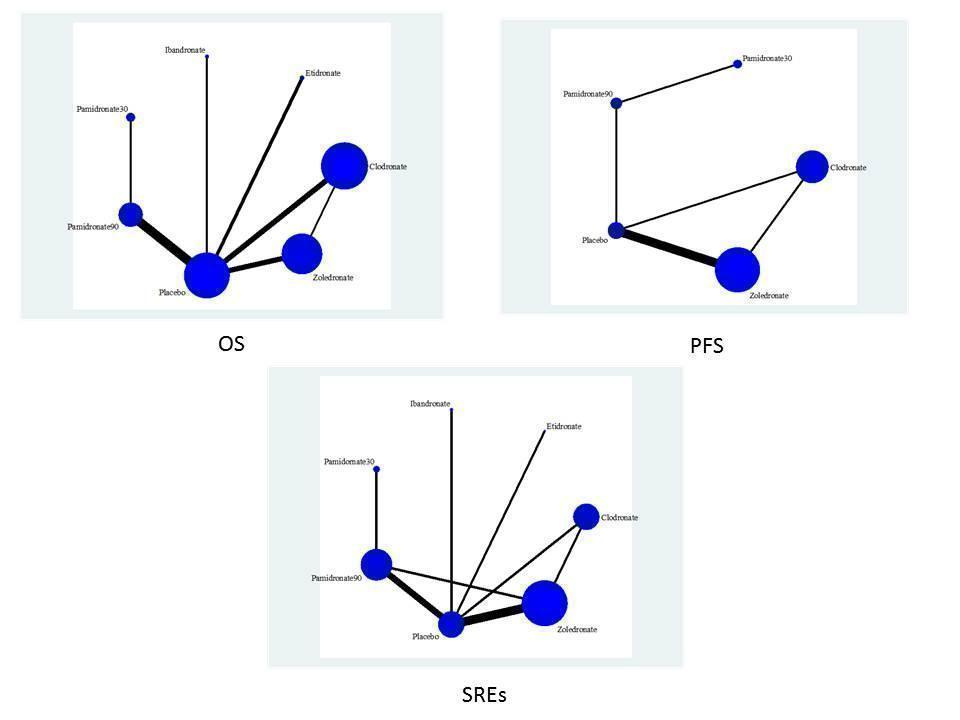
Randomized controlled trial (RCT) network for overall survival (OS), progression free survival (PFS) and skeletal related events (SREs).

A: Ranking probabilities of competing bisphosphonates. The size of each bar corresponds to the probability of each treatment to be at a specific rank. OS: Overall survival; PFS: Progression‐free survival; SRE: Skeletal‐related events; Osteonecrosis; GI: Gastrointestinal toxicity; Hyper: Hypercalcemia.
B: Surface under the cumulative ranking curve (SUCRA) plots for each treatment. The outcomes are listed on the horizontal axis. SUCRA for each outcome are on the vertical axis.

Funnel plot of comparison: 1 Bisphosphonates vs. control (efficacy), outcome: 1.6 Pain.
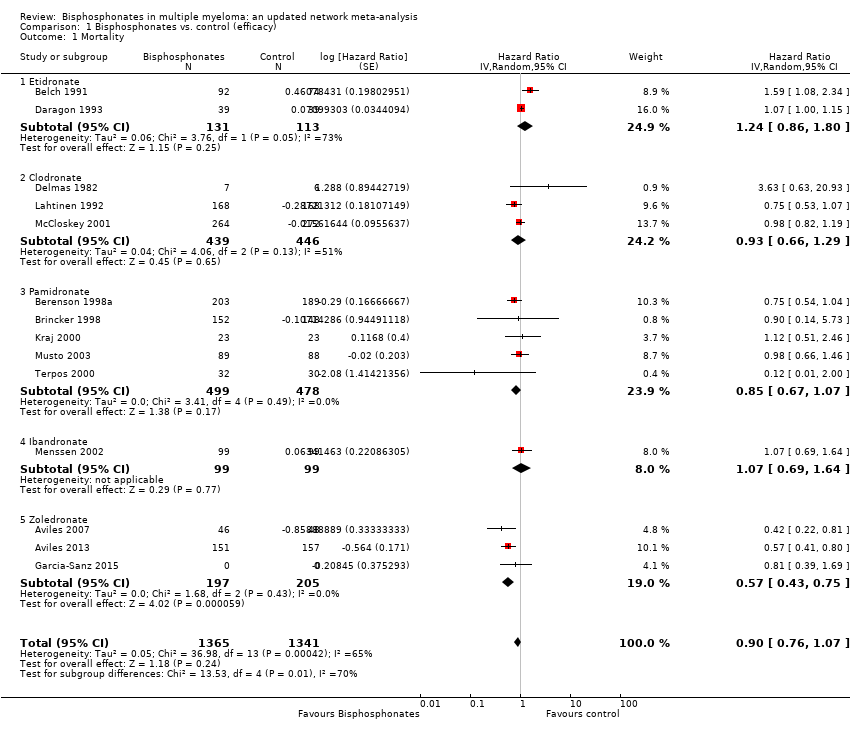
Comparison 1 Bisphosphonates vs. control (efficacy), Outcome 1 Mortality.

Comparison 1 Bisphosphonates vs. control (efficacy), Outcome 2 Progression‐free survival.
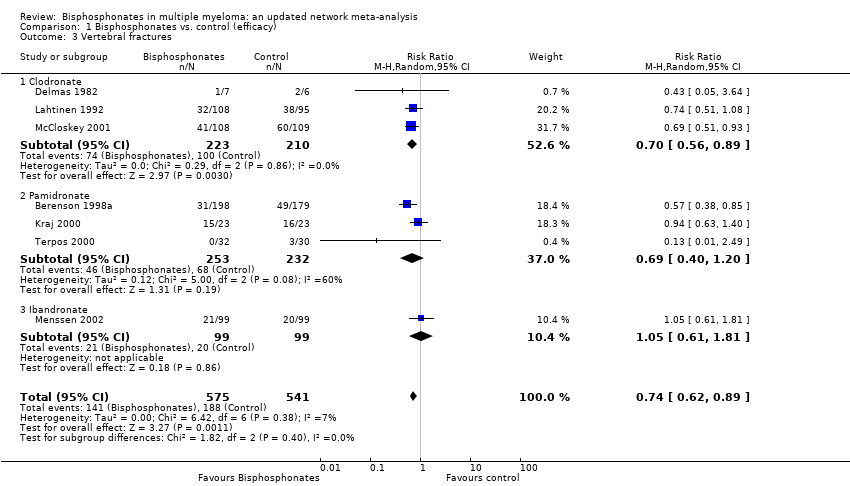
Comparison 1 Bisphosphonates vs. control (efficacy), Outcome 3 Vertebral fractures.

Comparison 1 Bisphosphonates vs. control (efficacy), Outcome 4 Non‐vertebral fractures.

Comparison 1 Bisphosphonates vs. control (efficacy), Outcome 5 Total skeletal‐related events.

Comparison 1 Bisphosphonates vs. control (efficacy), Outcome 6 Pain.
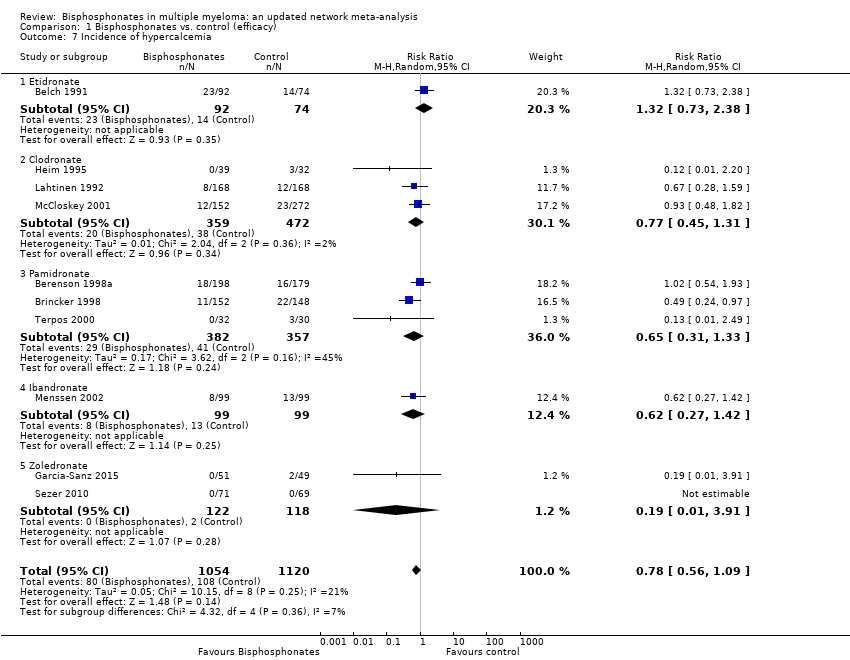
Comparison 1 Bisphosphonates vs. control (efficacy), Outcome 7 Incidence of hypercalcemia.

Comparison 2 Bisphosphonates vs. control (adverse effects), Outcome 1 Osteonecosis of jaw.

Comparison 2 Bisphosphonates vs. control (adverse effects), Outcome 2 Gastrointestinal toxicity (grade III/IV).

Comparison 2 Bisphosphonates vs. control (adverse effects), Outcome 3 Hypocalcaemia.
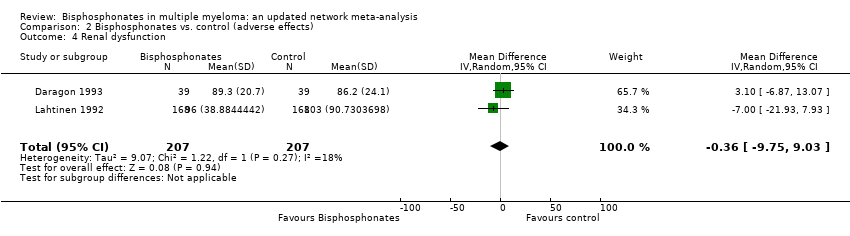
Comparison 2 Bisphosphonates vs. control (adverse effects), Outcome 4 Renal dysfunction.

Comparison 3 Sensitivity analyses (assessment of bias: analysed outcome in brackets), Outcome 1 Allocation concealment (vertebral fractures).

Comparison 3 Sensitivity analyses (assessment of bias: analysed outcome in brackets), Outcome 2 Blinding (vertebral fractures).
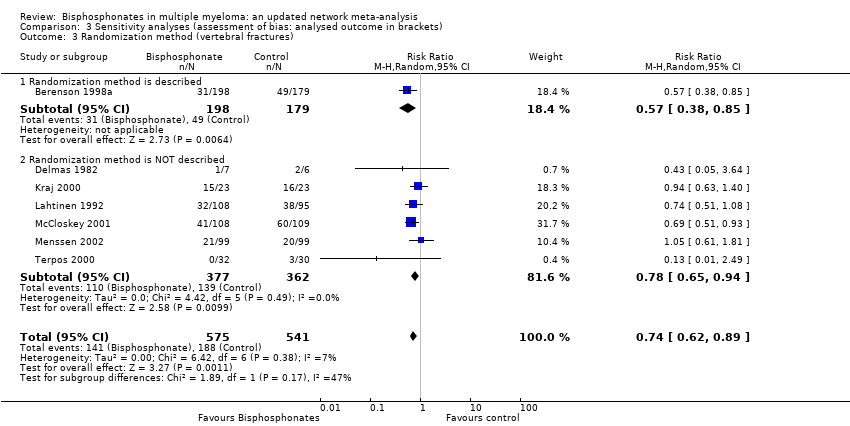
Comparison 3 Sensitivity analyses (assessment of bias: analysed outcome in brackets), Outcome 3 Randomization method (vertebral fractures).

Comparison 3 Sensitivity analyses (assessment of bias: analysed outcome in brackets), Outcome 4 Type of data analysis (vertebral fractures).

Comparison 3 Sensitivity analyses (assessment of bias: analysed outcome in brackets), Outcome 5 Description of withdrawals and drop outs (vertebral fractures).

Comparison 3 Sensitivity analyses (assessment of bias: analysed outcome in brackets), Outcome 6 Alpha error (vertebral fractures).
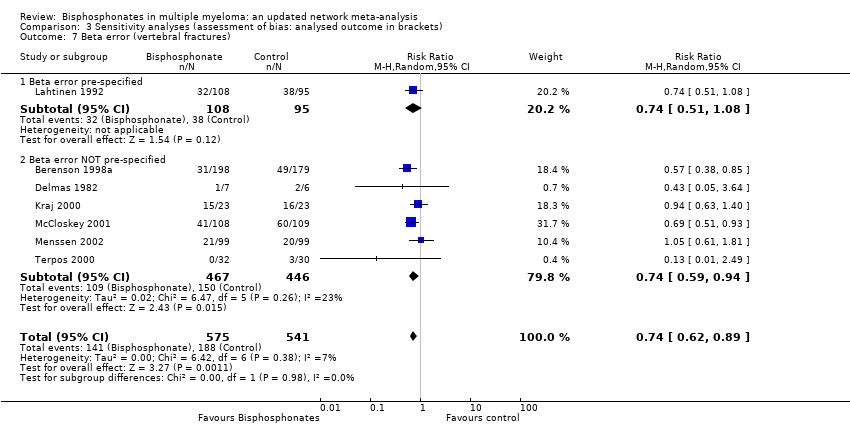
Comparison 3 Sensitivity analyses (assessment of bias: analysed outcome in brackets), Outcome 7 Beta error (vertebral fractures).

Comparison 3 Sensitivity analyses (assessment of bias: analysed outcome in brackets), Outcome 8 Gastrointestinal toxicity (grade III/IV: oral vs IV bisphosphonates)).
| Bisphosphonates in multiple myeloma | |||||
| Patient or population: patients with multiple myeloma Control: no treatment/placebo | |||||
| Outcomes | Illustrative comparative risks* (95% CI) | Relative effect | No of participants | Quality of the evidence | |
| Assumed risk | Corresponding risk | ||||
| Control | Bisphosphonates | ||||
| Overall survival## | Medium‐risk population# | HR 0.90 | 2706 | ⊕⊕⊕⊝ | |
| 410 per 1000 | 378 per 1000 | ||||
| Progression‐free survival### | Medium‐risk population# | HR 0.75 | 908 | ⊕⊕⊝⊝ | |
| 470 per 1000 | 379 per 1000 | ||||
| Vertebral fractures | Medium‐risk population# | RR 0.74 | 1116 | ⊕⊕⊕⊝ | |
| 360 per 1000 | 266 per 1000 | ||||
| Non‐vertebral fractures | Medium‐risk population# | RR 1.03 | 1389 | ⊕⊕⊕⊝ | |
| 140 per 1000 | 144 per 1000 | ||||
| Skeletal‐related events | Medium‐risk population# | RR 0.74 | 2141 | ⊕⊕⊕⊝ | |
| 400 per 1000 | 296 per 1000 | ||||
| Pain | Medium‐risk population | RR 0.75 | 1281 | ⊕⊝⊝⊝ | |
| 540 per 1000 | 410 per 1000 | ||||
| Osteonecrosis of jaw | Medium‐risk population# | RR 4.61 (0.99 to 21.35) | 1284 | ⊕⊕⊝⊝ low10,11 | |
| NE | 0 per 1000 | ||||
| *The basis for the assumed risk (e.g. the median control group risk across studies) is provided in footnotes. The corresponding risk (and its 95% confidence interval) is based on the assumed risk in the comparison group and the relative effect of the intervention (and its 95% CI). | |||||
| GRADE Working Group grades of evidence | |||||
| 1 A total of 20 RCTs were included in the direct meta‐analysis. Only 35% (7/20) of trials had adequate allocation concealment. Only 20% (4/20) of trials reported methods of randomization. Similarly, 15% (3/20) of trials reported blinding procedures and personnel who were blinded to the intervention assignment. However, sensitivity analyses based on the methodological quality domains did not change the estimates. Hence, the assessment of studies’ limitations may represent the poor quality of reporting rather than true biased estimates. 9 Downgraded the quality of evidence by one level due to variation in assessment of pain based on blinding of the assessors. Only 15% (3/20) of trials reported blinding procedures and personnel who were blinded to the intervention assignment. Moreover, we found that RCTs with double‐blinding showed no significant benefit of bisphosphonates over placebo for amelioration of pain, while non‐blinded RCTs favored bisphosphonates over placebo for pain relief. We also downgraded the quality of evidence by one level due to imprecision. 10 Downgraded the quality of evidence by one level due to the potential for publication bias.The Osteonecrosis of jaw data were extractable from 30% (6/20) of studies eligible for direct meta‐analysis. 11 Downgraded the quality of evidence by one level due to imprecision.All included RCTs and also the pooled estimate have wide confidence intervals. # The moderate control risk was calculated via GRADEpro software based on average risk in the control arm of the included studies. ## We have calculated and presented overall mortality instead of OS. The expected events represent a median timeline of 5 years. ### PFS events represent death or progress or relapse. The expected events represent a median timeline of 5 years. | |||||
| Type of bisphosphonates | Bisphosphontes | Relative potency |
| Nonaminobisphosphonates | Etidronate | 1 |
| Clodronate | 10 | |
| Tiludronate | 10 | |
| Aminobisphosphonates | Pamidronate | 100 |
| Alendronate | 500 | |
| Ibandronate | 1,000 | |
| Risendronate | 2,000 | |
| Zoledronate | 10,000 | |
| Based on information from (Drake 2008; Dunford 2001). | ||
| Study ID | Adverse events (gastrointestinal symptoms) | Adverse events (hypocalcemia) | Adverse events (serum creatinine) | Adverse events (osteonecrosis of the jaw) |
| No | No | No | No | |
| Yes | Yes | No | No | |
| Yes | No | No | No | |
| No | No | No | No | |
| Yes | No | Yes | No | |
| No | No | No | No | |
| Yes | No | Yes | No | |
| Yes | Yes | No | No | |
| Yes | No | No | No | |
| No | Yes | No | No | |
| No | No | No | No | |
| No | No | No | Yes | |
| No | No | No | Yes | |
| No | No | No | Yes | |
| No | No | No | No | |
| No | No | No | No | |
| No | No | No | No | |
| Yes | No | No | Yes | |
| No | No | No | No | |
| No | No | No | Yes | |
| No | No | No | Yes | |
| Yes | No | No | Yes | |
| No | No | No | No | |
| No | No | No | Yes |
| MTC method (REM) | ||||||||
| Outcome | Treatment1 | Treatment2 | NRCTs | Patients | HR/RR | 95% LCRL | 95% UCRL | Quality of the evidence (GRADE) |
| OS | PL | CLO | 16 | 5260 | 1.19 | 0.88 | 1.63 | ⊕⊕⊕⊝ moderate |
| OS | ETI | CLO | 16 | 5260 | 1.48 | 0.96 | 2.51 | ⊕⊕⊕⊝ moderate |
| OS | IBAN | CLO | 16 | 5260 | 1.34 | 0.60 | 2.62 | ⊕⊕⊕⊝ moderate |
| OS | PAM 90 mg | CLO | 16 | 5260 | 1.04 | 0.64 | 1.64 | ⊕⊕⊕⊝ moderate |
| OS | ZOL | CLO | 16 | 5260 | 0.78 | 0.52 | 1.14 | ⊕⊕⊕⊝ moderate |
| OS | PAM 30 mg | CLO | 16 | 5260 | 1.04 | 0.48 | 2.09 | ⊕⊕⊝⊝ low* |
| OS | ETI | PL | 16 | 5260 | 1.25 | 0.88 | 1.95 | ⊕⊕⊝⊝ low* |
| OS | IBAN | PL | 16 | 5260 | 1.13 | 0.54 | 2.06 | ⊕⊕⊝⊝ low* |
| OS | PAM 90 mg | PL | 16 | 5260 | 0.87 | 0.60 | 1.23 | ⊕⊕⊕⊝ moderate |
| OS | ZOL | PL | 16 | 5260 | 0.67 | 0.46 | 0.91 | ⊕⊕⊕⊝ moderate |
| OS | PAM 30 mg | PL | 16 | 5260 | 0.87 | 0.44 | 1.64 | ⊕⊕⊝⊝ low* |
| OS | IBAN | ETI | 16 | 5260 | 0.94 | 0.37 | 1.80 | ⊕⊕⊝⊝ low* |
| OS | PAM 90 mg | ETI | 16 | 5260 | 0.73 | 0.38 | 1.14 | ⊕⊕⊝⊝ low* |
| OS | ZOL | ETI | 16 | 5260 | 0.56 | 0.29 | 0.87 | ⊕⊕⊕⊝ moderate |
| OS | PAM 30 mg | ETI | 16 | 5260 | 0.72 | 0.30 | 1.40 | ⊕⊕⊝⊝ low* |
| OS | PAM 90 mg | IBAN | 16 | 5260 | 0.87 | 0.39 | 1.74 | ⊕⊕⊝⊝ low* |
| OS | ZOL | IBAN | 16 | 5260 | 0.67 | 0.29 | 1.31 | ⊕⊕⊝⊝ low* |
| OS | PAM 30 mg | IBAN | 16 | 5260 | 0.87 | 0.32 | 2.06 | ⊕⊕⊝⊝ low* |
| OS | ZOL | PAM 90 mg | 16 | 5260 | 0.79 | 0.46 | 1.26 | ⊕⊕⊝⊝ low* |
| OS | PAM 30 mg | PAM 90 mg | 16 | 5260 | 1.00 | 0.57 | 1.74 | ⊕⊕⊝⊝ low* |
| OS | PAM 30 mg | ZOL | 16 | 5260 | 1.35 | 0.62 | 2.76 | ⊕⊕⊝⊝ low* |
| PFS | PL | PAM 90 mg | 9 | 3472 | 0.84 | 0.30 | 1.88 | ⊕⊝⊝⊝ very low *^ |
| PFS | ZOL | PAM 90 mg | 9 | 3472 | 0.59 | 0.20 | 1.39 | ⊕⊝⊝⊝ very low *^ |
| PFS | CLO | PAM 90 mg | 9 | 3472 | 0.66 | 0.16 | 1.71 | ⊕⊝⊝⊝ very low *^ |
| PFS | PAM 30 mg | PAM 90 mg | 9 | 3472 | 1.04 | 0.38 | 2.16 | ⊕⊝⊝⊝ very low *^ |
| PFS | ZOL | PL | 9 | 3472 | 0.70 | 0.46 | 1.03 | ⊕⊝⊝⊝ very low *^ |
| PFS | CLO | PL | 9 | 3472 | 0.77 | 0.30 | 1.47 | ⊕⊝⊝⊝ very low *^ |
| PFS | PAM 30 mg | PL | 9 | 3472 | 1.55 | 0.34 | 4.29 | ⊕⊝⊝⊝ very low *^ |
| PFS | CLO | ZOL | 9 | 3472 | 1.10 | 0.45 | 1.95 | ⊕⊝⊝⊝ very low *^ |
| PFS | PAM 30 mg | ZOL | 9 | 3472 | 2.30 | 0.45 | 6.78 | ⊕⊝⊝⊝ very low *^ |
| PFS | PAM 30 mg | CLO | 9 | 3472 | 2.38 | 0.43 | 8.15 | ⊕⊝⊝⊝ very low *^ |
| SREs | PL | CLO | 13 | 5727 | 1.27 | 0.81 | 1.84 | ⊕⊕⊝⊝ low* |
| SREs | ETI | CLO | 13 | 5727 | 1.01 | 0.37 | 2.20 | ⊕⊕⊝⊝ low* |
| SREs | PAM 90 mg | CLO | 13 | 5727 | 0.90 | 0.51 | 1.38 | ⊕⊕⊝⊝ low* |
| SREs | IBAN | CLO | 13 | 5727 | 1.37 | 0.68 | 2.55 | ⊕⊕⊝⊝ low* |
| SREs | ZOL | CLO | 13 | 5727 | 0.72 | 0.41 | 1.02 | ⊕⊕⊝⊝ low* |
| SREs | PAM 30 mg | CLO | 13 | 5727 | 0.89 | 0.44 | 1.62 | ⊕⊕⊝⊝ low* |
| SREs | ETI | PL | 13 | 5727 | 0.79 | 0.33 | 1.61 | ⊕⊕⊝⊝ low* |
| SREs | PAM 90 mg | PL | 13 | 5727 | 0.71 | 0.49 | 0.96 | ⊕⊕⊕⊝ moderate |
| SREs | IBAN | PL | 13 | 5727 | 1.08 | 0.60 | 1.86 | ⊕⊕⊝⊝ low* |
| SREs | ZOL | PL | 13 | 5727 | 0.57 | 0.37 | 0.76 | ⊕⊕⊕⊝ moderate |
| SREs | PAM 30 mg | PL | 13 | 5727 | 0.71 | 0.38 | 1.23 | ⊕⊕⊝⊝ low* |
| SREs | PAM 90 mg | ETI | 13 | 5727 | 1.06 | 0.40 | 2.25 | ⊕⊕⊝⊝ low* |
| SREs | IBAN | ETI | 13 | 5727 | 1.61 | 0.55 | 3.79 | ⊕⊕⊝⊝ low* |
| SREs | ZOL | ETI | 13 | 5727 | 0.84 | 0.31 | 1.76 | ⊕⊕⊝⊝ low* |
| SREs | PAM30mg | ETI | 13 | 5727 | 1.06 | 0.35 | 2.57 | ⊕⊕⊝⊝ low* |
| SREs | IBAN | PAM 90 mg | 13 | 5727 | 1.56 | 0.80 | 2.90 | ⊕⊕⊝⊝ low* |
| SREs | ZOL | PAM 90 mg | 13 | 5727 | 0.81 | 0.52 | 1.14 | ⊕⊕⊝⊝ low* |
| SREs | PAM 30 mg | PAM 90 mg | 13 | 5727 | 1.00 | 0.60 | 1.70 | ⊕⊕⊝⊝ low* |
| SREs | ZOL | IBAN | 13 | 5727 | 0.56 | 0.26 | 0.98 | ⊕⊕⊕⊝ moderate |
| SREs | PAM 90 mg | IBAN | 13 | 5727 | 0.70 | 0.29 | 1.44 | ⊕⊕⊝⊝ low* |
| SREs | PAM 30 mg | ZOL | 13 | 5727 | 1.28 | 0.68 | 2.51 | ⊕⊕⊝⊝ low* |
| Pain | ETI | CLO | 8 | 1281 | 2.15 | 0.22 | 9.56 | ⊕⊝⊝⊝ very low *^ |
| Pain | IBAN | CLO | 8 | 1281 | 4.13 | 0.57 | 16.99 | ⊕⊝⊝⊝ very low *^ |
| Pain | PAM 90 mg | CLO | 8 | 1281 | 1.76 | 0.57 | 16.99 | ⊕⊝⊝⊝ very low *^ |
| Pain | IBAN | ETI | 8 | 1281 | 4.07 | 0.23 | 19.62 | ⊕⊝⊝⊝ very low *^ |
| Pain | PAM 90 mg | ETI | 8 | 1281 | 1.75 | 0.11 | 7.64 | ⊕⊝⊝⊝ very low *^ |
| Pain | PAM 90 mg | IBAN | 8 | 1281 | 0.75 | 0.06 | 3 | ⊕⊝⊝⊝ very low *^ |
| Vertebral fractures | PL | CLO | 8 | 3076 | 1.50 | 0.87 | 2.62 | ⊕⊕⊝⊝ low* |
| Vertebral fractures | IBAN | CLO | 8 | 3076 | 1.76 | 0.56 | 4.45 | ⊕⊕⊝⊝ low* |
| Vertebral fractures | PAM 90 mg | CLO | 8 | 3076 | 1.07 | 0.45 | 2.07 | ⊕⊕⊝⊝ low* |
| Vertebral fractures | ZOL | CLO | 8 | 3076 | 0.59 | 0.22 | 1.17 | ⊕⊕⊝⊝ low* |
| Vertebral fractures | IBAN | PL | 8 | 3076 | 1.16 | 0.41 | 2.56 | ⊕⊕⊝⊝ low* |
| Vertebral fractures | PAM90mg | PL | 8 | 3076 | 0.72 | 0.35 | 1.18 | ⊕⊕⊝⊝ low* |
| Vertebral fractures | ZOL | PL | 8 | 3076 | 0.42 | 0.12 | 0.94 | ⊕⊕⊕⊝ moderate |
| Vertebral fractures | PAM90mg | IBAN | 8 | 3076 | 0.76 | 0.21 | 1.91 | ⊕⊕⊝⊝ low* |
| Vertebral fractures | ZOL | IBAN | 8 | 3076 | 0.45 | 0.08 | 1.29 | ⊕⊕⊝⊝ low* |
| Vertebral fractures | ZOL | PAM 90 mg | 8 | 3076 | 0.64 | 0.17 | 1.68 | ⊕⊕⊝⊝ low* |
| Nonvertebral fractures | PL | CLO | 7 | 3349 | 1.47 | 0.65 | 3.10 | ⊕⊕⊝⊝ low* |
| Nonvertebral fractures | IBAN | CLO | 7 | 3349 | 2.13 | 0.44 | 7.20 | ⊕⊕⊝⊝ low* |
| Nonvertebral fractures | PAM 90 mg | CLO | 7 | 3349 | 3.17 | 0.52 | 10.88 | ⊕⊕⊝⊝ low* |
| Nonvertebral fractures | ZOL | CLO | 7 | 3349 | 0.82 | 0.24 | 2.32 | ⊕⊕⊝⊝ low* |
| Nonvertebral fractures | IBAN | PL | 7 | 3349 | 1.46 | 0.40 | 3.98 | ⊕⊕⊝⊝ low* |
| Non vertebral fractures | PAM 90 mg | PL | 7 | 3349 | 2.01 | 0.46 | 6.32 | ⊕⊕⊝⊝ low* |
| Non vertebral fractures | ZOL | PL | 7 | 3349 | 0.66 | 0.13 | 2.30 | ⊕⊕⊝⊝ low* |
| Non‐vertebral fractures | PAM 90 mg | IBAN | 7 | 3349 | 1.98 | 0.25 | 7.66 | ⊕⊕⊝⊝ low* |
| Non‐vertebral fractures | ZOL | IBAN | 7 | 3349 | 0.64 | 0.07 | 2.82 | ⊕⊕⊝⊝ low* |
| Non‐vertebral fractures | ZOL | PAM 90 mg | 7 | 3349 | 0.49 | 0.04 | 2.14 | ⊕⊕⊝⊝ low* |
| Hypercalcemia | PL | CLO | 11 | 4146 | 1.64 | 0.71 | 3.58 | ⊕⊝⊝⊝ very low *$ |
| Hypercalcemia | ETI | CLO | 11 | 4146 | 2.59 | 0.51 | 8.80 | ⊕⊝⊝⊝ very low *$ |
| Hypercalcemia | IBAN | CLO | 11 | 4146 | 1.27 | 0.20 | 4.53 | ⊕⊝⊝⊝ very low *$ |
| Hypercalcemia | PAM90mg | CLO | 11 | 4146 | 1.14 | 0.32 | 3.05 | ⊕⊝⊝⊝ very low *$ |
| Hypercalcemia | ZOL | CLO | 11 | 4146 | 1.04 | 0.32 | 2.47 | ⊕⊝⊝⊝ very low *$ |
| Hypercalcemia | ETI | PL | 11 | 4146 | 1.55 | 0.40 | 4.27 | ⊕⊝⊝⊝ very low *$ |
| Hypercalcemia | IBAN | PL | 11 | 4146 | 0.76 | 0.16 | 2.27 | ⊕⊝⊝⊝ very low *$ |
| Hypercalcemia | PAM 90 mg | PL | 11 | 4146 | 0.70 | 0.26 | 1.40 | ⊕⊝⊝⊝ very low *$ |
| Hypercalcemia | ZOL | PL | 11 | 4146 | 0.73 | 0.16 | 1.92 | ⊕⊝⊝⊝ very low *$ |
| Hypercalcemia | IBAN | ETI | 11 | 4146 | 0.68 | 0.08 | 2.53 | ⊕⊝⊝⊝ very low *$ |
| Hypercalcemia | PAM 90 mg | ETI | 11 | 4146 | 0.62 | 0.11 | 1.92 | ⊕⊝⊝⊝ very low *$ |
| Hypercalcemia | ZOL | ETI | 11 | 4146 | 0.65 | 0.08 | 2.28 | ⊕⊝⊝⊝ very low *$ |
| Hypercalcemia | PAM 90 mg | IBAN | 11 | 4146 | 1.42 | 0.22 | 4.79 | ⊕⊝⊝⊝ very low *$ |
| Hypercalcemia | ZOL | IBAN | 11 | 4146 | 1.50 | 0.15 | 5.74 | ⊕⊝⊝⊝ very low *$ |
| Hypercalcemia | ZOL | PAM 90 mg | 11 | 4146 | 1.23 | 0.21 | 4.05 | ⊕⊝⊝⊝ very low *$ |
| GIToxicity | PL | CLO | 8 | 3789 | 0.87 | 0.45 | 1.49 | ⊕⊕⊝⊝ low* $$ |
| GIToxicity | ETI | CLO | 8 | 3789 | 1.14 | 0.01 | 7.59 | ⊕⊕⊝⊝ low* $$ |
| GIToxicity | PAM 90 mg | CLO | 8 | 3789 | 1.18 | 0.45 | 2.49 | ⊕⊕⊝⊝ low* $$ |
| GIToxicity | ZOL | CLO | 8 | 3789 | 0.86 | 0.35 | 1.74 | ⊕⊕⊝⊝ low* $$ |
| GIToxicity | ETI | PL | 8 | 3789 | 1.32 | 0.01 | 8.73 | ⊕⊕⊝⊝ low* $$ |
| GIToxicity | PAM 90 mg | PL | 8 | 3789 | 1.36 | 0.69 | 2.39 | ⊕⊕⊝⊝ low* $$ |
| GIToxicity | ZOL | PL | 8 | 3789 | 1.07 | 0.38 | 2.39 | ⊕⊕⊝⊝ low* $$ |
| GIToxicity | PAM 90 mg | ETI | 8 | 3789 | 15.96 | 0.14 | 102.19 | ⊕⊕⊝⊝ low* $$ |
| GIToxicity | ZOL | ETI | 8 | 3789 | 12.63 | 0.10 | 81.10 | ⊕⊕⊝⊝ low* $$ |
| GIToxicity | ZOL | PAM 90 mg | 8 | 3789 | 0.86 | 0.24 | 2.27 | ⊕⊕⊝⊝ low* $$ |
| ONJ | PL | PAM 90 mg | 8 | 3746 | 1.10 | 0.04 | 5.99 | ⊕⊝⊝⊝ very low *^ |
| ONJ | ZOL | PAM 90 mg | 8 | 3746 | 6.19 | 0.09 | 38.16 | ⊕⊝⊝⊝ very low *^ |
| ONJ | CLO | PAM 90 mg | 8 | 3746 | 0.77 | 0.01 | 4.94 | ⊕⊝⊝⊝ very low *^ |
| ONJ | PAM 30 mg | PAM 90 mg | 8 | 3746 | 0.44 | 0.05 | 1.83 | ⊕⊝⊝⊝ very low *^ |
| ONJ | ZOL | PL | 8 | 3746 | 5.70 | 0.72 | 21.26 | ⊕⊝⊝⊝ very low *^ |
| ONJ | CLO | PL | 8 | 3746 | 0.71 | 0.04 | 3.43 | ⊕⊝⊝⊝ very low *^ |
| ONJ | PAM 30 mg | PL | 8 | 3746 | 2.19 | 0.03 | 13.55 | ⊕⊝⊝⊝ very low *^ |
| ONJ | CLO | ZOL | 8 | 3746 | 0.13 | 0.02 | 0.44 | ⊕⊝⊝⊝ very low ** |
| ONJ | PAM 30 mg | ZOL | 8 | 3746 | 0.77 | 0.00 | 5.09 | ⊕⊝⊝⊝ very low *^ |
| ONJ | PAM 30 mg | CLO | 8 | 3746 | 11.14 | 0.04 | 76.15 | ⊕⊝⊝⊝ very low *^ |
| REM: Random effects model, for multiple treatment comparison method: sigma˜Unif(0,1); ONJ: osteonecrosis of the jaw; PL: Placebo; #RCTS: Number of randomized controlled trials; LCRL: Lower credibility limit; UCRL: Upper credibility limit; OS: Overall survival; PFS: Progression‐free survival; SREs: Skeletal‐related events; HR: Hazard ratio; RR: Risk ratio; ETI: Etidronate; CLO: Clodronate; PAM 90 mg: Pamidronate 90 mg: PAM 30 mg: Pamidronate 30 mg; IBAN: Ibandronate: ZOL: Zoledronate; *Randomized controlled trial with direct (head‐to‐head) comparison of zoledronate versus clodronate (Morgan 2010).* Imprecision; ^ Contributing direct evidence of low quality;$ For the contributing direct evidence, the pooled estimate along with individual studies have wide confidence intervals. Therefore, we downgraded the quality of evidence by two levels resulting in low quality evidence. $$ For the contributing direct evidence, individual studies have wide confidence intervals. Therefore, we downgraded the quality of evidence by one level resulting in moderate quality evidence.**The results from head to head RCT comparing zoledronate with clodronate showed no difference in risk of ONJ (Morgan 2010). However, the results from network meta‐analysis showed an increased risk of ONJ with zoledronate over clodronate which is indicative of incoherence. | ||||||||
| Study | Study design | Type of bisphosphonate | Total number of patients | Number of patients with ONJ | Route, dose, frequency | Treatment duration | ONJ frequency |
| Retrospective study | Pamidronate | 17 | 3 | Not reported | Not reported | 17.65% | |
| Zoledronate | 34 | 2 | 5.88% | ||||
| Pamidronate + zoledronate | 33 | 17 | 51.51% | ||||
| Retrospective study | Zoledronate | 300 | 14 | Not clear | Median: 18 months Range: 1‐121 months | 5% | |
| Not clear | Zoledronate | 64 | 7 | Not reported | Not clear | 9% | |
| Prospective study | Zoledronate | 32 | 5 | 15 minute infusion of 4 mg IV zoledronate once a month | Mean duration: 26.5 months, SD 18.7 months | 15% | |
| Retrospective study | Pamidronate | 20 | 0 | Not clear | 23 months | 0% | |
| Zoledronate | 37 | 5 | Not clear | 28 months | 11.9% | ||
| Pamidronate + zoledronate | 42 | 2 | Not clear | 47 months | 4.55% | ||
| Pamidronate | 93 | 7 | Not reported | 39 months ONJ patients (11‐76) vs 28 (4.5‐123) months without ONJ | 7.5% | ||
| Zoledronate | 33 | 1 | 3% | ||||
| Pamidronate + zoledronate | 66 | 6 | 9.1% | ||||
| Ibandronate | 1 | 0 | 0% | ||||
| Ibandronate + zoledronate | 4 | 1 | 25% | ||||
| Clodronate + zoledronate | 1 | 0 | 0% | ||||
| Alendronate + zoledronate | 1 | 0 | 0% | ||||
| Retrospective study | Pamidronate | 49 | 1 | 90 mg monthly | 28 months | 2% | |
| Zoledronate | 64 | 6 | 4 mg monthly | 12 months (7‐28) | 9.3% | ||
| Pamidronate + zoledronate | 30 | 7 | 43.5 months (24‐59) | 23.3% | |||
| Retrospective study | Zoledronate | 225 | 6 | Not reported | 10 months (4‐35) | 2.7% | |
| Retrospective study from 1991, prospective from 2001‐2006 | Pamidronate | 78 | 1 | 90 mg | 24 months (4‐120) | 1.28% | |
| Pamidronate | 91 | 6 | 4 mg 4‐6 weeks | 6.59% | |||
| Pamidronate + zoledronate | 85 | 21 | 24.71% | ||||
| ONJ: Osteonecrosis of the jaw; SD: standard deviation; IV: intravenous. | |||||||
| Study_ID | Reason for exclusion |
| No multiple myeloma patients with ONJ | |
| No extractable data for multiple myeloma patients (abstract) | |
| American Society of Hematology 2004 (abstract no 4933): Approximately 600 multiple myeloma patients. Teported frequency: 7 patients. Excluded due to imprecise reporting (e.g. approximately 600 multiple myeloma patients) | |
| ONJ: Osteonecrosis of the jaw. | |
| Study | Total number of patients | Clodronate | Pamidronate | Zoledronate | Pamidronate /zoledronate | Not specified | Others |
| 9 | 2 | 7 | |||||
| 1 | 1 | ||||||
| 1 | 1 | ||||||
| 1 | 1 | ||||||
| 9 | 2 | 4 | 3 | ||||
| 1 | 1 | ||||||
| 1 | 1 | ||||||
| 21 | 12 | 1 | 8 | ||||
| 1 | 1 | ||||||
| 7 | 2 | 5 | |||||
| 3 | 3 | ||||||
| 5 | 2 | 3 | |||||
| 22 | 17 | 4 | 1(A) | ||||
| 2 | 1 | 1 | |||||
| 13 | 13 | ||||||
| 101 | 18 | 78 | 5 | ||||
| 1 | 1 | ||||||
| 5 | 1 | 4 | |||||
| 2 | 2 | ||||||
| 1 | 1 | ||||||
| 21 | 1 | 19 | 1(A) | ||||
| 1 | 1 | ||||||
| 1 | 1 | ||||||
| 2 | 1 | 1 | |||||
| 6 | 6 | ||||||
| 2 | 2 | ||||||
| 101 | 30 | 31 | 23 | 17(16:A,1:U) | |||
| 1 | 1 | ||||||
| 3 | 1 | 2 | |||||
| 33 | 6 | 19 | 7 | 1(P,I,Z) | |||
| 2 | 1 | 1 | |||||
| 7 | 4 | 2 | 1 | ||||
| 1 | 1 | ||||||
| 3 | 1 | 2 | |||||
| 1 | 1 | ||||||
| 4 | 2 | 2 | |||||
| 2 | 2 | ||||||
| 4 | 4 | ||||||
| 35 | 3 | 14 | 18 | ||||
| 3 | 2 | 1 | |||||
| 28 | 14 | 4 | 10 | ||||
| 1 | 1 | ||||||
| 3 | 1 | 1 | 1(P/C) | ||||
| 1 | 1 | ||||||
| 6 | 6 | ||||||
| 2 | 2 | ||||||
| 34 | 3 | 20 | 5 | 6 (:I/Z,3:A,1:U) | |||
| 1 | 1 | ||||||
| 1 | 1 | ||||||
| 11 | 11 | ||||||
| 23 | 23 | ||||||
| 6 | 6 | ||||||
| 1 | 1 | ||||||
| 1 | 1 | ||||||
| 56 | 56 | ||||||
| 9 | 1 | 1 | 7 | ||||
| 27 | 27 | ||||||
| 1 | 1 | ||||||
| 12 | 2 | 8 | 2 | ||||
| 2 | 2 | ||||||
| 10 | 10 | ||||||
| Total | 676 | 3 | 128 | 270 | 113 | 130 | 32 |
| A: Alendronate; C: Clodronate; I: Ibandronate; P: Pamidronate; R: Risedronate; Z: Zoledronate; MM: multiple myeloma; U: Unknown. | |||||||
| Outcome or subgroup title | No. of studies | No. of participants | Statistical method | Effect size |
| 1 Mortality Show forest plot | 14 | 2706 | Hazard Ratio (Random, 95% CI) | 0.90 [0.76, 1.07] |
| 1.1 Etidronate | 2 | 244 | Hazard Ratio (Random, 95% CI) | 1.24 [0.86, 1.80] |
| 1.2 Clodronate | 3 | 885 | Hazard Ratio (Random, 95% CI) | 0.93 [0.66, 1.29] |
| 1.3 Pamidronate | 5 | 977 | Hazard Ratio (Random, 95% CI) | 0.85 [0.67, 1.07] |
| 1.4 Ibandronate | 1 | 198 | Hazard Ratio (Random, 95% CI) | 1.07 [0.69, 1.64] |
| 1.5 Zoledronate | 3 | 402 | Hazard Ratio (Random, 95% CI) | 0.57 [0.43, 0.75] |
| 2 Progression‐free survival Show forest plot | 7 | 908 | Hazard Ratio (Random, 95% CI) | 0.75 [0.57, 1.00] |
| 2.1 Clodronate | 1 | 26 | Hazard Ratio (Random, 95% CI) | 0.63 [0.17, 2.34] |
| 2.2 Pamidronate | 1 | 177 | Hazard Ratio (Random, 95% CI) | 1.24 [0.66, 2.33] |
| 2.3 Zoledronate | 5 | 705 | Hazard Ratio (Random, 95% CI) | 0.70 [0.52, 0.95] |
| 3 Vertebral fractures Show forest plot | 7 | 1116 | Risk Ratio (M‐H, Random, 95% CI) | 0.74 [0.62, 0.89] |
| 3.1 Clodronate | 3 | 433 | Risk Ratio (M‐H, Random, 95% CI) | 0.70 [0.56, 0.89] |
| 3.2 Pamidronate | 3 | 485 | Risk Ratio (M‐H, Random, 95% CI) | 0.69 [0.40, 1.20] |
| 3.3 Ibandronate | 1 | 198 | Risk Ratio (M‐H, Random, 95% CI) | 1.05 [0.61, 1.81] |
| 4 Non‐vertebral fractures Show forest plot | 6 | 1389 | Risk Ratio (M‐H, Random, 95% CI) | 1.03 [0.68, 1.56] |
| 4.1 Clodronate | 3 | 752 | Risk Ratio (M‐H, Random, 95% CI) | 0.74 [0.42, 1.31] |
| 4.2 Pamidronate | 2 | 439 | Risk Ratio (M‐H, Random, 95% CI) | 1.65 [0.95, 2.87] |
| 4.3 Ibandronate | 1 | 198 | Risk Ratio (M‐H, Random, 95% CI) | 1.25 [0.79, 1.98] |
| 5 Total skeletal‐related events Show forest plot | 10 | 2141 | Risk Ratio (M‐H, Random, 95% CI) | 0.74 [0.63, 0.88] |
| 5.1 Etidronate | 1 | 78 | Risk Ratio (M‐H, Random, 95% CI) | 0.73 [0.39, 1.39] |
| 5.2 Clodronate | 1 | 204 | Risk Ratio (M‐H, Random, 95% CI) | 0.76 [0.65, 0.89] |
| 5.3 Pamidronate | 3 | 950 | Risk Ratio (M‐H, Random, 95% CI) | 0.73 [0.59, 0.91] |
| 5.4 Ibandronate | 1 | 198 | Risk Ratio (M‐H, Random, 95% CI) | 1.04 [0.80, 1.35] |
| 5.5 Zoledronate | 4 | 711 | Risk Ratio (M‐H, Random, 95% CI) | 0.49 [0.28, 0.89] |
| 6 Pain Show forest plot | 8 | 1281 | Risk Ratio (M‐H, Random, 95% CI) | 0.75 [0.60, 0.95] |
| 6.1 Etidronate | 1 | 78 | Risk Ratio (M‐H, Random, 95% CI) | 0.58 [0.26, 1.32] |
| 6.2 Clodronate | 4 | 566 | Risk Ratio (M‐H, Random, 95% CI) | 0.51 [0.29, 0.91] |
| 6.3 Pamidronate | 2 | 439 | Risk Ratio (M‐H, Random, 95% CI) | 0.85 [0.72, 1.01] |
| 6.4 Ibandronate | 1 | 198 | Risk Ratio (M‐H, Random, 95% CI) | 1.0 [0.86, 1.17] |
| 7 Incidence of hypercalcemia Show forest plot | 10 | 2174 | Risk Ratio (M‐H, Random, 95% CI) | 0.78 [0.56, 1.09] |
| 7.1 Etidronate | 1 | 166 | Risk Ratio (M‐H, Random, 95% CI) | 1.32 [0.73, 2.38] |
| 7.2 Clodronate | 3 | 831 | Risk Ratio (M‐H, Random, 95% CI) | 0.77 [0.45, 1.31] |
| 7.3 Pamidronate | 3 | 739 | Risk Ratio (M‐H, Random, 95% CI) | 0.65 [0.31, 1.33] |
| 7.4 Ibandronate | 1 | 198 | Risk Ratio (M‐H, Random, 95% CI) | 0.62 [0.27, 1.42] |
| 7.5 Zoledronate | 2 | 240 | Risk Ratio (M‐H, Random, 95% CI) | 0.19 [0.01, 3.91] |
| Outcome or subgroup title | No. of studies | No. of participants | Statistical method | Effect size |
| 1 Osteonecosis of jaw Show forest plot | 6 | 1284 | Risk Ratio (M‐H, Random, 95% CI) | 4.61 [0.99, 21.35] |
| 1.1 Pamidronate | 2 | 573 | Risk Ratio (M‐H, Random, 95% CI) | 3.06 [0.13, 74.69] |
| 1.2 Zoledronate | 4 | 711 | Risk Ratio (M‐H, Random, 95% CI) | 5.21 [0.91, 29.90] |
| 2 Gastrointestinal toxicity (grade III/IV) Show forest plot | 7 | 1829 | Risk Ratio (M‐H, Random, 95% CI) | 1.23 [0.95, 1.59] |
| 2.1 Etidronate | 1 | 78 | Risk Ratio (M‐H, Random, 95% CI) | 0.33 [0.01, 7.94] |
| 2.2 Clodronate | 2 | 872 | Risk Ratio (M‐H, Random, 95% CI) | 1.19 [0.82, 1.72] |
| 2.3 Pamidronate | 3 | 739 | Risk Ratio (M‐H, Random, 95% CI) | 1.30 [0.90, 1.88] |
| 2.4 Zoledronate | 1 | 140 | Risk Ratio (M‐H, Random, 95% CI) | 0.97 [0.06, 15.23] |
| 3 Hypocalcaemia Show forest plot | 3 | 1090 | Risk Ratio (M‐H, Random, 95% CI) | 2.19 [0.49, 9.74] |
| 3.1 Clodronate | 1 | 536 | Risk Ratio (M‐H, Random, 95% CI) | 2.06 [0.38, 11.16] |
| 3.2 Pamidronate | 2 | 554 | Risk Ratio (M‐H, Random, 95% CI) | 2.71 [0.11, 66.19] |
| 4 Renal dysfunction Show forest plot | 2 | 414 | Mean Difference (IV, Random, 95% CI) | ‐0.36 [‐9.75, 9.03] |
| Outcome or subgroup title | No. of studies | No. of participants | Statistical method | Effect size |
| 1 Allocation concealment (vertebral fractures) Show forest plot | 7 | 1116 | Risk Ratio (M‐H, Random, 95% CI) | 0.74 [0.62, 0.89] |
| 1.1 Adeqaute concealment of allocation | 2 | 594 | Risk Ratio (M‐H, Random, 95% CI) | 0.65 [0.51, 0.82] |
| 1.2 Inadequate concealment of allocation | 5 | 522 | Risk Ratio (M‐H, Random, 95% CI) | 0.85 [0.67, 1.09] |
| 2 Blinding (vertebral fractures) Show forest plot | 7 | 1116 | Risk Ratio (M‐H, Random, 95% CI) | 0.74 [0.62, 0.89] |
| 2.1 Double‐blind | 5 | 1008 | Risk Ratio (M‐H, Random, 95% CI) | 0.71 [0.58, 0.85] |
| 2.2 Not blinded | 2 | 108 | Risk Ratio (M‐H, Random, 95% CI) | 0.55 [0.08, 3.72] |
| 3 Randomization method (vertebral fractures) Show forest plot | 7 | 1116 | Risk Ratio (M‐H, Random, 95% CI) | 0.74 [0.62, 0.89] |
| 3.1 Randomization method is described | 1 | 377 | Risk Ratio (M‐H, Random, 95% CI) | 0.57 [0.38, 0.85] |
| 3.2 Randomization method is NOT described | 6 | 739 | Risk Ratio (M‐H, Random, 95% CI) | 0.78 [0.65, 0.94] |
| 4 Type of data analysis (vertebral fractures) Show forest plot | 7 | 1116 | Risk Ratio (M‐H, Random, 95% CI) | 0.74 [0.62, 0.89] |
| 4.1 Intention‐to‐treat analysis | 3 | 463 | Risk Ratio (M‐H, Random, 95% CI) | 0.82 [0.55, 1.22] |
| 4.2 Per protocol analysis | 4 | 653 | Risk Ratio (M‐H, Random, 95% CI) | 0.71 [0.56, 0.89] |
| 5 Description of withdrawals and drop outs (vertebral fractures) Show forest plot | 7 | 1116 | Risk Ratio (M‐H, Random, 95% CI) | 0.74 [0.62, 0.89] |
| 5.1 Withdrawals and dropouts well described | 3 | 797 | Risk Ratio (M‐H, Random, 95% CI) | 0.67 [0.55, 0.82] |
| 5.2 Withdrawals and dropouts NOT described | 4 | 319 | Risk Ratio (M‐H, Random, 95% CI) | 0.94 [0.68, 1.29] |
| 6 Alpha error (vertebral fractures) Show forest plot | 7 | 1116 | Risk Ratio (M‐H, Random, 95% CI) | 0.74 [0.62, 0.89] |
| 6.1 Alpha error pre‐specified | 1 | 203 | Risk Ratio (M‐H, Random, 95% CI) | 0.74 [0.51, 1.08] |
| 6.2 Alpha error NOT pre‐specified | 6 | 913 | Risk Ratio (M‐H, Random, 95% CI) | 0.74 [0.59, 0.94] |
| 7 Beta error (vertebral fractures) Show forest plot | 7 | 1116 | Risk Ratio (M‐H, Random, 95% CI) | 0.74 [0.62, 0.89] |
| 7.1 Beta error pre‐specified | 1 | 203 | Risk Ratio (M‐H, Random, 95% CI) | 0.74 [0.51, 1.08] |
| 7.2 Beta error NOT pre‐specified | 6 | 913 | Risk Ratio (M‐H, Random, 95% CI) | 0.74 [0.59, 0.94] |
| 8 Gastrointestinal toxicity (grade III/IV: oral vs IV bisphosphonates)) Show forest plot | 7 | 1829 | Risk Ratio (M‐H, Random, 95% CI) | 1.23 [0.95, 1.59] |
| 8.1 Oral route | 4 | 1250 | Risk Ratio (M‐H, Random, 95% CI) | 1.23 [0.89, 1.70] |
| 8.2 Intervenous route | 3 | 579 | Risk Ratio (M‐H, Random, 95% CI) | 1.24 [0.81, 1.90] |