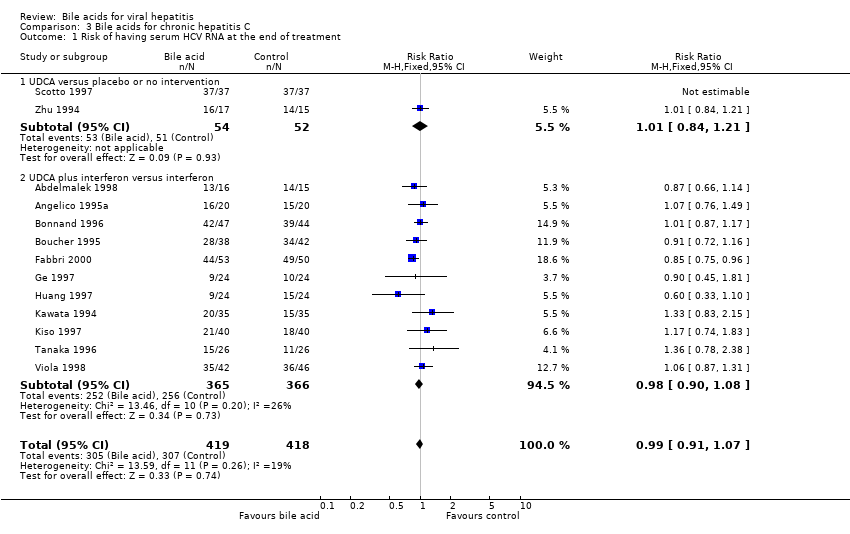
| 1 Risk of having serum HCV RNA at the end of treatment Show forest plot | 13 | 837 | Risk Ratio (M‐H, Fixed, 95% CI) | 0.99 [0.91, 1.07] |
|
| 1.1 UDCA versus placebo or no intervention | 2 | 106 | Risk Ratio (M‐H, Fixed, 95% CI) | 1.01 [0.84, 1.21] |
| 1.2 UDCA plus interferon versus interferon | 11 | 731 | Risk Ratio (M‐H, Fixed, 95% CI) | 0.98 [0.90, 1.08] |
| 2 Sensitivity analyses: Risk of having serum HCV RNA at the end of treatment ‐ Duration of treatment Show forest plot | 13 | 837 | Risk Ratio (M‐H, Fixed, 95% CI) | 0.99 [0.91, 1.07] |
|
| 2.1 Short treatment duration (less than 12 months) | 8 | 444 | Risk Ratio (M‐H, Fixed, 95% CI) | 0.93 [0.83, 1.04] |
| 2.2 Long treatment duration (12 months or more) | 5 | 393 | Risk Ratio (M‐H, Fixed, 95% CI) | 1.05 [0.92, 1.19] |
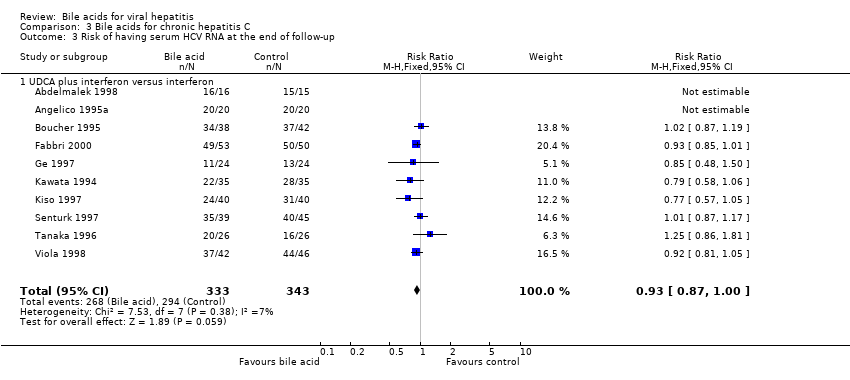
| 3 Risk of having serum HCV RNA at the end of follow‐up Show forest plot | 10 | 676 | Risk Ratio (M‐H, Fixed, 95% CI) | 0.93 [0.87, 1.00] |
|
| 3.1 UDCA plus interferon versus interferon | 10 | 676 | Risk Ratio (M‐H, Fixed, 95% CI) | 0.93 [0.87, 1.00] |
| 4 Sensitivity analyses: Risk of having serum HCV RNA at the end of follow‐up ‐ Duration of treatment Show forest plot | 10 | 676 | Risk Ratio (M‐H, Fixed, 95% CI) | 0.93 [0.87, 1.00] |
|
| 4.1 Short treatment duration (less than 12 months) | 5 | 283 | Risk Ratio (M‐H, Fixed, 95% CI) | 0.99 [0.87, 1.12] |
| 4.2 Long treatment duration (12 months or more) | 5 | 393 | Risk Ratio (M‐H, Fixed, 95% CI) | 0.90 [0.83, 0.99] |
| 5 Risk of cirrhosis at the end of treatment Show forest plot | 1 | 103 | Risk Ratio (M‐H, Fixed, 95% CI) | 1.79 [0.93, 3.47] |
|
| 5.1 UDCA plus interferon versus interferon | 1 | 103 | Risk Ratio (M‐H, Fixed, 95% CI) | 1.79 [0.93, 3.47] |
| 6 Risk of abnormal serum ALT at the end of treatment Show forest plot | 21 | 1582 | Risk Ratio (M‐H, Fixed, 95% CI) | 0.83 [0.77, 0.90] |
|
| 6.1 UDCA versus placebo or no intervention | 3 | 239 | Risk Ratio (M‐H, Fixed, 95% CI) | 0.78 [0.69, 0.88] |
| 6.2 UDCA plus interferon versus interferon | 15 | 1007 | Risk Ratio (M‐H, Fixed, 95% CI) | 0.81 [0.73, 0.91] |
| 6.3 TUDCA plus interferon versus interferon | 2 | 166 | Risk Ratio (M‐H, Fixed, 95% CI) | 0.93 [0.70, 1.24] |
| 6.4 UDCA plus glycyrrhizin versus glycyrrhizin | 1 | 170 | Risk Ratio (M‐H, Fixed, 95% CI) | 0.96 [0.75, 1.24] |
| 7 Sensitivity analyses: Risk of abnormal serum ALT at the end of treatment ‐ Duration of treatment Show forest plot | 21 | 1582 | Risk Ratio (M‐H, Fixed, 95% CI) | 0.83 [0.77, 0.90] |
|
| 7.1 Short treatment duration (less than 12 months) | 16 | 1189 | Risk Ratio (M‐H, Fixed, 95% CI) | 0.84 [0.76, 0.92] |
| 7.2 Long treatment duration (12 months or more) | 5 | 393 | Risk Ratio (M‐H, Fixed, 95% CI) | 0.83 [0.69, 0.99] |
| 8 Risk of abnormal serum ALT at the end of follow‐up Show forest plot | 13 | 929 | Risk Ratio (M‐H, Fixed, 95% CI) | 0.91 [0.85, 0.97] |
|
| 8.1 UDCA plus interferon versus interferon | 12 | 869 | Risk Ratio (M‐H, Fixed, 95% CI) | 0.90 [0.84, 0.97] |
| 8.2 TUDCA plus interferon versus interferon | 1 | 60 | Risk Ratio (M‐H, Fixed, 95% CI) | 1.0 [0.68, 1.47] |
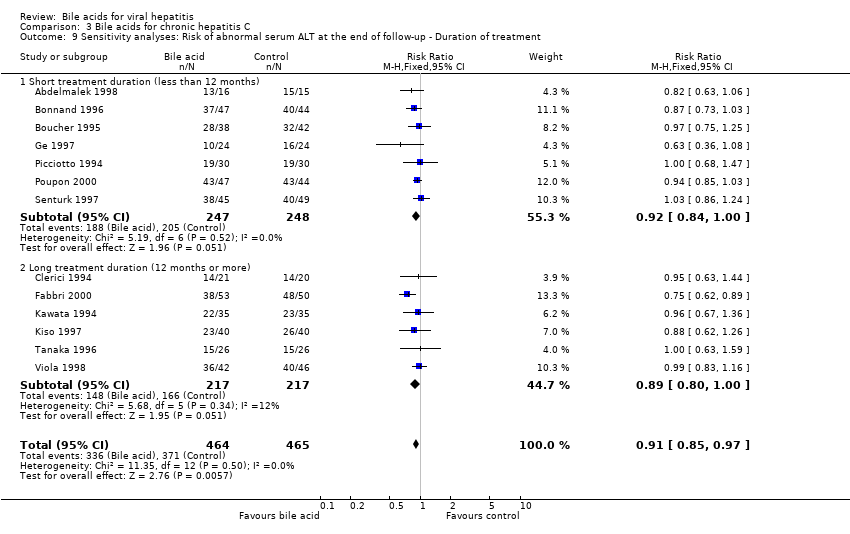
| 9 Sensitivity analyses: Risk of abnormal serum ALT at the end of follow‐up ‐ Duration of treatment Show forest plot | 13 | 929 | Risk Ratio (M‐H, Fixed, 95% CI) | 0.91 [0.85, 0.97] |
|
| 9.1 Short treatment duration (less than 12 months) | 7 | 495 | Risk Ratio (M‐H, Fixed, 95% CI) | 0.92 [0.84, 1.00] |
| 9.2 Long treatment duration (12 months or more) | 6 | 434 | Risk Ratio (M‐H, Fixed, 95% CI) | 0.89 [0.80, 1.00] |
| 10 Serum ALT (IU/L) at the end of treatment Show forest plot | 5 | 386 | Mean Difference (IV, Fixed, 95% CI) | ‐1.29 [‐3.16, 0.59] |
|
| 10.1 UDCA versus placebo or no intervention | 2 | 162 | Mean Difference (IV, Fixed, 95% CI) | ‐26.78 [‐39.65, ‐13.92] |
| 10.2 TUDCA versus placebo or no intervention | 3 | 224 | Mean Difference (IV, Fixed, 95% CI) | ‐0.73 [‐2.63, 1.16] |
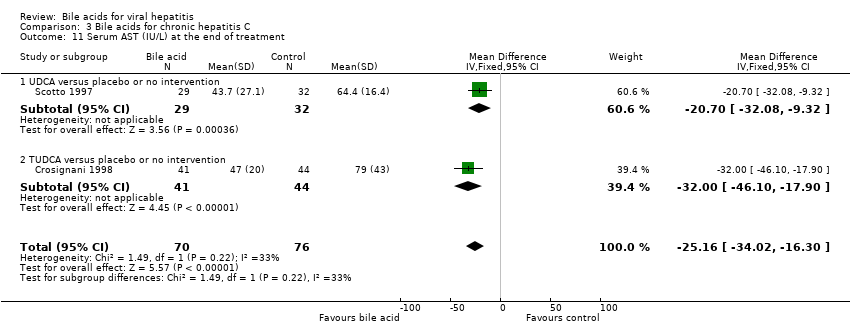
| 11 Serum AST (IU/L) at the end of treatment Show forest plot | 2 | 146 | Mean Difference (IV, Fixed, 95% CI) | ‐25.16 [‐34.02, ‐16.30] |
|
| 11.1 UDCA versus placebo or no intervention | 1 | 61 | Mean Difference (IV, Fixed, 95% CI) | ‐20.70 [‐32.08, ‐9.32] |
| 11.2 TUDCA versus placebo or no intervention | 1 | 85 | Mean Difference (IV, Fixed, 95% CI) | ‐32.0 [‐46.10, ‐17.90] |
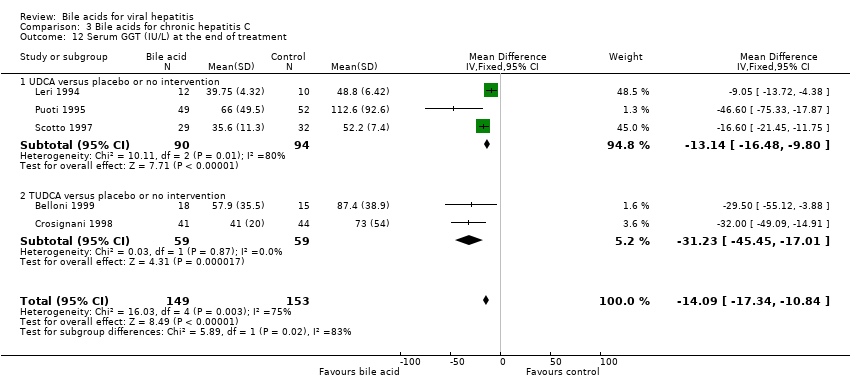
| 12 Serum GGT (IU/L) at the end of treatment Show forest plot | 5 | 302 | Mean Difference (IV, Fixed, 95% CI) | ‐14.09 [‐17.34, ‐10.84] |
|
| 12.1 UDCA versus placebo or no intervention | 3 | 184 | Mean Difference (IV, Fixed, 95% CI) | ‐13.14 [‐16.48, ‐9.80] |
| 12.2 TUDCA versus placebo or no intervention | 2 | 118 | Mean Difference (IV, Fixed, 95% CI) | ‐31.23 [‐45.45, ‐17.01] |
| 13 Portal and periportal inflammation scores at the end of treatment Show forest plot | 3 | 167 | Mean Difference (IV, Fixed, 95% CI) | 0.20 [0.15, 0.24] |
|
| 13.1 UDCA plus interferon versus interferon | 3 | 167 | Mean Difference (IV, Fixed, 95% CI) | 0.20 [0.15, 0.24] |
| 14 Knodell score at the end of treatment Show forest plot | 2 | 133 | Mean Difference (IV, Fixed, 95% CI) | 0.20 [0.08, 0.31] |
|
| 14.1 UDCA plus interferon versus interferon | 2 | 133 | Mean Difference (IV, Fixed, 95% CI) | 0.20 [0.08, 0.31] |
| 15 Adverse events caused by bile acid Show forest plot | 3 | 254 | Risk Ratio (M‐H, Fixed, 95% CI) | 1.17 [0.56, 2.46] |
|
| 15.1 UDCA plus interferon versus interferon | 2 | 179 | Risk Ratio (M‐H, Fixed, 95% CI) | 1.06 [0.49, 2.28] |
| 15.2 UDCA versus no intervention | 1 | 75 | Risk Ratio (M‐H, Fixed, 95% CI) | 2.75 [0.16, 48.61] |