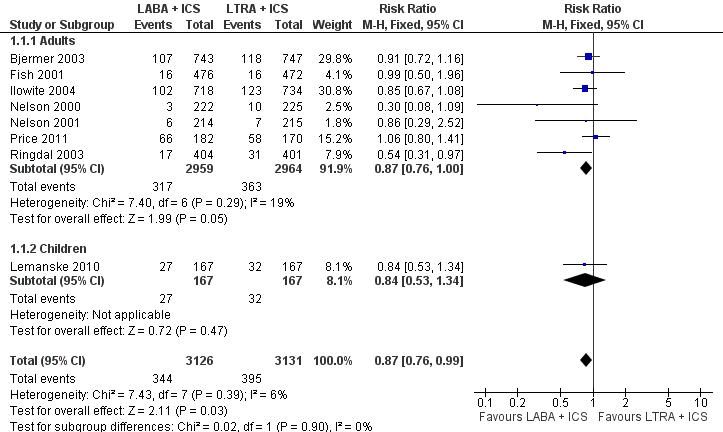
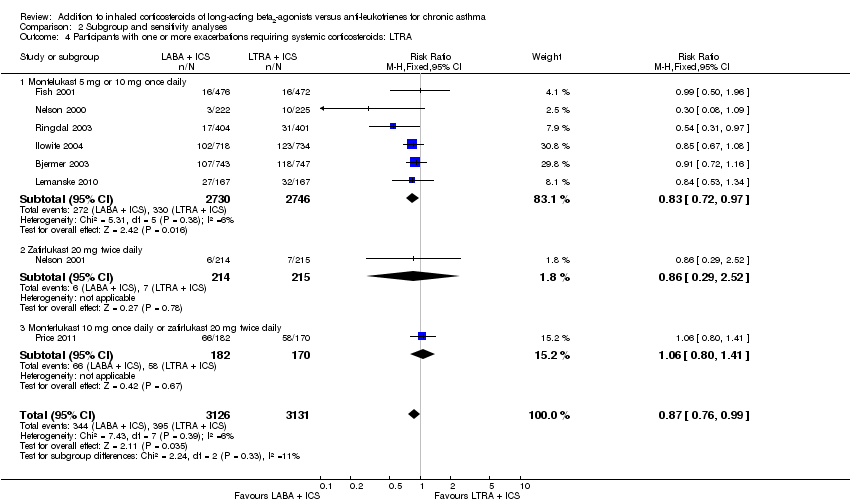
| 1 Participants with one or more exacerbations requiring systemic corticosteroids Show forest plot | 8 | 6257 | Risk Ratio (M‐H, Fixed, 95% CI) | 0.87 [0.76, 0.99] |
|
| 1.1 Adults | 7 | 5923 | Risk Ratio (M‐H, Fixed, 95% CI) | 0.87 [0.76, 1.00] |
| 1.2 Children | 1 | 334 | Risk Ratio (M‐H, Fixed, 95% CI) | 0.84 [0.53, 1.34] |
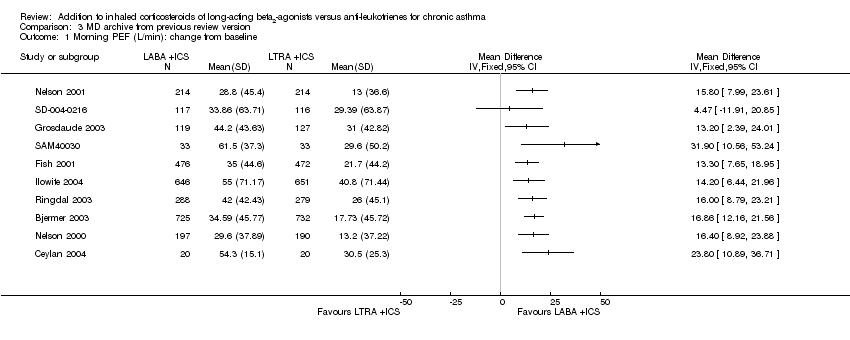
| 2 Morning PEF: L/min change from baseline Show forest plot | 11 | | Mean Difference (Random, 95% CI) | 15.36 [11.35, 19.37] |
|
| 2.1 Adults | 11 | | Mean Difference (Random, 95% CI) | 15.36 [11.35, 19.37] |
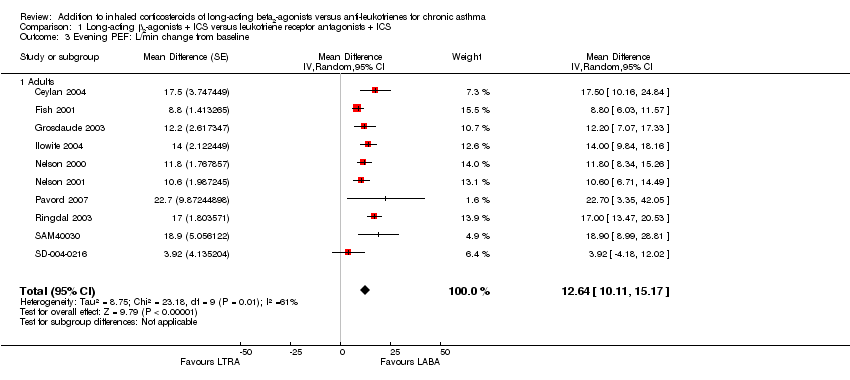
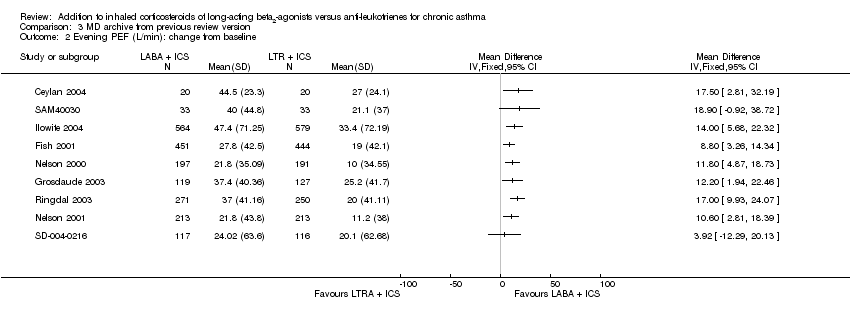
| 3 Evening PEF: L/min change from baseline Show forest plot | 10 | | Mean Difference (Random, 95% CI) | 12.64 [10.11, 15.17] |
|
| 3.1 Adults | 10 | | Mean Difference (Random, 95% CI) | 12.64 [10.11, 15.17] |
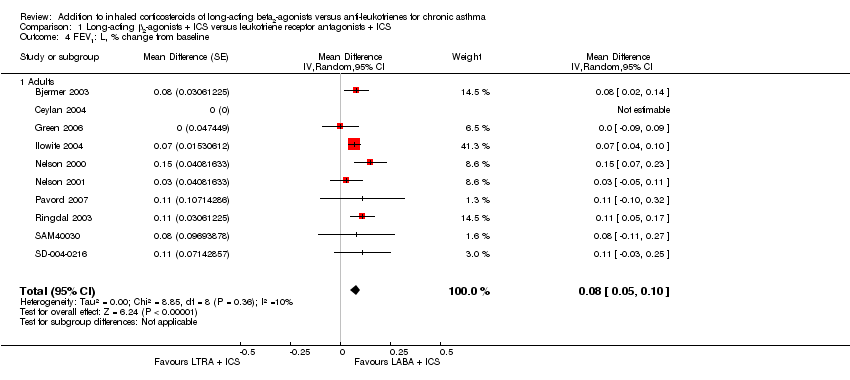
| 4 FEV1: L, % change from baseline Show forest plot | 10 | | Mean Difference (Random, 95% CI) | 0.08 [0.05, 0.10] |
|
| 4.1 Adults | 10 | | Mean Difference (Random, 95% CI) | 0.08 [0.05, 0.10] |
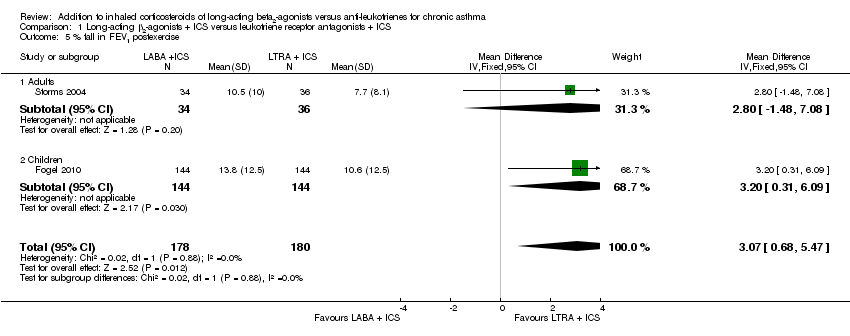
| 5 % fall in FEV1 postexercise Show forest plot | 2 | 358 | Mean Difference (IV, Fixed, 95% CI) | 3.07 [0.68, 5.47] |
|
| 5.1 Adults | 1 | 70 | Mean Difference (IV, Fixed, 95% CI) | 2.8 [‐1.48, 7.08] |
| 5.2 Children | 1 | 288 | Mean Difference (IV, Fixed, 95% CI) | 3.20 [0.31, 6.09] |
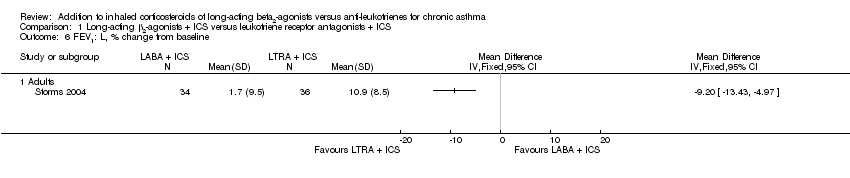
| 6 FEV1: L, % change from baseline Show forest plot | 1 | | Mean Difference (IV, Fixed, 95% CI) | Totals not selected |
|
| 6.1 Adults | 1 | | Mean Difference (IV, Fixed, 95% CI) | 0.0 [0.0, 0.0] |
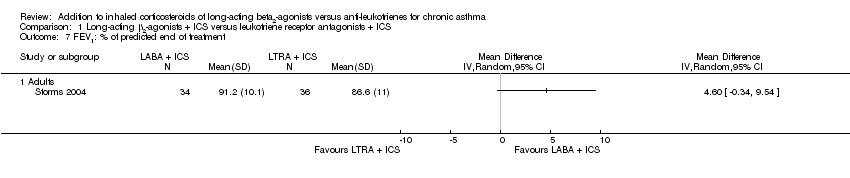
| 7 FEV1: % of predicted end of treatment Show forest plot | 1 | | Mean Difference (IV, Random, 95% CI) | Totals not selected |
|
| 7.1 Adults | 1 | | Mean Difference (IV, Random, 95% CI) | 0.0 [0.0, 0.0] |
| 8 Rescue‐free days: % change from baseline Show forest plot | 5 | 2612 | Mean Difference (IV, Random, 95% CI) | 9.18 [5.39, 12.98] |
|
| 8.1 Adults | 5 | 2612 | Mean Difference (IV, Random, 95% CI) | 9.18 [5.39, 12.98] |
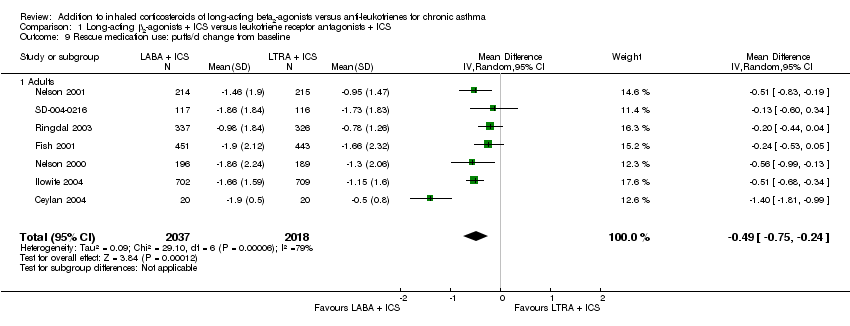
| 9 Rescue medication use: puffs/d change from baseline Show forest plot | 7 | 4055 | Mean Difference (IV, Random, 95% CI) | ‐0.49 [‐0.75, ‐0.24] |
|
| 9.1 Adults | 7 | 4055 | Mean Difference (IV, Random, 95% CI) | ‐0.49 [‐0.75, ‐0.24] |
| 10 Global asthma QoL AQLQ score (higher is better): change from baseline Show forest plot | 4 | 3243 | Std. Mean Difference (IV, Random, 95% CI) | 0.12 [0.05, 0.19] |
|
| 10.1 Adults | 4 | 3243 | Std. Mean Difference (IV, Random, 95% CI) | 0.12 [0.05, 0.19] |
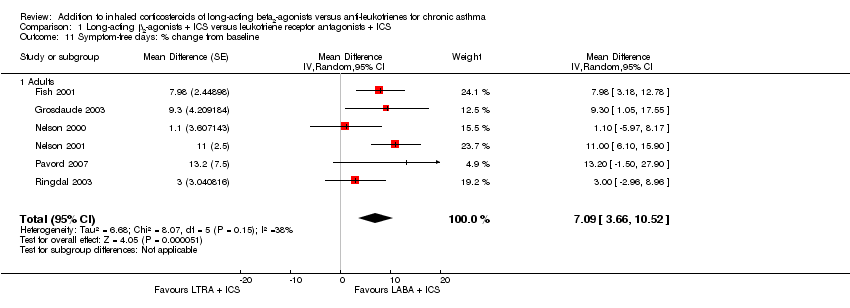
| 11 Symptom‐free days: % change from baseline Show forest plot | 6 | | Mean Difference (Random, 95% CI) | 7.09 [3.66, 10.52] |
|
| 11.1 Adults | 6 | | Mean Difference (Random, 95% CI) | 7.09 [3.66, 10.52] |
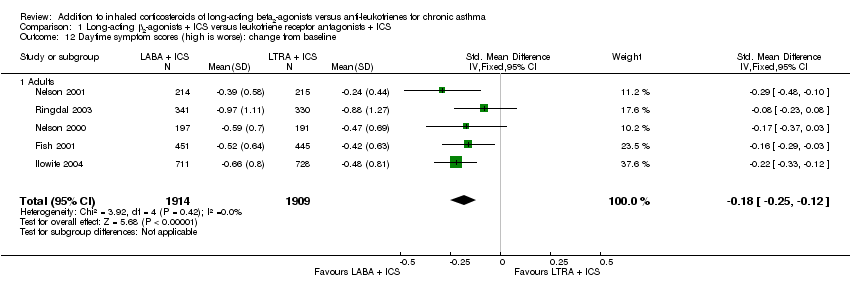
| 12 Daytime symptom scores (high is worse): change from baseline Show forest plot | 5 | 3823 | Std. Mean Difference (IV, Fixed, 95% CI) | ‐0.18 [‐0.25, ‐0.12] |
|
| 12.1 Adults | 5 | 3823 | Std. Mean Difference (IV, Fixed, 95% CI) | ‐0.18 [‐0.25, ‐0.12] |
| 13 Morning symptoms: change from baseline Show forest plot | 1 | | Mean Difference (IV, Fixed, 95% CI) | Totals not selected |
|
| 13.1 Adults | 1 | | Mean Difference (IV, Fixed, 95% CI) | 0.0 [0.0, 0.0] |
| 14 Night‐time symptom score (five‐point scale, higher score is worse): change from baseline Show forest plot | 1 | | Mean Difference (IV, Fixed, 95% CI) | Totals not selected |
|
| 14.1 Adults | 1 | | Mean Difference (IV, Fixed, 95% CI) | 0.0 [0.0, 0.0] |
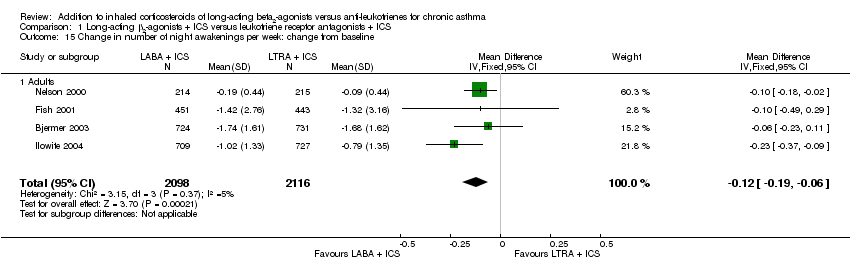
| 15 Change in number of night awakenings per week: change from baseline Show forest plot | 4 | 4214 | Mean Difference (IV, Fixed, 95% CI) | ‐0.12 [‐0.19, ‐0.06] |
|
| 15.1 Adults | 4 | 4214 | Mean Difference (IV, Fixed, 95% CI) | ‐0.12 [‐0.19, ‐0.06] |
| 16 Change in % of nights with no awakenings per week: change from baseline Show forest plot | 2 | 673 | Mean Difference (IV, Fixed, 95% CI) | 6.89 [2.87, 10.91] |
|
| 16.1 Adults | 2 | 673 | Mean Difference (IV, Fixed, 95% CI) | 6.89 [2.87, 10.91] |
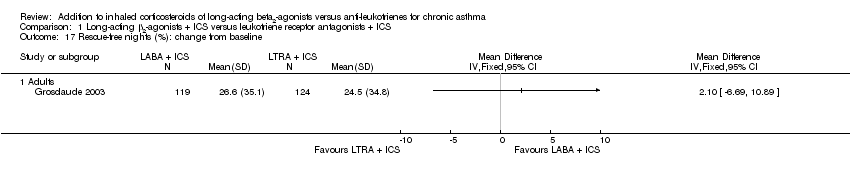
| 17 Rescue‐free nights (%): change from baseline Show forest plot | 1 | | Mean Difference (IV, Fixed, 95% CI) | Totals not selected |
|
| 17.1 Adults | 1 | | Mean Difference (IV, Fixed, 95% CI) | 0.0 [0.0, 0.0] |
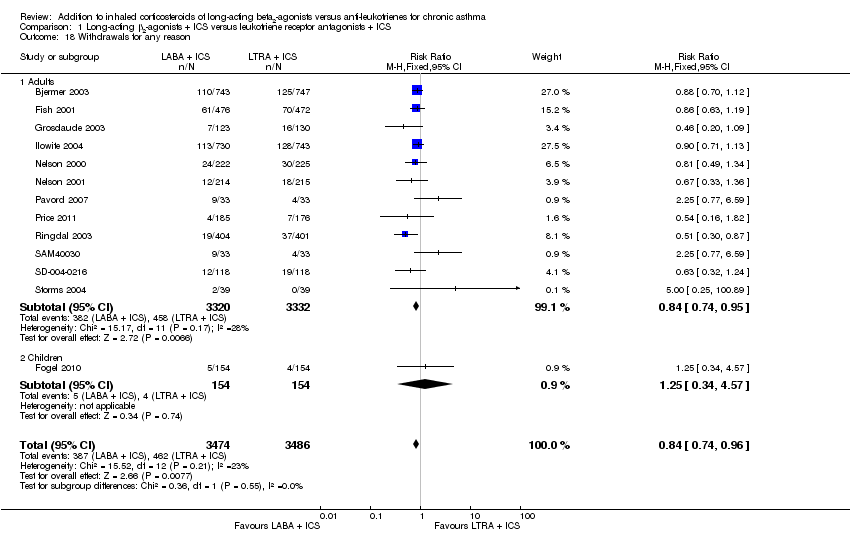
| 18 Withdrawals for any reason Show forest plot | 13 | 6960 | Risk Ratio (M‐H, Fixed, 95% CI) | 0.84 [0.74, 0.96] |
|
| 18.1 Adults | 12 | 6652 | Risk Ratio (M‐H, Fixed, 95% CI) | 0.84 [0.74, 0.95] |
| 18.2 Children | 1 | 308 | Risk Ratio (M‐H, Fixed, 95% CI) | 1.25 [0.34, 4.57] |
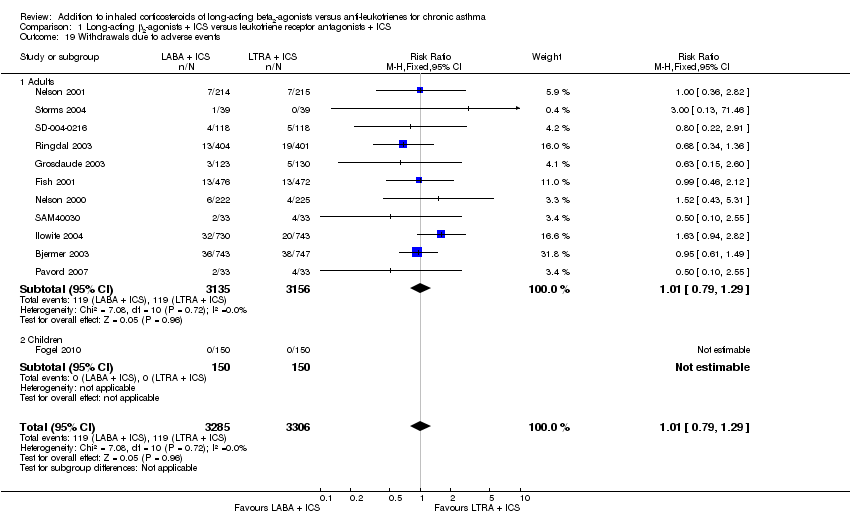
| 19 Withdrawals due to adverse events Show forest plot | 12 | 6591 | Risk Ratio (M‐H, Fixed, 95% CI) | 1.01 [0.79, 1.29] |
|
| 19.1 Adults | 11 | 6291 | Risk Ratio (M‐H, Fixed, 95% CI) | 1.01 [0.79, 1.29] |
| 19.2 Children | 1 | 300 | Risk Ratio (M‐H, Fixed, 95% CI) | 0.0 [0.0, 0.0] |
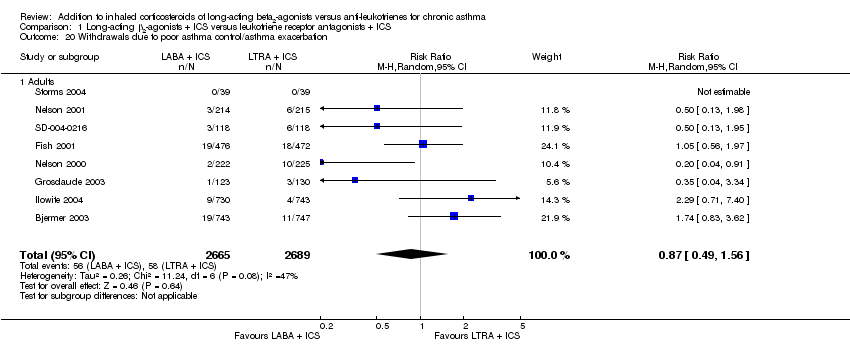
| 20 Withdrawals due to poor asthma control/asthma exacerbation Show forest plot | 8 | 5354 | Risk Ratio (M‐H, Random, 95% CI) | 0.87 [0.49, 1.56] |
|
| 20.1 Adults | 8 | 5354 | Risk Ratio (M‐H, Random, 95% CI) | 0.87 [0.49, 1.56] |
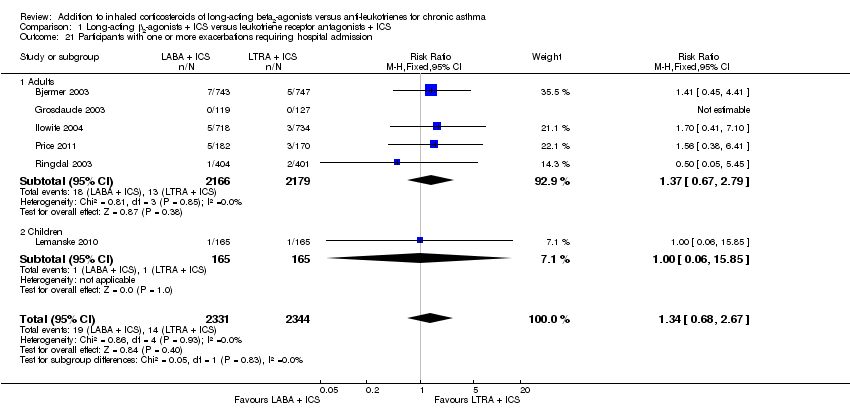
| 21 Participants with one or more exacerbations requiring hospital admission Show forest plot | 6 | 4675 | Risk Ratio (M‐H, Fixed, 95% CI) | 1.34 [0.68, 2.67] |
|
| 21.1 Adults | 5 | 4345 | Risk Ratio (M‐H, Fixed, 95% CI) | 1.37 [0.67, 2.79] |
| 21.2 Children | 1 | 330 | Risk Ratio (M‐H, Fixed, 95% CI) | 1.0 [0.06, 15.85] |
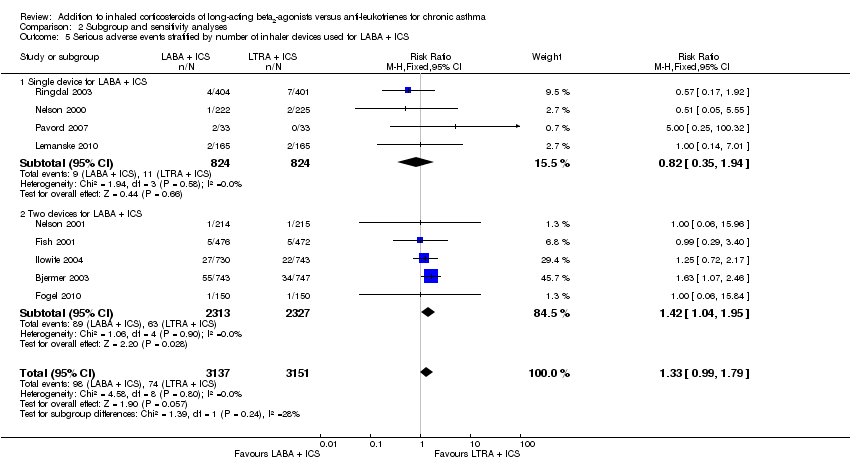
| 22 Serious adverse events Show forest plot | 9 | 6288 | Risk Ratio (M‐H, Fixed, 95% CI) | 1.33 [0.99, 1.79] |
|
| 22.1 Adults | 7 | 5658 | Risk Ratio (M‐H, Fixed, 95% CI) | 1.35 [1.00, 1.82] |
| 22.2 Children | 2 | 630 | Risk Ratio (M‐H, Fixed, 95% CI) | 1.0 [0.20, 4.91] |
| 23 Death Show forest plot | 1 | | Risk Ratio (M‐H, Fixed, 95% CI) | Totals not selected |
|
| 23.1 Adults | 1 | | Risk Ratio (M‐H, Fixed, 95% CI) | 0.0 [0.0, 0.0] |
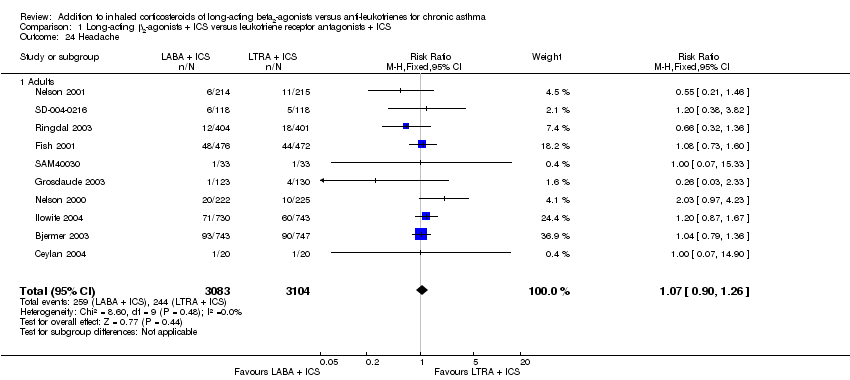
| 24 Headache Show forest plot | 10 | 6187 | Risk Ratio (M‐H, Fixed, 95% CI) | 1.07 [0.90, 1.26] |
|
| 24.1 Adults | 10 | 6187 | Risk Ratio (M‐H, Fixed, 95% CI) | 1.07 [0.90, 1.26] |
| 25 Cardiovascular events Show forest plot | 5 | 5163 | Risk Ratio (M‐H, Fixed, 95% CI) | 1.09 [0.77, 1.53] |
|
| 25.1 Adults | 5 | 5163 | Risk Ratio (M‐H, Fixed, 95% CI) | 1.09 [0.77, 1.53] |
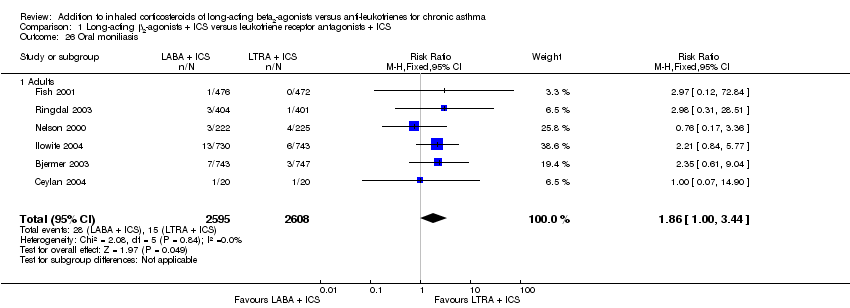
| 26 Oral moniliasis Show forest plot | 6 | 5203 | Risk Ratio (M‐H, Fixed, 95% CI) | 1.86 [1.00, 3.44] |
|
| 26.1 Adults | 6 | 5203 | Risk Ratio (M‐H, Fixed, 95% CI) | 1.86 [1.00, 3.44] |
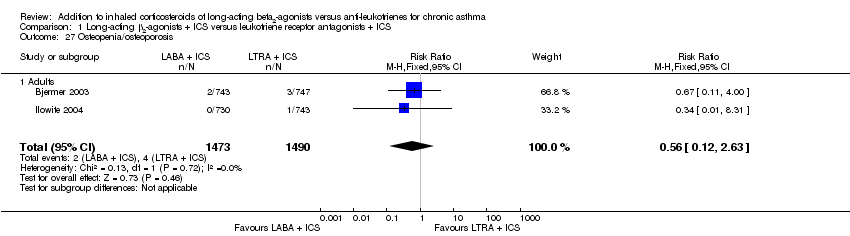
| 27 Osteopenia/osteoporosis Show forest plot | 2 | 2963 | Risk Ratio (M‐H, Fixed, 95% CI) | 0.56 [0.12, 2.63] |
|
| 27.1 Adults | 2 | 2963 | Risk Ratio (M‐H, Fixed, 95% CI) | 0.56 [0.12, 2.63] |
| 28 Elevated liver enzymes Show forest plot | 1 | | Risk Ratio (M‐H, Fixed, 95% CI) | Totals not selected |
|
| 28.1 Adults | 1 | | Risk Ratio (M‐H, Fixed, 95% CI) | 0.0 [0.0, 0.0] |
| 29 Overall adverse events Show forest plot | 10 | 6277 | Risk Ratio (M‐H, Fixed, 95% CI) | 1.02 [0.99, 1.06] |
|
| 29.1 Adults | 9 | 5977 | Risk Ratio (M‐H, Fixed, 95% CI) | 1.03 [0.99, 1.07] |
| 29.2 Children | 1 | 300 | Risk Ratio (M‐H, Fixed, 95% CI) | 0.79 [0.47, 1.31] |
| 30 Participants' treatment satisfaction Show forest plot | 3 | 2020 | Risk Ratio (M‐H, Random, 95% CI) | 1.12 [1.04, 1.20] |
|
| 30.1 Adults | 3 | 2020 | Risk Ratio (M‐H, Random, 95% CI) | 1.12 [1.04, 1.20] |
| 31 Participants switched/received additional treatment Show forest plot | 1 | 342 | Risk Ratio (M‐H, Random, 95% CI) | 0.01 [0.00, 0.16] |
|
| 31.1 Adults | 1 | 342 | Risk Ratio (M‐H, Random, 95% CI) | 0.01 [0.00, 0.16] |
| 32 Change from baseline in serum eosinophils (× 109/L) Show forest plot | 2 | 2787 | Mean Difference (IV, Fixed, 95% CI) | 0.04 [0.02, 0.05] |
|
| 32.1 Adults | 2 | 2787 | Mean Difference (IV, Fixed, 95% CI) | 0.04 [0.02, 0.05] |