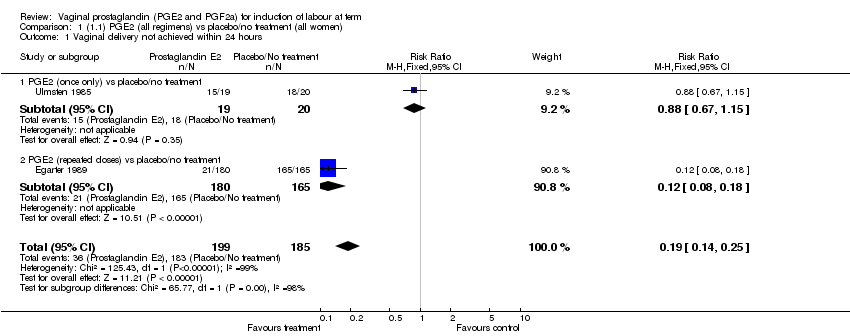
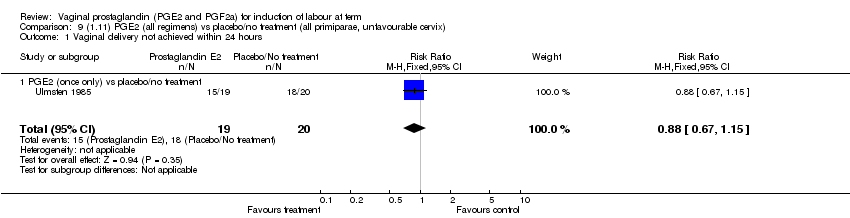
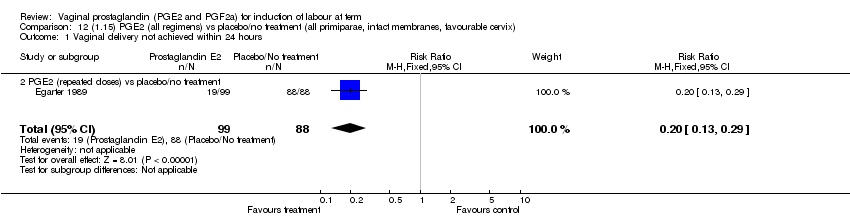
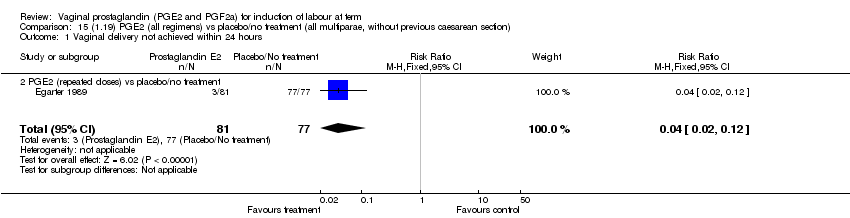
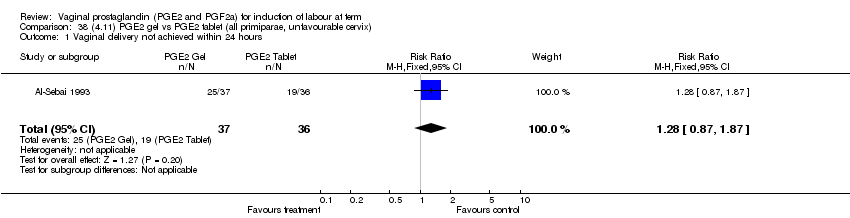
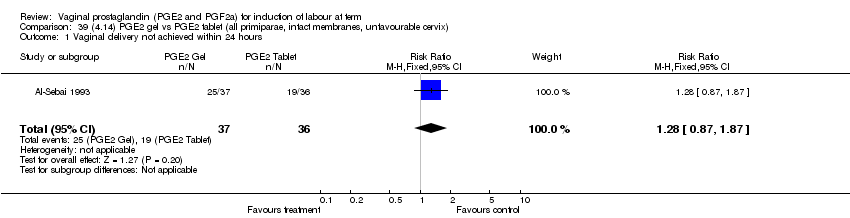
| 1 Vaginal delivery not achieved within 24 hours Show forest plot | 2 | 384 | Risk Ratio (M‐H, Fixed, 95% CI) | 0.19 [0.14, 0.25] |
|
| 1.1 PGE2 (once only) vs placebo/no treatment | 1 | 39 | Risk Ratio (M‐H, Fixed, 95% CI) | 0.88 [0.67, 1.15] |
| 1.2 PGE2 (repeated doses) vs placebo/no treatment | 1 | 345 | Risk Ratio (M‐H, Fixed, 95% CI) | 0.12 [0.08, 0.18] |
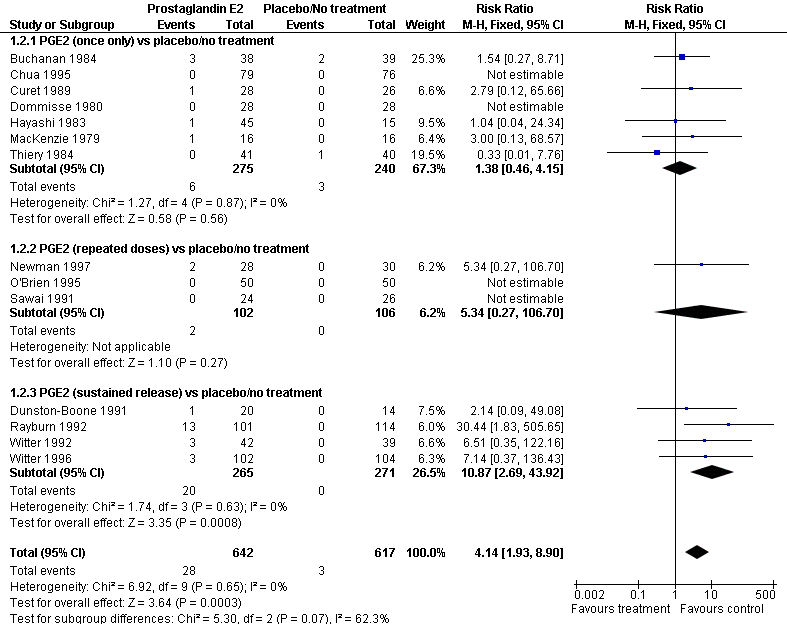
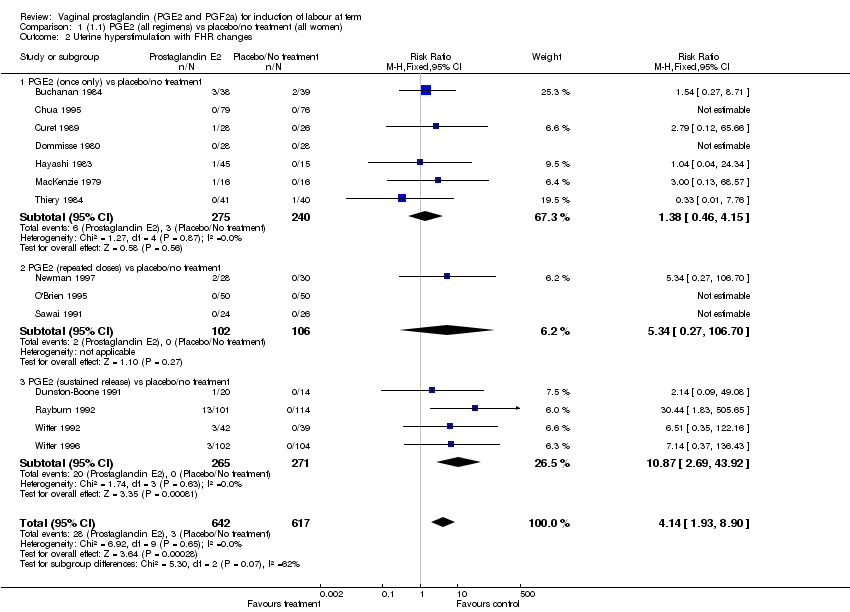
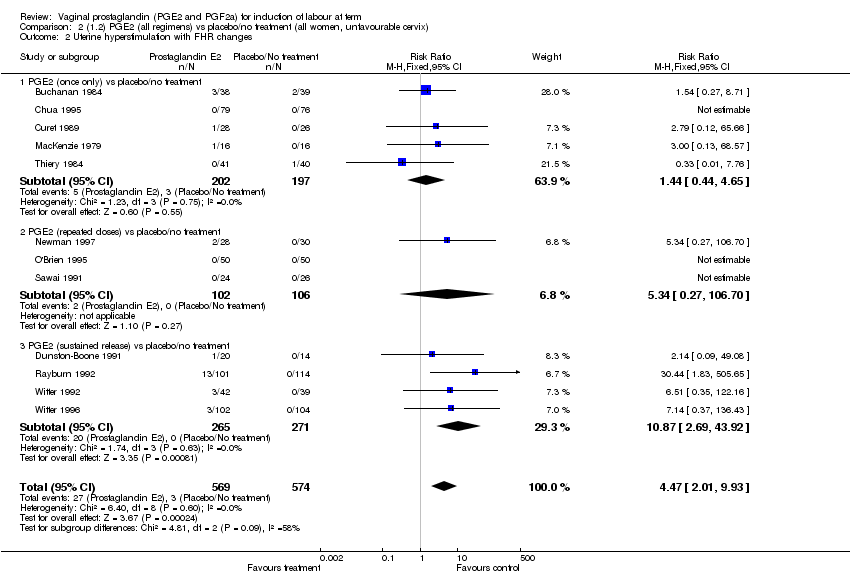
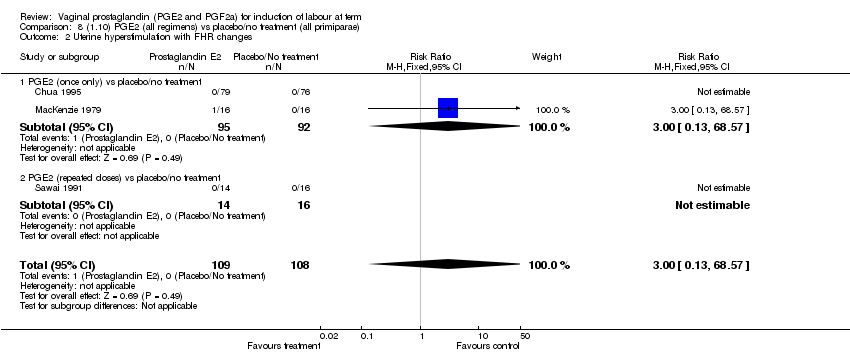
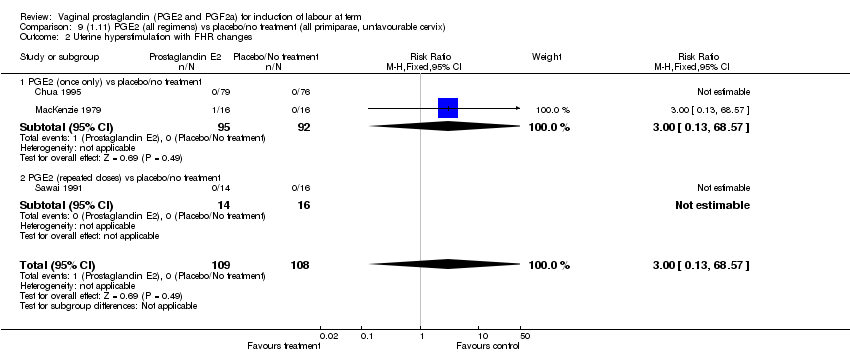
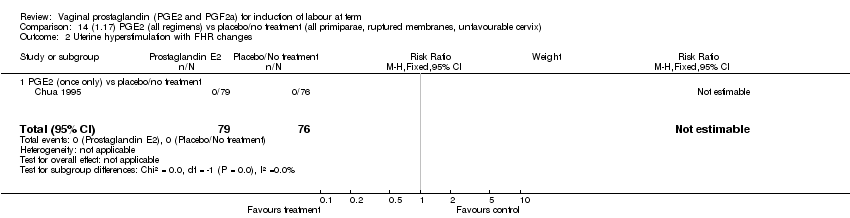
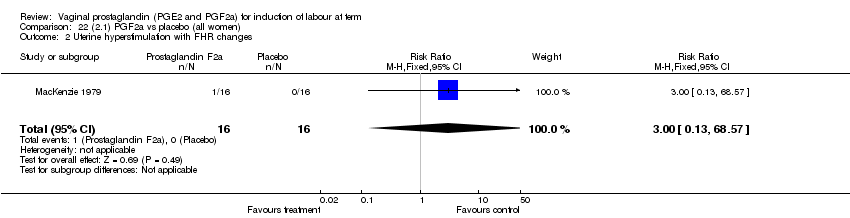
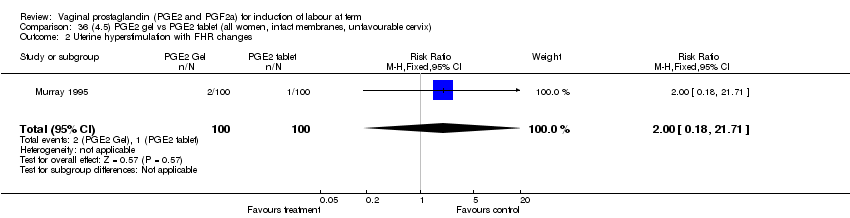
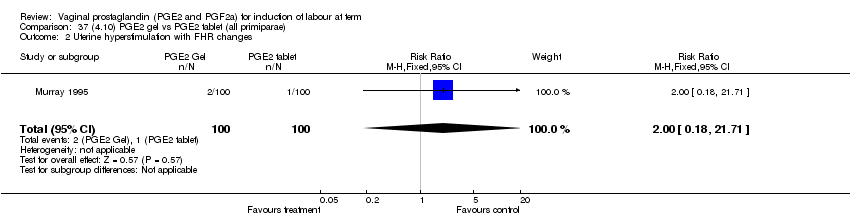
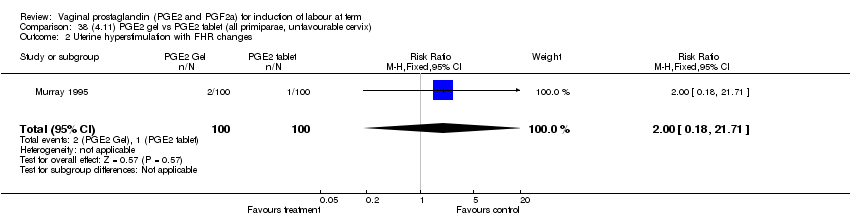
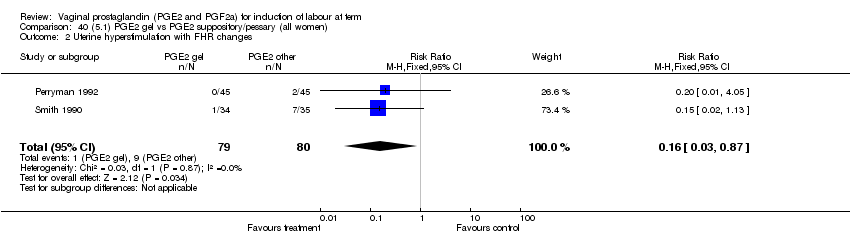
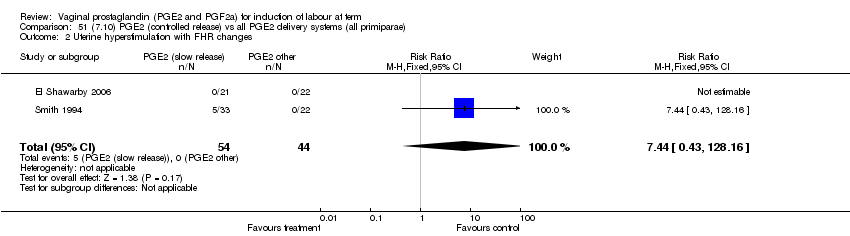
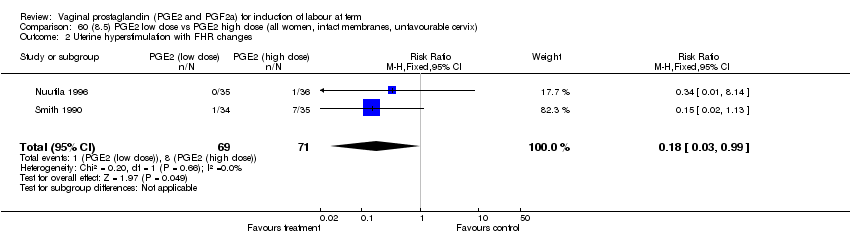
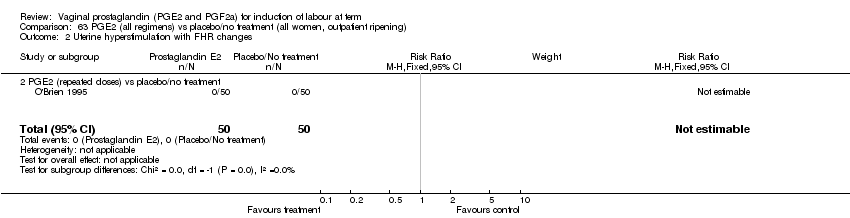
| 2 Uterine hyperstimulation with FHR changes Show forest plot | 14 | 1259 | Risk Ratio (M‐H, Fixed, 95% CI) | 4.14 [1.93, 8.90] |
|
| 2.1 PGE2 (once only) vs placebo/no treatment | 7 | 515 | Risk Ratio (M‐H, Fixed, 95% CI) | 1.38 [0.46, 4.15] |
| 2.2 PGE2 (repeated doses) vs placebo/no treatment | 3 | 208 | Risk Ratio (M‐H, Fixed, 95% CI) | 5.34 [0.27, 106.70] |
| 2.3 PGE2 (sustained release) vs placebo/no treatment | 4 | 536 | Risk Ratio (M‐H, Fixed, 95% CI) | 10.87 [2.69, 43.92] |
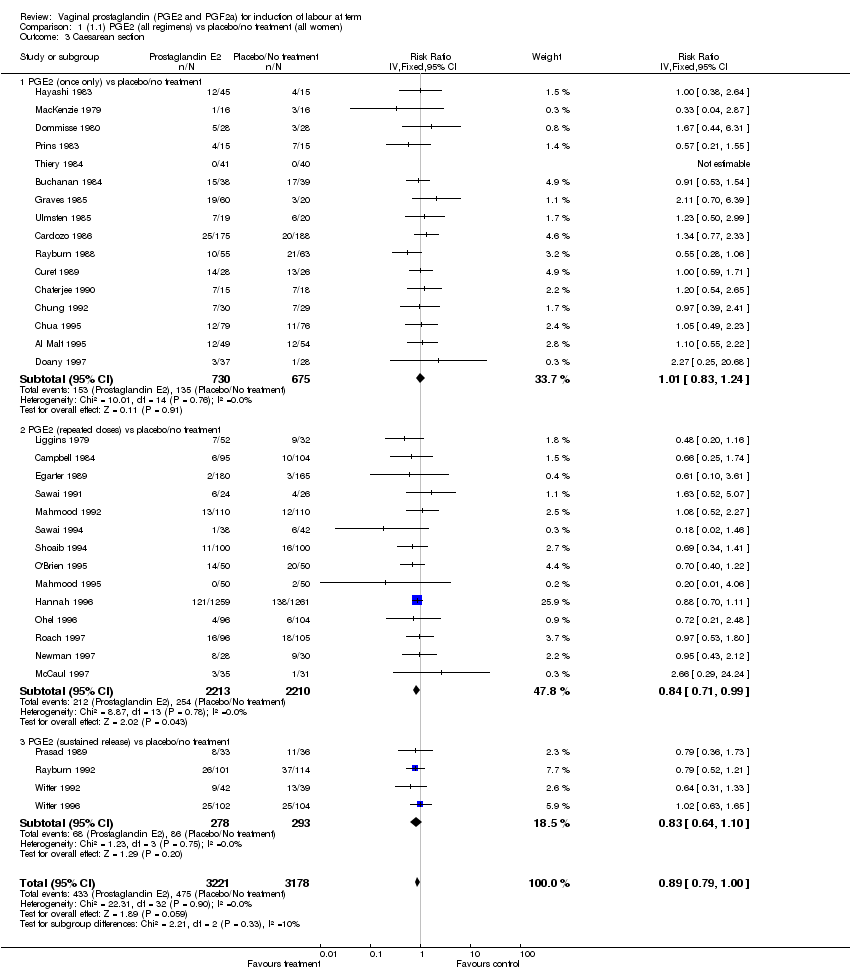
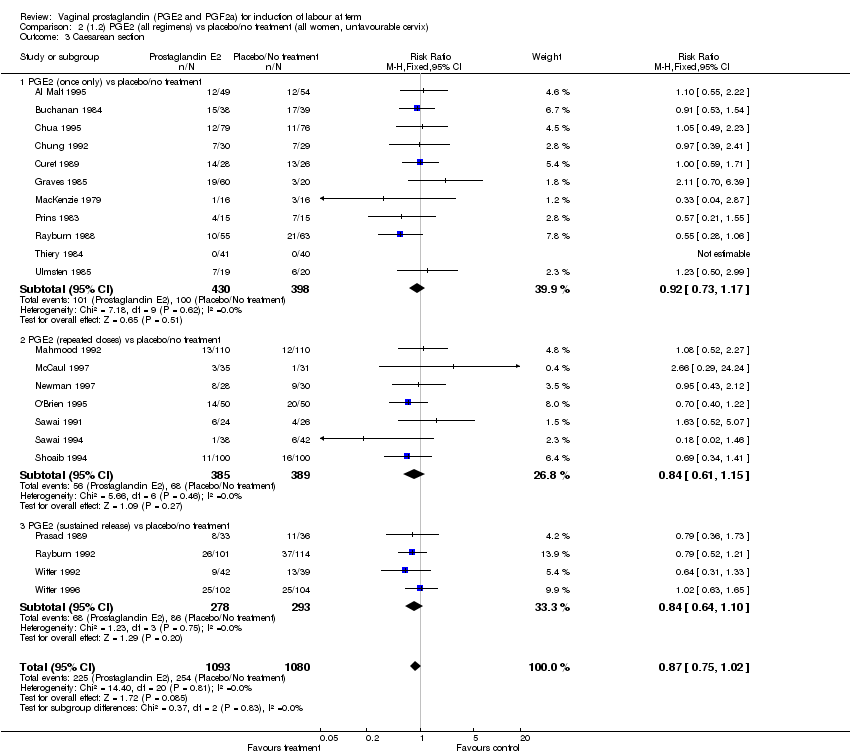
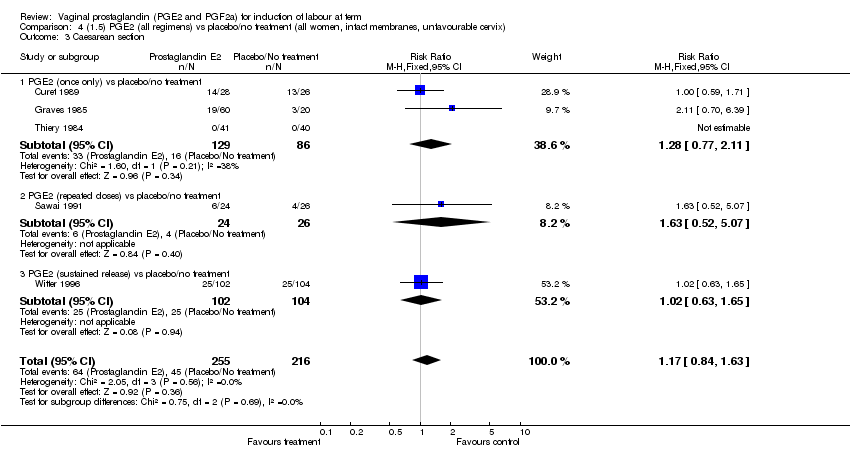
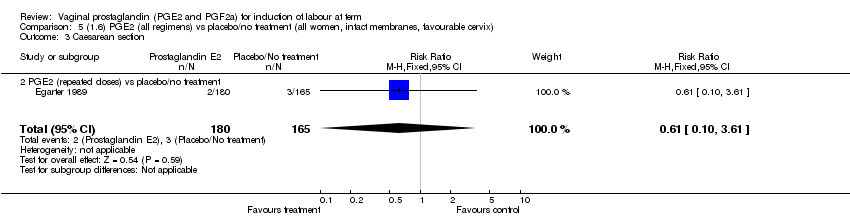
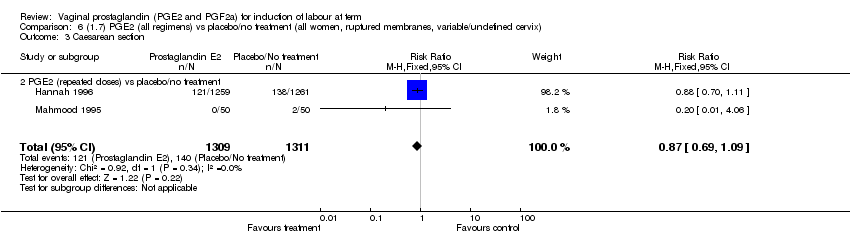
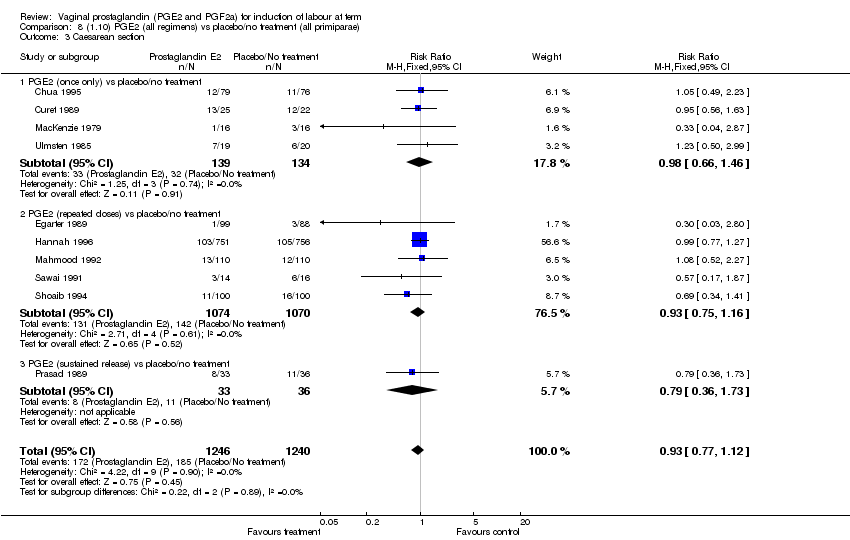
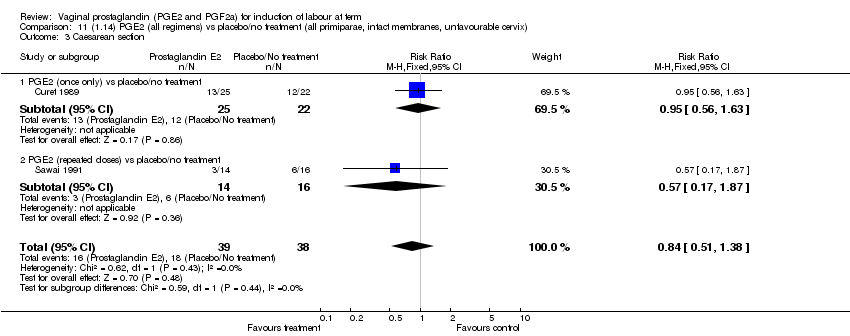
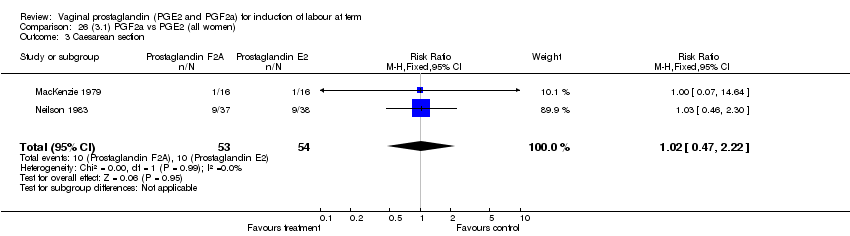
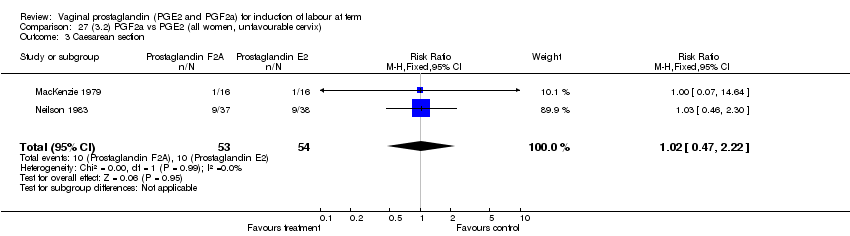
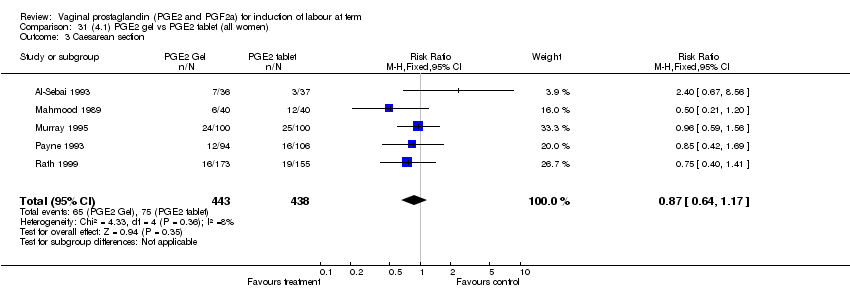
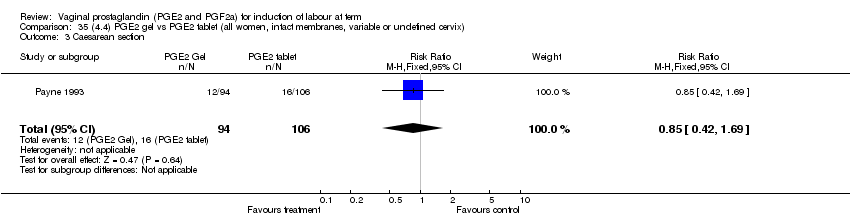
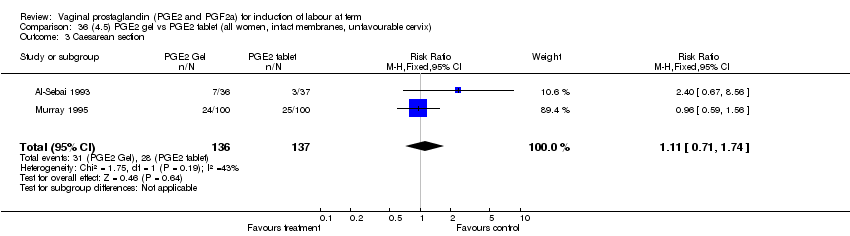
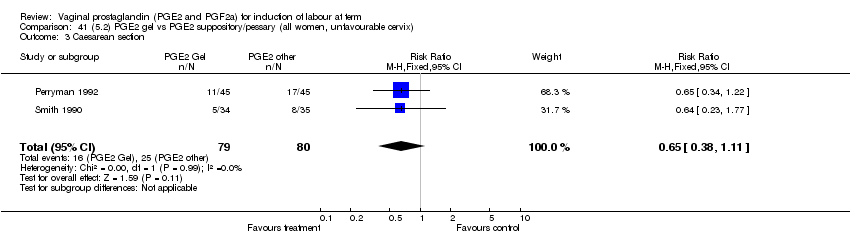
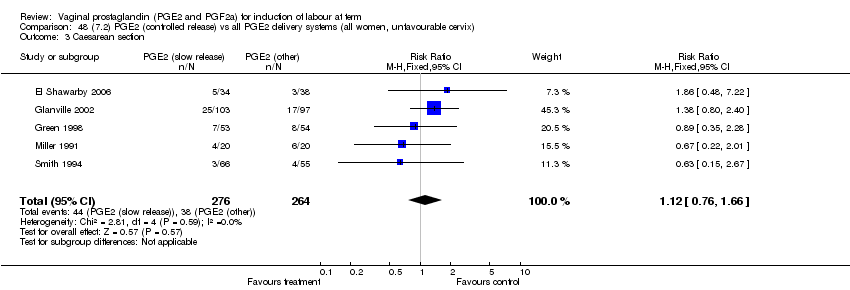
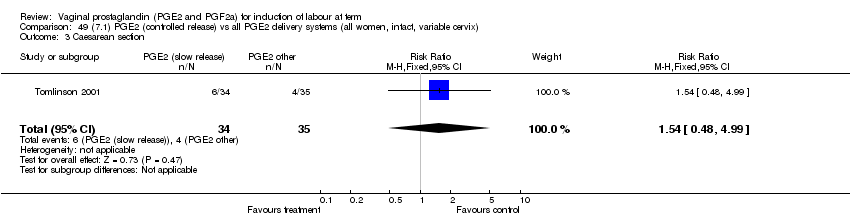
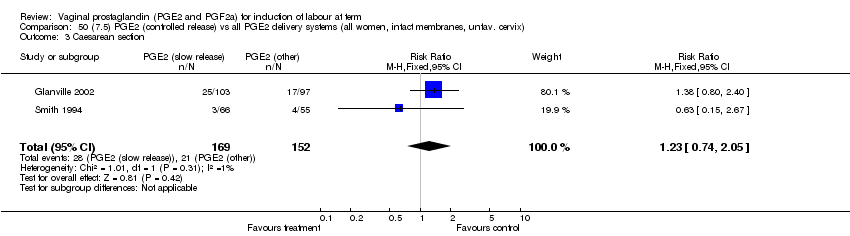
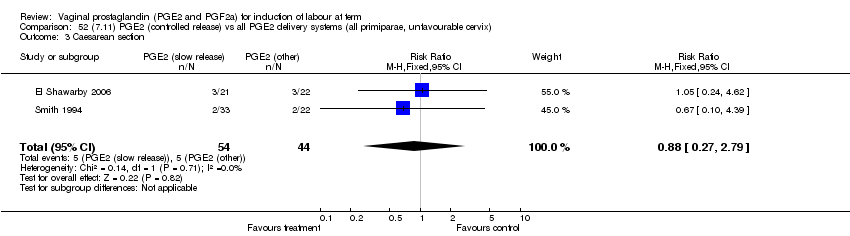
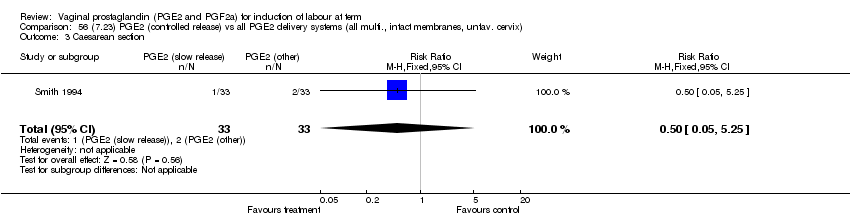
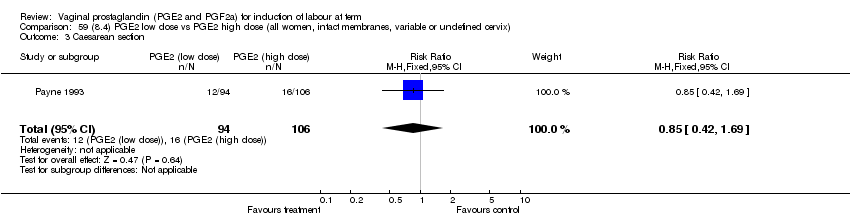
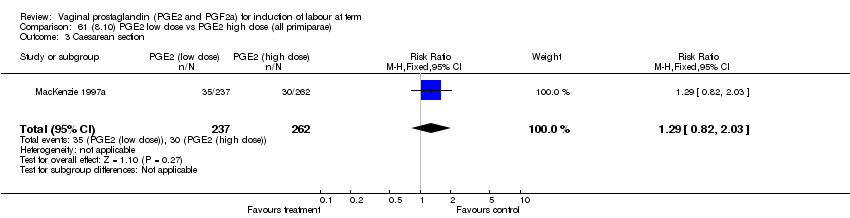
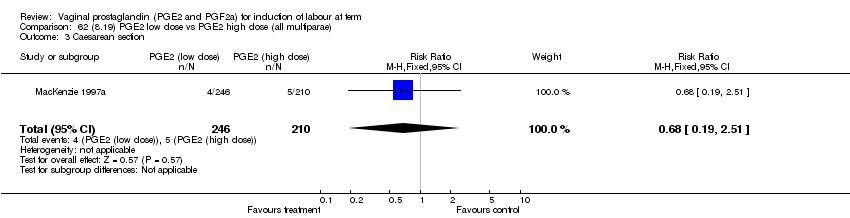
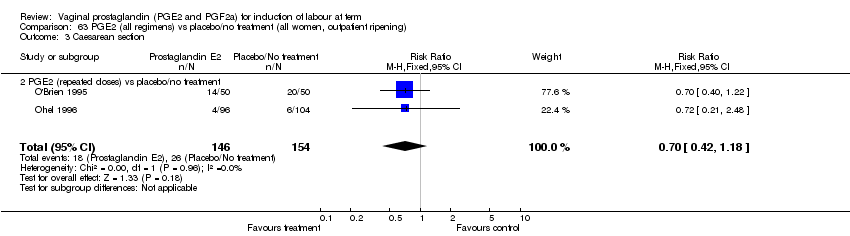
| 3 Caesarean section Show forest plot | 34 | 6399 | Risk Ratio (IV, Fixed, 95% CI) | 0.89 [0.79, 1.00] |
|
| 3.1 PGE2 (once only) vs placebo/no treatment | 16 | 1405 | Risk Ratio (IV, Fixed, 95% CI) | 1.01 [0.83, 1.24] |
| 3.2 PGE2 (repeated doses) vs placebo/no treatment | 14 | 4423 | Risk Ratio (IV, Fixed, 95% CI) | 0.84 [0.71, 0.99] |
| 3.3 PGE2 (sustained release) vs placebo/no treatment | 4 | 571 | Risk Ratio (IV, Fixed, 95% CI) | 0.83 [0.64, 1.10] |
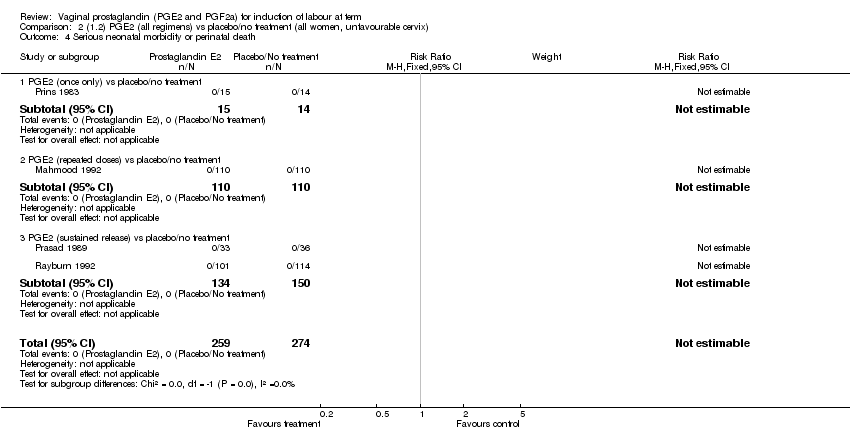
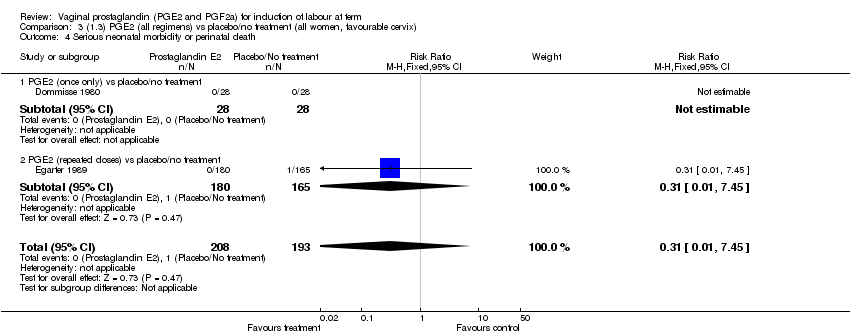
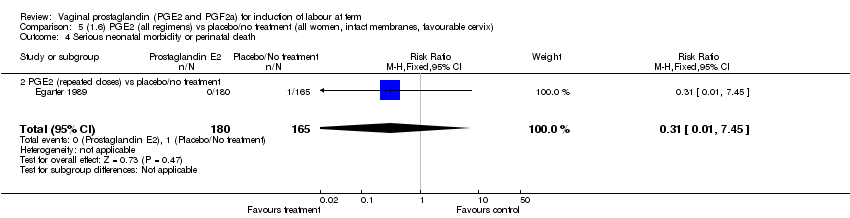
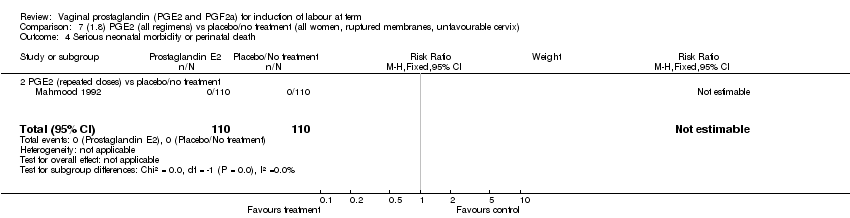
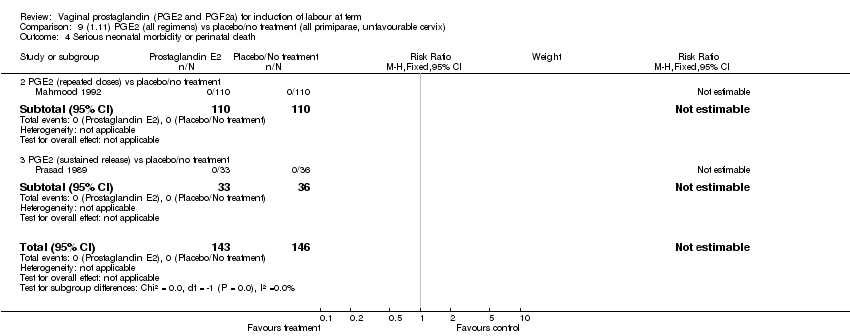
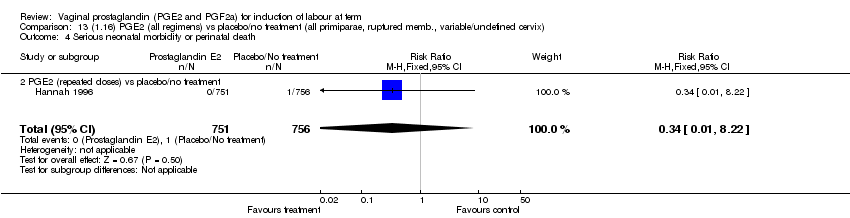
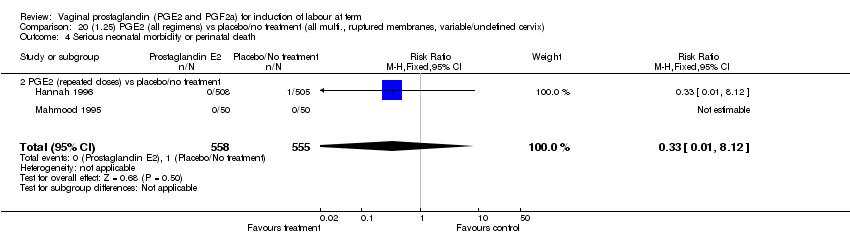
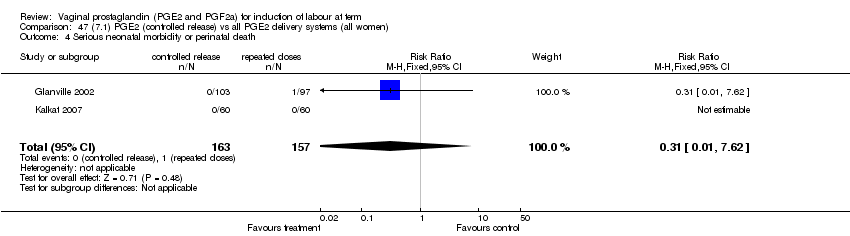
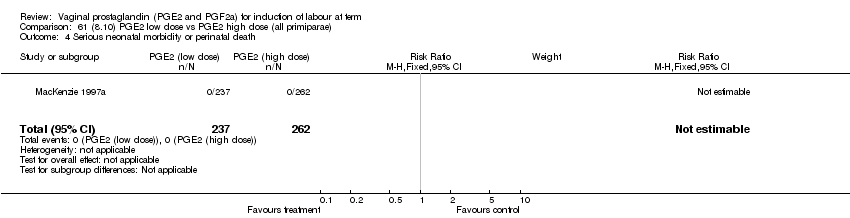
| 4 Serious neonatal morbidity or perinatal death Show forest plot | 9 | 3638 | Risk Ratio (M‐H, Fixed, 95% CI) | 0.46 [0.09, 2.31] |
|
| 4.1 PGE2 (once only) vs placebo/no treatment | 2 | 85 | Risk Ratio (M‐H, Fixed, 95% CI) | 0.0 [0.0, 0.0] |
| 4.2 PGE2 (repeated doses) vs placebo/no treatment | 5 | 3269 | Risk Ratio (M‐H, Fixed, 95% CI) | 0.46 [0.09, 2.31] |
| 4.3 PGE2 (sustained release) vs placebo/no treatment | 2 | 284 | Risk Ratio (M‐H, Fixed, 95% CI) | 0.0 [0.0, 0.0] |
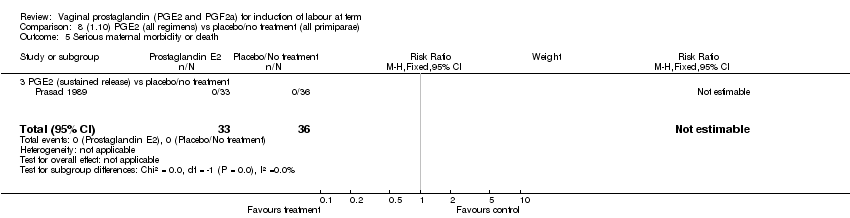
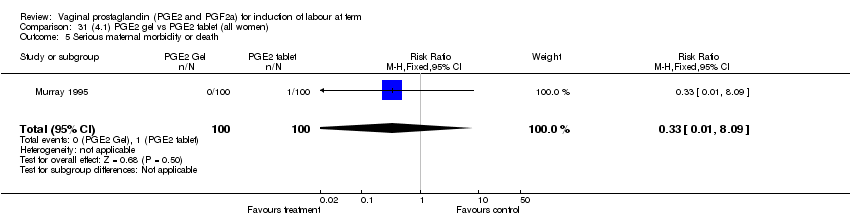
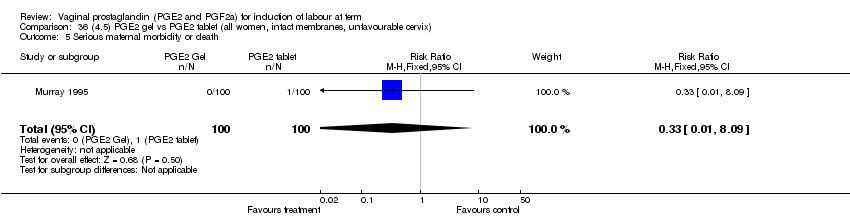
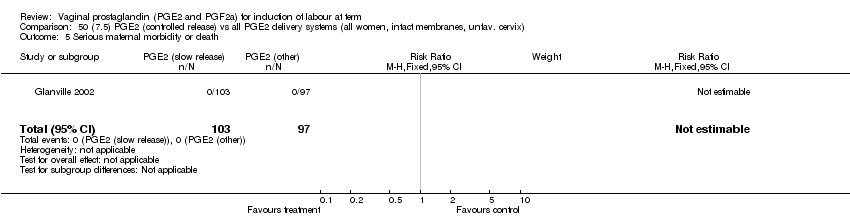
| 5 Serious maternal morbidity or death Show forest plot | 3 | 530 | Risk Ratio (M‐H, Fixed, 95% CI) | 2.23 [0.34, 14.76] |
|
| 5.1 PGE2 (once only) vs placebo | 2 | 461 | Risk Ratio (M‐H, Fixed, 95% CI) | 2.23 [0.34, 14.76] |
| 5.3 PGE2 (sustained release) vs placebo/no treatment | 1 | 69 | Risk Ratio (M‐H, Fixed, 95% CI) | 0.0 [0.0, 0.0] |
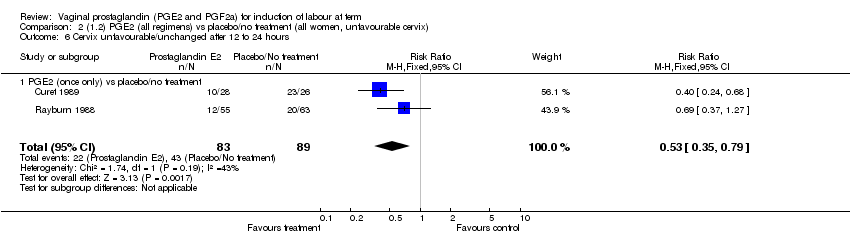
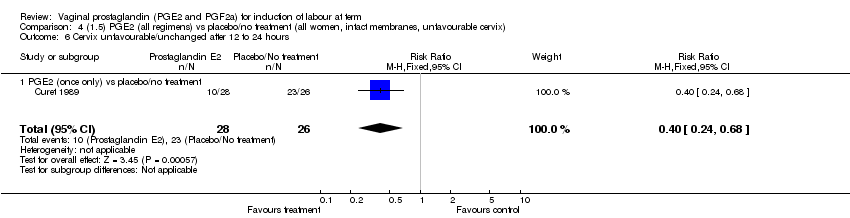
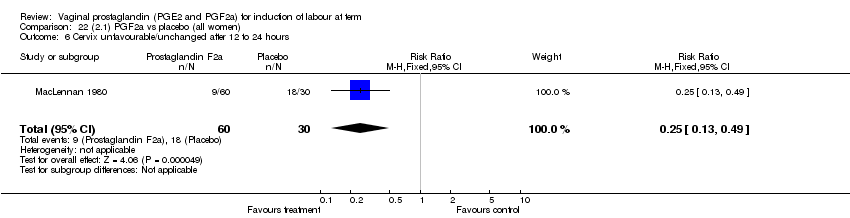
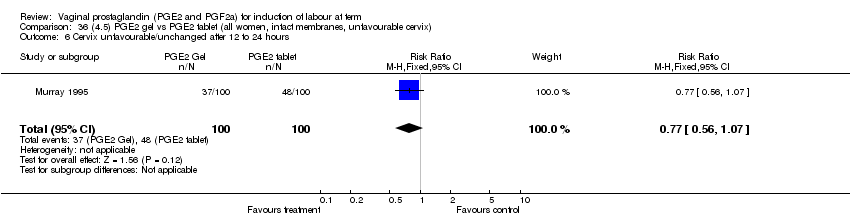
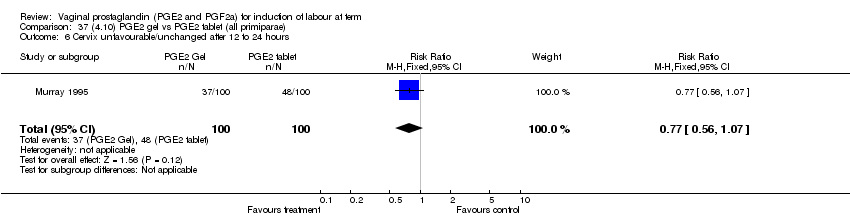
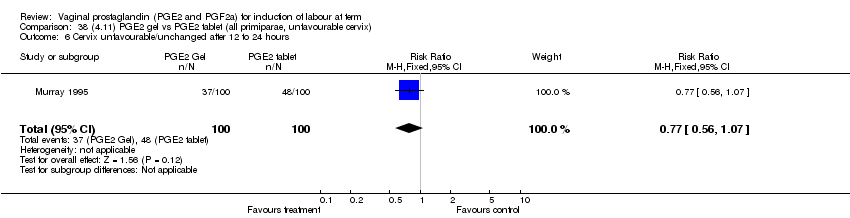
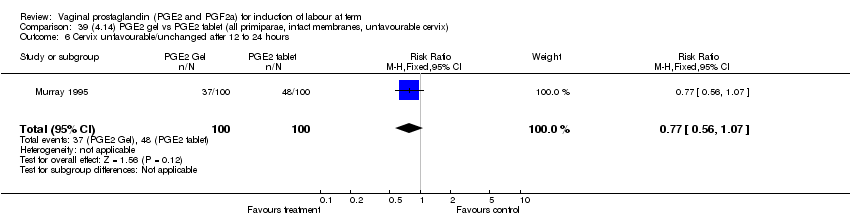
| 6 Cervix unfavourable/unchanged after 12 to 24 hours Show forest plot | 5 | 467 | Risk Ratio (M‐H, Fixed, 95% CI) | 0.46 [0.35, 0.62] |
|
| 6.1 PGE2 (once only) vs placebo/no treatment | 3 | 232 | Risk Ratio (M‐H, Fixed, 95% CI) | 0.55 [0.40, 0.75] |
| 6.2 PGE2 (repeated doses) vs placebo/no treatment | 2 | 235 | Risk Ratio (M‐H, Fixed, 95% CI) | 0.34 [0.19, 0.61] |
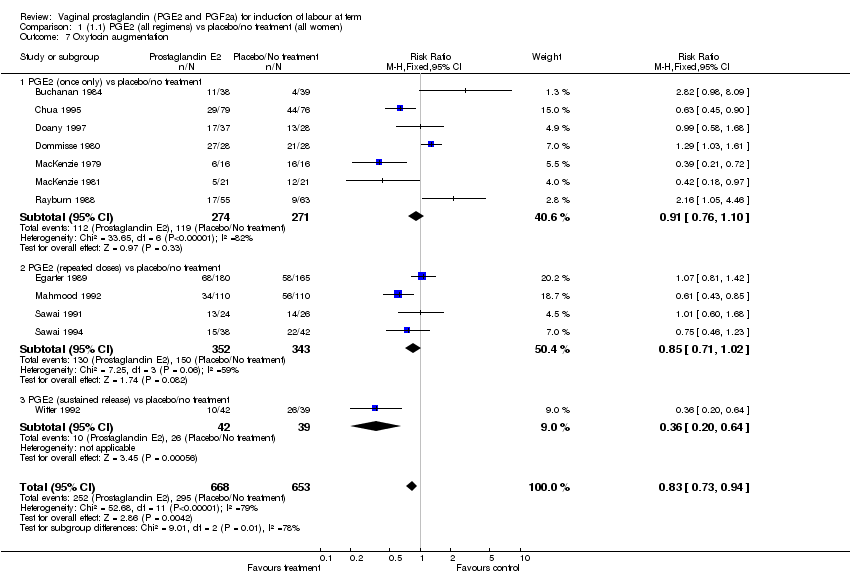
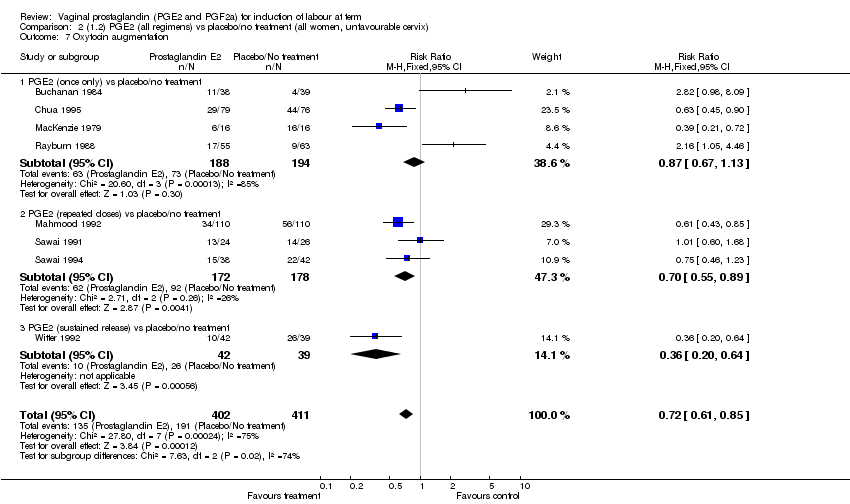
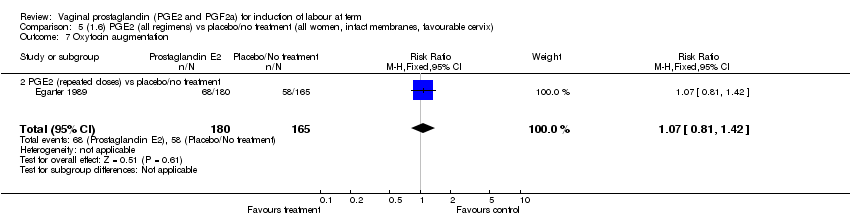
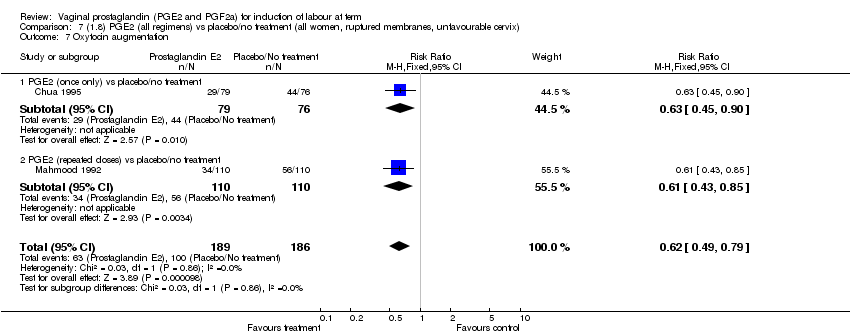
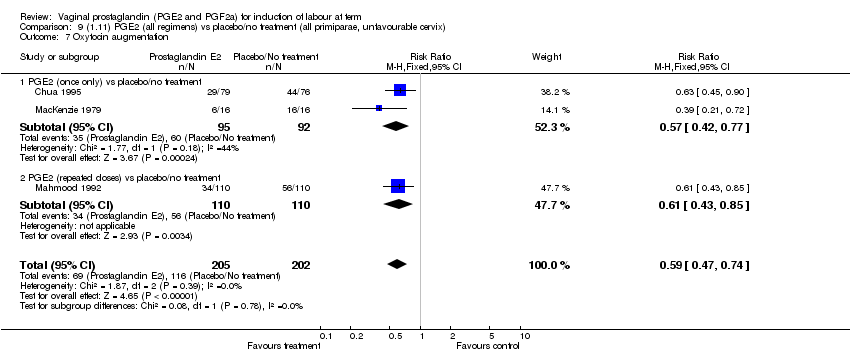
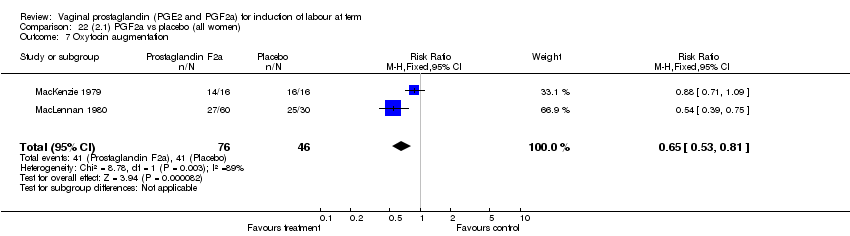
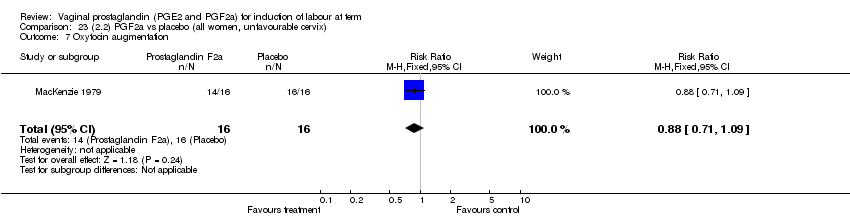
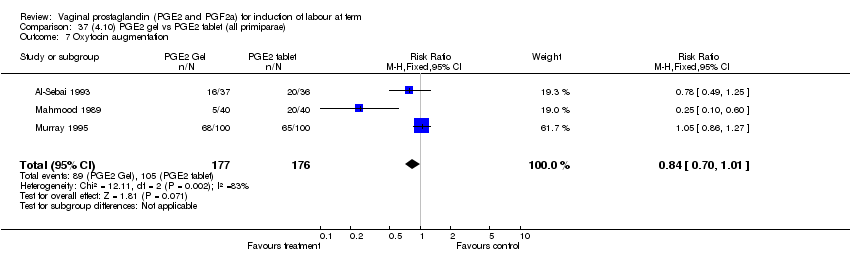
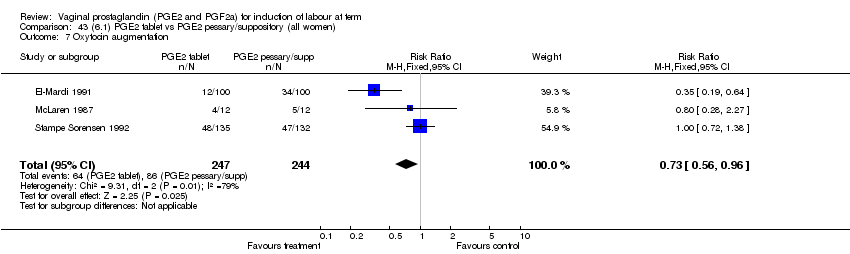
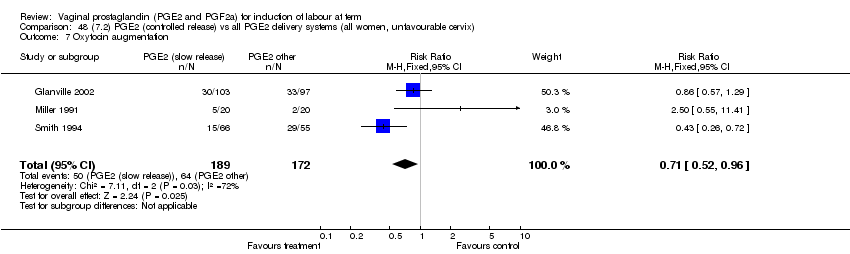
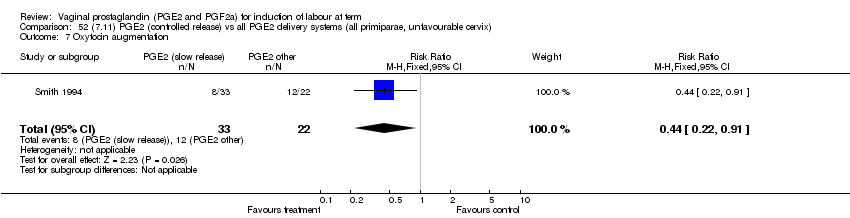
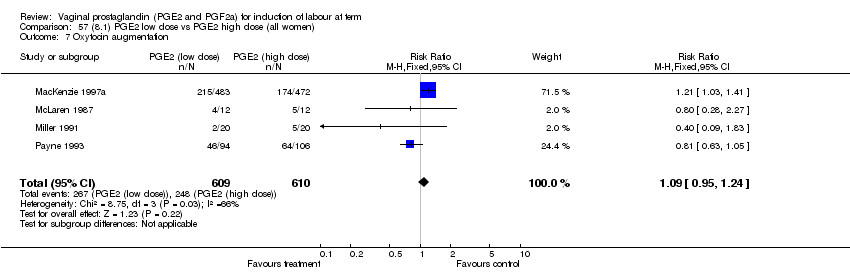
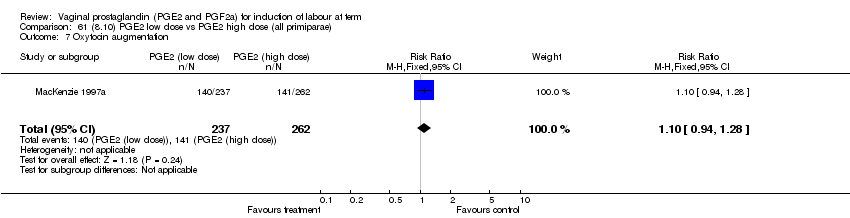
| 7 Oxytocin augmentation Show forest plot | 12 | 1321 | Risk Ratio (M‐H, Fixed, 95% CI) | 0.83 [0.73, 0.94] |
|
| 7.1 PGE2 (once only) vs placebo/no treatment | 7 | 545 | Risk Ratio (M‐H, Fixed, 95% CI) | 0.91 [0.76, 1.10] |
| 7.2 PGE2 (repeated doses) vs placebo/no treatment | 4 | 695 | Risk Ratio (M‐H, Fixed, 95% CI) | 0.85 [0.71, 1.02] |
| 7.3 PGE2 (sustained release) vs placebo/no treatment | 1 | 81 | Risk Ratio (M‐H, Fixed, 95% CI) | 0.36 [0.20, 0.64] |
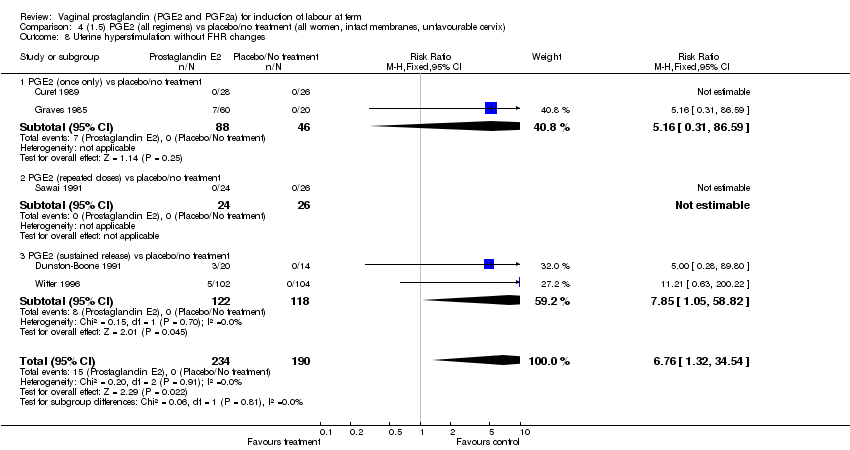
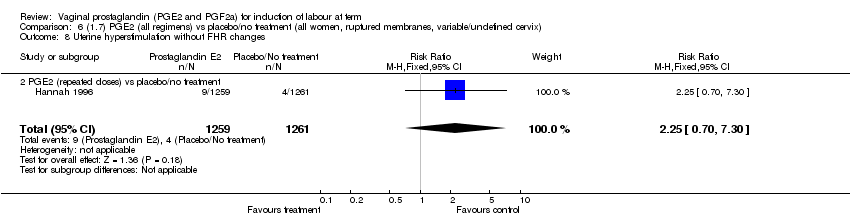
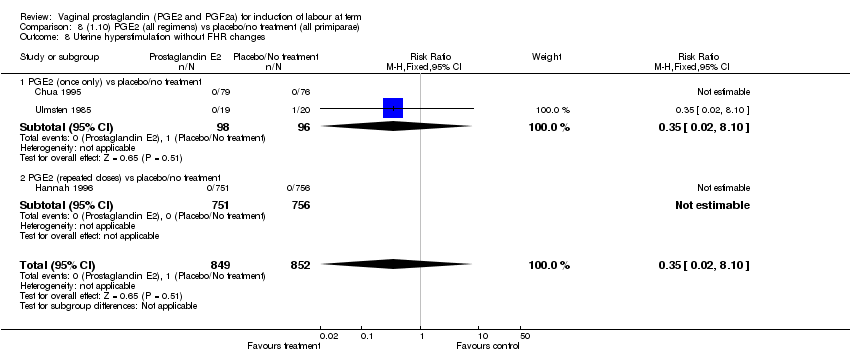
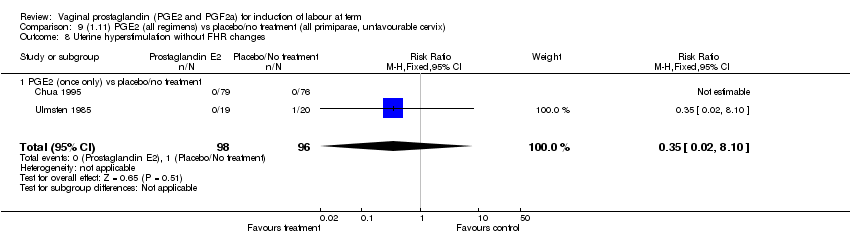
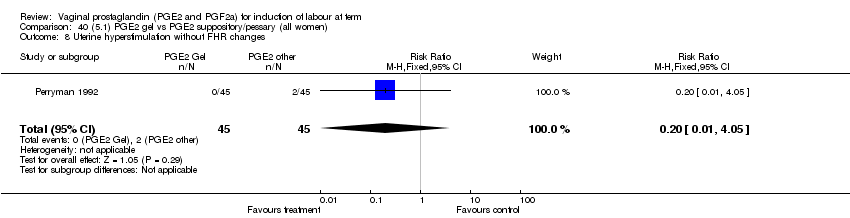
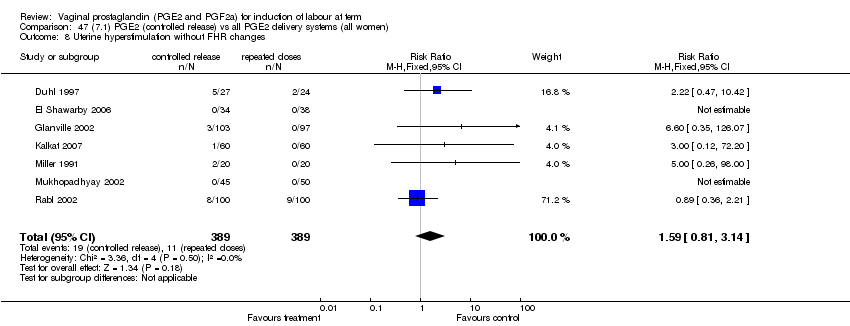
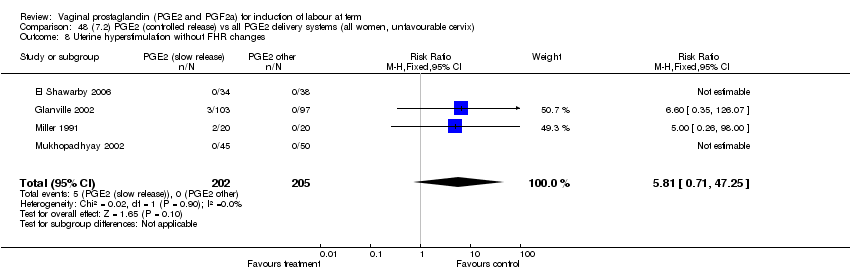
| 8 Uterine hyperstimulation without FHR changes Show forest plot | 13 | 3636 | Risk Ratio (M‐H, Fixed, 95% CI) | 2.48 [1.17, 5.26] |
|
| 8.1 PGE2 (once only) vs placebo/no treatment | 6 | 443 | Risk Ratio (M‐H, Fixed, 95% CI) | 1.26 [0.33, 4.84] |
| 8.2 PGE2 (repeated doses) vs placebo/no treatment | 5 | 2953 | Risk Ratio (M‐H, Fixed, 95% CI) | 2.34 [0.78, 7.03] |
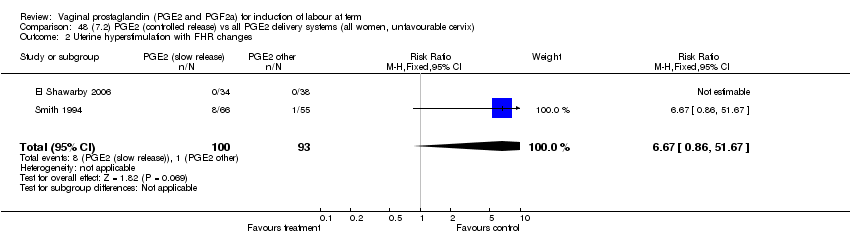
| 8.3 PGE2 (sustained release) vs placebo/no treatment | 2 | 240 | Risk Ratio (M‐H, Fixed, 95% CI) | 7.85 [1.05, 58.82] |
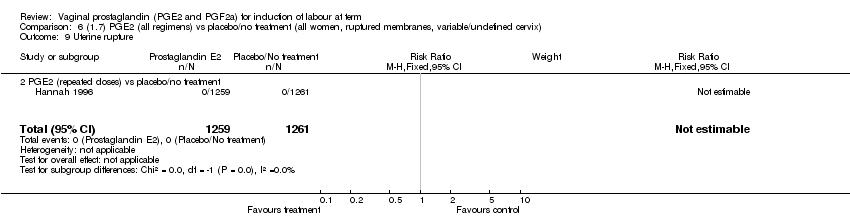
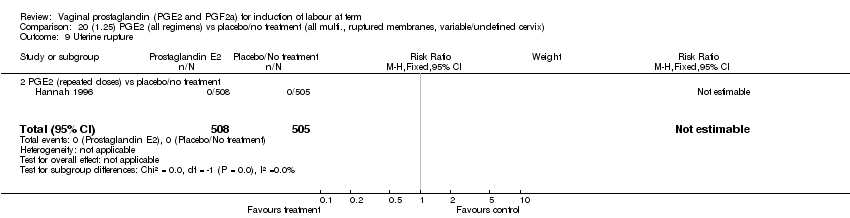
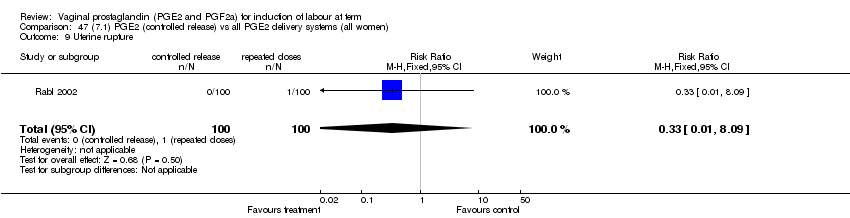
| 9 Uterine rupture Show forest plot | 2 | 2579 | Risk Ratio (M‐H, Fixed, 95% CI) | 2.90 [0.12, 68.50] |
|
| 9.1 PGE2 (once only) vs placebo/no treatment | 1 | 59 | Risk Ratio (M‐H, Fixed, 95% CI) | 2.90 [0.12, 68.50] |
| 9.2 PGE2 (repeated doses) vs placebo/no treatment | 1 | 2520 | Risk Ratio (M‐H, Fixed, 95% CI) | 0.0 [0.0, 0.0] |
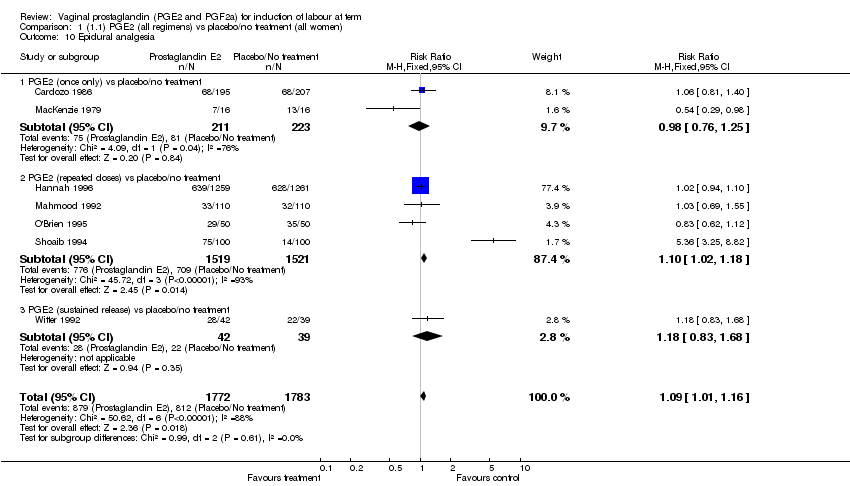
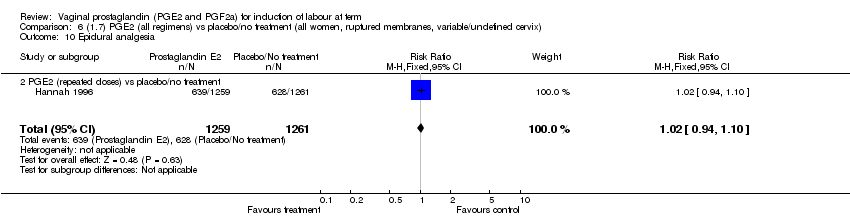
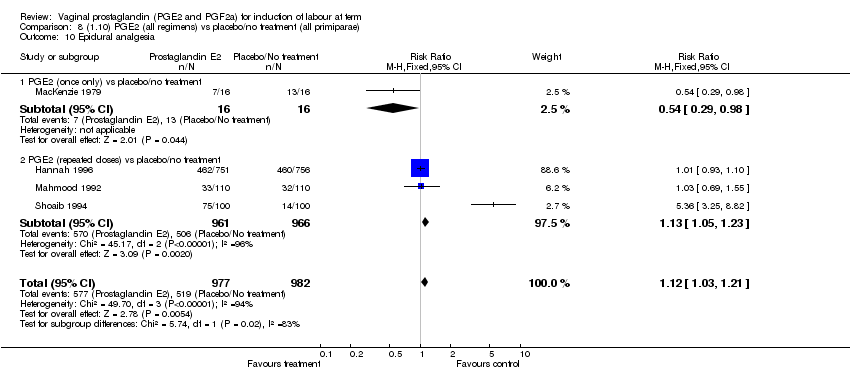
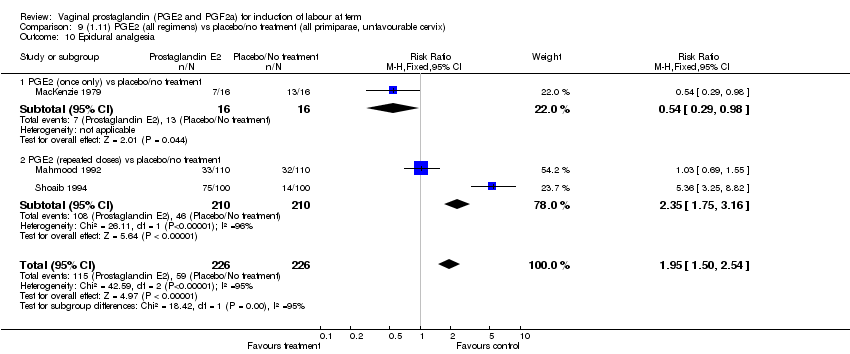
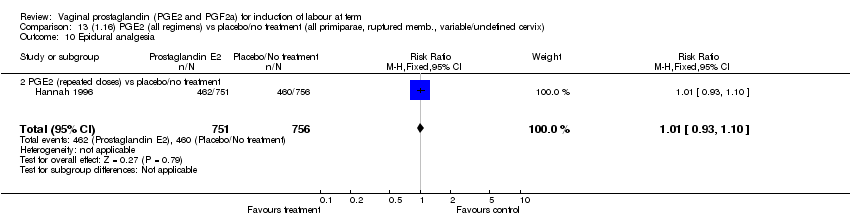
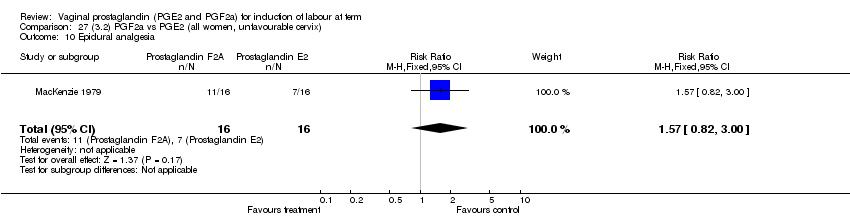
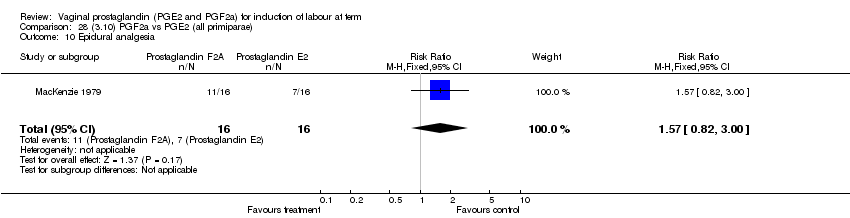
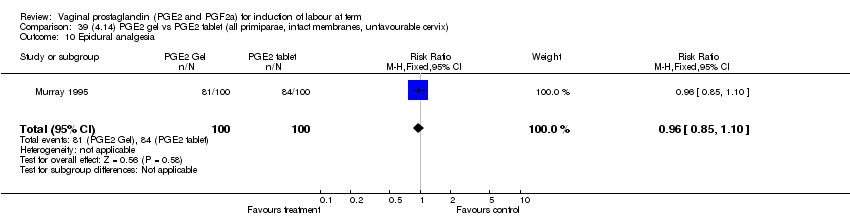
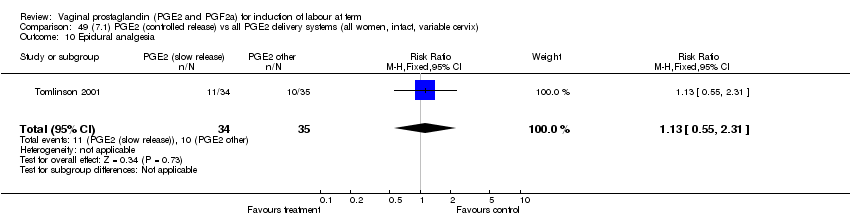
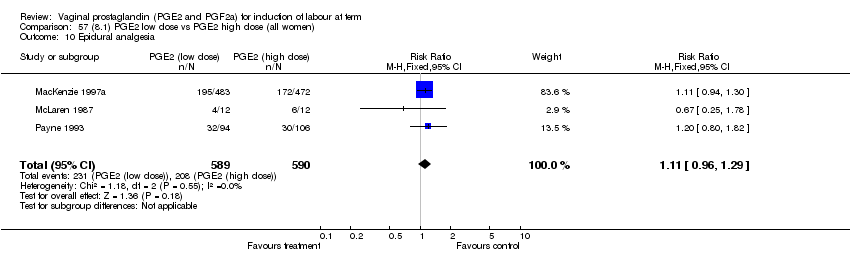
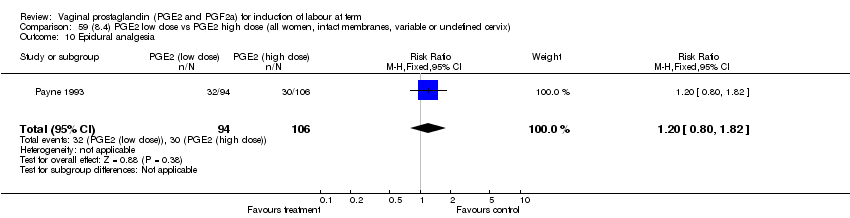
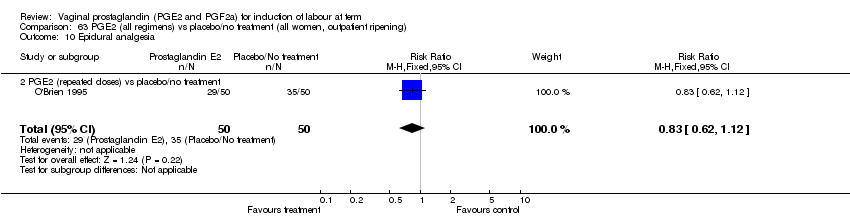
| 10 Epidural analgesia Show forest plot | 7 | 3555 | Risk Ratio (M‐H, Fixed, 95% CI) | 1.09 [1.01, 1.16] |
|
| 10.1 PGE2 (once only) vs placebo/no treatment | 2 | 434 | Risk Ratio (M‐H, Fixed, 95% CI) | 0.98 [0.76, 1.25] |
| 10.2 PGE2 (repeated doses) vs placebo/no treatment | 4 | 3040 | Risk Ratio (M‐H, Fixed, 95% CI) | 1.10 [1.02, 1.18] |
| 10.3 PGE2 (sustained release) vs placebo/no treatment | 1 | 81 | Risk Ratio (M‐H, Fixed, 95% CI) | 1.18 [0.83, 1.68] |
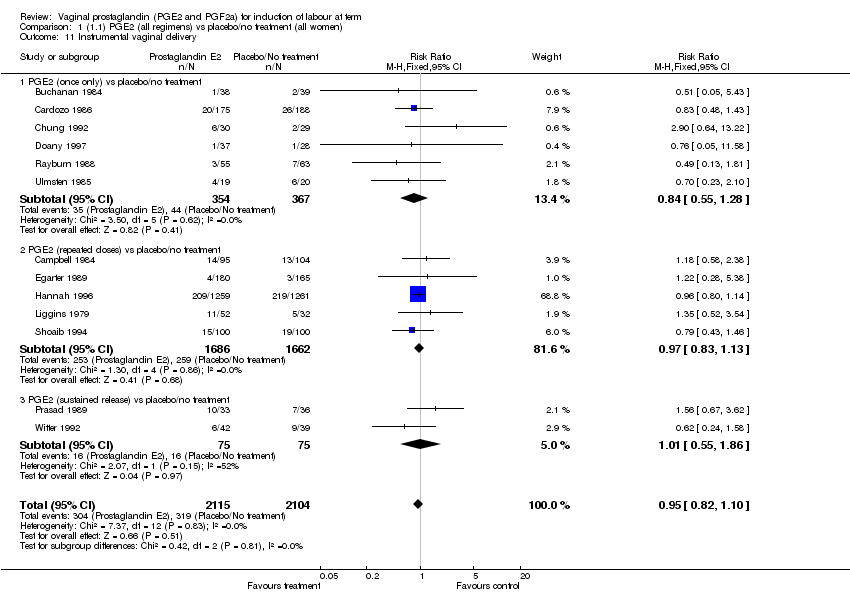
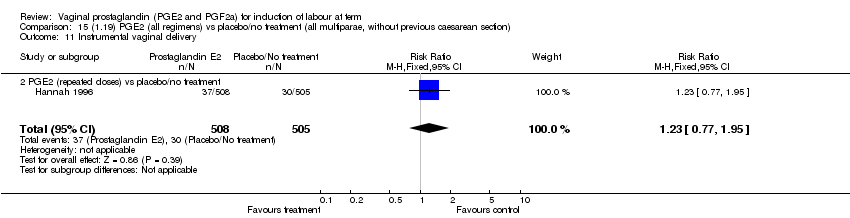
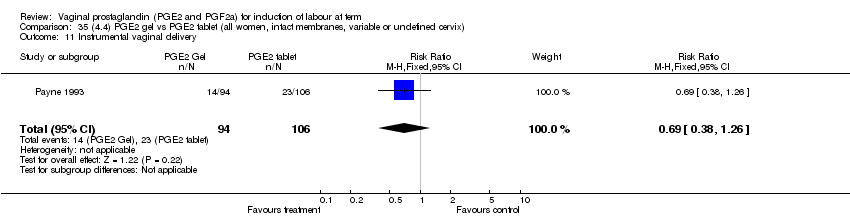
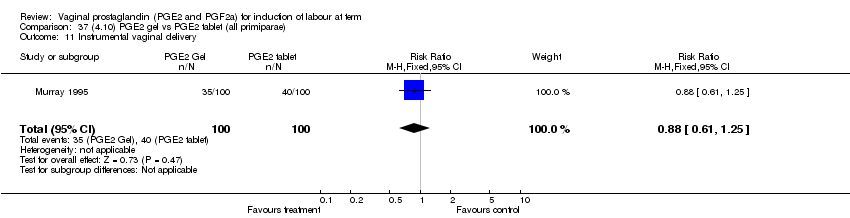
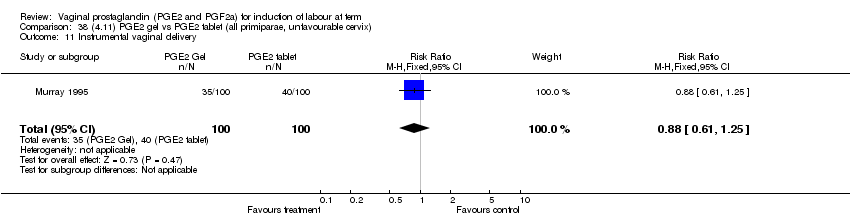
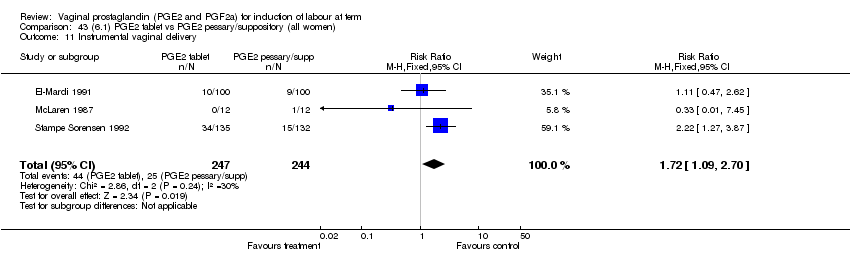
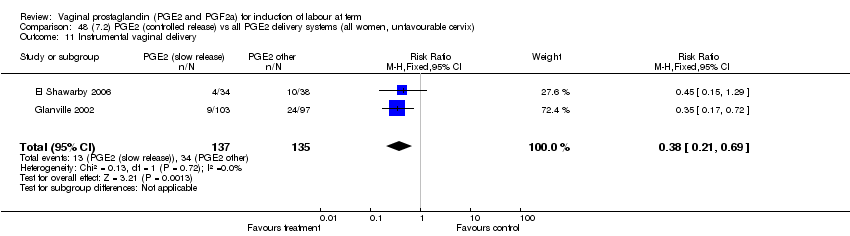
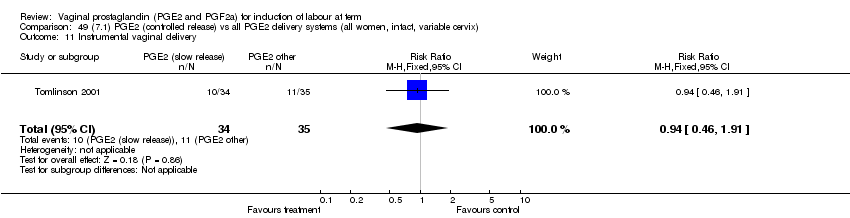
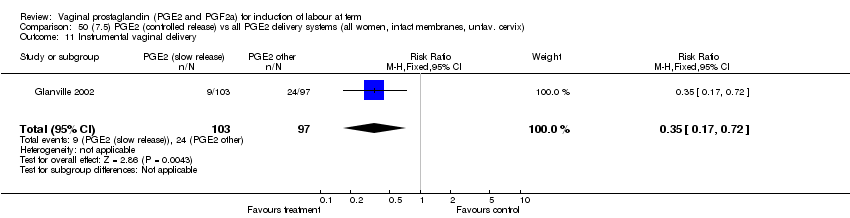
| 11 Instrumental vaginal delivery Show forest plot | 13 | 4219 | Risk Ratio (M‐H, Fixed, 95% CI) | 0.95 [0.82, 1.10] |
|
| 11.1 PGE2 (once only) vs placebo/no treatment | 6 | 721 | Risk Ratio (M‐H, Fixed, 95% CI) | 0.84 [0.55, 1.28] |
| 11.2 PGE2 (repeated doses) vs placebo/no treatment | 5 | 3348 | Risk Ratio (M‐H, Fixed, 95% CI) | 0.97 [0.83, 1.13] |
| 11.3 PGE2 (sustained release) vs placebo/no treatment | 2 | 150 | Risk Ratio (M‐H, Fixed, 95% CI) | 1.01 [0.55, 1.86] |
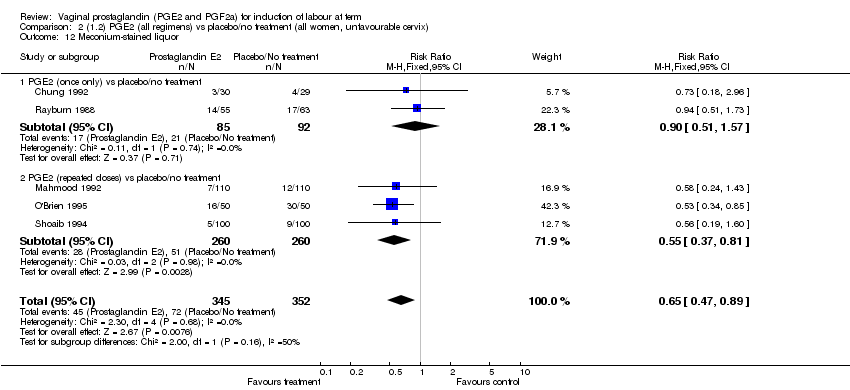
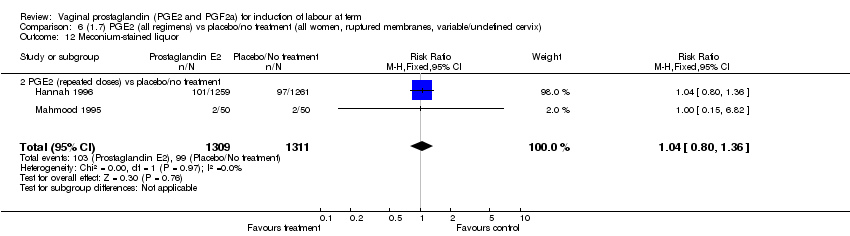
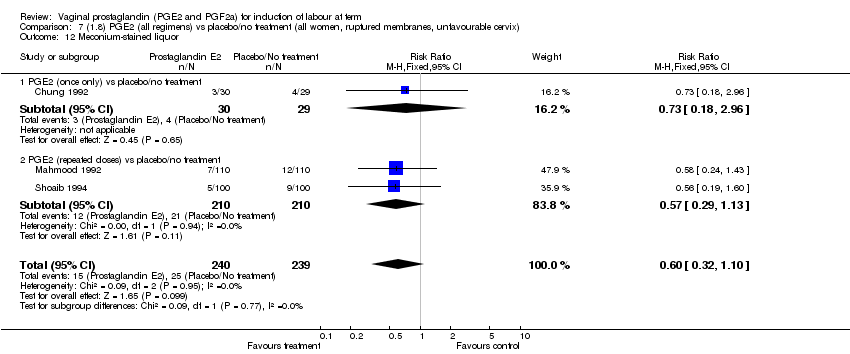
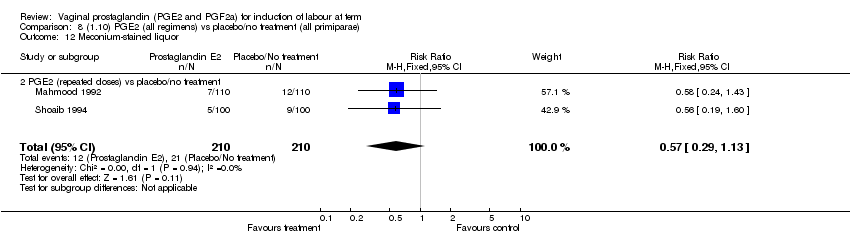
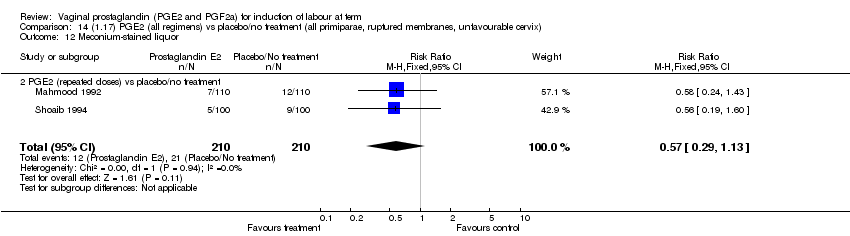
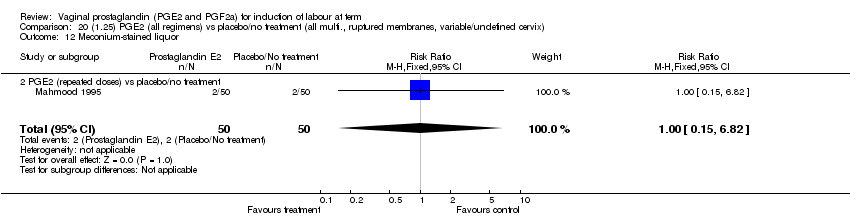
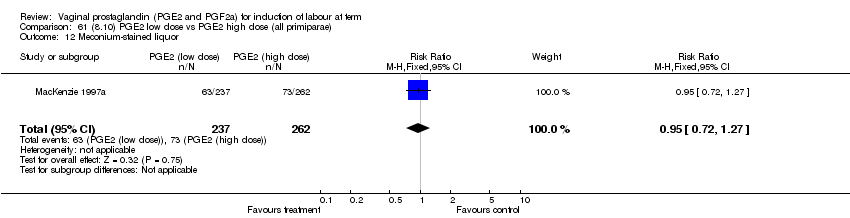
| 12 Meconium‐stained liquor Show forest plot | 12 | 4245 | Risk Ratio (M‐H, Fixed, 95% CI) | 0.82 [0.68, 0.98] |
|
| 12.1 PGE2 (once only) vs placebo/no treatment | 5 | 704 | Risk Ratio (M‐H, Fixed, 95% CI) | 0.95 [0.65, 1.40] |
| 12.2 PGE2 (repeated doses) vs placebo/no treatment | 7 | 3541 | Risk Ratio (M‐H, Fixed, 95% CI) | 0.79 [0.64, 0.97] |
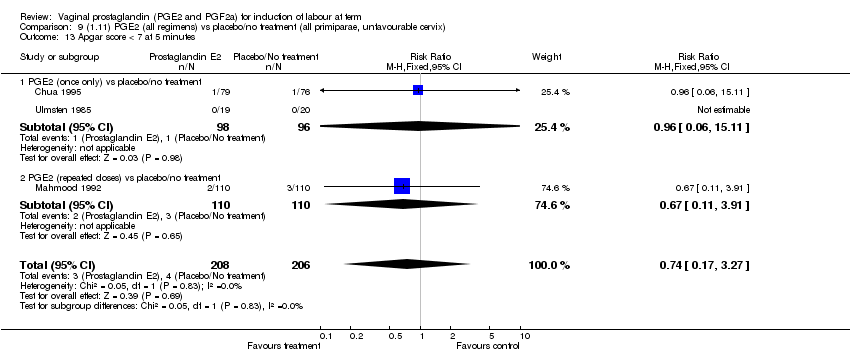
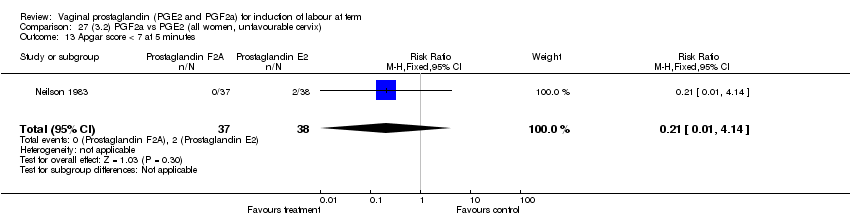
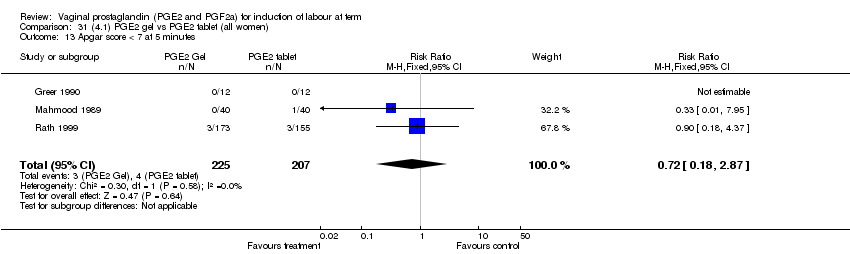
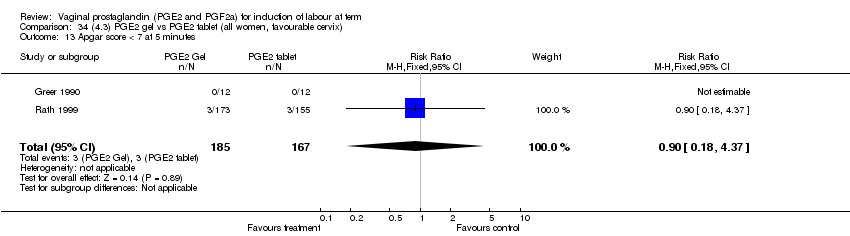
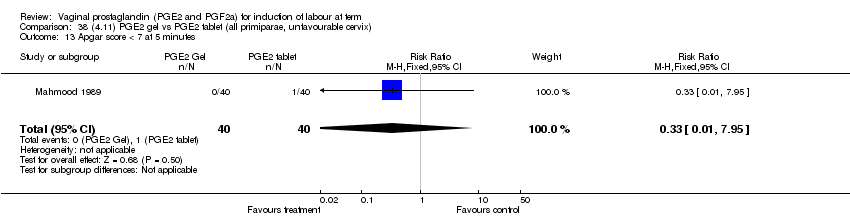
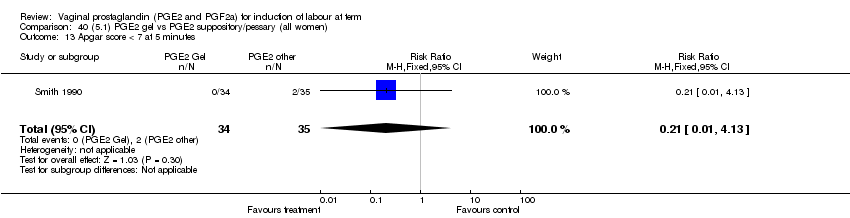
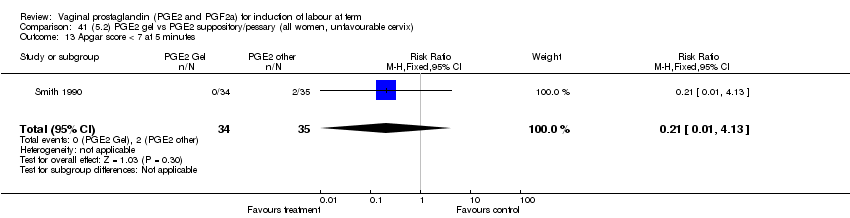
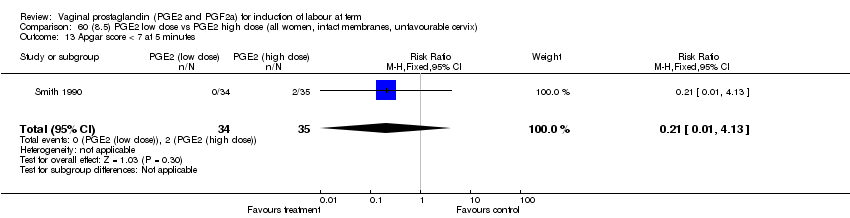
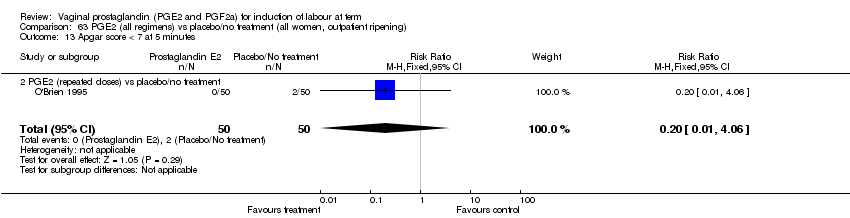
| 13 Apgar score < 7 at 5 minutes Show forest plot | 15 | 4381 | Risk Ratio (M‐H, Fixed, 95% CI) | 1.30 [0.86, 1.96] |
|
| 13.1 PGE2 (once only) vs placebo/no treatment | 9 | 1046 | Risk Ratio (M‐H, Fixed, 95% CI) | 0.56 [0.24, 1.30] |
| 13.2 PGE2 (repeated doses) vs placebo/no treatment | 5 | 3120 | Risk Ratio (M‐H, Fixed, 95% CI) | 1.38 [0.80, 2.37] |
| 13.3 PGE2 (sustained release) vs placebo/no treatment | 1 | 215 | Risk Ratio (M‐H, Fixed, 95% CI) | 6.21 [1.41, 27.34] |
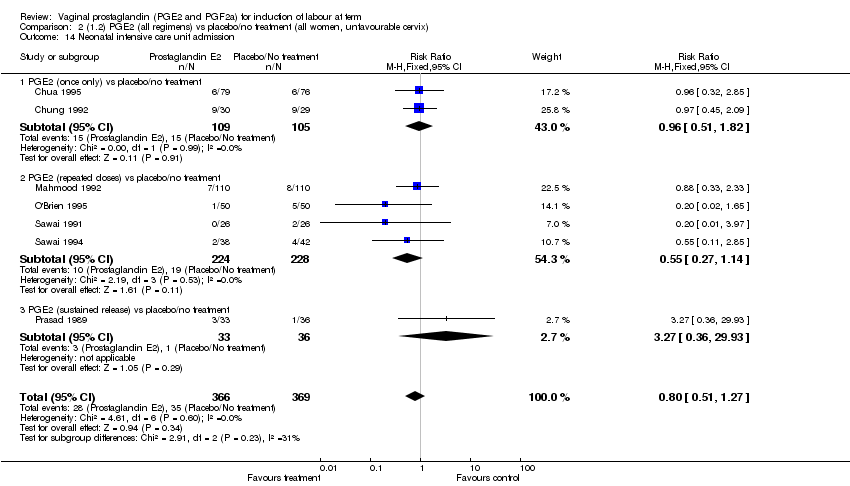
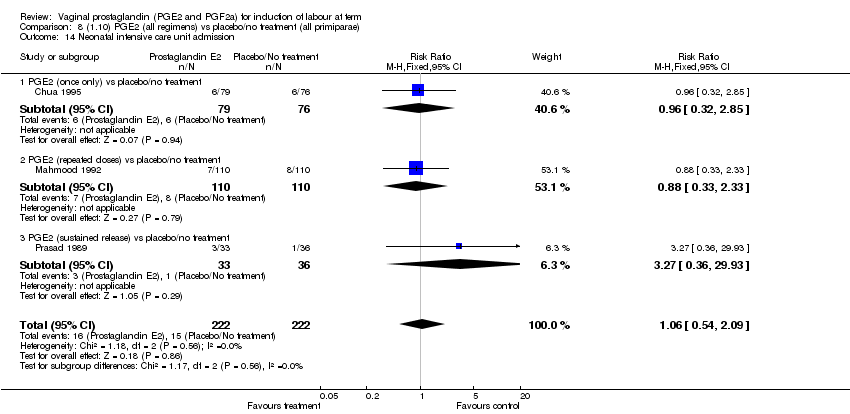
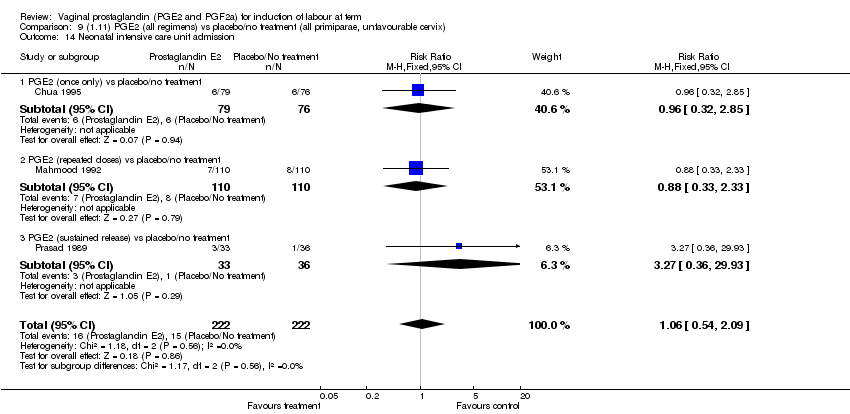
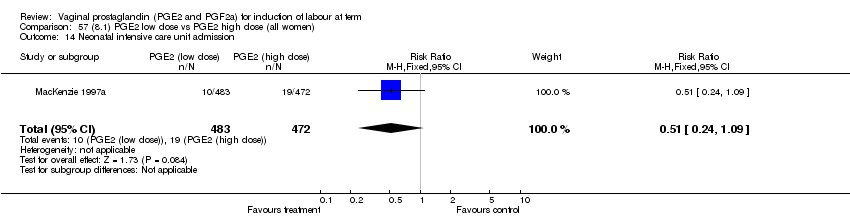
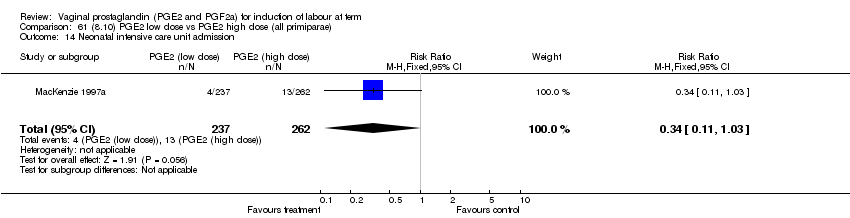
| 14 Neonatal intensive care unit admission Show forest plot | 11 | 3922 | Risk Ratio (M‐H, Fixed, 95% CI) | 0.95 [0.78, 1.15] |
|
| 14.1 PGE2 (once only) vs placebo/no treatment | 4 | 681 | Risk Ratio (M‐H, Fixed, 95% CI) | 1.23 [0.70, 2.15] |
| 14.2 PGE2 (repeated doses) vs placebo/no treatment | 6 | 3172 | Risk Ratio (M‐H, Fixed, 95% CI) | 0.90 [0.73, 1.11] |
| 14.3 PGE2 (sustained release) vs placebo/no treatment | 1 | 69 | Risk Ratio (M‐H, Fixed, 95% CI) | 3.27 [0.36, 29.93] |
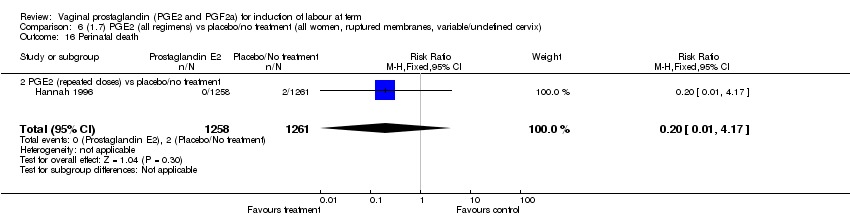
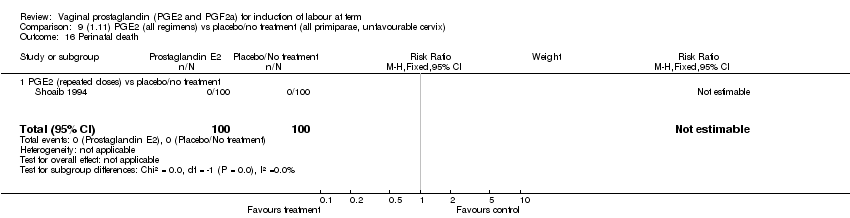
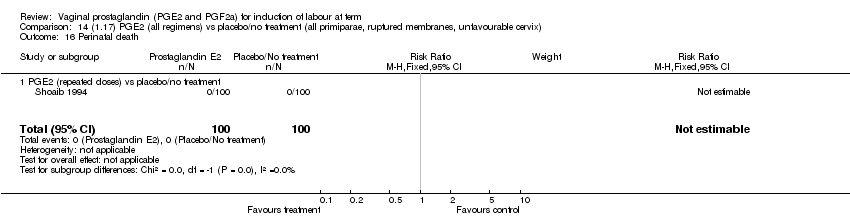
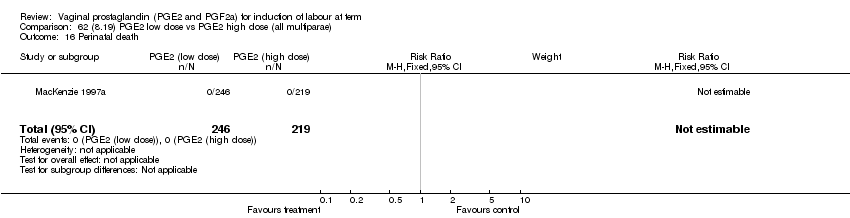
| 16 Perinatal death Show forest plot | 7 | 3648 | Risk Ratio (M‐H, Fixed, 95% CI) | 0.56 [0.14, 2.22] |
|
| 16.1 PGE2 (once only) vs placebo/no treatment | 2 | 431 | Risk Ratio (M‐H, Fixed, 95% CI) | 1.06 [0.07, 16.85] |
| 16.2 PGE2 (repeated doses) vs placebo/no treatment | 4 | 3148 | Risk Ratio (M‐H, Fixed, 95% CI) | 0.46 [0.09, 2.31] |
| 16.3 PGE2 (sustained release) vs placebo/no treatment | 1 | 69 | Risk Ratio (M‐H, Fixed, 95% CI) | 0.0 [0.0, 0.0] |
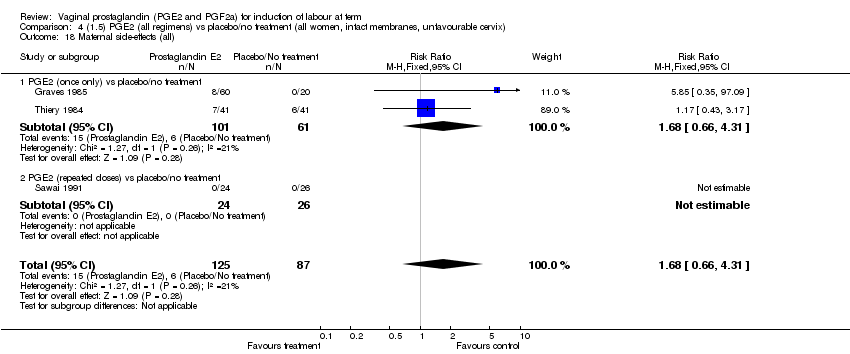
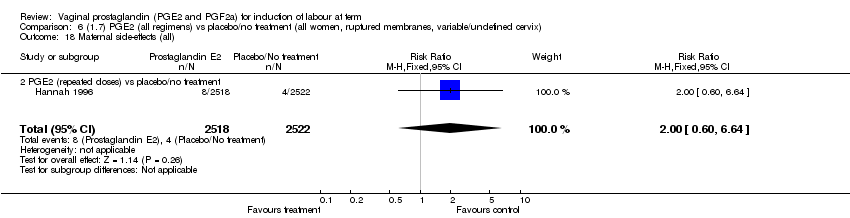
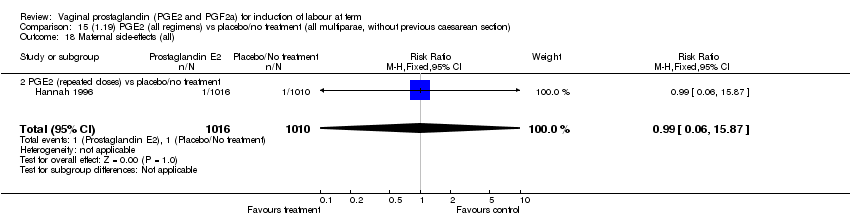
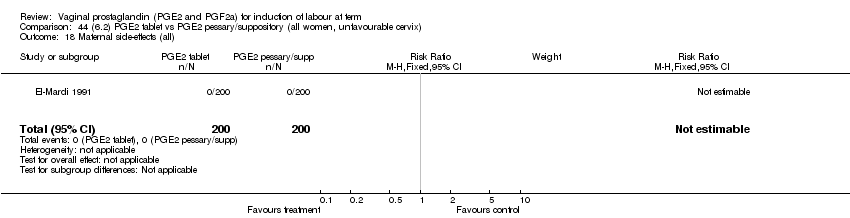
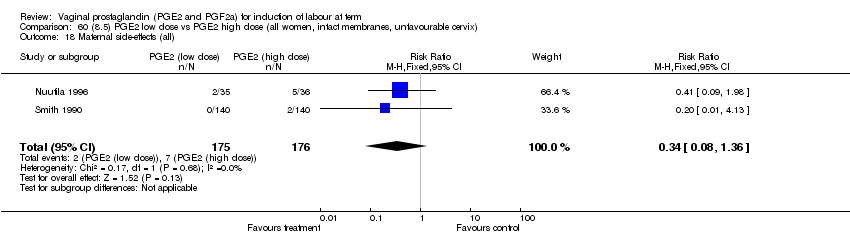
| 18 Maternal side‐effects (all) Show forest plot | 12 | 6780 | Risk Ratio (M‐H, Fixed, 95% CI) | 1.15 [0.80, 1.67] |
|
| 18.1 PGE2 (once only) vs placebo/no treatment | 6 | 577 | Risk Ratio (M‐H, Fixed, 95% CI) | 1.95 [1.02, 3.74] |
| 18.2 PGE2 (repeated doses) vs placebo/no treatment | 5 | 5558 | Risk Ratio (M‐H, Fixed, 95% CI) | 0.84 [0.53, 1.34] |
| 18.3 PGE2 (sustained release) vs placebo/no treatment | 1 | 645 | Risk Ratio (M‐H, Fixed, 95% CI) | 0.0 [0.0, 0.0] |
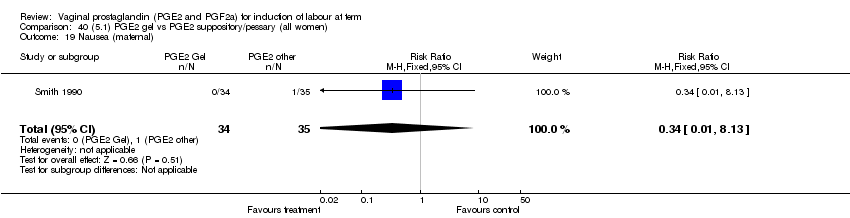
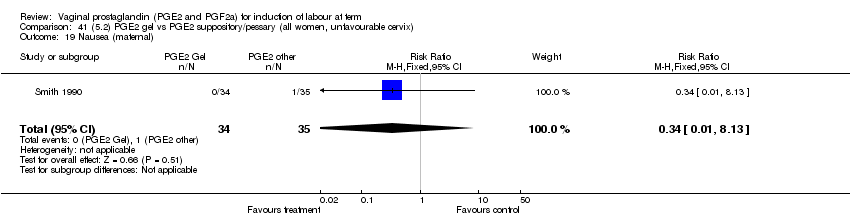
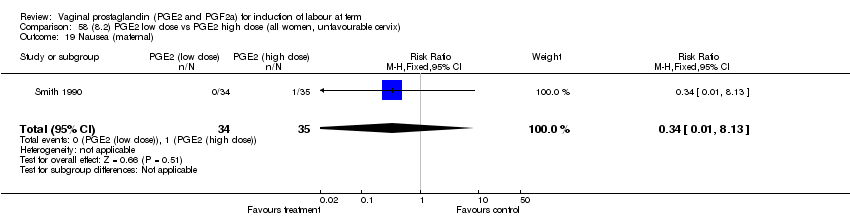
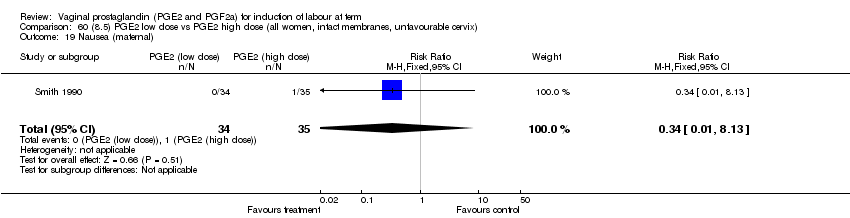
| 19 Nausea (maternal) Show forest plot | 1 | 84 | Risk Ratio (M‐H, Fixed, 95% CI) | 0.0 [0.0, 0.0] |
|
| 19.2 PGE2 (repeated doses) vs placebo/no treatment | 1 | 84 | Risk Ratio (M‐H, Fixed, 95% CI) | 0.0 [0.0, 0.0] |
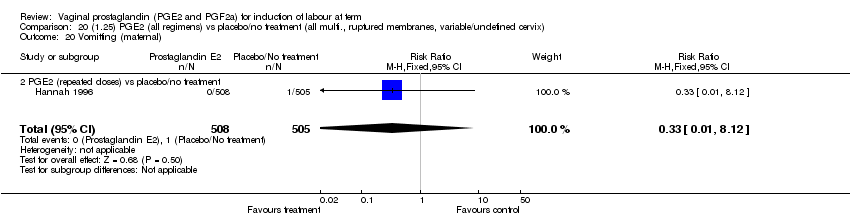
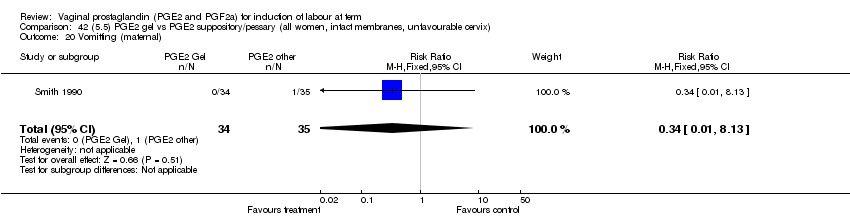
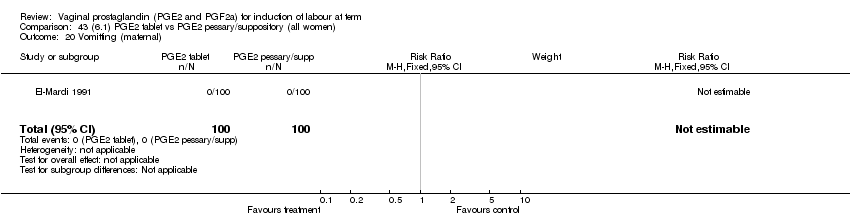
| 20 Vomitting (maternal) Show forest plot | 3 | 2794 | Risk Ratio (M‐H, Fixed, 95% CI) | 1.16 [0.39, 3.39] |
|
| 20.1 PGE2 (once only) vs placebo/no treatment | 1 | 59 | Risk Ratio (M‐H, Fixed, 95% CI) | 0.97 [0.15, 6.41] |
| 20.2 PGE2 (repeated doses) vs placebo/no treatment | 1 | 2520 | Risk Ratio (M‐H, Fixed, 95% CI) | 1.25 [0.34, 4.65] |
| 20.3 PGE2 (sustained release) vs placebo/no treatment | 1 | 215 | Risk Ratio (M‐H, Fixed, 95% CI) | 0.0 [0.0, 0.0] |
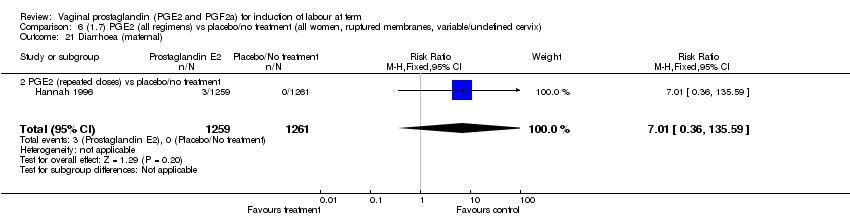
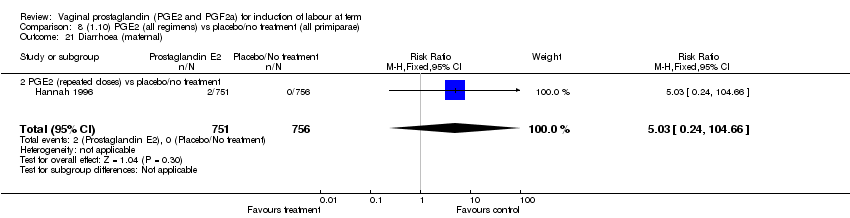
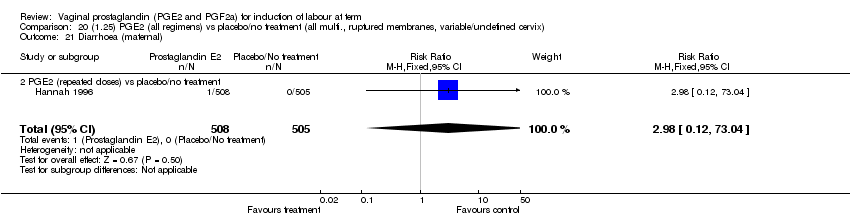
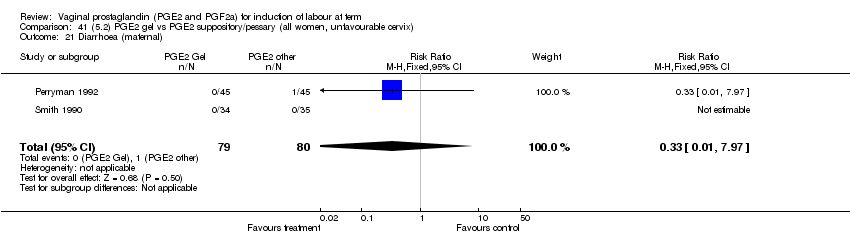
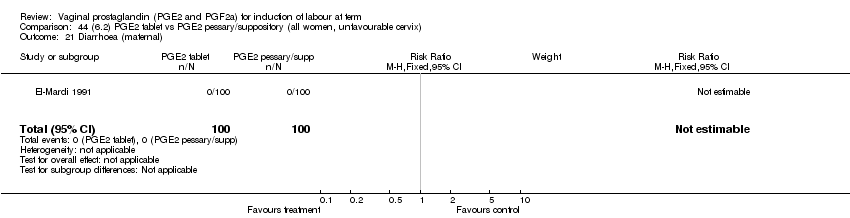
| 21 Diarrhoea (maternal) Show forest plot | 3 | 2819 | Risk Ratio (M‐H, Fixed, 95% CI) | 7.01 [0.36, 135.59] |
|
| 21.2 PGE2 (repeated doses) vs placebo/no treatment | 2 | 2604 | Risk Ratio (M‐H, Fixed, 95% CI) | 7.01 [0.36, 135.59] |
| 21.3 PGE2 (sustained release) vs placebo/no treatment | 1 | 215 | Risk Ratio (M‐H, Fixed, 95% CI) | 0.0 [0.0, 0.0] |
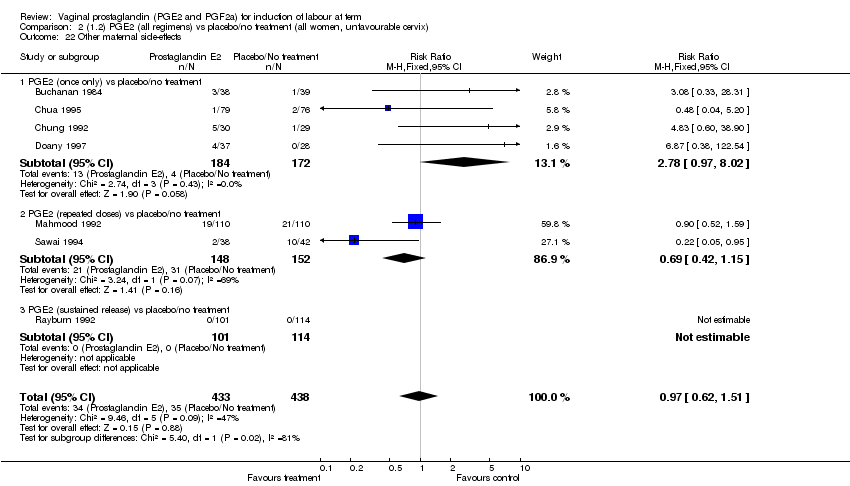
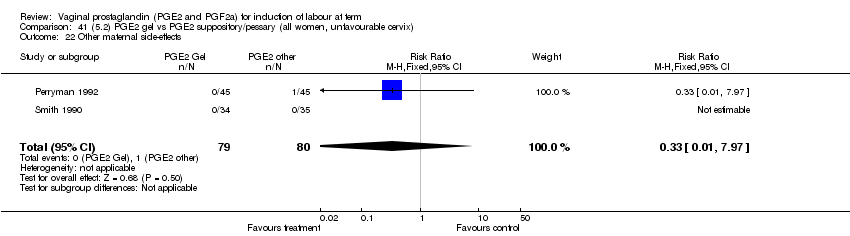
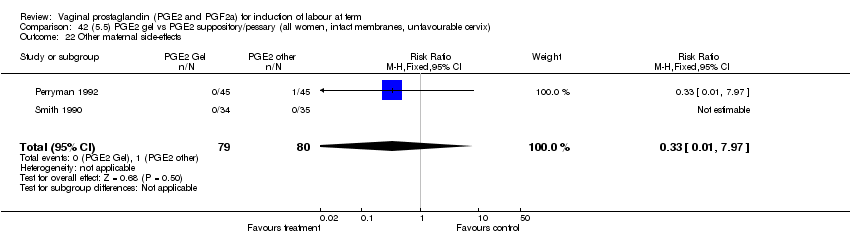
| 22 Other maternal side‐effects Show forest plot | 7 | 871 | Risk Ratio (M‐H, Fixed, 95% CI) | 0.97 [0.62, 1.51] |
|
| 22.1 PGE2 (once only) vs placebo/no treatment | 4 | 356 | Risk Ratio (M‐H, Fixed, 95% CI) | 2.78 [0.97, 8.02] |
| 22.2 PGE2 (repeated doses) vs placebo/no treatment | 2 | 300 | Risk Ratio (M‐H, Fixed, 95% CI) | 0.69 [0.42, 1.15] |
| 22.3 PGE2 (sustained release) vs placebo/no treatment | 1 | 215 | Risk Ratio (M‐H, Fixed, 95% CI) | 0.0 [0.0, 0.0] |
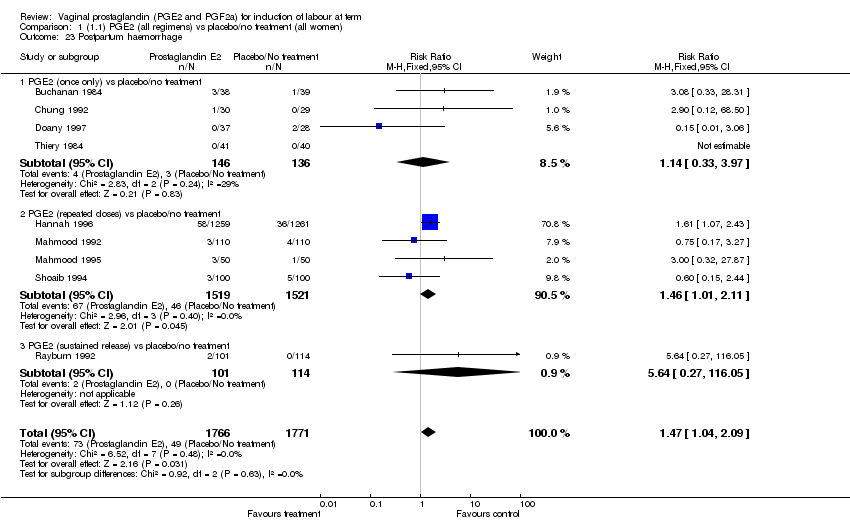
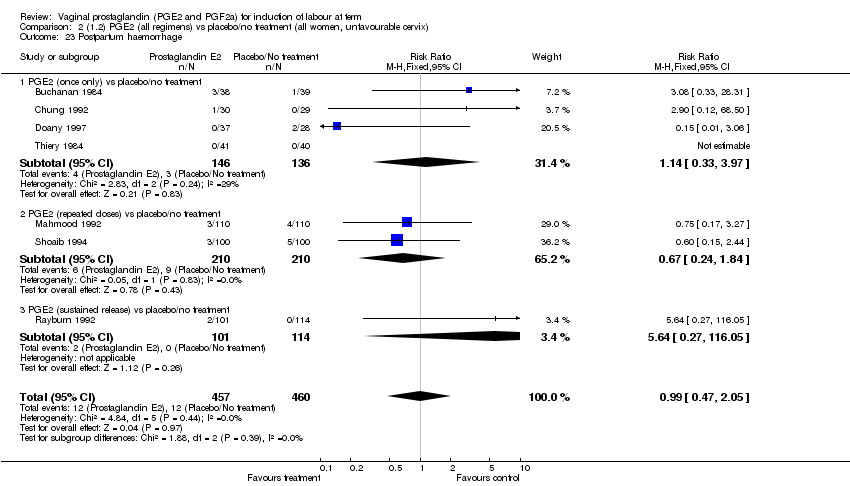
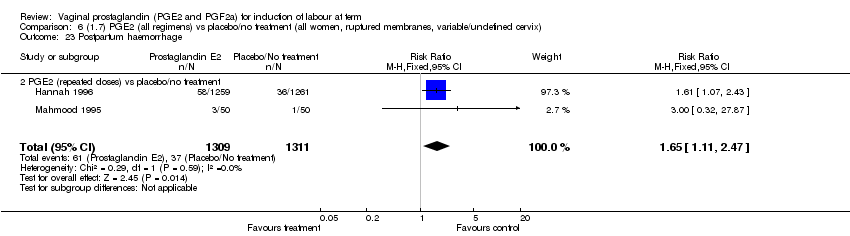
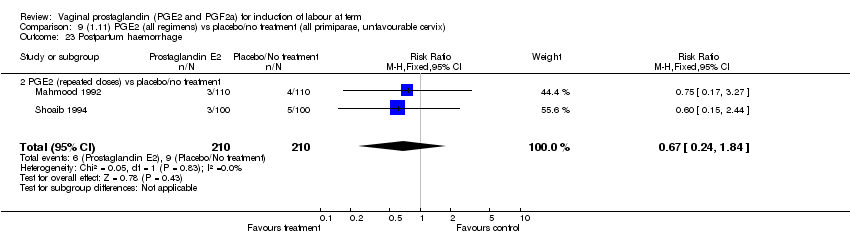
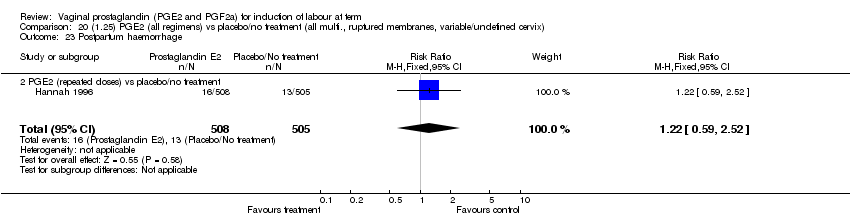
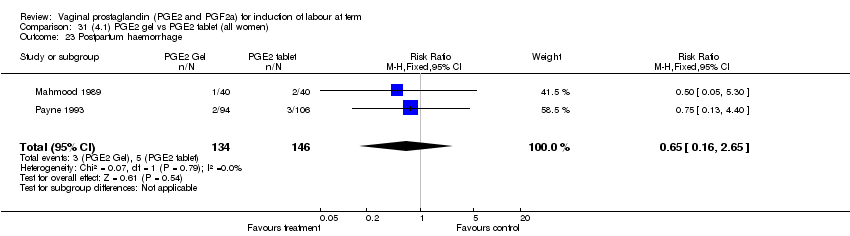
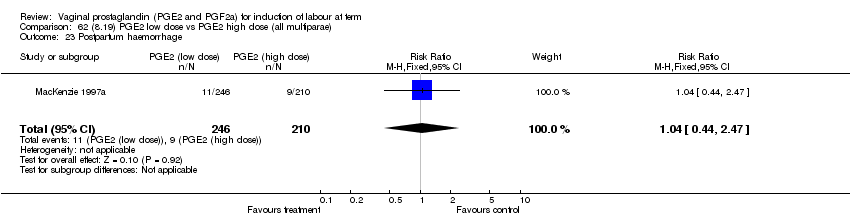
| 23 Postpartum haemorrhage Show forest plot | 9 | 3537 | Risk Ratio (M‐H, Fixed, 95% CI) | 1.47 [1.04, 2.09] |
|
| 23.1 PGE2 (once only) vs placebo/no treatment | 4 | 282 | Risk Ratio (M‐H, Fixed, 95% CI) | 1.14 [0.33, 3.97] |
| 23.2 PGE2 (repeated doses) vs placebo/no treatment | 4 | 3040 | Risk Ratio (M‐H, Fixed, 95% CI) | 1.46 [1.01, 2.11] |
| 23.3 PGE2 (sustained release) vs placebo/no treatment | 1 | 215 | Risk Ratio (M‐H, Fixed, 95% CI) | 5.64 [0.27, 116.05] |
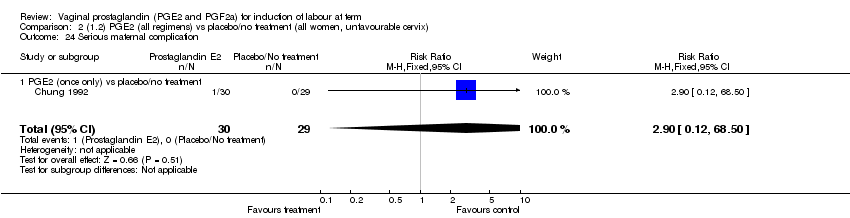
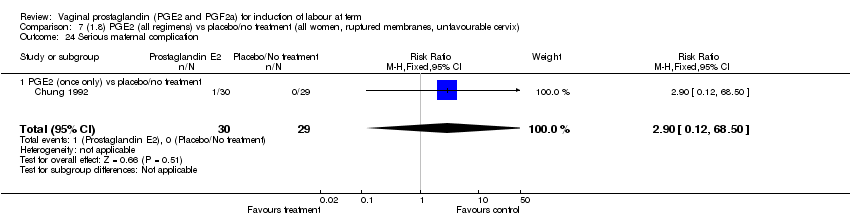
| 24 Serious maternal complication Show forest plot | 1 | 59 | Risk Ratio (M‐H, Fixed, 95% CI) | 2.90 [0.12, 68.50] |
|
| 24.1 PGE2 (once only) vs placebo/no treatment | 1 | 59 | Risk Ratio (M‐H, Fixed, 95% CI) | 2.90 [0.12, 68.50] |
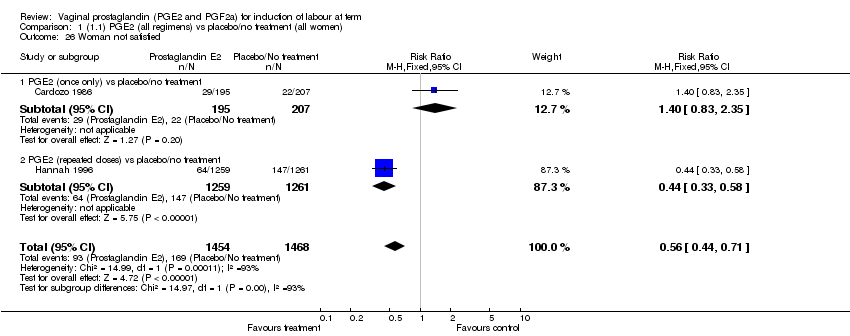
| 26 Woman not satisfied Show forest plot | 2 | 2922 | Risk Ratio (M‐H, Fixed, 95% CI) | 0.56 [0.44, 0.71] |
|
| 26.1 PGE2 (once only) vs placebo/no treatment | 1 | 402 | Risk Ratio (M‐H, Fixed, 95% CI) | 1.40 [0.83, 2.35] |
| 26.2 PGE2 (repeated doses) vs placebo/no treatment | 1 | 2520 | Risk Ratio (M‐H, Fixed, 95% CI) | 0.44 [0.33, 0.58] |