Haloperidol versus placebo para la esquizofrenia
Resumen
Antecedentes
El haloperidol se desarrolló a finales de los años 50 para ser utilizado en el campo de la anestesia. Estudios posteriores demostraron que tiene efectos sobre las alucinaciones, los delirios, la agresividad, la impulsividad y los estados de excitación, lo que dio lugar a la introducción del haloperidol como un antipsicótico.
Objetivos
Evaluar los efectos clínicos del haloperidol para el tratamiento de la esquizofrenia y de otras enfermedades mentales graves semejantes comparado con placebo.
Métodos de búsqueda
Inicialmente, se hicieron búsquedas electrónicas en las bases de datos Biological Abstracts (1985 a 1998), CINAHL (1982 a 1998), The Cochrane Library (1998, número 4), registro del Grupo Cochrane de Esquizofrenia (Cochrane Schizophrenia Group) (diciembre de 1998), EMBASE (1980 a 1998), MEDLINE (1966 a 1998), PsycLIT (1974 a 1998) y en SCISEARCH. También se revisaron las referencias de todos los estudios identificados para obtener citas de ensayos adicionales y se estableció contacto con los autores de los ensayos y compañías farmacéuticas para obtener información adicional y material de archivo.
Para la actualización de 2012, el 15 de mayo de 2012 se realizaron búsquedas en el registro de ensayos del Grupo Cochrane de Esquizofrenia.
Criterios de selección
Se incluyeron todos los ensayos controlados aleatorios relevantes que compararon la administración de haloperidol (cualquier dosis por vía oral) con placebo en pacientes con esquizofrenia u otras enfermedades psicóticas no afectivas graves similares, (independientemente de cómo fueran diagnosticadas). Los principales resultados de interés fueron: muerte, pérdida durante el seguimiento, respuesta social y clínica, recurrencia y gravedad de los efectos adversos.
Obtención y análisis de los datos
Los datos se evaluaron de forma independiente y se extrajeron, se reinspeccionaron y se evaluó la calidad. Los datos dicotómicos se analizaron mediante el cociente de riesgos (CR) y se calcularon los intervalos de confianza (IC) del 95%. Para los datos continuos, se calcularon las diferencias de medias (DM). Los datos continuos se excluyeron si la pérdida durante el seguimiento fue superior al 50%, y los datos se analizaron en busca de heterogeneidad. Se utilizó un modelo de efectos fijos para todos los análisis. Para la actualización de 2012, se evaluó el riesgo de sesgo de los estudios incluidos y se utilizó el enfoque GRADE para crear una tabla 'Resumen de los hallazgos".
Resultados principales
En esta revisión, actualmente se han incluido 25 ensayos que asignaron al azar a 4651 pacientes. Para la tabla "Resumen de los hallazgos", se eligieron siete resultados de interés principales. Más pacientes asignados a haloperidol mejoraron en las primeras seis semanas de tratamiento en comparación con los que recibieron placebo (cuatro ECA, n = 472, CR 0,67; IC: 0,56 a 0,80; pruebas de calidad moderada). Ocho ensayos también encontraron una diferencia a favor del haloperidol en el período de seis semanas a seis meses (ocho ECA, n = 307, CR 0,67; IC: 0,58 a 0,78; pruebas de calidad moderada). Los datos de dos ensayos sobre la recurrencia favorecieron al haloperidol a < 52 semanas, pero las pruebas fueron de calidad muy baja (dos ECA, n = 70, CR 0,69; IC: 0,55 a 0,86). Pruebas de calidad moderada mostraron que cerca de la mitad de los pacientes reclutados en los estudios no lograron completar los ensayos cortos (seis semanas a seis meses), aunque hasta las seis semanas 16 estudios encontraron una diferencia que favoreció ligeramente al haloperidol (n = 1812, CR 0,87; IC: 0,80 a 0,95). No obstante, los datos sobre efectos adversos apoyan la impresión clínica de que el haloperidol es una causa importante de trastornos del movimiento, por lo menos a corto plazo. Pruebas de calidad moderada indican que el haloperidol causó parkinsonismo (cinco ECA, n = 485, CR 5,48; IC: 2,68 a 11,22), acatisia (seis ECA, n = 695, CR 3,66; IC: 2,24 a 5,97) y distonía aguda (cinco ECA, n = 471, CR 11,49; IC: 3,23 a 10,85). El alta hospitalaria fue equívoca entre los grupos (un ECA, n = 33, CR 0,85; IC: 0,47 a 1,52; pruebas de calidad muy baja). No se informaron datos sobre la muerte ni la satisfacción del paciente.
Conclusiones de los autores
El haloperidol es un fármaco antipsicótico potente que tiene una alta tendencia a causar efectos adversos. Cuando no hay otra opción de tratamiento, se justifica el uso del haloperidol para contrarrestar las consecuencias perjudiciales y potencialmente peligrosas de la esquizofrenia sin tratar. Sin embargo, cuando es posible la elección de otro fármaco, los pacientes con esquizofrenia y los médicos pueden preferir una opción antipsicótica con menos probabilidades de producir efectos adversos como parkinsonismo, acatisia y distonías agudas. El haloperidol debe ser menos preferido como fármaco control para los ensayos aleatorios de nuevos antipsicóticos.
PICO
Resumen en términos sencillos
Haloperidol versus placebo para la esquizofrenia
El haloperidol se desarrolló por primera vez a finales de 1950. Estudios de investigación posteriores mostraron efectos terapéuticos sobre los síntomas de la esquizofrenia como oír voces y ver cosas (alucinaciones), tener sentimientos extraños (delirios), agresividad, impulsividad y estados de excitación. Lo anterior dio lugar a la introducción del haloperidol como uno de los primeros fármacos antipsicóticos. Los fármacos antipsicóticos son el principal tratamiento para los síntomas de la esquizofrenia. A pesar de la introducción de fármacos antipsicóticos más nuevos (fármacos de segunda generación o "atípicos"), el haloperidol se utiliza de manera generalizada y es el punto de referencia para evaluar la efectividad de los fármacos antipsicóticos más nuevos.
El objetivo de esta revisión fue evaluar los efectos del haloperidol para la esquizofrenia y otras enfermedades mentales graves semejantes en comparación con tratamiento "simulado" o ningún tratamiento (placebo). Se realizó una nueva búsqueda de ensayos en mayo de 2012 y la revisión incluye ahora 25 estudios con 4651 pacientes. Los revisores evaluaron la calidad de las pruebas informadas en los ensayos para siete resultados principales (estado general, muerte, alta hospitalaria, recurrencia, abandono anticipado del estudio, efectos adversos y satisfacción con el tratamiento). Para el estado general, el abandono anticipado del estudio y los efectos adversos, los revisores consideraron las pruebas de calidad moderada; sin embargo, la recurrencia y el alta hospitalaria se evaluaron de calidad muy baja. No hubo datos disponibles para la muerte y la satisfacción con el tratamiento.
Según pruebas de calidad moderada, el haloperidol fue mejor que placebo para tratar la esquizofrenia. Más pacientes que recibieron haloperidol mejoraron en las primeras seis semanas de tratamiento que los que recibieron placebo. Sin embargo, un número significativo de pacientes que recibieron haloperidol presentó efectos secundarios que incluyeron contracción muscular, sacudidas incontrolables, temblores, somnolencia y excitabilidad.
Los revisores concluyeron que el haloperidol es un antipsicótico potente y efectivo para tratar los síntomas de la esquizofrenia, pero puede causar efectos secundarios debilitantes. Los pacientes con esquizofrenia y los psiquiatras pueden desear la prescripción de un antipsicótico más nuevo con menos efectos secundarios.
Por último, una gran proporción de otras informaciones y datos de los ensayos fue escasa y mal informada, lo que significa que se necesitan mejores estudios. Muchos pacientes de ambos grupos abandonaron los ensayos de forma anticipada. Lo anterior indica que el diseño y la realización de los ensayos fue deficiente y quizás no aceptable para los pacientes. Según estos resultados, posiblemente sea sorprendente que el haloperidol se considere el punto de referencia antipsicótico de uso generalizado para el tratamiento de la esquizofrenia. Sorprende también que el haloperidol sea ampliamente utilizado como comparación para las nuevas medicaciones. El haloperidol es un antipsicótico efectivo pero tiene efectos secundarios graves y debilitantes.
Benjamin Gray, Usuario de Servicios y Experto Usuario de Servicios, Rethink Mental Illness.
Authors' conclusions
Summary of findings
| HALOPERIDOL versus PLACEBO for schizophrenia | ||||||
| Patient or population: patients with schizophrenia | ||||||
| Outcomes | Illustrative comparative risks* (95% CI) | Relative effect | No of Participants | Quality of the evidence | Comments | |
| Assumed risk | Corresponding risk | |||||
| Control | HALOPERIDOL versus PLACEBO | |||||
| Death ‐ suicide and natural causes | See comment | See comment | Not estimable | 0 | See comment | No studies reported on this outcome. |
| Overall improvement: No marked global improvement | 841 per 1000 | 564 per 1000 | RR 0.67 | 307 | ⊕⊕⊕⊝ | Another four trials reported on this outcome at up to six weeks follow‐up, and one trial at > 6‐24 weeks follow‐up using a nurse‐rated scale, both sub‐analyses showed significant results in favour of haloperidol. |
| Not discharged from hospital | 625 per 1000 | 531 per 1000 | RR 0.85 | 33 | ⊕⊝⊝⊝ | |
| Relapse | 1000 per 1000 | 690 per 1000 | RR 0.69 | 70 | ⊕⊝⊝⊝ | |
| Leaving the study early | 134 per 1000 | 72 per 1000 | RR 0.54 | 304 | ⊕⊕⊕⊝ | Another 16 trials reported on this outcome at up to six weeks follow‐up showing a significant result in favour of haloperidol. One trial at < 52 weeks follow‐up showed no difference between haloperidol and placebo. |
| Satisfaction with treatment | See comment | See comment | Not estimable | 0 | See comment | No studies reported on this outcome. |
| Adverse effects: Movement disorders ‐ parkinsonism | 28 per 1000 | 154 per 1000 | RR 5.48 | 485 | ⊕⊕⊕⊝ | Several studies also reported on other, specific movement disorders: there was a significant result favouring placebo for akathisia, dystonia, needing anti‐Parkinson medication, rigidity and tremor; there was no difference between haloperidol and placebo for tardive dyskinesia, oculogyric crises, teeth grinding and 'thick' speech. |
| *The basis for the assumed risk (e.g. the median control group risk across studies) is provided in footnotes. The corresponding risk (and its 95% confidence interval) is based on the assumed risk in the comparison group and the relative effect of the intervention (and its 95% CI). | ||||||
| GRADE Working Group grades of evidence | ||||||
| 1 Seven out of the eight included studies had an unclear risk of bias for random sequence generation and for allocation concealment. Blinding of participants and personnel was unclear in four studies and blinding of assessors was unclear in six. Two studies had an unclear risk of bias for incomplete outcome data. One study had a high risk of other bias as they were funded by industry and three an unclear risk of bias as the drugs were provided by a pharmaceutical company. | ||||||
Background
Description of the condition
Schizophrenia affects about 1% of the world's population, irrespective of race, gender, social class or country of origin (Jablensky 1992). Central to the treatment of this disabling mental illness are antipsychotic drugs, the earliest of which, chlorpromazine and haloperidol, were formulated and introduced in the 1950's. This introduction caused a revolution in the care of those with serious mental illnesses (Awad 1997; Dally 1967). Despite the formulation of a newer generation of atypical antipsychotics, chlorpromazine and haloperidol are still the most frequently prescribed antipsychotic drugs world‐wide (Ayd 1978; Carpenter 1994; Waddington 1997).
Description of the intervention
Haloperidol was developed in the late 1950s for use in the field of anaesthesia and was initially used to prevent surgical shock. Research subsequently demonstrated its beneficial effect on hallucinations, delusions, aggressiveness, impulsiveness and states of excitement (Ayd 1972; Ayd 1978; Settle 1983). These findings led to the introduction of haloperidol as an antipsychotic. Hailed as a breakthrough, it was considered to be the most potent antipsychotic known, effective for a wide range of psychotic disorders, and in addition, appeared to keep side effects to a minimum (Settle 1983). Since its introduction, clinical experience has suggested that haloperidol is indeed an effective antipsychotic, particularly beneficial for those who are experiencing acute hallucinations and delusions.
How the intervention might work
Antipsychotic drugs block, to a greater or lesser extent, the transmission of dopamine, which is implicated in the cause of schizophrenia, in the brain (Willner 1997). The action of these drugs is not specific and unwanted blockade can occur. This produces a wide range of side effects including lethargy, sedation, dry mouth, blurred vision, constipation, weight gain, and stiffness. Haloperidol has a higher potency dopamine blockade compared to most other antipsychotics, therefore, low‐dose haloperidol can be used to achieve an antipsychotic effect. This keeps the sort of adverse effects described above to a minimum. Haloperidol's high potency for dopamine blockade, however, means that it may cause more disorders of movement and expression (parkinsonism), involuntary and perhaps irreversible movements (dyskinesia), overwhelming feelings of restlessness (akathisia) and dangerous disturbances of the body's temperature and blood pressure regulatory systems (neuroleptic malignant syndrome) (Settle 1983).
Despite these recent concerns, research in general has consistently found haloperidol to be an effective, well tolerated antipsychotic that produces minimal side effects (Ayd 1972; Ayd 1978; Settle 1983). Consequently, in accordance with the recommendations of drug regulatory authorities, such as the Food and Drug Administration (FDA) of the United States of America, haloperidol is increasingly used as a comparator drug in clinical trials (Settle 1983; Thornley 1998). To an even greater extent than chlorpromazine, haloperidol remains the benchmark by which all other antipsychotics are measured.
Why it is important to do this review
Haloperidol's efficacy as an antipsychotic seems to vary. Some research suggests factors such as drug dose, administration of antiparkinson medication, recipient's age, sex, and individual physiology may all change efficacies (Ayd 1972; Ayd 1978; Settle 1983). More recently there has been increasing concern and debate surrounding the long‐term use of haloperidol and the subsequent development of serious adverse side effects (Settle 1983).
Objectives
To evaluate the clinical effects of haloperidol for the management of schizophrenia and other similar serious mental illnesses compared with placebo.
Methods
Criteria for considering studies for this review
Types of studies
We included all relevant randomised controlled trials. We included trials that implied randomisation, i.e. the trial was described as 'double‐blind' and the participants' demographic details in each group were similar. We excluded quasi‐randomised studies, such as those allocating by using alternate days of the week.
Types of participants
We included anyone with schizophrenia or similar serious, non‐affective psychosis diagnosed by any criteria, irrespective of gender, age or race. We accepted a trial including people with less serious mental illnesses if the majority of participants suffered from serious functional psychotic illnesses, such as schizophrenia.
Types of interventions
-
Haloperidol: any oral dose.*
-
Placebo: active or inactive.
* Depot administration of haloperidol has been evaluated in another Cochrane Review (Quraishi 1999), and if trials relevant to this comparison were found we sent these to the contact author of this review. A systematic review of haloperidol, one dose versus another, has also been published (Donnelly 2013) and relevant studies were also supplied to this review author.
Types of outcome measures
We also grouped outcomes into immediate (up to six weeks), short (six weeks to six months), medium (six months to one year), and long (over one year) term.
Primary outcomes
1. Death ‐ suicide and natural causes
2. Global state
2.1 Overall improvement
2.2 Relapse ‐ as defined by each study
2.3 Hospital discharge
3. Satisfaction with treatment
4. Behaviour
4.1 Specific behaviours (e.g. aggressive or violent behaviour)
Secondary outcomes
1. Global state
1.1 Duration of hospital stay
1.2 Re‐admission
1.3 Leaving the study early
2. Mental state
2.1 General symptoms
2.2 Specific symptoms
2.2.1 Positive symptoms (delusions, hallucinations, disordered thinking)
2.2.2 Negative symptoms (avolition, poor self‐care, blunted affect)
2.2.3 Mood ‐ depression
3. Behaviour
3.1 General behaviour
3.2.1 Social functioning
3.2.2 Employment status during trial (employed/unemployed)
3.2.3 Occurrence of violent incidents (to self, others or property)
4. Adverse effects
4.1 General
4.2 Specific
4.2.1 Movement disorders
4.2.2 Other CNS
4.2.3 Cardiovascular effects
4.2.4 Others
5. Economic
5.1 Cost of care
6. ,Summary of findings, table
We used the GRADE approach to interpret findings (Schünemann 2008) and used the GRADE profiler to import data from Review Manager (RevMan) to create 'Summary of findings' tables. These tables provide outcome‐specific information concerning the overall quality of evidence from each included study in the comparison, the magnitude of effect of the interventions examined, and the sum of available data on all outcomes we rated as important to patient‐care and decision making. We selected the following main outcomes for inclusion in the 'Summary of findings' table.
-
Death ‐ suicide and natural causes.
-
Overall improvement.
-
Not discharged from hospital.
-
Relapse.
-
Leaving the study early
-
Satisfaction with treatment ‐ participant/carer.
-
Adverse effects: Movement disorders ‐ parkinsonism.
Search methods for identification of studies
Electronic searches
For details of the search terms and previous searches see Appendix 1
Cochrane Schizophrenia Group Trials Register (May 2012)
The Trials Search Co‐ordinator searched the Cochrane Schizophrenia Group’s Trials Register (15 May 2012).
The Cochrane Schizophrenia Group’s Trials Register is compiled by systematic searches of major databases, handsearches and conference proceedings (see group module).
Searching other resources
1. Reference searching
We inspected references of all identified studies for further relevant studies.
2. Personal contact
For this update, we did not contact the first author of each included study for information regarding unpublished trials.
Data collection and analysis
Methods used in data collection and analysis for this 2012 update are set out below; for previous methods, please see Appendix 2.
Selection of studies
For this 2012 update, the Cochrane Schizophrenia group provided Enhance Reviews, a database of relevant abstracts; the Enhance Reviews team inspected full articles of the abstracts meeting the inclusion criteria.
Data extraction and management
1. Extraction
For this 2012 update, two members of the Enhance Reviews team extracted data from included studies. We extracted data presented only in graphs and figures whenever possible. In the previous versions of the review, when further information was necessary, we contacted authors of studies in order to obtain missing data, or for clarification. If studies were multi‐centre, where possible, we extracted data relevant to each component centre separately.
2. Management
2.1 Forms
We extracted data onto standard, simple forms, created in a web‐based software (DistillerSR).
2.2 Scale‐derived data
We included continuous data from rating scales only if:
a) the psychometric properties of the measuring instrument have been described in a peer‐reviewed journal (Marshall 2000); and
b) the measuring instrument has not been written or modified by one of the trialists for that particular trial.
Ideally, the measuring instrument should either be i. a self‐report or ii. completed by an independent rater or relative (not the therapist). We realise that this is not often reported clearly; we have noted whether or not this is the case in Description of studies.
2.3 Endpoint versus change data
There are advantages of both endpoint and change data. Change data can remove a component of between‐person variability from the analysis. On the other hand, calculation of change needs two assessments (baseline and endpoint), which can be difficult in unstable and difficult to measure conditions such as schizophrenia. We decided primarily to use endpoint data, and only use change data if the former were not available. We combined endpoint and change data in the analysis as we used mean differences (MD) rather than standardised mean differences throughout (Higgins 2011, Chapter 9.4.5.2).
2.4 Skewed data
Continuous data on clinical and social outcomes are often not normally distributed. To avoid the pitfall of applying parametric tests to non‐parametric data, we aimed to apply the following standards to all data before inclusion:
a) standard deviations (SDs) and means are reported in the paper or obtainable from the authors;
b) when a scale starts from the finite number zero, the SD, when multiplied by two, is less than the mean (as otherwise the mean is unlikely to be an appropriate measure of the centre of the distribution (Altman 1996));
c) if a scale started from a positive value (such as the Positive and Negative Syndrome Scale (PANSS) (Kay 1986), which can have values from 30 to 210), we modified the calculation described above to take the scale starting point into account. In these cases skew is present if 2 SD > (S‐S min), where S is the mean score and S min is the minimum score.
Endpoint scores on scales often have a finite start and end point and these rules can be applied. We entered skewed endpoint data from studies of fewer than 200 participants in additional tables rather than into an analysis. Skewed data pose less of a problem when looking at mean if the sample size is large; we entered such endpoint data into syntheses.
When continuous data are presented on a scale that includes a possibility of negative values (such as change data), it is difficult to tell whether data are skewed or not, we entered skewed change data into analyses regardless of the size of the study.
2.5 Common measure
To facilitate comparison between trials, we intended to convert variables that can be reported in different metrics, such as days in hospital (mean days per year, per week or per month) to a common metric (e.g. mean days per month).
2.6 Conversion of continuous to binary
Where possible, we made efforts to convert outcome measures to dichotomous data. This can be done by identifying cut‐off points on rating scales and dividing participants accordingly into 'clinically improved' or 'not clinically improved'. It is generally assumed that if there is a 50% reduction in a scale‐derived score such as the Brief Psychiatric Rating Scale (BPRS, Overall 1962) or the PANSS (Kay 1986), this could be considered as a clinically significant response (Leucht 2005; Leucht 2005a). If data based on these thresholds were not available, we used the primary cut‐off presented by the original authors.
2.7 Direction of graphs
Where possible, we entered data in such a way that the area to the left of the line of no effect indicated a favourable outcome for haloperidol.
Assessment of risk of bias in included studies
For this 2012 update, two members of the Enhance Reviews team worked independently by using criteria described in the Cochrane Handbook for Systematic Reviews of Interventions (Higgins 2011) to assess trial quality for the new included studies and all previously included studies. This new set of criteria is based on evidence of associations between overestimate of effect and high risk of bias of the article such as sequence generation, allocation concealment, blinding, incomplete outcome data and selective reporting.
Where inadequate details of randomisation and other characteristics of trials were provided, we did not contact authors of the studies in order to obtain additional information.
We have noted the level of risk of bias in both the text of the review and in the summary of findings Table for the main comparison.
Measures of treatment effect
1. Binary data
For binary outcomes we calculated a standard estimation of the risk ratio (RR) and its 95% confidence interval (CI). It has been shown that RR is more intuitive (Boissel 1999) than odds ratios and that odds ratios tend to be interpreted as RR by clinicians (Deeks 2000).
2. Continuous data
For continuous outcomes we estimated mean difference (MD) between groups. We would prefer not to calculate effect size measures (standardised mean difference (SMD)). However, if scales of very considerable similarity had been used, we would have presumed there was a small difference in measurement, and we would have calculated effect size and transformed the effect back to the units of one or more of the specific instruments.
Unit of analysis issues
1. Cluster trials
Studies increasingly employ 'cluster randomisation' (such as randomisation by clinician or practice), but analysis and pooling of clustered data poses problems. Authors often fail to account for intra‐class correlation in clustered studies, leading to a 'unit of analysis' error (Divine 1992) whereby P values are spuriously low, confidence intervals (CIs) unduly narrow and statistical significance overestimated. This causes type I errors (Bland 1997; Gulliford 1999).
If we had included cluster trials and if clustering had not been accounted for in the primary studies, we would have presented data in a table, with a (*) symbol to indicate the presence of a probable unit of analysis error. In subsequent versions of this review, if we include cluster trials, we will seek to contact the first authors of studies to obtain intra‐class correlation coefficients (ICCs) for their clustered data and to adjust for this by using accepted methods (Gulliford 1999). Where clustering has been incorporated into the analysis of primary studies, we will present these data as if from a non‐cluster randomised study, but adjust for the clustering effect.
For adjustment for clustering a posteriori, the binary data as presented in a report are divided by a 'design effect'. This is calculated using the mean number of participants per cluster (m) and the ICC [Design effect = 1+(m‐1)*ICC] (Donner 2002). If the ICC is not reported, it will be assumed to be 0.1 (Ukoumunne 1999).
If cluster studies have been appropriately analysed taking into account ICCs and relevant data documented in the report, synthesis with other studies will be possible using the generic inverse variance technique.
2. Cross‐over trials
A major concern of cross‐over trials is the carry‐over effect. It occurs if an effect (e.g. pharmacological, physiological or psychological) of the treatment in the first phase is carried over to the second phase. As a consequence, on entry to the second phase the participants can differ systematically from their initial state despite a wash‐out phase. For the same reason cross‐over trials are not appropriate if the condition of interest is unstable (Elbourne 2002). As both effects are very likely in severe mental illness, we only used data of the first phase of cross‐over studies.
3. Studies with multiple treatment groups
Where a study involves more than two treatment arms, if relevant, we presented the additional treatment arms in comparisons. If data were binary, we simply added these and combined within the two‐by‐two table. If data were continuous, we combined data following the formula in section 7.7.3.8 (Combining groups) of the Cochrane Handbook for Systemic reviews of Interventions (Higgins 2011). Where the additional treatment arms were not relevant, we did not reproduce these data.
Dealing with missing data
1. Overall loss of credibility
At some degree of loss of follow‐up, data must lose credibility (Xia 2009). We chose that, for any particular outcome, should more than 50% of data be unaccounted for, we would not reproduce these data or use them within analyses, with the exception of the outcome leaving the study early. If, however, more than 50% of those in one arm of a study were lost, but the total loss was less than 50%, we addressed this within the 'Summary of findings' table/s by down‐rating quality. Finally, we also downgraded quality within the 'Summary of findings' table/s should loss be 25% to 50% in total.
2. Binary
In the case where attrition for a binary outcome was between 0% and 50% and where these data were not clearly described, we presented data on a 'once‐randomised‐always‐analyse' basis (an intention‐to‐treat analysis). Those leaving the study early were all assumed to have the same rates of negative outcome as those who completed, with the exception of the outcome of death and adverse effects. For these outcomes, the rate of those who stayed in the study ‐ in that particular arm of the trial ‐ were used for those who did not. We undertook a sensitivity analysis to test how prone the primary outcomes were to change when 'completer' data only were, compared to the intention‐to‐treat analysis using the above assumptions.
3. Continuous
3.1 Attrition
In the case where attrition for a continuous outcome was between 0% and 50% and completer‐only data were reported, we reproduced these.
3.2 Standard deviations
If standard deviations (SDs) were not reported, we first tried to obtain the missing values from the authors. If not available, where there are missing measures of variance for continuous data, but an exact standard error (SE) and confidence intervals (CIs) available for group means, and either a P value or T value available for differences in mean, we can calculate them according to the rules described in the Cochrane Handbook (Higgins 2011): When only the SE is reported, SDs are calculated by the formula SD = SE * square root (n). Chapters 7.7.3 and 16.1.3 of the Cochrane Handbook (Higgins 2011) present detailed formulae for estimating SDs from P values, T or F values, CIs, ranges or other statistics. If these formulae do not apply, we can calculate the SDs according to a validated imputation method which is based on the SDs of the other included studies (Furukawa 2006). Although some of these imputation strategies can introduce error, the alternative would be to exclude a given study’s outcome and thus to lose information. We nevertheless examined the validity of the imputations in a sensitivity analysis excluding imputed values.
3.3 Last observation carried forward
We anticipated that in some studies the method of last observation carried forward (LOCF) would be employed within the study report. As with all methods of imputation to deal with missing data, LOCF introduces uncertainty about the reliability of the results (Leucht 2007). Therefore, where LOCF data have been used in the trial, if less than 50% of the data have been assumed, we reproduced these data and indicated that they are the product of LOCF assumptions.
Assessment of heterogeneity
1. Clinical heterogeneity
We considered all included studies initially, without seeing comparison data, to judge clinical heterogeneity. We simply inspected all studies for clearly outlying people or situations which we had not predicted would arise. When such situations or participant groups arose, we fully discussed these.
2. Methodological heterogeneity
We considered all included studies initially, without seeing comparison data, to judge methodological heterogeneity. We simply inspected all studies for clearly outlying methods which we had not predicted would arise. When such methodological outliers arose, we fully discussed these.
3. Statistical heterogeneity
3.1 Visual inspection
We visually inspected graphs to investigate the possibility of statistical heterogeneity.
3.2 Employing the I2 statistic
We investigated heterogeneity between studies by considering the I2 method alongside the Chi2 P value. The I2 provides an estimate of the percentage of inconsistency thought to be due to chance (Higgins 2003). The importance of the observed value of I2 depends on i. magnitude and direction of effects and ii. strength of evidence for heterogeneity (e.g. a P value from Chi2 test, or a confidence interval for I2). An I2 estimate greater than or equal to around 50% accompanied by a statistically significant Chi2 statistic was interpreted as evidence of substantial levels of heterogeneity (Higgins 2011). When substantial levels of heterogeneity were found in the primary outcome, we explored reasons for heterogeneity (Subgroup analysis and investigation of heterogeneity).
Assessment of reporting biases
Reporting biases arise when the dissemination of research findings is influenced by the nature and direction of results (Egger 1997). These are described in Section 10 of the Cochrane Handbook (Higgins 2011). We are aware that funnel plots may be useful in investigating reporting biases but are of limited power to detect small‐study effects. We did not use funnel plots for outcomes where there were 10 or fewer studies, or where all studies were of similar sizes. In other cases, where funnel plots were possible, we sought statistical advice in their interpretation.
Data synthesis
We understand that there is no closed argument for preference for use of fixed‐effect or random‐effects models. The random‐effects method incorporates an assumption that the different studies are estimating different, yet related, intervention effects. This often seems to be true to us and the random‐effects model takes into account differences between studies even if there is no statistically significant heterogeneity. There is, however, a disadvantage to the random‐effects model: it puts added weight onto small studies which often are the most biased ones. Depending on the direction of effect, these studies can either inflate or deflate the effect size. We chose the fixed‐effect model for all analyses. The reader is, however, able to choose to inspect the data using the random‐effects model.
Subgroup analysis and investigation of heterogeneity
1. Subgroup analyses ‐ only primary outcomes
1.1 Clinical state, stage or problem
We proposed to undertake this review to provide an overview of the effects of haloperidol for people with schizophrenia in general. In addition, however, we tried to report data on subgroups of people in the same clinical state, stage and with similar problems.
We also undertook subgroup analyses comparing the results for the following:
-
male versus female participants;
-
under 18 years of age versus 18‐65 years old, versus older than 65 years;
-
acute versus chronic phase of illness;
-
low dose (≤ 5 mg/day) versus medium to high dose (> 5 mg/day), or as defined by each study;
-
use of anti‐Parkinson medication versus no use of anti‐Parkinson medication;
-
people diagnosed according to any operational criteria versus those who have not been diagnosed using operational criteria.
2. Investigation of heterogeneity
If inconsistency was high, we have reported this. First, we investigated whether data had been entered correctly. Second, if data were correct, we visually inspected the graph and successively removed outlying studies to see if homogeneity was restored.
When unanticipated clinical or methodological heterogeneity was obvious, we simply stated hypotheses regarding these for future reviews or versions of this review. We did not undertake analyses relating to these.
Sensitivity analysis
We applied all sensitivity analyses to the primary outcomes of this review.
1. Implication of randomisation
We aimed to include trials in a sensitivity analysis if they were described in some way so as to imply randomisation. For the primary outcomes, we included these studies and if there was no substantive difference when the implied randomised studies were added to those with better description of randomisation, then we entered all data from these studies.
2. Assumptions for lost binary data
Where assumptions had to be made regarding people lost to follow‐up (see Dealing with missing data), we compared the findings of the primary outcomes when we use our assumption/s and when we used data only from people who completed the study to that point. A sensitivity analysis was undertaken to test how prone results were to change when completer‐only data only were compared to the imputed data using the above assumption. If there was a substantial difference, we reported results and discussed them, but continued to employ our assumption.
3. Risk of bias
We analysed the effects of excluding trials that were judged to be at high risk of bias across one or more of the domains of randomisation (implied as randomised with no further details available): allocation concealment, blinding and outcome reporting for the meta‐analysis of the primary outcome. If the exclusion of trials at high risk of bias did not substantially alter the direction of effect or the precision of the effect estimates, then we included data from these trials in the analysis.
4. Imputed values
Had we included any cluster‐randomised trials, we would have undertaken a sensitivity analysis to assess the effects of including data from trials where imputed values were used for ICC in calculating the design effect in cluster‐randomised trials.
If we noted substantial differences in the direction or precision of effect estimates in any of the sensitivity analyses listed above, we did not pool data from the excluded trials with the other trials contributing to the outcome, but presented them separately.
Results
Description of studies
Please see Characteristics of included studies and Characteristics of excluded studies.
Results of the search
From the 2012 search, we added five new trials (Garcia 2009; Kane 2010; Meltzer 2004; NCT00044044 2002; Potkin 2008) to the included studies, taking the total number of included studies to 25. Previous searches in 2005 and 1998 produced 2161 references; in addition to our own search, Dr Jo Wood, at Janseen‐Cilag UK Limited, kindly carried out a search of an in‐house databases and provided a further 104 possible references. A total of 2250 references have now been screened and 134 full texts retrieved for further inspection (See Figure 1).
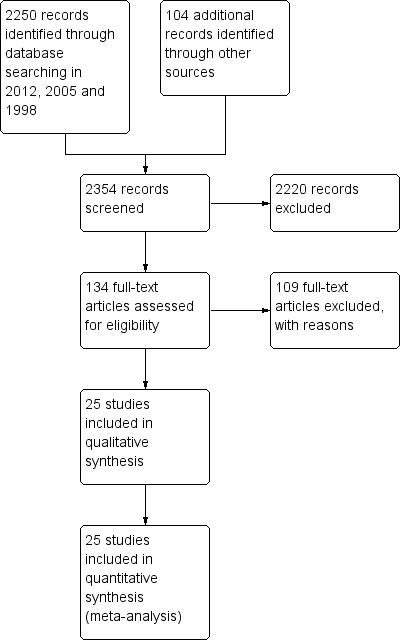
Study flow diagram.
Included studies
1. Methods
Most included studies had a parallel design, and four studies were cross‐over trials (Howard 1974; Nishikawa 1982; Spencer 1992; Vichaiya 1971). All studies were either stated or described as being randomised.
2. Length of trials
Schizophrenia is often chronic, and, in some cases, lifelong. This review categorised data into 'immediate' (up to six weeks), 'short‐term' (six weeks to six months), 'medium‐term' (six months to one year) and 'long ‐term' (over one year) follow‐up. Not one of the studies presented usable data on 'long‐term' follow‐up, only two (Nishikawa 1982; Nishikawa 1984) had a follow‐up of one year. Eight studies lasted for less than six weeks and the other 15 studies presented data that fell into the 'short‐term' category. A placebo wash‐out or a medication‐free period preceded treatment in all but six trials.
3. Participants
Fifteen studies included people with schizophrenia diagnosed by DSM‐III, DSM‐III‐R or DSM‐IV criteria. The other 10 studies included people with schizophrenia, but did not describe the means of diagnosis. Nishikawa 1982 and Nishikawa 1984 included people who were stable and in remission. Other studies also included a few people with other mental illnesses such as neurosis (Durost 1964) and major depressive disorder (Klieser 1989), in addition to people with schizophrenia. In these studies, only data for those suffering from schizophrenia were used. The majority of participants were hospitalised and chronically ill. Eight studies specifically stated that participants were currently acutely ill. Only one study included people who were under 18 years old (Spencer 1992) and none included people who were over 65 years of age. Most trials were of mixed sex. Howard 1974 and Vichaiya 1971 included only women, while Simpson 1967 and Bechelli 1983 included only men. Only Borison 1989 did not describe the sex of participants.
4. Setting
Trials mainly took place in inpatient settings. Two trials were conducted in outpatient settings (Nishikawa 1982 and Nishikawa 1984), and three in a mixture of inpatient and outpatient settings (Beasley 1996; Howard 1974; Kane 2010). Eleven studies were multi‐centre (Arvanitis 1997; Beasley 1996; Borison 1989; Chouinard 1993; Garcia 2009; Kane 2002; Kane 2010; Marder 1994; Meltzer 2004; NCT00044044 2002; Potkin 2008).
5. Study size
The included studies involved 4651 participants. The largest trial (Potkin 2008) randomised 621 people (although this review only uses data for the haloperidol (n = 124) and placebo groups (n = 127)), while the smallest study included only 12 participants (Spencer 1992). Seven of the 25 studies randomised fewer than 50 people and 11 were greater than 100. Nine of these randomised over 300 participants (Arvanitis 1997; Beasley 1996; Garcia 2009; Kane 2002; Kane 2010; Marder 1994; Meltzer 2004; NCT00044044 2002; Potkin 2008).
6. Interventions
A wide range of doses of haloperidol was used in the trials. The smallest doses were given in Spencer 1992 who used a range of 0.5 to 10 mg/day for children under 12 years of age and the greatest in Howard 1974 (doses up to 200 mg/day). Most studies used doses in the range of 4 mg/day to 20 mg/day. The majority of trials adjusted the dose according to need with only seven studies appearing to give a fixed dose throughout the trial (Garcia 2009; Kane 2010; Klieser 1989; Marder 1994; Potkin 2008; Simpson 1967; Vichaiya 1971). Most trials randomised to other drugs in addition to placebo. The other comparators included amitriptyline, asenapine, blonanserin, chlorpromazine, clopenthixol, diazepam, iloperidone, imipramine, loxapine, lurasidone, olanzapine, quetiapine, risperidone, thioridazine, thiothixene, trazodone and one trial (Meltzer 2004) also evaluated four receptor antagonists (5‐HT2A/2C, NK3, CB1 and NTS1 antagonists). Only six studies had the single comparison of haloperidol with placebo (Bechelli 1983; Durost 1964; Garry 1962; Jann 1997; Spencer 1992; Vichaiya 1971). Of these Vichaiya 1971 and Spencer 1992 were cross‐over trials. Fourteen studies stated that they used other medications to alleviate adverse effects or behaviour as required. These drugs included benztropine mesylate, biperiden, chloral hydrate, lorazepam, nitrazepam, paraldehyde, procyclidine, sodium amytal and trihexyphenidyl.
7. Outcomes
7.1 Missing outcomes
None of the studies evaluated patient or staff satisfaction. Death, suicide or self‐harm was also not mentioned in any study. Outcomes such as employment status, living status and community burden were not investigated in the included studies, nor were economic outcomes such as cost of care.
7.2 Scales
Twenty different instruments were used to collect data. Although all of the scales used were validated through peer review, only seven collected continuous data useful to this review. Details of the scales are shown below. Reasons for exclusion of data from the other instruments are given in the Characteristics of included studies. Frequently, despite using a scale, no data were presented, or means were reported without a variance.
7.2.1 Mental state
i. Brief Psychiatric Rating Scale ‐ BPRS (Overall 1962)
This is used to assess the severity of abnormal mental state. The original scale has 16 items, but a revised 18‐item scale is commonly used. Each item is defined on a seven‐point scale varying from 'not present' to 'extremely severe', scoring from zero to six or one to seven. Scores can range from zero to 126, with high scores indicating more severe symptoms. Bechelli 1983, Borison 1992a, Jann 1997 and Klieser 1989 reported data from this scale.
ii. Calgary Depression Scale ‐ CDS (Addington 1990)
The CDS is a nine‐item special purpose scale designed to measure depression in patients with chronic schizophrenia. Each item is rated from zero ‐ absent to three ‐severe. Kane 2010 reported data from this scale.
iii. Positive and Negative Syndrome Scale ‐ PANSS (Kay 1986)
This schizophrenia scale has 30 items, each of which can be defined on a seven‐point scoring system varying from one (absent) to seven (extreme). This scale can be divided into three sub‐scales for measuring the severity of general psychopathology, positive symptoms (PANSS‐P), and negative symptoms (PANSS‐N). A low score indicates lesser severity. Garcia 2009 and Kane 2010 reported data from this scale.
7.2.2 Global state
i. Clinical Global Impression – CGI (Guy 1976)
A rating instrument commonly used in studies on schizophrenia that enables clinicians to quantify severity of illness and overall clinical improvement. A seven‐point scoring system is usually used with low scores indicating decreased severity and/or greater recovery. Garcia 2009 and Kane 2010 reported data from this scale.
7.2.3 Adverse effects
i. Simpson‐Angus Scale ‐ SAS (Simpson 1970)
This scale was employed to measure extrapyramidal symptoms. The 10‐item SAS is used to evaluate the presence and severity of parkinsonian symptomatology and other extrapyramidal effects. Higher scores reflect more adverse effects. This scale was used by Kane 2010.
ii. Barnes Akathisia Scale – BAS (Barnes 1989)
This is a 12‐item scale consisting of a standardised examination followed by questions rating the orofacial, extremity and trunk movements, as well as three global measurements. Each of these 10 items can be scored from zero (none) to four (severe). Two additional items assess the dental status. The BAS ranges from zero to 40, with higher scores indicating greater severity. This scale was used by Kane 2010.
iii. Abnormal Involuntary Movement Scale ‐ AIMS (Guy 1976)
This is a 12‐item clinician‐rated scale to assess severity of dyskinesias (specifically, orofacial movements and extremity and truncal movements) in patients taking neuroleptic medications. Items are scored on a scale of zero (none) to four (severe) basis; the scale provides a total score (items one through seven) or item eight can be used in isolation as an indication of overall severity of symptoms. This scale was used by Kane 2010.
Ongoing trials
As far as we are aware, there are currently no ongoing trials evaluating oral haloperidol versus placebo.
Studies awaiting assessment
There are currently no studies awaiting assessment.
Excluded studies
Of the 109 excluded studies, we excluded 24 because they were not randomised and/or allocation was unclear. We excluded another nine because the participants were not suffering from schizophrenia. We excluded 31 because they compared haloperidol with another antipsychotic without a placebo group. We excluded seven studies because they administered haloperidol by intramuscular injection, not orally. We excluded five more studies because they were withdrawal trials. In these trials, people stable on haloperidol were randomised to placebo or to continue their usual dose of haloperidol. As this review is, at present, focusing on instigation studies of haloperidol, we excluded these trials. We eventually excluded a further 22 studies because all outcome data were impossible to use. Seven of these were only published as conference proceedings and information was not available in the short abstract. We have contacted the authors of these studies for additional data and this data may be included in later versions of this review. We excluded one cross‐over study (Rees 1965) as no data were provided for the first arm of the trial. Three studies had losses to follow‐up greater than 50%, but data could not be added for leaving the study early: Zimbroff 1997 only reported the total number of losses, not per treatment group; Browne 1988 allowed people who had relapsed to re‐enter the study under single‐blind conditions; and North America 1997 combines data from several centres, which combined has greater than 50% loss, instead data from publications of specific centres have been included (Chouinard 1993; Marder 1994). The other six either reported data incorrectly. We had to exclude Pool 1976 and Price 1987 because they replaced people who withdrew from the trial with people whom they did not randomise and presented outcomes that included data from these non‐random additions.
Risk of bias in included studies
See also 'Risk of bias' tables in Characteristics of included studies, and Figure 2 and Figure 3.

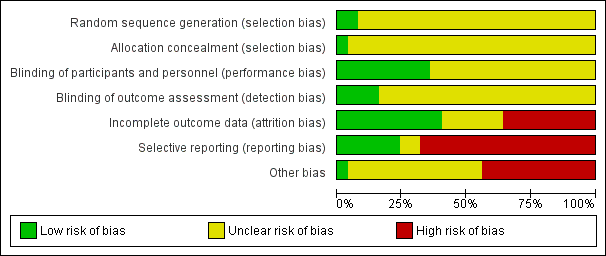
'Risk of bias' graph: review authors' judgements about each risk of bias item presented as percentages across all included studies.

'Risk of bias' summary: review authors' judgements about each risk of bias item for each included study.
Allocation
All included studies were reported as randomised. A few studies mentioned the use of 'randomised blind schedules' (Borison 1989; Klieser 1989) and/or patient codes (Bechelli 1983; Spencer 1992; Simpson 1967) but it was not stated how these were generated or used. We therefore categorised these studies as unclear risk of bias. Only two studies reported method of generation of randomisation sequence and were rated low risk of bias (Garcia 2009 and Garry 1962).
Only one study (Garry 1962) reported method of allocation concealment and was rated low risk of bias, whereas the other studies did not provide any details and were rated unclear risk of bias for allocation concealment.
Blinding
All studies were reported to be double‐blind although this was difficult to maintain due to the appearance of characteristic adverse side effects when administering haloperidol. Some trials tried to overcome this by masking some of the side effects with antiparkinson medication. Nine studies were rated low risk of bias for blinding of participants and personnel, most of these specifically stated blindness was achieved through use of identical capsules and/or bottles of medication (Chouinard 1993, Garcia 2009, Howard 1974, Jann 1997, Nishikawa 1982, Nishikawa 1984, Serafetinides 1972, Selman 1976), but no trial tested whether their attempts at blinding had been successful. Only four studies described outcome assessors as being blinded to treatment and were rated low risk of bias (Bechelli 1983, Durost 1964, Kane 2002 and Selman 1976). The remaining studies were of unclear risk of bias as no information on blinding of outcome assessors was provided.
Incomplete outcome data
Ten studies were rated as low risk of bias for incomplete outcome data and six studies had an unclear risk of bias. Nine studies were rated as high risk of bias, for seven of these it was due to more than 50% of losses to follow‐up (Arvanitis 1997; Beasley 1996; Chouinard 1993; Marder 1994; Meltzer 2004; NCT00044044 2002; Potkin 2008). For these studies only the outcome 'Leaving the study early' was collected for the review, see Dealing with missing data.
Selective reporting
Six studies were of low risk of bias with regard to selective reporting, and two were unclear. The remaining 17 studies were of high risk of bias, mainly due to poor data reporting. Overall, there were very little data that were possible to use from the 25 included trials. Continuous data were particularly problematic. Many studies presented findings without standard deviations or any other measure of variance, in graphs, in percentiles or by inexact P values. 'P' values are commonly used as a measure of association between intervention and outcomes instead of showing the strength of the association. Further, many pre‐planned outcomes were not reported at all.
Other potential sources of bias
Eleven trials were subject to other biases as they were either partly or fully funded by the pharmaceutical industry. Only one study was of low risk of bias for other potential sources of bias (Serafetinides 1972) and the remaining 13 had an unclear risk of bias, three of which had the drugs used in the trials provided by the pharmaceutical industry.
Effects of interventions
See: Summary of findings for the main comparison HALOPERIDOL versus PLACEBO for schizophrenia
1. Comparison: HALOPERIDOL versus PLACEBO
We grouped outcomes as immediate (up to six weeks), short (six weeks to six months), medium (six months to one year) and long term (over one year). We used risk ratios (RR) for dichotomous data and mean differences (MD) for continuous data, with their respective 95% confidence intervals (CIs) throughout.
1.1 Death – suicide or natural causes
None of the 25 included studies reported on this outcome.
1.2 Global state
1.2.1 Overall improvement
Results favoured haloperidol (Analysis 1.1). Four trials found that a marked improvement was significantly more likely at up to six weeks with haloperidol (n = 472, RR 0.67 CI 0.56 to 0.80) compared with placebo. Results were heterogenous (I2 = 72%); when the data are analysed using random‐effects, the result remains significant (RR 0.59 CI 0.39 to 0.89). This heterogeneity is explored in the results of subgroup analyses (Analysis 1.21; Analysis 1.22), and in sensitivity analysis (Analysis 1.23). We found, when splitting the studies by low dose and medium to high dose, the heterogeneity was removed (see subgroup analysis section 2.4, Analysis 1.21).
A further eight trials also found a significant difference favouring haloperidol across the six weeks to six months period (n = 307, RR 0.67 CI 0.58 to 0.78). Serafetinides 1972 reported results for 'nurse‐rated' global improvement across this time period, as opposed to the other 'clinician‐rated' trials, and found similar results favouring haloperidol (n = 28, RR 0.59 CI 0.37 to 0.92).
Garcia 2009 and Kane 2010 reported average change at six weeks on the CGI‐S scale (Analysis 1.2). Results favoured haloperidol (n = 353, MD ‐0.49 CI ‐0.73 to ‐0.25).
1.2.2 Hospital discharge
Only one study, Howard 1974 reported usable data on hospitalisation‐related outcomes. This small trial found no difference between haloperidol and placebo for not being discharged from hospital between six weeks and six months (1 RCT n = 33; Analysis 1.3).
1.2.3 Relapse
Only two studies reported on relapse. Nishikawa 1982 and Nishikawa 1984 found that once a person's illness was stable and in remission, if haloperidol was started, it was more likely to keep people in remission than placebo (n = 70, RR 0.69 CI 0.55 to 0.86; Analysis 1.4).
1.2.4 Leaving the study early
Sixteen studies with up to six weeks follow‐up, found that people allocated to haloperidol were more likely to remain in the study than participants receiving placebo (n = 1812, RR 0.87 CI 0.80 to 0.95). At six weeks to six months follow‐up, results were equivocal (8 RCTs n = 304), as they were for Nishikawa 1984 at one year follow‐up (n = 50; Analysis 1.5).
We did not identify any studies reporting on re‐admission or satisfaction with treatment.
1.3 Mental state
Only six studies had useable data on mental state outcomes.
1.3.1 Overall improvement
No significant difference was found at up to six weeks follow‐up by Borison 1992a when measuring clinical improvement by reduction in BPRS scores by at least 20% (n = 24; Analysis 1.6).
1.3.2 General symptoms
The result from three studies showed a significant difference favouring haloperidol for the average BPRS score at six weeks (n = 108, MD ‐9.76 CI ‐14.60 to ‐4.93; Analysis 1.7), but with significant heterogeneity (I2 = 81.9). Removing the study with results that were causing this heterogeneity, as judged by visual inspection (Klieser 1989, which reported average change data, whereas the other two studies, Bechelli 1983 and Jann 1997, reported average and point data), eliminates this heterogeneity. However, it is unclear what the reason for heterogeneity is because there are only three, small studies included. Finally, for average change at six weeks on the PANSS total scale, data from Garcia 2009 favoured haloperidol (n = 119, MD ‐15.58 CI ‐23.92 to ‐7.24; Analysis 1.8).
1.3.3 Positive symptoms
Garcia 2009 and Kane 2010 found an improvement in symptoms favouring haloperidol on the PANSS positive scale average change scores at six weeks (n = 353, MD ‐3.29 CI ‐4.70 to ‐1.89; Analysis 1.9). Results were heterogenous (I2 = 83%) and there was no obviously outlying study out of the two. When the results are analyses using random‐effects, the results remain significant (MD ‐3.97 CI ‐7.72 to ‐0.23).
1.3.4 Negative symptoms
Similarly, the same two studies found an improvement in symptoms on the PANSS negative scale average change scores at six weeks favouring haloperidol (n = 353, MD ‐1.18 CI ‐2.32 to ‐0.04; Analysis 1.10).
1.3.5 Mood
Kane 2010 found no significant difference for depression between haloperidol and placebo on the CDS average change scores (n = 234; Analysis 1.11).
1.4 Behaviour
None of the 25 included studies reported on behaviour outcomes such as social functioning, employment status or violent incidents.
1.5 Adverse effects
1.5.1 Movement disorders
Haloperidol causes various extrapyramidal adverse effects (Analysis 1.12), such as akathisia (6 RCTs n = 695, RR 3.66 CI 2.24 to 5.97), dystonia (5 RCT n = 471, RR 11.49 CI 3.23 to 40.85), parkinsonism (5 RCTs n = 485, RR 5.48 CI 2.68 to 11.22), rigidity (5 RCTs n = 461, RR 4.98 CI 2.74 to 9.05), and tremor (5 RCTs n = 447, RR 3.93 CI 1.96 to 7.91). Further, haloperidol increases the need for anti‐Parkinson medication (4 RCTs n = 480, RR 3.23 CI 2.20 to 4.72). However, data from the small study Selman 1976 (n = 33) found no difference between placebo and haloperidol groups for teeth grinding or 'thick' speech. A further two studies found no difference for oculogyric crises (2 RCTs n = 83).
Garcia 2009 and Howard 1974 found no evidence that haloperidol causes tardive dyskinesia or dyskinesia (2 RCTs n = 157; Analysis 1.13).
Kane 2010 provided data measuring movement disorder average change scores on three different scales (Analysis 1.14). No difference was found on the AIMS scale (1 RCT n = 231), whereas placebo was favoured on the BAS (1 RCT n = 231, MD 0.31 CI 0.10 to 0.52) and SAS (n = 231, MD 1.48 CI 0.76 to 2.20) scales.
1.5.2 Other central nervous system (CNS) effects
Selman 1976 and Kane 2002 found haloperidol appeared more likely to produce blurred vision than placebo (2 RCTs, n = 240, RR 3.96 CI 1.21 to 12.93). Selman 1976 (n = 33) found no clear differences between haloperidol and placebo for confusion or dry mouth. Kane 2010 found no difference between groups for sedation (n = 238; see Analysis 1.15).
1.5.3 Cardiovascular effects
Three studies were unable to demonstrate clear differences between groups for incidences of low blood pressure (3 RCTs, n = 245), and Borison 1989 also found no effect for raised blood pressure (1 RCT n = 16). Similarly, Garcia 2009 (n = 124) found no difference between haloperidol and placebo for bradycardia (See Analysis 1.16).
1.5.4 Other adverse effects
Seven studies found haloperidol more likely to induce sleepiness than placebo (7 RCTs, n = 686, RR 3.09 CI 1.51 to 6.31). Kane 2002 and Kane 2010 found haloperidol more likely to cause weight gain (2 RCTs, n = 441, RR 4.89 CI 1.41 to 16.95).
No significant differences between haloperidol and placebo groups were found for the following adverse effects: agitation (2 RCTs n = 362), anxiety (2 RCTs n = 362), drooling (3 RCTs n = 207), facial oedema (1 RCT n = 33), headache (4 RCTs n = 593), infection (1 RCT n = 24), insomnia (4 RCTs n = 629), nausea/vomiting (2 RCTs n = 231), oral hypoaesthesia (1 RCT n = 238), perspiration (2 RCTs n = 93), or weight loss (3 RCTs n = 385). (See Analysis 1.17).
1.6 Economic outcomes
None of the 25 included studies reported on economic outcomes such as cost of care.
2. Subgroup analyses
2.1 Gender: men versus women
Most studies included both men and women but did not report results separated by gender. The only primary outcome where results are available for comparison is 'Global state: Overall improvement: No marked global improvement, > 6‐24 weeks' (Analysis 1.18). Howard 1974 and Vichaiya 1971 included only women, whereas, Simpson 1967 only men. Results were equally significant for both subgroups (P = 0.20).
2.2 Age: adult (18‐65 years) versus child (< 18 years)
All studies, except Spencer 1992, which included only children, included adult participants. For 'Global state: Overall improvement: No marked global improvement, > 6‐24 weeks' (Analysis 1.19) there were no differences between subgroups (P = 0.07).
2.3 Phase of illness: acute versus chronic
Again, only 'Global state: Overall improvement: No marked global improvement, > 6‐24 weeks' had sufficient data for a comparison to be made among the primary outcomes (Analysis 1.20). There were no differences between subgroups (P = 0.58).
2.4 Dose: low dose (≤ 5 mg/day) versus medium to high dose (> 5 mg/day), or as defined by each study
Heterogeneity (I2 = 72%) was observed for 'Global state: Overall improvement: No marked global improvement, up to six weeks' (Analysis 1.1). When splitting the studies by dose, the heterogeneity was removed, and results from low dose Kane 2010 show no statistically significant difference between haloperidol and placebo, whereas medium to high dose Bechelli 1983, Garcia 2009 and Selman 1976 favour haloperidol (P = 0.003; Analysis 1.21). For 'Global state: Overall improvement: No marked global improvement, > 6‐24 weeks' results were equally significant for both subgroups (P = 1.00).
2.5 Anti‐Parkinson drugs: administration of any anti‐Parkinson drug (any dose) versus administration of haloperidol alone.
We could not perform this subgroup analysis as data for primary outcomes were only available from studies where anti‐Parkinson medication was allowed.
2.6 Diagnosis of schizophrenia: operational criteria versus non‐operational diagnoses
The heterogeneity of 'Global state: Overall improvement: No marked global improvement, up to six weeks' (Analysis 1.1) does not diminish or disappear with this subgroup analysis (Analysis 1.22), and no differences between subgroups were observed (P = 0.90). Similarly, there were no differences between subgroups for 'Global state: Overall improvement: No marked global improvement, > 6‐24 weeks' (P = 0.07) or for 'Global state: Relapse' (P = 0.59).
3. Sensitivity analyses
3.1 Implications for randomisation
All included studies either described the method of randomisation or stated that the study was randomised. Had there been studies implying randomisation without stating or describing, we would have performed this sensitivity analysis.
3.2 Assumptions for lost binary data
For 'Global state: Overall improvement: No marked global improvement, up to 6 weeks' one study (Garcia 2009) used LOCF assumptions about missing data. When this study was removed from the analysis the results remained significant (Analysis 1.23), and heterogeneity from the pooled analysis (Analysis 1.1) remains.
3.2 Risk of bias
No studies were judged to be at high risk of bias across one or more of the domains of randomisation and therefore no sensitivity analysis was undertaken.
3.4 Imputed values
Had we included any cluster‐randomised trials, we would have undertaken a sensitivity analysis to assess the effects of including data from trials where we used imputed values for ICC in calculating the design effect in cluster‐randomised trials.
3.5 On dishonest researchers
It has come to our attention that Dr Richard Borison and Dr Bruce Diamond have been convicted of theft, making false statements and violations of state racketeering law in the USA. At this point, it seems that crimes were to do with criminal diversion of funds, rather than falsifying study data (http://www.the‐scientist.com/?articles.view/articleNo/19152/title/Notebook/). Nevertheless, we temporarily removed studies with either of these authors from the analyses to see if this made a substantive difference to the findings. Arvanitis 1997 only provided data for leaving the study early. Borison 1989 and Borison 1992a also reported on this outcome but also presented usable data on mental state (< 20% reduction in BPRS), and a range of adverse effects. In every case, where data from these trials are added to those of others, removal of the studies never resulted in substantive changes in the findings. For example, most data are available for the outcome of leaving the study early. With all trials included, the results favour the haloperidol group (16 RCTs n = 1812, RR 0.87 CI 0.80 to 0.95; Analysis 1.5). Removing the three studies results in no change. Where difficulties arise is where Borison 1989 or Borison 1992a report unique outcomes. In these cases, of course, removal of the study results in the deletion of the complete outcome. This applies to the outcome of < 20% reduction in BPRS (Analysis 1.6), and the adverse effects of high blood pressure (Analysis 1.16) and infection (Analysis 1.17) (see Potential biases in the review process).
4. Reporting biases (publication bias)
Only one outcome in this review lent itself to producing a funnel plot, i.e. had more than 10 included studies; 'Global state: Leaving the study early, up to six weeks'. The funnel plot was symmetrical for this outcome.
Discussion
Summary of main results
Twenty‐five trials enrolling 4651 participants met the inclusion criteria. The summary below reflects the outcomes chosen for summary of findings Table for the main comparison, and considered the main findings of this review that can support evidence‐based decision making.
1. Overall global improvement
Moderate quality evidence indicates that the efficacy of haloperidol for improving global state is 33% for both up to six weeks follow‐up and for six weeks to six months follow‐up. In the clinical environment haloperidol is clearly a valuable antipsychotic. However, there were no studies that reported on this outcome beyond six months.
2. Hospital discharge
Only one, small study (Howard 1974), reported on discharge from hospital and no significant differences were observed.
3. Relapse
Results from two small studies (Nishikawa 1982 and Nishikawa 1984) show that haloperidol reduced the number of participants experiencing a relapse by 31% from six months to one year follow‐up. Based solely on this very low quality evidence, we cannot say whether haloperidol prevents relapses in real, clinical settings.
4. Leaving the study early
Just less than half those allocated haloperidol and just over half of those given placebo did not complete the six‐week studies. Although the result does favour haloperidol, this is a shocking loss of data and much greater than is seen in the companion review, 'Chlorpromazine versus placebo for schizophrenia' (Adams 2007). There is no suggestion that this attrition, much greater than would be expected in normal clinical practice, has changed over three decades of trials. Clearly the trial design is either unacceptable to participants or is asking researchers to withdraw participants for reasons that are not apparent to those reading the final reports. In any event this is not acceptable.
5. Mental state
We expected more data on the specific symptoms of schizophrenia. One set of mental state data were presented in a study undertaken by dishonest researchers (Borison 1992a), where no differences were observed between haloperidol and placebo. Results from change data on the BPRS scale from Klieser 1989 also showed no differences. On the other hand, Bechelli 1983 and Jann 1997 (n = 72) found a significant difference, favouring haloperidol, by approximately 12 points on the BPRS at six weeks. Garcia 2009 (n = 119) and Kane 2010 (n = 234) reported data from the PANSS; they found significant results favouring haloperidol on the total (by 15.6 points), positive (by 3.3 points) and negative (by 1.2 points) subscales. We are unsure whether these are clinically significant findings.
6. Adverse effects
Use of haloperidol has long been associated with movement disorders, and trial‐derived data would seem to fit with clinical experience. Evidence from this review indicate that haloperidol causes different extrapyramidal symptoms (EPS) such as akathisia, dystonia, parkinsonism, rigidity and tremor, and more people given haloperidol needed anti‐Parkinson medication than those given placebo. On the other hand, there was no evidence that haloperidol causes other EPS such as oculogyric crises, teeth grinding, or 'thick' speech. There were so few long‐term data that rates of tardive dyskinesia were difficult to quantify with confidence. Although not noted as being a sedating antipsychotic, haloperidol does commonly induce sleepiness. Also, people given haloperidol tend to gain weight.
7. Subgroup analyses
The power to detect a real difference between studies in any one of the subgroup analyses was very low. The only statistically significant difference was for low versus medium to high dose for the outcome 'Global state: Overall improvement: No marked global improvement, up to six weeks'. Pooled results for this outcome had high heterogeneity (I2 = 72%); this heterogeneity disappeared when trials were split into subgroups of low and medium to high dose haloperidol. For low dose (4 mg/day), Kane 2010 did not observe any difference in global improvement between haloperidol and placebo, whereas for medium to high doses (> 5 mg/day), Bechelli 1983, Garcia 2009 and Selman 1976 found that haloperidol was 52% more effective than placebo.
Overall completeness and applicability of evidence
Completeness
Given that haloperidol is so widely used in routine practice across the world, and is a common control drug for randomised trials of new compounds, readers may have expected more data; certainly we did. We were especially surprised not to find a single study that reported on deaths. In addition, no study reported on satisfaction with treatment, cost of care or behavioural outcomes. Also, only one study reported on hospitalisation and only two on relapse. If further data from randomised trials become available, this review will be updated and might report results with greater confidence. Nevertheless, to date, this systematic review represents a rare attempt to quantify the effects of this potent antipsychotic in some clinically meaningful terms.
Applicability
The 25 included studies in this review included many people who would be recognisable in everyday practice. There were those with strictly diagnosed illness and those whose illness was diagnosed using less rigorous criteria; the results of the subgroup analyses on diagnostic rigour (see Effects of interventions, section 2.6) support the assertion that the results are widely applicable. However, most studies were undertaken in hospital, whereas the great majority of people with schizophrenia are in the community, and thus, generalising to treatment in community settings could be problematic.
In addition, the dose of haloperidol in 68% of the included studies was high (10‐200 mg/day), see Characteristics of included studies, and one of the subgroup analyses on dose revealed a difference between low‐ and medium‐ to high‐dose haloperidol (see Effects of interventions section 2.4) suggesting results may not be fully applicable to any haloperidol dose.
Finally, most studies were conducted in Europe and North America, therefore, results may not be applicable to Africa, Asia, Australia or South America.
Quality of the evidence
The quality of the evidence is moderate to very low based on GRADE (Schünemann 2008). Overall, outcomes with a small number of participants were rated very low quality, and other outcomes moderate quality. None were rated high quality as most studies had an overall unclear to high risk of bias. The great majority of studies did not report the method of randomisation, and only one trial described the method of allocation concealment. Although all studies were reported to be double‐blind, it was not clearly described in most trials. Thirty‐six per cent out of the included studies were rated as high risk of bias for incomplete outcome reporting, mainly due to very high losses to follow‐up. Data presentation was poor, with most scale data rendered unusable (see Characteristics of included studies). Studies failed to report variances, reported only P values, or did not report the result at all. In this way a lot of potentially informative data were lost. Consequently, 68% of the trials were rated as high risk of selective reporting bias. With closer adherence to the CONSORT statement (Begg 1996), data reporting should improve, although it should be noted that some of the most recent trials (Garcia 2009 and Kane 2002) still failed to present standard deviations for some or all of their continuous data.
Potential biases in the review process
1. Failing to identify old trials
We identified trials by meticulous searching, including Janssen‐Cilag UK helping the original search. Despite this, it is reasonable to assume that no data set is complete for haloperidol, one of the oldest antipsychotic drugs. Nevertheless, we do not feel that we have omitted very many highly influential studies.
2. Under‐reporting of trial methodology
As can be seen in Figure 2, most trials were rated unclear risk of bias for randomisation generation, allocation concealment and blinding. This was because the trial reports did not specify the methods adequately. Consequently, we downgraded the quality of the evidence in the summary of findings Table for the main comparison, and by doing so we may have introduced bias.
3. Sensitivity analyses on dishonest researchers
We felt that it would be harsh to immediately delete all trial data associated with Drs Borison and Diamond without empirical data. That removal of their data makes no discernable difference to any outcome is reassuring.
Agreements and disagreements with other studies or reviews
We know of two systematic reviews of randomised controlled trials that evaluate haloperidol versus placebo for schizophrenia: i. Gao 2008 systematically reviewed extrapyramidal side effects and, similar to our results, found that there was a higher risk of developing akathisia and overall EPS with haloperidol compared with placebo; ii. Klemp 2011 reviewed the clinical efficacy and adverse effects of four atypical antipsychotics compared with haloperidol and placebo, and in agreement with our results found that haloperidol had a significantly better antipsychotic effect than placebo, and that haloperidol induces weight gain and EPS compared with placebo.

Study flow diagram.
'Risk of bias' graph: review authors' judgements about each risk of bias item presented as percentages across all included studies.

'Risk of bias' summary: review authors' judgements about each risk of bias item for each included study.
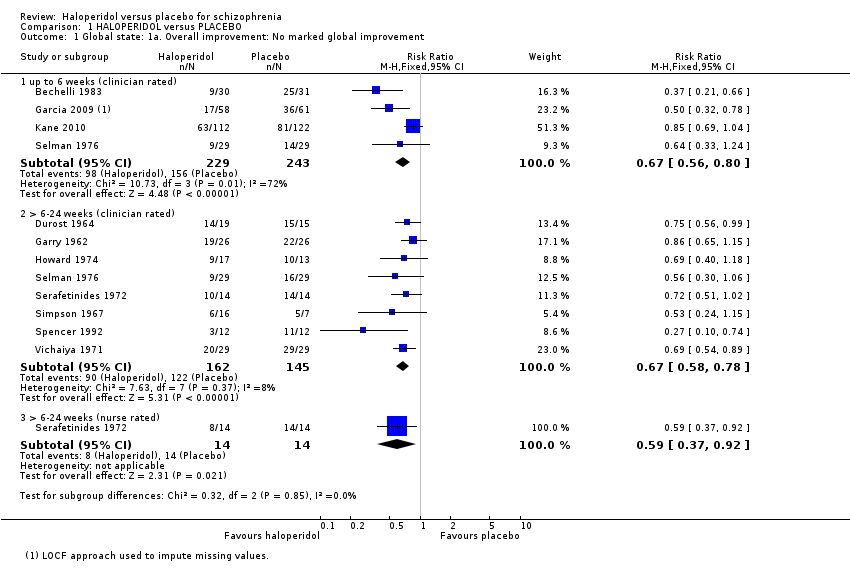
Comparison 1 HALOPERIDOL versus PLACEBO, Outcome 1 Global state: 1a. Overall improvement: No marked global improvement.

Comparison 1 HALOPERIDOL versus PLACEBO, Outcome 2 Global state: 1b. Overall improvement: Average change in CGI‐S score (up to 6 weeks; high = poor).
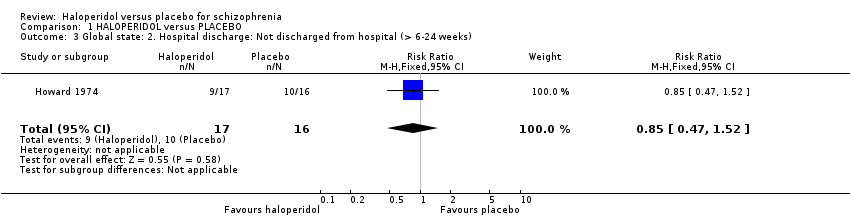
Comparison 1 HALOPERIDOL versus PLACEBO, Outcome 3 Global state: 2. Hospital discharge: Not discharged from hospital (> 6‐24 weeks).

Comparison 1 HALOPERIDOL versus PLACEBO, Outcome 4 Global state: 3. Relapse (< 52 weeks).
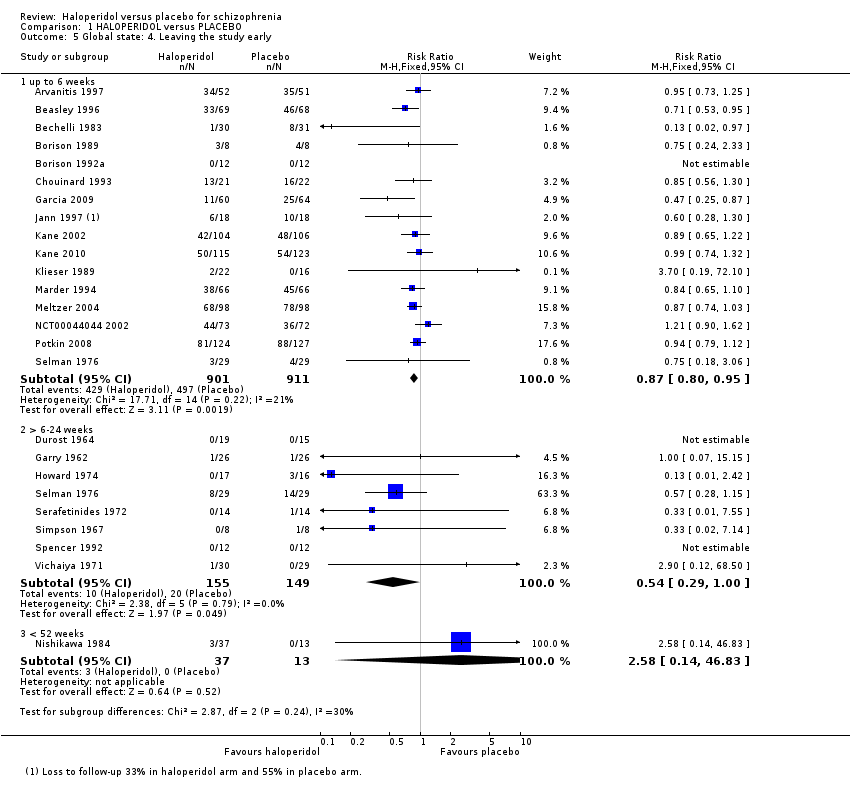
Comparison 1 HALOPERIDOL versus PLACEBO, Outcome 5 Global state: 4. Leaving the study early.

Comparison 1 HALOPERIDOL versus PLACEBO, Outcome 6 Mental state: 1. No clinical improvement (< 20% reduction in BPRS score; up to 6 weeks).

Comparison 1 HALOPERIDOL versus PLACEBO, Outcome 7 Mental state: 2a. General symptoms: Average BPRS total score (up to 6 weeks; high = poor).
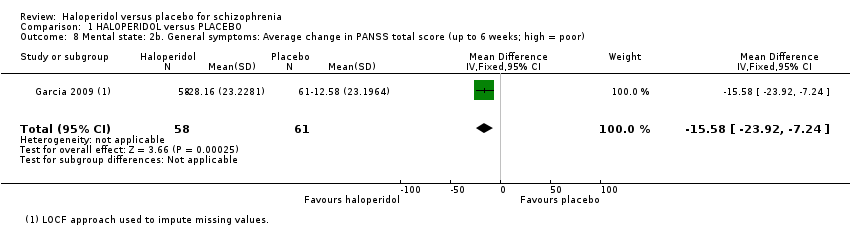
Comparison 1 HALOPERIDOL versus PLACEBO, Outcome 8 Mental state: 2b. General symptoms: Average change in PANSS total score (up to 6 weeks; high = poor).

Comparison 1 HALOPERIDOL versus PLACEBO, Outcome 9 Mental state: 3. Positive symptoms: Average change in PANSS positive score (up to 6 weeks; high = poor).

Comparison 1 HALOPERIDOL versus PLACEBO, Outcome 10 Mental state: 4. Negative symptoms: Average change in PANSS negative score (up to 6 weeks; high = poor).

Comparison 1 HALOPERIDOL versus PLACEBO, Outcome 11 Mental state: 5. Mood: Average change in CDS score (up to 6 weeks; high = poor).

Comparison 1 HALOPERIDOL versus PLACEBO, Outcome 12 Adverse effects: 1a. Movement disorders: Extrapyramidal symptoms.
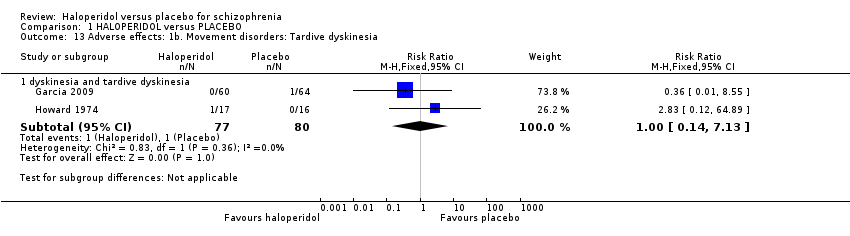
Comparison 1 HALOPERIDOL versus PLACEBO, Outcome 13 Adverse effects: 1b. Movement disorders: Tardive dyskinesia.
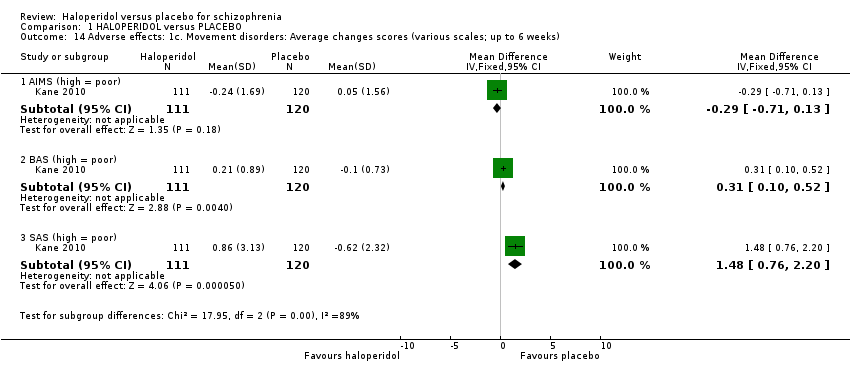
Comparison 1 HALOPERIDOL versus PLACEBO, Outcome 14 Adverse effects: 1c. Movement disorders: Average changes scores (various scales; up to 6 weeks).

Comparison 1 HALOPERIDOL versus PLACEBO, Outcome 15 Adverse effects: 2. Other CNS.

Comparison 1 HALOPERIDOL versus PLACEBO, Outcome 16 Adverse effects: 3. Cardiovascular effects.

Comparison 1 HALOPERIDOL versus PLACEBO, Outcome 17 Adverse effects: 4. Other adverse effects.
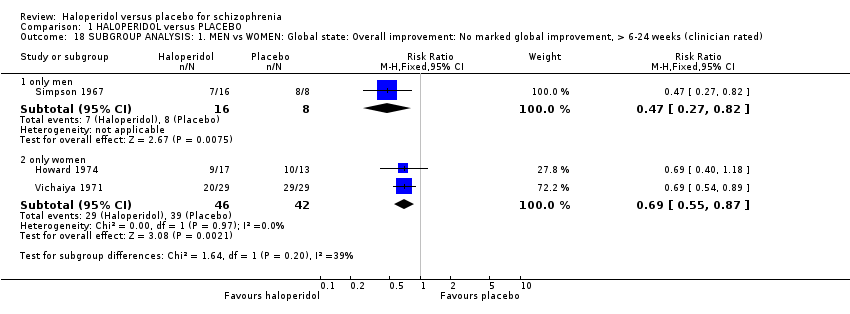
Comparison 1 HALOPERIDOL versus PLACEBO, Outcome 18 SUBGROUP ANALYSIS: 1. MEN vs WOMEN: Global state: Overall improvement: No marked global improvement, > 6‐24 weeks (clinician rated).
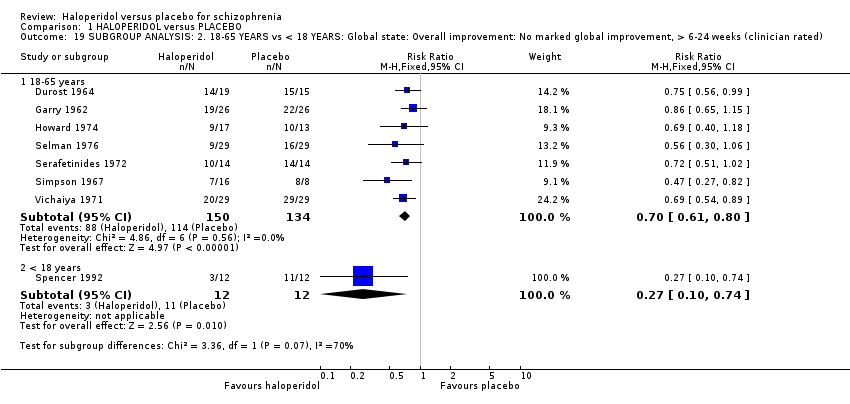
Comparison 1 HALOPERIDOL versus PLACEBO, Outcome 19 SUBGROUP ANALYSIS: 2. 18‐65 YEARS vs < 18 YEARS: Global state: Overall improvement: No marked global improvement, > 6‐24 weeks (clinician rated).

Comparison 1 HALOPERIDOL versus PLACEBO, Outcome 20 SUBGROUP ANALYSIS: 3. ACUTE vs CHRONIC: Global state: Overall improvement: No marked global improvement, > 6‐24 weeks (clinician rated).

Comparison 1 HALOPERIDOL versus PLACEBO, Outcome 21 SUBGROUP ANALYSIS: 4. LOW DOSE vs MEDIUM TO HIGH DOSE.
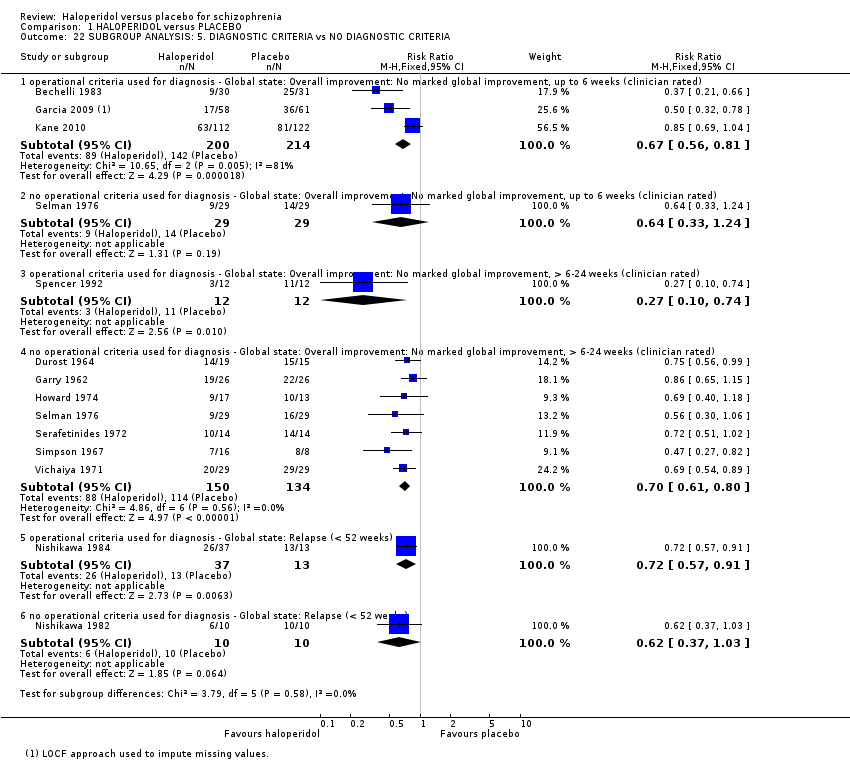
Comparison 1 HALOPERIDOL versus PLACEBO, Outcome 22 SUBGROUP ANALYSIS: 5. DIAGNOSTIC CRITERIA vs NO DIAGNOSTIC CRITERIA.

Comparison 1 HALOPERIDOL versus PLACEBO, Outcome 23 SENSITIVITY ANALYSIS: 1. ASSUMPTIONS FOR MISSING DATA vs NO ASSUMPTIONS FOR MISSING DATA: Global state: Overall improvement: No marked global improvement, up to 6 weeks (clinician rated).
| HALOPERIDOL versus PLACEBO for schizophrenia | ||||||
| Patient or population: patients with schizophrenia | ||||||
| Outcomes | Illustrative comparative risks* (95% CI) | Relative effect | No of Participants | Quality of the evidence | Comments | |
| Assumed risk | Corresponding risk | |||||
| Control | HALOPERIDOL versus PLACEBO | |||||
| Death ‐ suicide and natural causes | See comment | See comment | Not estimable | 0 | See comment | No studies reported on this outcome. |
| Overall improvement: No marked global improvement | 841 per 1000 | 564 per 1000 | RR 0.67 | 307 | ⊕⊕⊕⊝ | Another four trials reported on this outcome at up to six weeks follow‐up, and one trial at > 6‐24 weeks follow‐up using a nurse‐rated scale, both sub‐analyses showed significant results in favour of haloperidol. |
| Not discharged from hospital | 625 per 1000 | 531 per 1000 | RR 0.85 | 33 | ⊕⊝⊝⊝ | |
| Relapse | 1000 per 1000 | 690 per 1000 | RR 0.69 | 70 | ⊕⊝⊝⊝ | |
| Leaving the study early | 134 per 1000 | 72 per 1000 | RR 0.54 | 304 | ⊕⊕⊕⊝ | Another 16 trials reported on this outcome at up to six weeks follow‐up showing a significant result in favour of haloperidol. One trial at < 52 weeks follow‐up showed no difference between haloperidol and placebo. |
| Satisfaction with treatment | See comment | See comment | Not estimable | 0 | See comment | No studies reported on this outcome. |
| Adverse effects: Movement disorders ‐ parkinsonism | 28 per 1000 | 154 per 1000 | RR 5.48 | 485 | ⊕⊕⊕⊝ | Several studies also reported on other, specific movement disorders: there was a significant result favouring placebo for akathisia, dystonia, needing anti‐Parkinson medication, rigidity and tremor; there was no difference between haloperidol and placebo for tardive dyskinesia, oculogyric crises, teeth grinding and 'thick' speech. |
| *The basis for the assumed risk (e.g. the median control group risk across studies) is provided in footnotes. The corresponding risk (and its 95% confidence interval) is based on the assumed risk in the comparison group and the relative effect of the intervention (and its 95% CI). | ||||||
| GRADE Working Group grades of evidence | ||||||
| 1 Seven out of the eight included studies had an unclear risk of bias for random sequence generation and for allocation concealment. Blinding of participants and personnel was unclear in four studies and blinding of assessors was unclear in six. Two studies had an unclear risk of bias for incomplete outcome data. One study had a high risk of other bias as they were funded by industry and three an unclear risk of bias as the drugs were provided by a pharmaceutical company. | ||||||
| Outcome or subgroup title | No. of studies | No. of participants | Statistical method | Effect size |
| 1 Global state: 1a. Overall improvement: No marked global improvement Show forest plot | 11 | Risk Ratio (M‐H, Fixed, 95% CI) | Subtotals only | |
| 1.1 up to 6 weeks (clinician rated) | 4 | 472 | Risk Ratio (M‐H, Fixed, 95% CI) | 0.67 [0.56, 0.80] |
| 1.2 > 6‐24 weeks (clinician rated) | 8 | 307 | Risk Ratio (M‐H, Fixed, 95% CI) | 0.67 [0.58, 0.78] |
| 1.3 > 6‐24 weeks (nurse rated) | 1 | 28 | Risk Ratio (M‐H, Fixed, 95% CI) | 0.59 [0.37, 0.92] |
| 2 Global state: 1b. Overall improvement: Average change in CGI‐S score (up to 6 weeks; high = poor) Show forest plot | 2 | 353 | Mean Difference (IV, Fixed, 95% CI) | ‐0.49 [‐0.73, ‐0.25] |
| 3 Global state: 2. Hospital discharge: Not discharged from hospital (> 6‐24 weeks) Show forest plot | 1 | 33 | Risk Ratio (M‐H, Fixed, 95% CI) | 0.85 [0.47, 1.52] |
| 4 Global state: 3. Relapse (< 52 weeks) Show forest plot | 2 | 70 | Risk Ratio (M‐H, Fixed, 95% CI) | 0.69 [0.55, 0.86] |
| 5 Global state: 4. Leaving the study early Show forest plot | 24 | Risk Ratio (M‐H, Fixed, 95% CI) | Subtotals only | |
| 5.1 up to 6 weeks | 16 | 1812 | Risk Ratio (M‐H, Fixed, 95% CI) | 0.87 [0.80, 0.95] |
| 5.2 > 6‐24 weeks | 8 | 304 | Risk Ratio (M‐H, Fixed, 95% CI) | 0.54 [0.29, 1.00] |
| 5.3 < 52 weeks | 1 | 50 | Risk Ratio (M‐H, Fixed, 95% CI) | 2.58 [0.14, 46.83] |
| 6 Mental state: 1. No clinical improvement (< 20% reduction in BPRS score; up to 6 weeks) Show forest plot | 1 | 24 | Risk Ratio (M‐H, Fixed, 95% CI) | 0.76 [0.54, 1.08] |
| 7 Mental state: 2a. General symptoms: Average BPRS total score (up to 6 weeks; high = poor) Show forest plot | 3 | 108 | Mean Difference (IV, Fixed, 95% CI) | ‐9.76 [‐14.60, ‐4.93] |
| 8 Mental state: 2b. General symptoms: Average change in PANSS total score (up to 6 weeks; high = poor) Show forest plot | 1 | 119 | Mean Difference (IV, Fixed, 95% CI) | ‐15.58 [‐23.92, ‐7.24] |
| 9 Mental state: 3. Positive symptoms: Average change in PANSS positive score (up to 6 weeks; high = poor) Show forest plot | 2 | 353 | Mean Difference (IV, Fixed, 95% CI) | ‐3.29 [‐4.70, ‐1.89] |
| 10 Mental state: 4. Negative symptoms: Average change in PANSS negative score (up to 6 weeks; high = poor) Show forest plot | 2 | 353 | Mean Difference (IV, Fixed, 95% CI) | ‐1.18 [‐2.32, ‐0.04] |
| 11 Mental state: 5. Mood: Average change in CDS score (up to 6 weeks; high = poor) Show forest plot | 1 | 234 | Mean Difference (IV, Fixed, 95% CI) | ‐0.30 [‐1.20, 0.60] |
| 12 Adverse effects: 1a. Movement disorders: Extrapyramidal symptoms Show forest plot | 11 | Risk Ratio (M‐H, Fixed, 95% CI) | Subtotals only | |
| 12.1 akathisia | 6 | 695 | Risk Ratio (M‐H, Fixed, 95% CI) | 3.66 [2.24, 5.97] |
| 12.2 dystonia | 5 | 471 | Risk Ratio (M‐H, Fixed, 95% CI) | 11.49 [3.23, 40.85] |
| 12.3 needing antiparkinson medication | 4 | 480 | Risk Ratio (M‐H, Fixed, 95% CI) | 3.23 [2.20, 4.72] |
| 12.4 oculogyric crises | 2 | 83 | Risk Ratio (M‐H, Fixed, 95% CI) | 0.97 [0.14, 6.57] |
| 12.5 parkinsonism (including EPS) | 5 | 485 | Risk Ratio (M‐H, Fixed, 95% CI) | 5.48 [2.68, 11.22] |
| 12.6 rigidity | 5 | 461 | Risk Ratio (M‐H, Fixed, 95% CI) | 4.98 [2.74, 9.05] |
| 12.7 teeth grinding | 1 | 33 | Risk Ratio (M‐H, Fixed, 95% CI) | 2.53 [0.11, 57.83] |
| 12.8 'thick' speech | 1 | 33 | Risk Ratio (M‐H, Fixed, 95% CI) | 5.89 [0.33, 105.81] |
| 12.9 tremor | 5 | 447 | Risk Ratio (M‐H, Fixed, 95% CI) | 3.93 [1.96, 7.91] |
| 13 Adverse effects: 1b. Movement disorders: Tardive dyskinesia Show forest plot | 2 | Risk Ratio (M‐H, Fixed, 95% CI) | Subtotals only | |
| 13.1 dyskinesia and tardive dyskinesia | 2 | 157 | Risk Ratio (M‐H, Fixed, 95% CI) | 1.00 [0.14, 7.13] |
| 14 Adverse effects: 1c. Movement disorders: Average changes scores (various scales; up to 6 weeks) Show forest plot | 1 | Mean Difference (IV, Fixed, 95% CI) | Subtotals only | |
| 14.1 AIMS (high = poor) | 1 | 231 | Mean Difference (IV, Fixed, 95% CI) | ‐0.29 [‐0.71, 0.13] |
| 14.2 BAS (high = poor) | 1 | 231 | Mean Difference (IV, Fixed, 95% CI) | 0.31 [0.10, 0.52] |
| 14.3 SAS (high = poor) | 1 | 231 | Mean Difference (IV, Fixed, 95% CI) | 1.48 [0.76, 2.20] |
| 15 Adverse effects: 2. Other CNS Show forest plot | 3 | Risk Ratio (M‐H, Fixed, 95% CI) | Subtotals only | |
| 15.1 blurred vision | 2 | 240 | Risk Ratio (M‐H, Fixed, 95% CI) | 3.96 [1.21, 12.93] |
| 15.2 confusion | 1 | 33 | Risk Ratio (M‐H, Fixed, 95% CI) | 2.53 [0.11, 57.83] |
| 15.3 dry mouth | 1 | 33 | Risk Ratio (M‐H, Fixed, 95% CI) | 1.67 [0.62, 4.46] |
| 15.4 sedation | 1 | 238 | Risk Ratio (M‐H, Fixed, 95% CI) | 0.86 [0.24, 3.11] |
| 16 Adverse effects: 3. Cardiovascular effects Show forest plot | 5 | Risk Ratio (M‐H, Fixed, 95% CI) | Subtotals only | |
| 16.1 blood pressure ‐ dizziness/low BP | 3 | 245 | Risk Ratio (M‐H, Fixed, 95% CI) | 1.01 [0.36, 2.79] |
| 16.2 blood pressure ‐ high BP | 1 | 16 | Risk Ratio (M‐H, Fixed, 95% CI) | 3.0 [0.14, 64.26] |
| 16.3 bradycardia | 1 | 124 | Risk Ratio (M‐H, Fixed, 95% CI) | 4.27 [0.49, 37.10] |
| 17 Adverse effects: 4. Other adverse effects Show forest plot | 9 | Risk Ratio (M‐H, Fixed, 95% CI) | Subtotals only | |
| 17.1 agitation | 2 | 362 | Risk Ratio (M‐H, Fixed, 95% CI) | 1.07 [0.54, 2.12] |
| 17.2 anxiety | 2 | 362 | Risk Ratio (M‐H, Fixed, 95% CI) | 0.84 [0.33, 2.16] |
| 17.3 drooling | 3 | 207 | Risk Ratio (M‐H, Fixed, 95% CI) | 4.00 [0.88, 18.21] |
| 17.4 facial oedema | 1 | 33 | Risk Ratio (M‐H, Fixed, 95% CI) | 2.83 [0.12, 64.89] |
| 17.5 headache | 4 | 593 | Risk Ratio (M‐H, Fixed, 95% CI) | 0.93 [0.62, 1.39] |
| 17.6 infection | 1 | 24 | Risk Ratio (M‐H, Fixed, 95% CI) | 7.0 [0.40, 122.44] |
| 17.7 insomnia | 4 | 629 | Risk Ratio (M‐H, Fixed, 95% CI) | 1.11 [0.76, 1.63] |
| 17.8 nausea/vomiting | 2 | 231 | Risk Ratio (M‐H, Fixed, 95% CI) | 0.90 [0.49, 1.65] |
| 17.9 oral hypoaesthesia | 1 | 238 | Risk Ratio (M‐H, Fixed, 95% CI) | 0.15 [0.01, 2.92] |
| 17.10 perspiration | 2 | 93 | Risk Ratio (M‐H, Fixed, 95% CI) | 4.74 [0.58, 38.81] |
| 17.11 sleepiness | 7 | 686 | Risk Ratio (M‐H, Fixed, 95% CI) | 3.09 [1.51, 6.31] |
| 17.12 weight gain | 2 | 441 | Risk Ratio (M‐H, Fixed, 95% CI) | 4.89 [1.41, 16.95] |
| 17.13 weight loss | 3 | 385 | Risk Ratio (M‐H, Fixed, 95% CI) | 0.77 [0.36, 1.64] |
| 18 SUBGROUP ANALYSIS: 1. MEN vs WOMEN: Global state: Overall improvement: No marked global improvement, > 6‐24 weeks (clinician rated) Show forest plot | 3 | Risk Ratio (M‐H, Fixed, 95% CI) | Subtotals only | |
| 18.1 only men | 1 | 24 | Risk Ratio (M‐H, Fixed, 95% CI) | 0.47 [0.27, 0.82] |
| 18.2 only women | 2 | 88 | Risk Ratio (M‐H, Fixed, 95% CI) | 0.69 [0.55, 0.87] |
| 19 SUBGROUP ANALYSIS: 2. 18‐65 YEARS vs < 18 YEARS: Global state: Overall improvement: No marked global improvement, > 6‐24 weeks (clinician rated) Show forest plot | 8 | Risk Ratio (M‐H, Fixed, 95% CI) | Subtotals only | |
| 19.1 18‐65 years | 7 | 284 | Risk Ratio (M‐H, Fixed, 95% CI) | 0.70 [0.61, 0.80] |
| 19.2 < 18 years | 1 | 24 | Risk Ratio (M‐H, Fixed, 95% CI) | 0.27 [0.10, 0.74] |
| 20 SUBGROUP ANALYSIS: 3. ACUTE vs CHRONIC: Global state: Overall improvement: No marked global improvement, > 6‐24 weeks (clinician rated) Show forest plot | 8 | Risk Ratio (M‐H, Fixed, 95% CI) | Subtotals only | |
| 20.1 acute phase of illness | 1 | 58 | Risk Ratio (M‐H, Fixed, 95% CI) | 0.56 [0.30, 1.06] |
| 20.2 chronic phase of illness | 7 | 250 | Risk Ratio (M‐H, Fixed, 95% CI) | 0.68 [0.59, 0.78] |
| 21 SUBGROUP ANALYSIS: 4. LOW DOSE vs MEDIUM TO HIGH DOSE Show forest plot | 11 | Risk Ratio (M‐H, Fixed, 95% CI) | Subtotals only | |
| 21.1 low dose (≤ 5 mg/day) ‐ Global state: Overall improvement: No marked global improvement, up to 6 weeks (clinician rated) | 1 | 234 | Risk Ratio (M‐H, Fixed, 95% CI) | 0.85 [0.69, 1.04] |
| 21.2 medium to high dose (> 5 mg/day) ‐ Global state: Overall improvement: No marked global improvement, up to 6 weeks (clinician rated) | 3 | 238 | Risk Ratio (M‐H, Fixed, 95% CI) | 0.48 [0.35, 0.66] |
| 21.3 low dose (≤ 5 mg/day) ‐ Global state: Overall improvement: No marked global improvement, > 6‐24 weeks (clinician rated) | 4 | 149 | Risk Ratio (M‐H, Fixed, 95% CI) | 0.67 [0.55, 0.81] |
| 21.4 medium to high dose (> 5 mg/day) ‐ Global state: Overall improvement: No marked global improvement, > 6‐24 weeks (clinician rated) | 5 | 165 | Risk Ratio (M‐H, Fixed, 95% CI) | 0.67 [0.54, 0.83] |
| 22 SUBGROUP ANALYSIS: 5. DIAGNOSTIC CRITERIA vs NO DIAGNOSTIC CRITERIA Show forest plot | 13 | Risk Ratio (M‐H, Fixed, 95% CI) | Subtotals only | |
| 22.1 operational criteria used for diagnosis ‐ Global state: Overall improvement: No marked global improvement, up to 6 weeks (clinician rated) | 3 | 414 | Risk Ratio (M‐H, Fixed, 95% CI) | 0.67 [0.56, 0.81] |
| 22.2 no operational criteria used for diagnosis ‐ Global state: Overall improvement: No marked global improvement, up to 6 weeks (clinician rated) | 1 | 58 | Risk Ratio (M‐H, Fixed, 95% CI) | 0.64 [0.33, 1.24] |
| 22.3 operational criteria used for diagnosis ‐ Global state: Overall improvement: No marked global improvement, > 6‐24 weeks (clinician rated) | 1 | 24 | Risk Ratio (M‐H, Fixed, 95% CI) | 0.27 [0.10, 0.74] |
| 22.4 no operational criteria used for diagnosis ‐ Global state: Overall improvement: No marked global improvement, > 6‐24 weeks (clinician rated) | 7 | 284 | Risk Ratio (M‐H, Fixed, 95% CI) | 0.70 [0.61, 0.80] |
| 22.5 operational criteria used for diagnosis ‐ Global state: Relapse (< 52 weeks) | 1 | 50 | Risk Ratio (M‐H, Fixed, 95% CI) | 0.72 [0.57, 0.91] |
| 22.6 no operational criteria used for diagnosis ‐ Global state: Relapse (< 52 weeks) | 1 | 20 | Risk Ratio (M‐H, Fixed, 95% CI) | 0.62 [0.37, 1.03] |
| 23 SENSITIVITY ANALYSIS: 1. ASSUMPTIONS FOR MISSING DATA vs NO ASSUMPTIONS FOR MISSING DATA: Global state: Overall improvement: No marked global improvement, up to 6 weeks (clinician rated) Show forest plot | 3 | Risk Ratio (M‐H, Fixed, 95% CI) | Subtotals only | |
| 23.1 no assumptions for missing data | 3 | 353 | Risk Ratio (M‐H, Fixed, 95% CI) | 0.72 [0.60, 0.87] |