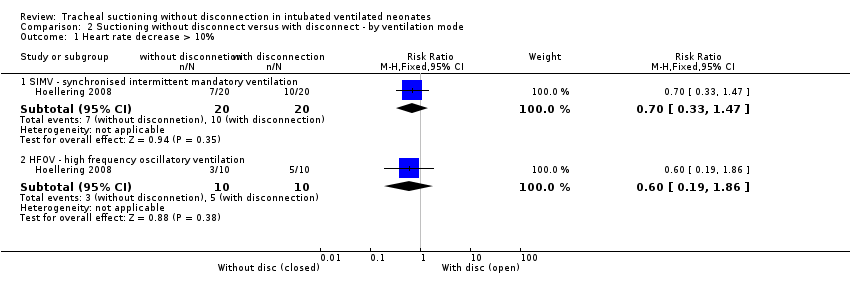
| 1 Heart rate decrease >10% Show forest plot | 3 | 104 | Risk Ratio (M‐H, Fixed, 95% CI) | 0.61 [0.40, 0.93] |
|
| 2 Change in heart rate (HR)(%) ‐ by weight Show forest plot | 4 | | Mean Difference (IV, Fixed, 95% CI) | Subtotals only |
|
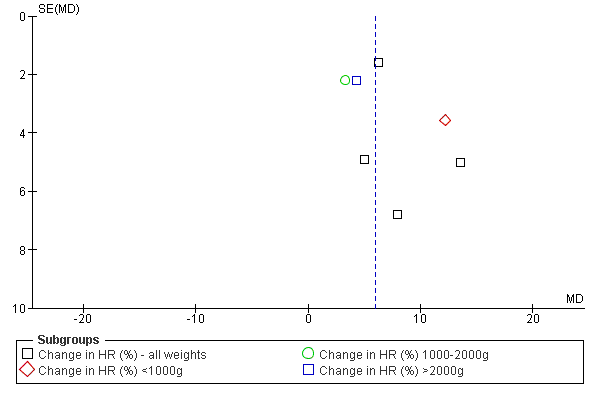
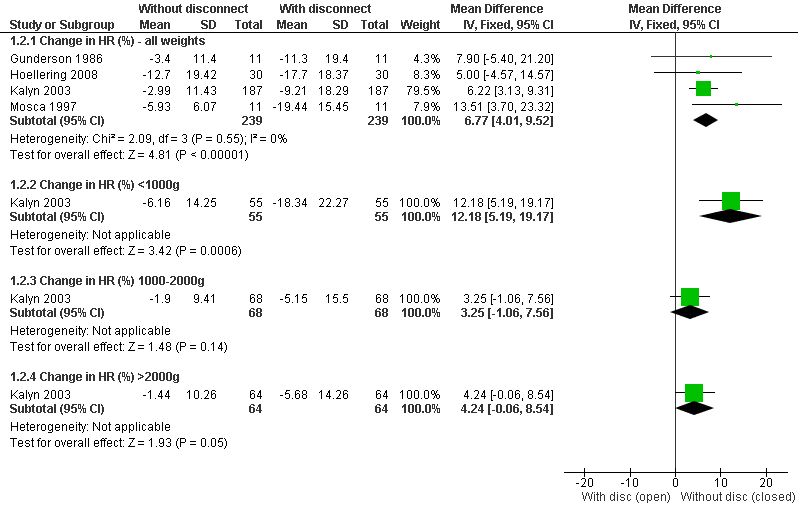
| 2.1 Change in HR (%) ‐ all weights | 4 | 478 | Mean Difference (IV, Fixed, 95% CI) | 6.77 [4.01, 9.52] |
| 2.2 Change in HR (%) <1000g | 1 | 110 | Mean Difference (IV, Fixed, 95% CI) | 12.18 [5.19, 19.17] |
| 2.3 Change in HR (%) 1000‐2000g | 1 | 136 | Mean Difference (IV, Fixed, 95% CI) | 3.25 [‐1.06, 7.56] |
| 2.4 Change in HR (%) >2000g | 1 | 128 | Mean Difference (IV, Fixed, 95% CI) | 4.24 [‐0.06, 8.54] |
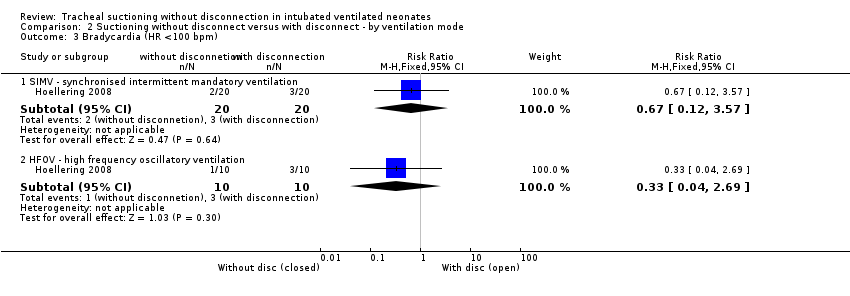
| 3 Bradycardia (HR < 100 bpm) ‐ by weight Show forest plot | 3 | | Risk Ratio (M‐H, Fixed, 95% CI) | Subtotals only |
|
| 3.1 Bradycardia (HR < 100 bpm) ‐ all weights | 3 | 482 | Risk Ratio (M‐H, Fixed, 95% CI) | 0.38 [0.15, 0.92] |
| 3.2 Bradycardia (HR < 100 bpm) <1000g | 1 | 122 | Risk Ratio (M‐H, Fixed, 95% CI) | 0.33 [0.04, 3.12] |
| 3.3 Bradycardia (HR < 100 bpm) 1000‐2000g | 1 | 144 | Risk Ratio (M‐H, Fixed, 95% CI) | 0.33 [0.01, 8.05] |
| 3.4 Bradycardia (HR < 100 bpm) > 2000g | 1 | 134 | Risk Ratio (M‐H, Fixed, 95% CI) | 0.5 [0.05, 5.38] |
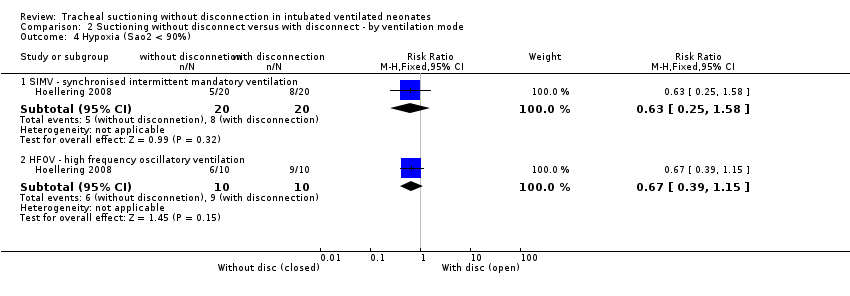
| 4 Hypoxia (SaO2 < 90%) ‐ by weight Show forest plot | 3 | | Risk Ratio (M‐H, Fixed, 95% CI) | Subtotals only |
|
| 4.1 Hypoxia (SaO2 < 90%) ‐ all weights | 3 | 482 | Risk Ratio (M‐H, Fixed, 95% CI) | 0.48 [0.31, 0.74] |
| 4.2 Hypoxia (SaO2 < 90%) < 1000g | 1 | 122 | Risk Ratio (M‐H, Fixed, 95% CI) | 0.6 [0.15, 2.40] |
| 4.3 Hypoxia (SaO2 < 90%) 1000‐2000g | 1 | 144 | Risk Ratio (M‐H, Fixed, 95% CI) | 0.33 [0.04, 3.13] |
| 4.4 Hypoxia (SaO2 < 90%) > 2000g | 1 | 134 | Risk Ratio (M‐H, Fixed, 95% CI) | 0.33 [0.09, 1.18] |
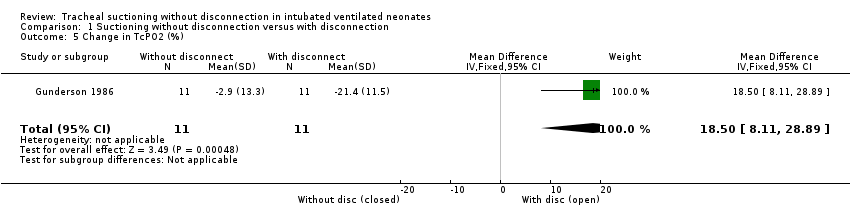
| 5 Change in TcPO2 (%) Show forest plot | 1 | 22 | Mean Difference (IV, Fixed, 95% CI) | 18.5 [8.11, 28.89] |
|
| 6 TcPO2 decrease>10% Show forest plot | 1 | 22 | Risk Ratio (M‐H, Fixed, 95% CI) | 0.39 [0.19, 0.82] |
|